Investigating photoreceptor densities, potential visual ...
9
Investigating photoreceptor densities, potential visual acuity, and cone mosaics of shallow water, temperate fish species D.E. Hunt a,⇑ , N.J.F. Rawlinson a , G.A. Thomas b , J.M. Cobcroft c,d a Northern Hub, Institute for Marine and Antarctic Studies, University of Tasmania, Locked Bag 1370, Launceston, TAS 7250, Australia b University College London, Torrington Place, London WC1E 7JE, United Kingdom c Fisheries and Aquaculture Centre, Institute for Marine and Antarctic Studies, University of Tasmania, Private Bag 49, Hobart, TAS 7001, Australia d University of the Sunshine Coast, Locked Bag 4, Maroochydore DC, Queensland 4558, Australia article info Article history: Received 6 November 2014 Received in revised form 10 March 2015 Available online 11 April 2015 Keywords: Potential visual acuity Rod density Cone density Cone mosaic Minimum separable angle abstract The eye is an important sense organ for teleost species but can vary greatly depending on the adaption to the habitat, environment during ontogeny and developmental stage of the fish. The eye and retinal mor- phology of eight commonly caught trawl bycatch species were described: Lepidotrigla mulhalli; Lophonectes gallus; Platycephalus bassensis; Sillago flindersi; Neoplatycephalus richardsoni; Thamnaconus degeni; Parequula melbournensis; and Trachurus declivis. The cone densities ranged from 38 cones per 0.01 mm 2 for S. flindersi to 235 cones per 0.01 mm 2 for P. melbournensis. The rod densities ranged from 22 800 cells per 0.01 mm 2 for L. mulhalli to 76 634 cells per 0.01 mm 2 for T. declivis and potential visual acuity (based on anatomical measures) ranged from 0.08 in L. gallus to 0.31 in P. melbournensis. Higher rod densities were correlated with maximum habitat depths. Six species had the regular pattern of four double cones arranged around a single cone in the photoreceptor mosaic, while T. declivis had only rows of double cones. P. melbournensis had the greatest potential ability for detecting fine detail based on eye anatomy. The potential visual acuity estimates and rod densities can be applied to suggest the relative detection ability of different species in a commercial fishing context, since vision is a critical sense in an illuminated environment for perceiving an oncoming trawl. Ó 2015 Elsevier Ltd. All rights reserved. 1. Introduction The eye is an essential tool for fish and is utilised for capture of prey, detection of predators, schooling, and the courtship involved in reproduction (Gurthrie & Muntz, 1993). The structure of the eye can vary depending on the adaptation to the habitat, environmen- tal conditions during ontogeny (e.g. temperature, nutrition, light intensity), and developmental stage (Powers & Raymond, 1990). Although the teleost eye is very similar to that of terrestrial verte- brates, common variations between species occur within the retina, particularly in the abundance of the different photoreceptor cells and potential visual acuity (VA) (Wagner, 1990). There are also various morphological specialisations of the teleost eye in dif- ferent species, such as having more than one lens, oblong eyeballs, degeneration (no cornea or lens), and even the use of adipose eye- lids (Gailliet, Love, & Ebeling, 1996). These adaptions of the teleost eye are suited to optimise visual ability underwater. Most fish that inhabit shallow waters can detect colours and patterns with well-developed eyes (Gurthrie & Muntz, 1993). Pigments (rhodopsin and porphyropsin) in the photoreceptors absorb different light wavelengths and are stimulated at different light intensities (Fernald, 1988). This means that fish can have both photopic vision (well-lit, colour) that is mediated by cones, and scotopic vision (low-light) that is mediated by rods (Fernald, 1988). The arrangement of single, double and sometimes triple cones in the retina is known as the mosaic, and is adapted to the habitats and behaviour of a species (Evans & Browman, 2004; Lyall, 1957; Raymond, Barthel, & Curran, 1995). Likewise, the amount of rod and cone photoreceptor cell types in the retina is related to the habitat and of the particular species. It has been well documented, for example, that those species living in shallow waters often have a greater selection of cones than deep-water species that are predominantly in the dark (Mas-Riera, 1991; Pankhurst, 1987). In addition to the detection of certain wavelengths and light intensities, fish also need to be able to resolve an image. The pho- toreceptor cells are also involved in potential visual acuity whereby the resolving power of the eye is a function of photore- ceptor cell spacing (in particular the cones) and the lens size (Tamura, 1957). Lens size is important because the lens is not cov- ered by the iris in fish and the aperture is the lens diameter http://dx.doi.org/10.1016/j.visres.2015.03.017 0042-6989/Ó 2015 Elsevier Ltd. All rights reserved. ⇑ Corresponding author. E-mail address: [email protected] (D.E. Hunt). Vision Research 111 (2015) 13–21 Contents lists available at ScienceDirect Vision Research journal homepage: www.elsevier.com/locate/visres
Transcript of Investigating photoreceptor densities, potential visual ...

Vision Research 111 (2015) 13–21
Contents lists available at ScienceDirect
Vision Research
journal homepage: www.elsevier .com/locate /v isres
Investigating photoreceptor densities, potential visual acuity, and conemosaics of shallow water, temperate fish species
http://dx.doi.org/10.1016/j.visres.2015.03.0170042-6989/� 2015 Elsevier Ltd. All rights reserved.
⇑ Corresponding author.E-mail address: [email protected] (D.E. Hunt).
D.E. Hunt a,⇑, N.J.F. Rawlinson a, G.A. Thomas b, J.M. Cobcroft c,d
a Northern Hub, Institute for Marine and Antarctic Studies, University of Tasmania, Locked Bag 1370, Launceston, TAS 7250, Australiab University College London, Torrington Place, London WC1E 7JE, United Kingdomc Fisheries and Aquaculture Centre, Institute for Marine and Antarctic Studies, University of Tasmania, Private Bag 49, Hobart, TAS 7001, Australiad University of the Sunshine Coast, Locked Bag 4, Maroochydore DC, Queensland 4558, Australia
a r t i c l e i n f o a b s t r a c t
Article history:Received 6 November 2014Received in revised form 10 March 2015Available online 11 April 2015
Keywords:Potential visual acuityRod densityCone densityCone mosaicMinimum separable angle
The eye is an important sense organ for teleost species but can vary greatly depending on the adaption tothe habitat, environment during ontogeny and developmental stage of the fish. The eye and retinal mor-phology of eight commonly caught trawl bycatch species were described: Lepidotrigla mulhalli;Lophonectes gallus; Platycephalus bassensis; Sillago flindersi; Neoplatycephalus richardsoni; Thamnaconusdegeni; Parequula melbournensis; and Trachurus declivis. The cone densities ranged from 38 cones per0.01 mm2 for S. flindersi to 235 cones per 0.01 mm2 for P. melbournensis. The rod densities ranged from22800 cells per 0.01 mm2 for L. mulhalli to 76634 cells per 0.01 mm2 for T. declivis and potential visualacuity (based on anatomical measures) ranged from 0.08 in L. gallus to 0.31 in P. melbournensis. Higherrod densities were correlated with maximum habitat depths. Six species had the regular pattern of fourdouble cones arranged around a single cone in the photoreceptor mosaic, while T. declivis had only rowsof double cones. P. melbournensis had the greatest potential ability for detecting fine detail based on eyeanatomy. The potential visual acuity estimates and rod densities can be applied to suggest the relativedetection ability of different species in a commercial fishing context, since vision is a critical sense inan illuminated environment for perceiving an oncoming trawl.
� 2015 Elsevier Ltd. All rights reserved.
1. Introduction Pigments (rhodopsin and porphyropsin) in the photoreceptors
The eye is an essential tool for fish and is utilised for capture ofprey, detection of predators, schooling, and the courtship involvedin reproduction (Gurthrie & Muntz, 1993). The structure of the eyecan vary depending on the adaptation to the habitat, environmen-tal conditions during ontogeny (e.g. temperature, nutrition, lightintensity), and developmental stage (Powers & Raymond, 1990).Although the teleost eye is very similar to that of terrestrial verte-brates, common variations between species occur within theretina, particularly in the abundance of the different photoreceptorcells and potential visual acuity (VA) (Wagner, 1990). There arealso various morphological specialisations of the teleost eye in dif-ferent species, such as having more than one lens, oblong eyeballs,degeneration (no cornea or lens), and even the use of adipose eye-lids (Gailliet, Love, & Ebeling, 1996). These adaptions of the teleosteye are suited to optimise visual ability underwater.
Most fish that inhabit shallow waters can detect colours andpatterns with well-developed eyes (Gurthrie & Muntz, 1993).
absorb different light wavelengths and are stimulated at differentlight intensities (Fernald, 1988). This means that fish can have bothphotopic vision (well-lit, colour) that is mediated by cones, andscotopic vision (low-light) that is mediated by rods (Fernald,1988). The arrangement of single, double and sometimes triplecones in the retina is known as the mosaic, and is adapted to thehabitats and behaviour of a species (Evans & Browman, 2004;Lyall, 1957; Raymond, Barthel, & Curran, 1995). Likewise, theamount of rod and cone photoreceptor cell types in the retina isrelated to the habitat and of the particular species. It has been welldocumented, for example, that those species living in shallowwaters often have a greater selection of cones than deep-waterspecies that are predominantly in the dark (Mas-Riera, 1991;Pankhurst, 1987).
In addition to the detection of certain wavelengths and lightintensities, fish also need to be able to resolve an image. The pho-toreceptor cells are also involved in potential visual acuitywhereby the resolving power of the eye is a function of photore-ceptor cell spacing (in particular the cones) and the lens size(Tamura, 1957). Lens size is important because the lens is not cov-ered by the iris in fish and the aperture is the lens diameter
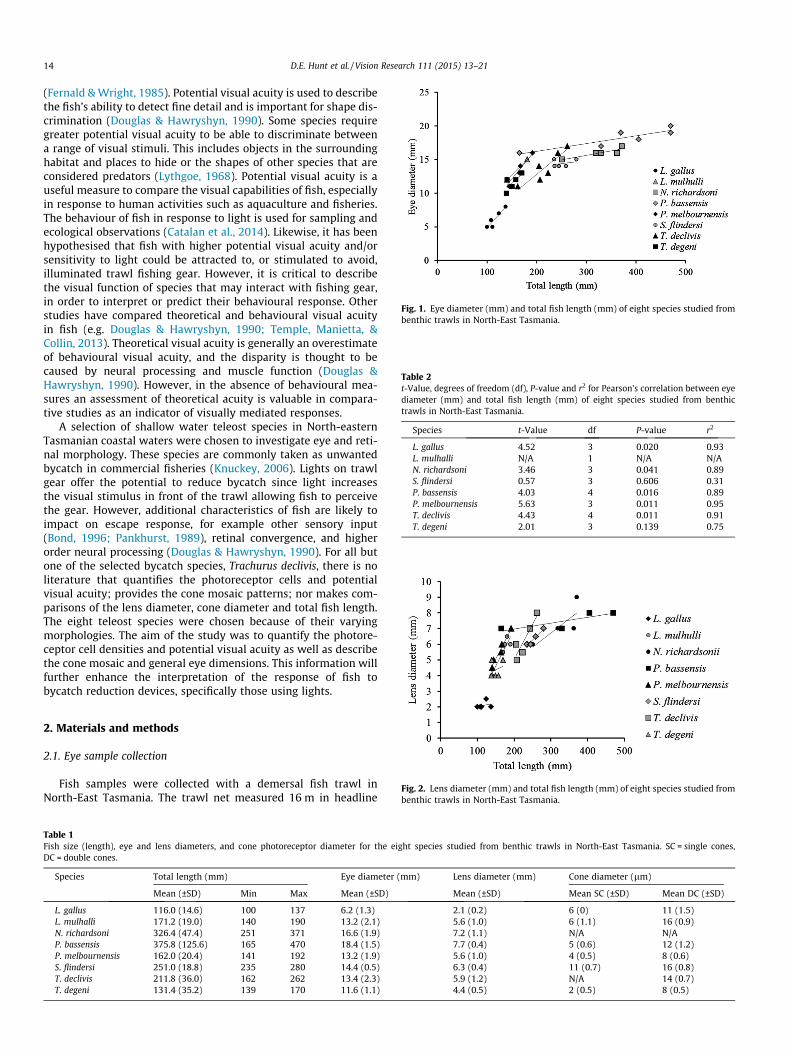
Fig. 1. Eye diameter (mm) and total fish length (mm) of eight species studied frombenthic trawls in North-East Tasmania.
Table 2t-Value, degrees of freedom (df), P-value and r2 for Pearson’s correlation between eyediameter (mm) and total fish length (mm) of eight species studied from benthictrawls in North-East Tasmania.
Species t-Value df P-value r2
L. gallus 4.52 3 0.020 0.93L. mulhalli N/A 1 N/A N/AN. richardsoni 3.46 3 0.041 0.89S. flindersi 0.57 3 0.606 0.31P. bassensis 4.03 4 0.016 0.89P. melbournensis 5.63 3 0.011 0.95T. declivis 4.43 4 0.011 0.91T. degeni 2.01 3 0.139 0.75
14 D.E. Hunt et al. / Vision Research 111 (2015) 13–21
(Fernald & Wright, 1985). Potential visual acuity is used to describethe fish’s ability to detect fine detail and is important for shape dis-crimination (Douglas & Hawryshyn, 1990). Some species requiregreater potential visual acuity to be able to discriminate betweena range of visual stimuli. This includes objects in the surroundinghabitat and places to hide or the shapes of other species that areconsidered predators (Lythgoe, 1968). Potential visual acuity is auseful measure to compare the visual capabilities of fish, especiallyin response to human activities such as aquaculture and fisheries.The behaviour of fish in response to light is used for sampling andecological observations (Catalan et al., 2014). Likewise, it has beenhypothesised that fish with higher potential visual acuity and/orsensitivity to light could be attracted to, or stimulated to avoid,illuminated trawl fishing gear. However, it is critical to describethe visual function of species that may interact with fishing gear,in order to interpret or predict their behavioural response. Otherstudies have compared theoretical and behavioural visual acuityin fish (e.g. Douglas & Hawryshyn, 1990; Temple, Manietta, &Collin, 2013). Theoretical visual acuity is generally an overestimateof behavioural visual acuity, and the disparity is thought to becaused by neural processing and muscle function (Douglas &Hawryshyn, 1990). However, in the absence of behavioural mea-sures an assessment of theoretical acuity is valuable in compara-tive studies as an indicator of visually mediated responses.
A selection of shallow water teleost species in North-easternTasmanian coastal waters were chosen to investigate eye and reti-nal morphology. These species are commonly taken as unwantedbycatch in commercial fisheries (Knuckey, 2006). Lights on trawlgear offer the potential to reduce bycatch since light increasesthe visual stimulus in front of the trawl allowing fish to perceivethe gear. However, additional characteristics of fish are likely toimpact on escape response, for example other sensory input(Bond, 1996; Pankhurst, 1989), retinal convergence, and higherorder neural processing (Douglas & Hawryshyn, 1990). For all butone of the selected bycatch species, Trachurus declivis, there is noliterature that quantifies the photoreceptor cells and potentialvisual acuity; provides the cone mosaic patterns; nor makes com-parisons of the lens diameter, cone diameter and total fish length.The eight teleost species were chosen because of their varyingmorphologies. The aim of the study was to quantify the photore-ceptor cell densities and potential visual acuity as well as describethe cone mosaic and general eye dimensions. This information willfurther enhance the interpretation of the response of fish tobycatch reduction devices, specifically those using lights.
Fig. 2. Lens diameter (mm) and total fish length (mm) of eight species studied frombenthic trawls in North-East Tasmania.
2. Materials and methods
2.1. Eye sample collection
Fish samples were collected with a demersal fish trawl inNorth-East Tasmania. The trawl net measured 16 m in headline
Table 1Fish size (length), eye and lens diameters, and cone photoreceptor diameter for the eight species studied from benthic trawls in North-East Tasmania. SC = single cones,DC = double cones.
Species Total length (mm) Eye diameter (mm) Lens diameter (mm) Cone diameter (lm)
Mean (±SD) Min Max Mean (±SD) Mean (±SD) Mean SC (±SD) Mean DC (±SD)
L. gallus 116.0 (14.6) 100 137 6.2 (1.3) 2.1 (0.2) 6 (0) 11 (1.5)L. mulhalli 171.2 (19.0) 140 190 13.2 (2.1) 5.6 (1.0) 6 (1.1) 16 (0.9)N. richardsoni 326.4 (47.4) 251 371 16.6 (1.9) 7.2 (1.1) N/A N/AP. bassensis 375.8 (125.6) 165 470 18.4 (1.5) 7.7 (0.4) 5 (0.6) 12 (1.2)P. melbournensis 162.0 (20.4) 141 192 13.2 (1.9) 5.6 (1.0) 4 (0.5) 8 (0.6)S. flindersi 251.0 (18.8) 235 280 14.4 (0.5) 6.3 (0.4) 11 (0.7) 16 (0.8)T. declivis 211.8 (36.0) 162 262 13.4 (2.3) 5.9 (1.2) N/A 14 (0.7)T. degeni 131.4 (35.2) 139 170 11.6 (1.1) 4.4 (0.5) 2 (0.5) 8 (0.5)

Table 3t-Value, degrees of freedom (df), P-value and r2 for Pearson’s correlation between lensdiameter (mm) and total fish length (mm) of eight species studied from benthictrawls in North-East Tasmania.
Species t-Value df P-value r2
L. gallus 0.56 3 0.616 0.31L. mulhalli 4.40 3 0.022 0.93N. richardsoni 2.24 3 0.110 0.79P. bassensis 3.38 4 0.027 0.86P. melbournensis 8.84 3 0.003 0.98S. flindersi 8.19 3 0.004 0.98T. declivis 3.30 4 0.298 0.85T. degeni 0.45 3 0.681 0.25
D.E. Hunt et al. / Vision Research 111 (2015) 13–21 15
length and was designed to sweep an 11–13 m wide strip of theseabed, was towed at 3 knots by a 35 m research vessel, the FTVBluefin. The headline was 2.3 m above the seabed. Trawling wasconducted during the night at 30 m depth starting at the followingcoordinates: 40�18008280S and 148�32006460E.
The left eyes of five fish were collected from each of eight spe-cies: roundsnout gurnard Lepidotrigla mulhalli; crested flounderLophonectes gallus; sand flathead Platycephalus bassensis; easternschool whiting Sillago flindersi; tiger flathead Neoplatycephalusrichardsoni; Degen’s leatherjacket Thamnaconus degeni; silverbiddy Parequula melbournensis; and jack mackerel T. declivis.Work was carried out in accordance with the EU Directive of2010/63/EU and the University of Tasmania Animal EthicsCommittee approved the experimental procedures.
The fish length, eye and lens diameters were measured withcallipers to the nearest 1 mm. Eyes were dissected and afterinspection of eye quality (i.e. absence of corneal/lenticular opacity,pupil atrophy, and inflammation), a small incision was made tomaximise infiltration of the fixative and to retain orientation.Samples were fixed for 24 h in 5% glutaraldehyde in a sucrose-phosphate buffer, then stored in 70% ethanol. The eye diameterwas measured again post fixation, and the eyes were dissected toremove the retina prior to processing for histology.
2.2. Histology and retinal morphology
Retinal samples were manually dehydrated to 100% ethanol andembedded using a JB4 resin histology kit (JB4, Agar Scientific Ltd.,UK). Retinas were halved to form dorsal and ventral areas. Ten ran-dom transverse sections (3 lm thickness) per retinal sample perarea were cut with a Microm microtome (Heidelberg HM340)
Fig. 3. Mean number of rods (cells per 0.01 mm2) ± SE, in eight different teleostspecies studied from benthic trawls in North-East Tasmania. Common lettersrepresent values that are not significantly different.
and placed in water drops on a glass slide, allowed to dry and sec-tions were stained with Lee’s Methylene Blue-Basic Fuchsin andmounted in TBS� SHUR/mount toluene-based mounting mediawith a coverslip. Three 100 lm transects from five sections wererandomly chosen and images taken under a light microscope at400� magnification. The number of photoreceptor (PR) nucleiand cone ellipsoids were counted in each transect. For the purposeof this study, both double and single cones were counted as one(Hajar et al., 2008). Cells that overlapped the transect were onlycounted on the left side. The following formula was used to findthe number of rods:
Rods ¼ Pr nuclei� cone ellipsoids
Cell counts were expressed as density: cells per 0.01 mm2
(squared counts from 100 lm transects). The only differencesbetween dorsal and ventral cell densities occurred in L. mulhalli(rods were 1.8 times higher in dorsal than ventral, t-test, df = 8,t = 2.86, P = 0.02; and cones were 1.6 times greater in the dorsalthan ventral, t-test, df = 8, t = 3.84, P = 0.004) and P. bassensis(cones were 2 times higher in dorsal than in ventral, t-test,df = 8, t-value = 4.39, P = 0.002). Consequently, the cell counts werepooled by region for each of the eight species to enable furthercomparison based on the average values for the whole eye.
Tangential sections (3 lm) per species were cut and stained in asimilar fashion. From them, the cone mosaic (the pattern of singleand double cones) was observed. The tangential sections were alsoused to measure the diameter of the single and double cones (trea-ted as one unit) ‘en face’ at the widest cross section using Image J(Version 1.46r, National Institute of Health, USA). To calculate theminimum separable angle (MSA) (a), the lens diameter and highestdensity of cones (per 0.01 mm2) were used in the followingequation:
tana2
� �¼ qð1þ sÞ
2F
where q is the mean distance between two cones in mm (q = 0.1/pp); where p is density of cones per unit area 0.01 mm2), s is the
shrinkage factor and F is focal length (F = m � r; where m isMatthiessen’s ratio (2.55) and r is lens radius in mm). Since noshrinkage was measured in the majority of individuals (75%,n = 40) across all the species, the shrinkage factor was consideredto be zero and was omitted from the calculation of a. MSA (a)was used to find the potential visual acuity (VA) according to(Tamura, 1957):
VA ¼ a� 180p� 60
� ��1
Retinal magnification (b) was calculated using the following:
tan b ¼ 1 mmð1þ sÞF
whereby b is the angle subtended by a 1 mm projection on theretina.
2.3. Data analysis
Pearson’s correlation was used to measure the linear correlationbetween: eye diameter and total fish length; and lens diameter andtotal fish length. A Student’s t-test was used to compare cone androd densities in dorsal and ventral retinal areas within each spe-cies. An Analysis of Variance (ANOVA) was used to detect statisticaldifference between species for the following: cone density, roddensity, minimum separable angle and potential visual acuity.Tukeys’ post hoc test was used to find where the differenceoccurred. Data were accepted as significantly different whenP < 0.05.

L. gallus
T. declivis
T. degeni
L. mulhalli
P. bassensis P. melbournensis
S. flindersiN. richardsoni
Fig. 4. Transverse section of the retinas, showing the photoreceptors, of eight different fish species studied from benthic trawls in North-East Tasmania. The scale bars are all40 lm.
16 D.E. Hunt et al. / Vision Research 111 (2015) 13–21
3. Results
3.1. Eye and retinal morphology
With the exception of the oval nature of the eyes of P. bassensisand N. richardsoni, all species had round eyes. The species withlaterally compressed body shape (including T. degeni, T. declivis,L. mulhalli, P. melbournensis and S. flindersi) had eyes that arelocated on either side of the head allowing for greater peripheraland binocular vision. In dorso-ventrally compressed fish, such asthe Platycephalus spp., eyes are orientated dorsally.
The fish eye sizes ranged from 6.2 ± 1.3 mm (mean ± SD, hereand throughout) in the smallest species (L. gallus) to18.4 ± 1.5 mm in the largest (P. bassensis) and the mean lensdiameter ranged between 2.1 mm ± 0.2 (L. gallus) and7.7 mm ± 0.4 (P. bassensis) (Table 1).
The increase in eye diameter coincided with the increase intotal fish length and was described with linear trendlines (Fig. 1).For five out of eight species there was a significant correlationbetween the two variables (Table 2). T. degeni and S. flindersi hadalmost no correlation and L. mulhalli could not be used as it onlyhad two data points.
Similarly, linear correlations show the trend between lens diame-ter and total length (Fig. 2). Lens diameter had a strong positiveincrease with increasing length of the fish for six out of eight species(Table 3). Only half of the species, P. bassensis, P. melbournensis,L. mulhalli, and S. flindersi, were found to have a significant correlation.
3.2. Rod density
The mean density of rods (cells per 0.01 mm2) was significantlydifferent across the eight different species (ANOVA, F7,72 = 12.72,

Fig. 5. Relationship between mean diameter (lm) of double cones and the conedensity in each species studied from benthic trawls in North-East Tasmania, withlogarithmic equation.
D.E. Hunt et al. / Vision Research 111 (2015) 13–21 17
P < 0.001) (Figs. 3 and 4). L. mulhalli had the smallest number ofrods with 22800 ± 2980 per 0.01 mm2. There was a central group,consisting of P. bassensis, L. gallus, P. melbournensis and S. flindersi,with rod densities that ranged from 41670 to 52220 rods per0.01 mm2. The highest rod density of 76630 ± 5876 cells per0.01 mm2 was in T. declivis.
3.3. Cone density and diameter
A logarithmic decay function described the relationshipbetween double cone size, measured as cone diameter, and conedensity (Fig. 5). 72% of the decrease in double cone size was pre-dicted to be a function of cone density.
The mean density of cones (cells per 0.01 mm2) was signifi-cantly different between species (ANOVA, F7,72 = 32.564,P < 0.001). Post-hoc analysis showed that species were in threemain groups (Fig. 6). S. flindersi, N. richardsoni, P. bassensis,L. mulhalli and T. declivis all had 38–60 cones per 0.01 mm2.T. degeni and L. gallus had almost double this density, with�100 cones per 0.01 mm2. P. melbournensis had over four timesthe density of the first group with 235 ± 29 cones per 0.01 mm2.
Fig. 6. Mean density of cones (cells per 0.01 mm2) ± SE, in eight different teleostspecies studied from benthic trawls in North-East Tasmania. Common lettersrepresent values that are not significantly different.
3.4. Cone mosaics
Double cones were present in the mosaics of all species. Withthe exception of T. declivis, the double cones were arranged as aset of four around a single cone (Fig. 7). This arrangement variedslightly for each species with respect to the size of the cone cells(Table 1). T. declivis had only rows of double cones.
3.5. Minimum separable angle and potential visual acuity
Mean MSA and VA were significantly different between theeight species studied (ANOVA, F7,32 = 28.93, P < 0.001, andF7,32 = 15.15, P < 0.001, respectively) (Fig. 8 and Table 4). L. gallushad the lowest value of VA, 0.078, while L. mulhalli, S. flindersi,T. degeni, T. declivis, N. richardsoni and P. bassensis had from 0.125to 0.171. P. melbournensis had the highest value of 0.310. Retinalmagnification (RM) was also significantly different between theeight species (ANOVA, F7,32 = 65.37, P < 0.001), (Table 4).
4. Discussion
4.1. Dimensions of the eye
An increase in both eye diameter and lens diameter occurredwith an increase in total fish length in five of the species assessed,based on a linear relationship. This increase was in agreement withother studies (Fishelson et al., 2004; Hajar et al., 2008; Miyazakiet al., 2000). For those species that did not show a strong correla-tion in this study, this was likely due to the limited range of lengthsof the specimens collected. In contrast, the correlation does notapply to deeper water species, where it is hypothesised that thereis a limit on the space in the retina for accommodating photorecep-tor cells, and in this environment larger eyes are observed relativeto fish size (Kirschfeld, 1976). This study found that with increas-ing cone densities there was a decrease in the diameter of eachdouble cone which agrees with the findings of Boehlert (1978). Itis also recognised that, relative to fish size, eye size is generally lar-ger in carnivores than herbivores (Pankhurst, 1989). This was notthe case in this study as it was found that the two species withthe largest eyes, P. bassensis and N. richardsoni, had the smallesteye diameter to total length ratios. These two carnivorous flatheadspecies had the smallest ratios, followed by T. degeni which was theonly herbivore of the eight species. The largest eye sizes in relationto fish length were L. muhulli and P. melbournensis.
4.2. Rods
T. declivis had only 7.6 � 106 rod cells per mm2 of retina, whichwas similar to the previously reported value of 1 � 107 rods permm2 in a closely related species, yellowtail horse mackerel(Trachurus novaezealandiae), from shallow waters of North-easternNew Zealand (Pankhurst, 1989). Normally, the slight differenceseen between the Trachurus species could be attributed to the spe-cies inhabiting different ranges of depths (Edgar, 2012), however inthis case the maximum depth of both species is 500 m (Gomon,Glover, & Kuiter, 2008). Alternatively, it could be due to environ-mental conditions during larval development (Fishelson, Delarea,& Goren, 2012; Shand, 1997). T. declivis are more commonly foundin deeper waters and the juveniles are more likely to be found off-shore than T. novaezealandiae. As such, it would be expected thatT. declivis have greater rod density but this is not the case here.Thus, the difference seen could be due to natural interspeciesvariation. This could be tested by estimating the rod densities ofother Trachurus species for further comparison. No other studieson photoreceptor cell densities exist for L. mulhalli, S. flindersi,

L. gallus T. declivis
T. degeni L. mulhalli
P. bassensis P. melbournensis
S. flindersi
SC
DC
Fig. 7. Tangential sections revealing the cone mosaic patterns in seven different fish species studied from benthic trawls in North-East Tasmania. The scale bars in insets areall 40 lm. DC = double cone; SC = single cone.
18 D.E. Hunt et al. / Vision Research 111 (2015) 13–21
N. richardsoni, P. melbournensis, P. bassensis, L. gallus and T. degeni orother closely related species.
A high density of rods is normally attributed to deeper habitatranges (Eastman, 1988; Mas-Riera, 1991). In this case, T. declivisis known to inhabit a maximum range of 500 m (Gomon, Glover,& Kuiter, 2008), which is much deeper than the seven other speciesexamined in this paper, all with lower rod densities. It is evidentthat the mean number of rods per mm2 increases with theexpected maximum habitat depth of the species, see Fig. 9.While T. declivis had the greatest number of rods, N. richardsoni,
S. flindersi and L. gallus had the highest rod densities relative tothe other estimates. The maximum habitat range of N. richardsoni,S. flindersi and L. gallus extends to 160–240 m depth (Gomon,Glover, & Kuiter, 2008).
On the other end of the scale, P. melbournensis, T. degeni, andP. bassensis all had the lowest rod densities and inhabit watersup to 80–100 m deep. Even in closely related species this was thecase, for example, N. richardsoni have more rods than P. bassensisprobably because they are found up to 60 m deeper. This is becauserods are adapted for detecting dim light, and therefore are more

ig. 9. Maximum habitat depth profile (m) (bars) of eight bycatch species withean rod density (cells per 0.01 mm2) (dots). Depth data from Edgar (2012).
Fig. 8. Mean MSA ± SE (points), in eight different temperate fish species studiedfrom benthic trawls in North-East Tasmania. Common letters represent values thatare not significantly different.
D.E. Hunt et al. / Vision Research 111 (2015) 13–21 19
valuable for fish to perceive visual cues in low light intensity con-ditions associated with deep water (Fernald, 1988). For T. declivis,having the highest density of rods would likely result in this spe-cies responding quickly to lights, since rods are sensitive to theshift from dark to light (Bond, 1996). The only species that didnot follow this trend was L. mulhalli. This species is usually locatedat depths up to 100 m but had the lowest estimate of rod density.However, of the eight species, this species has the largest eyediameter to total length ratio, and an intermediate retinal magnifi-cation. This could be an adaption that allows for increased lightcapture and a larger depth range of the species. Alternatively, itcould simply be a reflection of the time actually spent at its maxi-mum range.
4.3. Cones
The densities of cones were found to be less variable amongspecies in this study than rod densities. While foveae, specialisedregions of high cone density, do occur in some fish species(Douglas & Hawryshyn, 1990; Wagner, 1990), this feature wasnot assessed in this study and average cone densities in dorsaland ventral regions were used for ease of species comparisons.Foveae may contribute to differences in functional visual abilityamong species. P. melbournensis had the greatest density of coneswhich suggests that they are adapted to shallow habitats, but theyare found in depths of greater than 100 m (Fishelson, Delarea, &Goren, 2012). This species is apparently diurnal (mostly active dur-ing the day), as are most of the other species’ in this study (Edgar,2012), suggesting they would be less reliant on rods. The high conedensity of P. melbournensis could be due to the fact that this is aschooling species (Edgar, 2012), requiring visual cues to maintainorientation in a group. However, T. declivis also exhibits schooling(Gomon, Glover, & Kuiter, 2008), and had a much lower cone
Table 4Visual acuity (VA) and retinal magnification (degrees) in eight different temperate fish spethat are not significantly different. Note: species are listed in order of highest to lowest V
Species Subset VA Sp
P. melbournensis a 0.3104 L.P. bassensis b 0.1713 T.N. richardsonii b 0.1658 L.T. declivis b 0.1573 P.T. degeni b 0.1576 T.S. flindersi b 0.1359 S.L. mulhalli bc 0.1248 N.L. gallus c 0.0774 P.
Fm
density. While it has been shown that certain species have visiondependent schooling behaviours (Kowalko et al., 2013), most fishuse the lateral line as the dominant mechanism for schooling(Larsson, 2012).
Conversely, S. flindersi, N. richardsoni, P. bassensis, L. mulhalli andT. declivis, all had the lowest density of cones. It could be assumedthat in the relatively shallow depth that light can penetrate (to�100 m), the absolute densities of cones are not as important asthe types of cones available. It has been demonstrated that singlecones and double cones (and perhaps also triple cones, that werenot observed in this study) are sensitive to different wavelengthsof light (Loew & Lythgoe, 1978; Marc & Sperling, 1976; Tamura,1957; Ullmann et al., 2011). The eyes of certain species may beadapted to their underwater visual environment niche, for specificlight intensities, light spectra, plankton colours, and dissolved andparticulate materials (McFarland & Munz, 1975).
4.4. Cone mosaics
The cone mosaic for six of the eight species had a similararrangement of four double cones around a centre single cone,which is a common arrangement, especially in shallow water spe-cies (Boehlert, 1978; Mas-Riera, 1991; Wagner, 1990). T. decliviswas different, with rows of double cones, which is a known patternfor species in deeper water habitats and shoaling species (Boehlert,1978). This is contrary to a similar species, Trachurus mediterraneus
cies indicating the subsets from post hoc analyses. Common letters represent valuesA and retinal magnification for ease of interpreting subsets.
ecies Subset Retinal magnification (�)
gallus a 20.61degeni b 10.40mulhalli c 8.49melbournensis c 8.26declivis c 8.15flindersi cd 7.31richardsonii d 6.32bassensis d 5.93
20 D.E. Hunt et al. / Vision Research 111 (2015) 13–21
ponticus, which has a regular structural organisation of four doublecones around a single cone (Podugolnikova, 1985). This differenceis unexpected since both species are deeper-water shoaling spe-cies. There are no studies in species similar to L. mulhalli, S. flindersi,P. melbournensis, P. bassensis, L. gallus and T. degeni. The shallowwater species would have increased visual capacity via coloursensitivity compared to the deeper water species, since this is con-ferred by the complex cone mosaic that can allow for detection ofdifferent light spectra (Boehlert, 1978; Losey et al., 1999).
4.5. Minimum separable angle and potential visual acuity
The MSA for T. degeni (6.6 min) was very similar to that ofanother Monocanthidae species, Cantherines modestus which hada value of 6.4 min (Tamura, 1957). However, the MSA of L. mulhalli(8.5 min) was higher than a related species Chelidonichthys kumu(6.8 min) (Tamura, 1957). This difference was most likely due tothe larger size of the specimens examined, for example C. kumugrows to around 500 mm (Gomon, Glover, & Kuiter, 2008) whilethe mean size of the L. mulhalli in this study was 172 mm.S. flindersi and T. declivis from this study were not similar to theirJapanese counterparts of the same size; the MSA for S. flindersi(7.7 min) was less than that of the Sillago japonica (10.0 min), whilein T. declivis (6.6 min) MSA was less than Trachurus japonicus(7.7 min) (Hajar et al., 2008). The two Sillago species have manysimilar characteristics such as habitat and maximum length, how-ever the difference in depth range (up to 170 m for S. flindersi andup to 30 m for S. japonicus) may be the key factor to these differ-ences in the values (Matsuura, 1985). Similarly, the maximumhabitat depth of T. declivis (up to 500 m) is deeper than the maxi-mum depth for T. japonicus (275 m) (Matsuura, 1985). TheJapanese species have higher MSA (lower resolution) even thoughthey occur in shallower water with higher light intensity.
Potential visual acuity is dependent upon cone cell density inthe calculation, and therefore these results tended to reflect similarpatterns among the eight species. For this reason, P. melbournensishad the largest calculated potential visual acuity. However, lenssize is also an important factor to determine potential visual acu-ity, which contributed to L. gallus possessing the lowest potentialvisual acuity of the eight species. The other six species (P. bassensis,N. richardsoni, T. declivis, T. degeni, S. flindersi and L. mulhalli) werenot significantly different. Higher potential visual acuity and lowretinal magnification are beneficial to an individual as they allowbetter distinguishing of fine detail at a greater distance. The bene-fits could range from finding food, to avoiding predation, or avoid-ance of commercial fishing gear (Hajar et al., 2008; Walsh &Hickey, 1993; Zhang & Arimoto, 1993).
5. Conclusion
By estimating the potential visual acuity of different bycatchspecies, calculating rod density, and reviewing the implicationsof specific photoreceptor mosaic patterns, the potential vulnerabil-ity of the species to fishing gear could be suggested. Importantly,visual ability alone is not the only contributor to fish behaviourand other sensory input (mechanosensory and chemosensory)may be critical especially for crepuscular or deep water species(Douglas & Hawryshyn, 1990). Retinal convergence and higherorder neural processing of visual information will also impactavailable visual stimuli, and detection of a visual cue alone cannotdetermine a fishes response to escape, swim towards or notrespond to the stimulus. However, for temperate shallow waterspecies, including those in this study, the dominant sensory modal-ity is vision (Douglas & Hawryshyn, 1990; Pankhurst, 1989). Interms of the commercial fishery, in particular trawling, where a
mix of fish are caught but only a select few species are kept, thisretinal morphology data can inform mitigation techniques suchas the use of light to reduce fish bycatch. The use of light couldaid in increasing the sensory detection of fishing gear, resultingin a visual cue for fish to detect an oncoming trawl and potentiallyelicit an escape response.
Acknowledgments
Many thanks to the crew of the FTV Bluefin for the collection ofsamples, Polly Hilder for assistance with resin histology, and theAustralian Maritime College for funding this project. D.H. was sup-ported by an APA Stipend from the University of Tasmania and JCwas supported by a University of the Sunshine Coast CRNResearch Fellowship. All procedures were carried out with theapproval of the University of Tasmania Animal Ethics Committee(approval number A0012574). The manuscript was improved withvaluable comments from two anonymous reviewers.
References
Boehlert, G. (1978). Intraspecific evidence for the function of single and doublecones in the teleost retina. Science, 202(4365), 309–311.
Bond, C. E. (1996). Biology of fishes. Fort Worth, Texas: Saunders College Pub., pp.750.
Catalan, I. A., Dunand, A., Álvarez, I., Alos, J., Colinas, N., & Nash, R. D. M. (2014). Anevaluation of sampling methodology for assessing settlement of temperate fishin seagrass meadows. Mediterranean Marine Science, 15(2), 338–349.
Douglas, R. H., & Hawryshyn, C. W. (1990). Behavioural studies of fish vision: Ananalysis of visual capabilities. In R. H. Douglas & M. B. A. Djamagoz (Eds.), Thevisual system of fish (pp. 544). London: Chapman and Hall.
Eastman, J. T. (1988). Ocular morphology in antarctic notothenioid fishes. Journal ofMorphology, 196(3), 283–306.
Edgar, G. J. (2012). Australian marine life. Sydney: Reed New Holland, pp. 624.Evans, B. I., & Browman, H. I. (2004). Variation in the development of the fish retina.
American Fisheries Society Symposia, 40, 145–166.Fernald, R. D. (1988). Aquatic adaptions in fish eyes. In J. Atema, R. R. Fay, A. N.
Popper, & W. N. Tavolga (Eds.), Sensory biology of aquatic animals (pp. 936). NewYork: Springer-Verlag.
Fernald, R. D., & Wright, S. E. (1985). Growth of the visual system in the Africancichlid fish, Haplochromis burtoni. Accommodation. Vision Research, 25(2),163–170.
Fishelson, L., Ayalon, G., Zverdling, A., & Holzman, R. (2004). Comparativemorphology of the eye (with particular attention to the retina) in variousspecies of cardinal fish (Apogonidae, Teleostei). The Anatomical Record Part A:Discoveries in Molecular, Cellular, and Evolutionary Biology, 277A(2), 249–261.
Fishelson, L., Delarea, Y., & Goren, M. (2012). Comparative morphology and cytologyof the eye, with particular reference to the retina, in lizardfishes (Synodontidae,Teleostei). Acta Zoologica, 93(1), 68–79.
Gailliet, G. M., Love, M. S., & Ebeling, A. W. (1996). Fishes: A field and laboratorymanual on their structure, identification, and natural question. Illinois: WavelanPress Inc., pp. 202.
Gomon, M. F., Glover, J. C. M., & Kuiter, R. H. (2008). The fishes of Australia’s southcoast. Adelaide: State Print, pp. 929.
Gurthrie, D. M., & Muntz, W. R. A. (1993). Role of vision in fish behaviour. In T. J.Pitcher (Ed.), Behaviour of teleost fishes (pp. 715). England: Chapman and Hall.
Hajar, M. A. I., Inada, H., Hasobe, M., & Arimoto, T. (2008). Visual acuity of PacificSaury, Cololabis saira, for understanding capture process. Fisheries Science, 74(3),461–468.
Kirschfeld, K. (1976). The resolution of lens and compound eyes. In F. Zettler & R.Weiler (Eds.), Neural principles in vision (pp. 430). Berlin: Springer-Verlag.
Knuckey, I. A. (2006). Southern and Eastern scalefish and shark fishery-bycatchutilisation scoping study. (p. 41). Victoria.
Kowalko, J. E., Rohner, N., Rompani, S. B., Peterson, B. K., Linden, T. A., Yoshizawa, M.,et al. (2013). Loss of school behaviour in cavefish through sight-dependant andsight-independant mechanisms. Current Biology, 23, 1874–1883.
Larsson, M. (2012). Why do fish school? Current Zoology, 58(1), 116–128.Loew, E. R., & Lythgoe, J. N. (1978). The ecology of cone pigments in teleost fishes.
Vision Research, 18, 715–722.Losey, G. S., Cronin, T. W., Goldsmith, T. H., Hydes, D., Marshall, N. J., & McFarland,
W. N. (1999). The UV visual world of fishes: A review. Journal of Fish Biology, 54,921–943.
Lyall, A. H. (1957). Cone arrangements in teleost retinae. Quarterly Journal ofMicroscopical Science, 98(2), 189–201.
Lythgoe, J. N. (1968). Visual pigments and visual range underwater. Vision Research,8(8), 997–1012.
Marc, R. E., & Sperling, H. G. (1976). The chromatic organisation of the goldfish conemosaic. Vision Research, 16, 1211–1224.
Mas-Riera, J. (1991). Changes during growth in the retinal structure of three hakespecies, Merluccius spp. (Teleostei: Gadiformes), in relation to their depth
D.E. Hunt et al. / Vision Research 111 (2015) 13–21 21
distribution and feeding. Journal of Experimental Marine Biology and Ecology,152(1), 91–104.
Matsuura, K. (1985). Carangidae. In O. Okamura & T. Kitajima (Eds.), Fishes of theOkinawa through and the adjacent waters, II (pp. 680). Japan: Japan FisheriesResource Conservation Association.
McFarland, W. N., & Munz, F. W. (1975). Part III: The evolution of photopic visualpigments in fishes. Vision Research, 15, 1071–1080.
Miyazaki, T., Shiozawa, S., Kogane, T., Masuda, R., Maruyama, K., & Tsukamoto, K.(2000). Developmental changes of the light intensity threshold for schoolformation in the striped jack Pseudocaranx dentex. Marine Ecology Progress Series,192, 267–275.
Pankhurst, N. (1987). Intra- and interspecific changes in retinal morphology amongmesopelagic and demersal teleosts from the slope waters of New Zealand.Environmental Biology of Fishes, 19(4), 269–280.
Pankhurst, N. W. (1989). The relationship of ocular morphology to feeding modesand activity periods in shallow marine teleosts from New Zealand.Environmental Biology of Fishes, 26(3), 201–211.
Podugolnikova, T. A. (1985). Morphology of bipolar cells and their participation inspatial organization of the inner plexiform layer of jack mackerel retina. VisionResearch, 25(12), 1843–1851.
Powers, M. K., & Raymond, P. A. (1990). Development of the visual system. In R. H.Douglas & M. B. A. Djamgoz (Eds.), The visual system of fish (pp. 419–442).London: Chapman and Hall.
Raymond, P. A., Barthel, L. K., & Curran, G. A. (1995). Developmental patterning ofrod and cone photoreceptors in embryonic zebrafish. The Journal of ComparativeNeurology, 359(4), 537–550.
Shand, J. (1997). Ontogenetic changes in retinal structure and visual acuity: Acomparative study of coral-reef teleosts with differing post-settlementlifestyles. Environmental Biology of Fishes, 49, 307–322.
Tamura, T. (1957). A study of visual perception in fish, especially on resolving powerand accommodation. Bulletin of the Japanese Society of Scientific Fisheries, 22(9),536–557.
Temple, S. E., Manietta, D., & Collin, S. P. (2013). A comparison of behavioural(Landolt C) and anatomical estimates of visual acuity in archerfish (Toxoteschatareus). Vision Research, 83, 1–8.
Ullmann, J. F. P., Gallagher, T., Hart, N. S., Barnes, A. C., Smullen, R. P., Collin, S. P.,et al. (2011). Tank color increases growth, and alters color preference andspectral sensitivity, in barramundi (Lates calcarifer). Aquaculture, 322–323,235–240.
Wagner, H.-J. (1990). Retinal structure of fishes. In R. H. Douglas & M. B. A. Djamgoz(Eds.), The visual system of fish (pp. 544). London: Chapman and Hall.
Walsh, S. J., & Hickey, W. M. (1993). Behavioural reactions of demersal fish to bottomtrawls at various light conditions. ICES Marine Science Symposia, 196, 68–76.
Zhang, X. M., & Arimoto, T. (1993). Visual Physiology of walleye pollock (Theragrachalcogramma) in relation to capture by trawl nets. ICES Marine ScienceSymposia, 196, 113–116.