Investigating oxygen diffusion in solid oxides by quasi elastic ...
21
Joseph Peet Mark Johnson, ILL Ivana Evans, Durham University
Transcript of Investigating oxygen diffusion in solid oxides by quasi elastic ...

Joseph Peet
Mark Johnson, ILL Ivana Evans, Durham University

Introduction to oxide ion conductors and solid oxide fuel cells
Introduction to my project
Introduction to La2Mo2O9
QENS experiment results so far
Molecular Dynamics Simulation results so far
Future Work

Solid oxide materials that conduct electricity via diffusion of O2-
through their crystal lattice
In order to be considered useful in applications a conductivity of 0.01 S cm-1 is agreed upon as a required minimum
Current OICs require high temperatures of ~800 °C to reach this limit
There is great research interest in developing intermediate temperature OICs which can operate in the 500-700 °C range
e- e-
e- e-
O2-
O2-
O2
H2
H2O
Anode
OIC Electrolyte Cathode
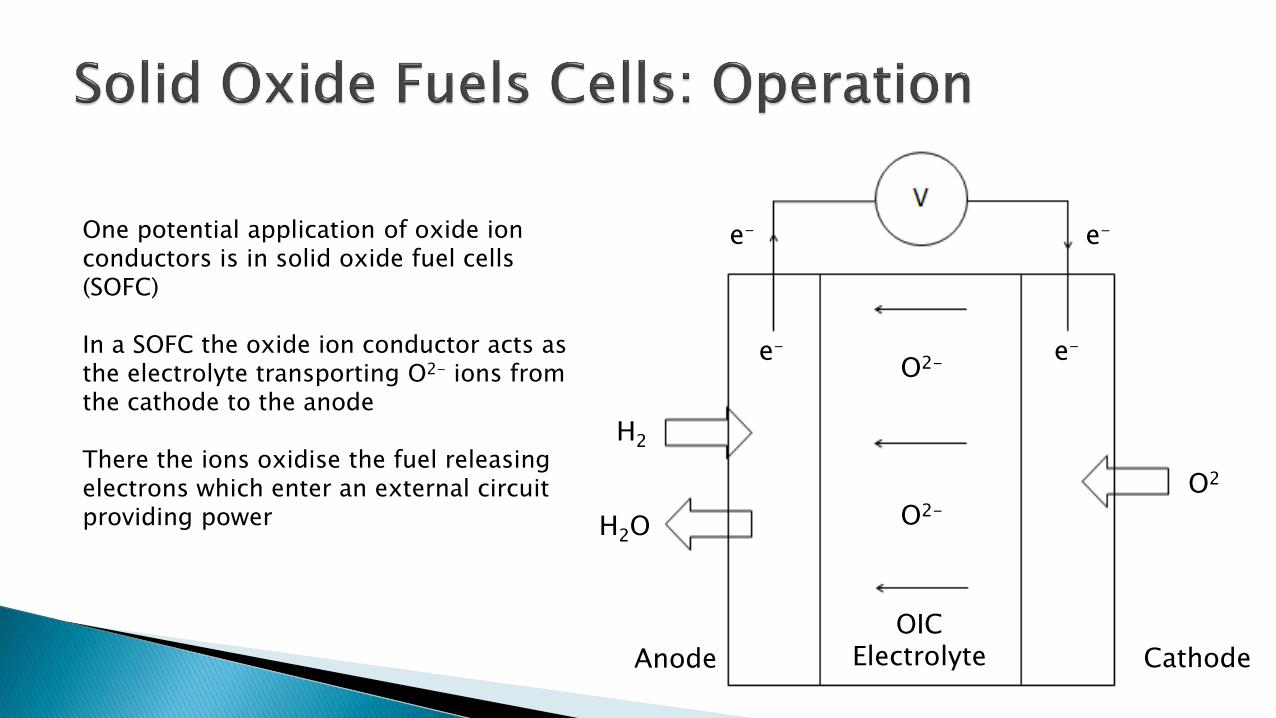
One potential application of oxide ion conductors is in solid oxide fuel cells (SOFC)
In a SOFC the oxide ion conductor acts as the electrolyte transporting O2- ions from the cathode to the anode
There the ions oxidise the fuel releasing electrons which enter an external circuit providing power

SOFCs can use H2, natural gas or biogas as a fuel
The reaction is very efficient with low emissions
They can act a clean form of distributed power generation
Can also act as a cleaner replacement for conventional backup generators
Potential applications as engines on vehicles

Synthesis of materials
Structure (X-rays) – Cell parameters and heavy atoms
Macroscopic Dynamics (Conductivity measurements)
Structure (Neutrons) – Needed for oxygen
Microscopic Dynamics (QENS and INS) MD simulations
Intelligent Design of New Materials
Durham ILL
Understand the relationships between micro and macroscopic
dynamics and structure

First year at Durham University – Produced samples for neutron experiments at ILL
Also worked on Na+ doped SrSiO3 materials and confirmed using SSNMR that although reported as OIC they were in fact Na+
conductors
Current work at ILL involves DFT simulations and a QENS experiment
The main sample under study is La2Mo2O9

La Mo O
B
C
560 °C
Low temperature phase P21:a = 14.3 Å,b = 21.5 Å,c = 28.6 ÅStructure made up of MoO4, MoO5
MoO6 polyhedra
High temperature phase P213:a = 7.2 ÅStructure made up of MoOx
polyhedra with partially occupied O sites

200 400 600 800
-8.0
-6.0
-4.0
-2.0
0.0
T/ C-l
og(σ/
S cm
-1)
At the phase transition there is an ~102x increase in conductivity
Conductivity reaches 0.01 S cm-1
goal at ~600 °C
Very good oxide ion conductor

Time of flight experiments carried out on IN6
No QENS signal was observed => dynamics too slow to be seen on meV / ps energy / time scale
Phonons observed => Could be related to rotations of polyhedra

Timescales probed by IN6 were too fast to see dynamics
Therefore experiments were carried out on IN16b
The μeV energy resolution of IN16b allows nanosecond timescales to be probed which should allow the long range dynamics in La2Mo2O9 to be observed

An elastic fixed window scan was carried out over a large temperature range
A plot of elastic intensity against temperature shows a large decrease at the phase transition temperature
This indicates that the dynamics have entered the time window of the instrument
This means that these dynamics occur on the nanosecond timescale
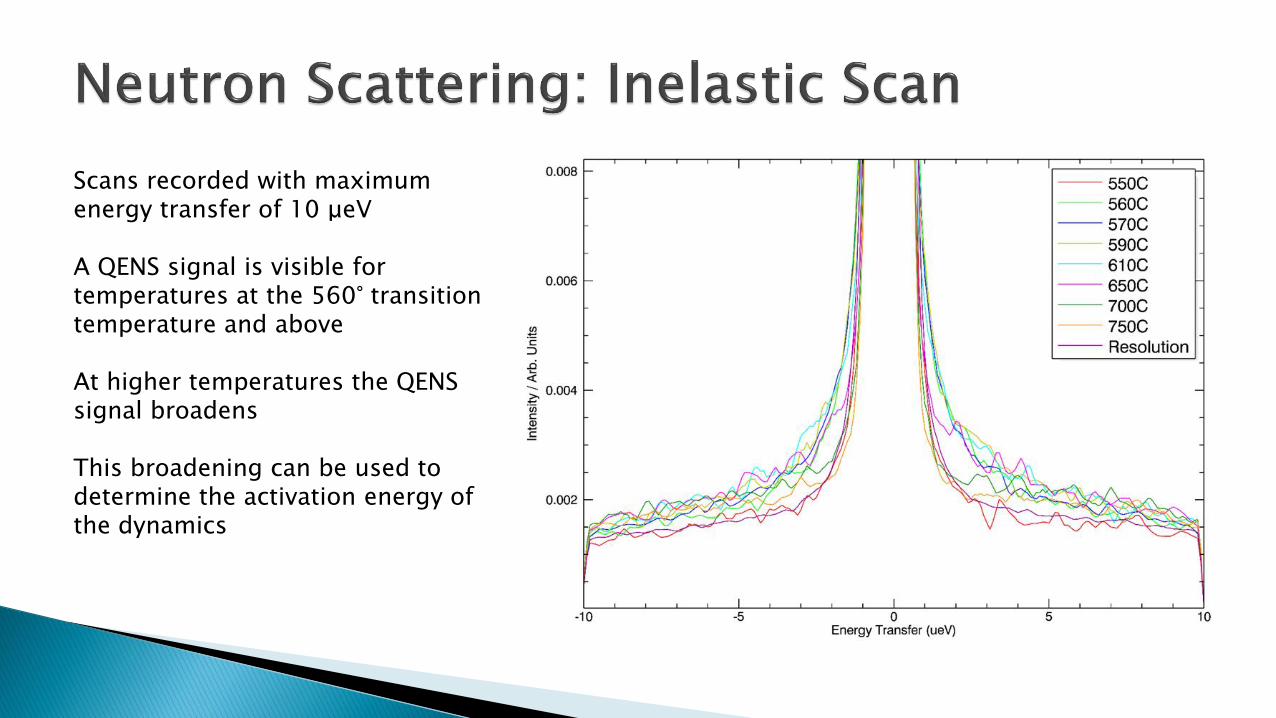
Scans recorded with maximum energy transfer of 10 μeV
A QENS signal is visible for temperatures at the 560° transition temperature and above
At higher temperatures the QENS signal broadens
This broadening can be used to determine the activation energy of the dynamics

1 1.05 1.1 1.15 1.2 1.25
0.5
1
1.5
2
2.5
1000 K /Tln
(Γ/ µ
eV
)
The QENS linewidth Γ has an Arrhenius relationship with temperature
Plotting this gives an activation energy of 0.61(5) eV
This compares to a value of 0.48 eV found using impedance measurements
This helps confirm that the dynamics probed are the same in both cases

0
0.5
1
1.5
2
2.5
3
3.5
4
0.00 1.00 2.00 3.00 4.00Γ
/ µ
eV
Q2 / Å-2
Experimental
Random Jump
Chudley Elliot
Guassian
The Q dependence of Γ should give information on the diffusion mechanism and provide jump lengths and timescales
Fitting of Γ vs Q2 for 570 °C data attempted using several models
So far fits have given jump lengths of around 6 Å which is quite long
Data for low Q values needed to get better fits
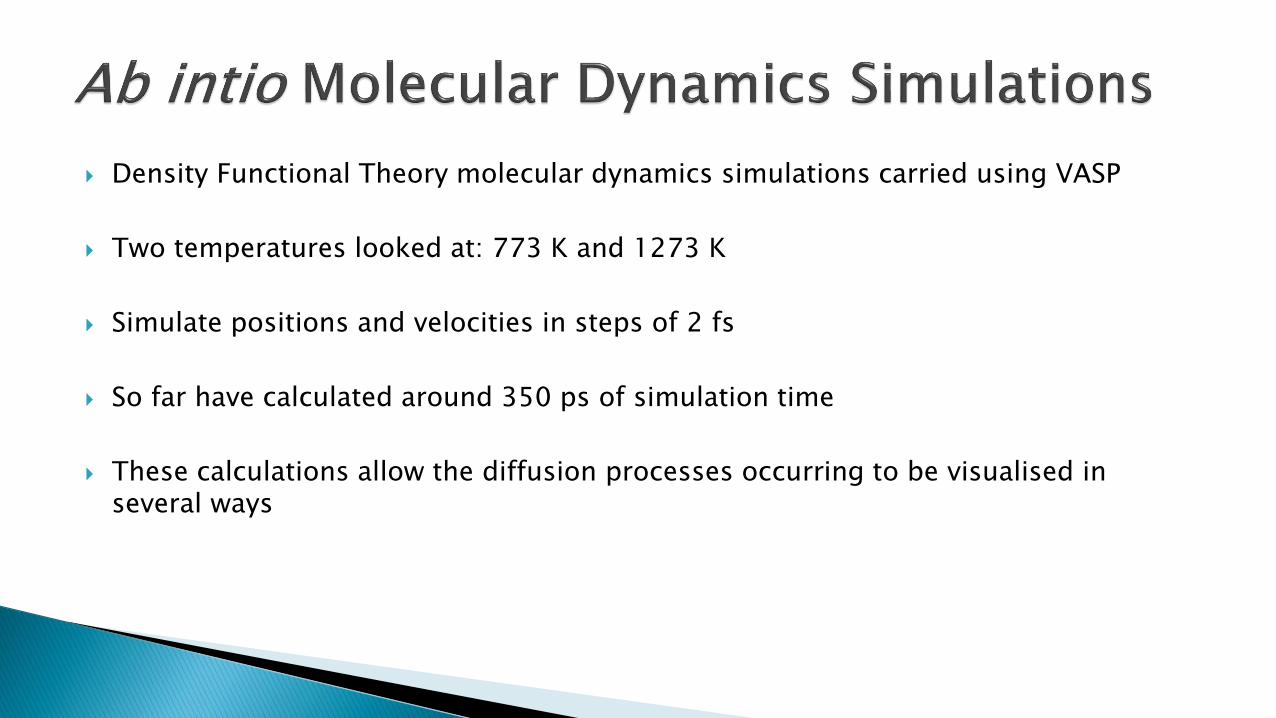
Density Functional Theory molecular dynamics simulations carried using VASP
Two temperatures looked at: 773 K and 1273 K
Simulate positions and velocities in steps of 2 fs
So far have calculated around 350 ps of simulation time
These calculations allow the diffusion processes occurring to be visualised in several ways
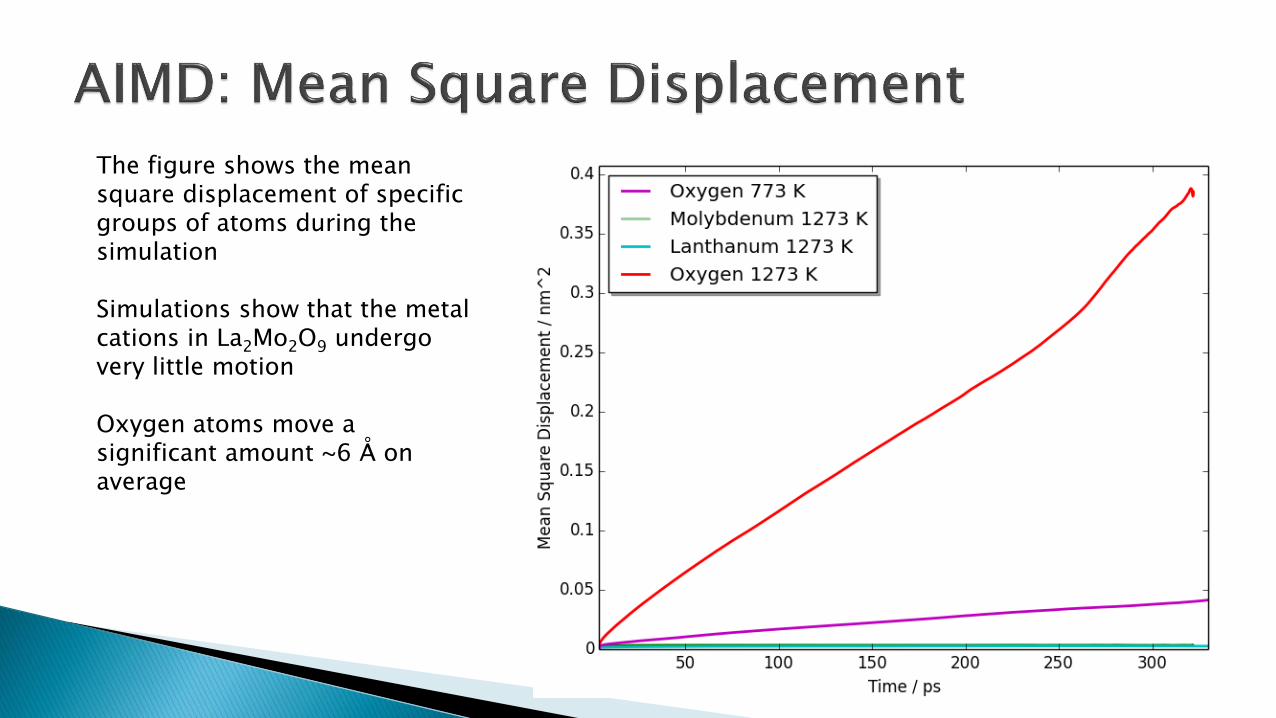
The figure shows the mean square displacement of specific groups of atoms during the simulation
Simulations show that the metal cations in La2Mo2O9 undergo very little motion
Oxygen atoms move a significant amount ~6 Å on average

The plot of RMSF shows the difference between the initial and final positions of individual atoms during the simulation
This can be used to identify O atoms that have moved a particularly long distance
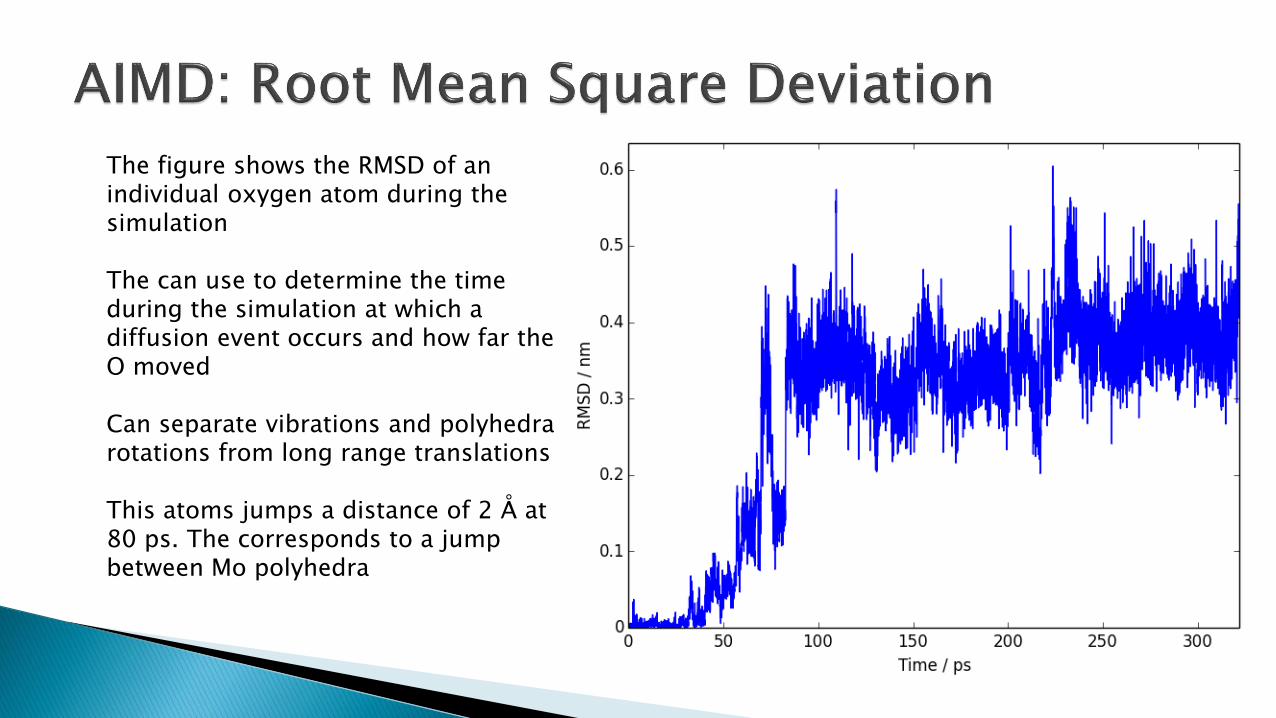
The figure shows the RMSD of an individual oxygen atom during the simulation
The can use to determine the time during the simulation at which a diffusion event occurs and how far the O moved
Can separate vibrations and polyhedrarotations from long range translations
This atoms jumps a distance of 2 Å at 80 ps. The corresponds to a jump between Mo polyhedra

The figure shows the area visited by a single oxygen atom during the simulation
The atom has undergone several jumps to new polyhedra
This allows the diffusion pathways to be visualised
Conduct a detailed analysis of La2Mo2O9 data including QENS results and DFT MD simulations
Carry out simulations and QENS experiments on other materials eg. BiVOx and La10Ge6O27
Develop pair potentials to allow classical MD simulations to be carried out in order to reach simulation times on the order of nanoseconds


![Arie Bodek, Univ. of Rochester1 [P13.011] Modeling Neutrino Quasi-elastic Cross Sections Using Up.](https://static.fdocuments.net/doc/165x107/56649d7a5503460f94a5eb2f/arie-bodek-univ-of-rochester1-httpwwwapsorgmeetapr03bapsabss3530011html.jpg)