Investigating mechanisms for effluent pond sealing: the ...
91
University of Southern Queensland Faculty of Engineering and Surveying Investigating mechanisms for effluent pond sealing: the effect of suspended organic particulate on soil hydraulic conductivity A dissertation submitted by Bradley Warren In fulfilment of the requirements of Courses ENG 4111 and 4112 Research Project towards the degree of Bachelor of Engineering (Environmental) Submitted: October, 2012
Transcript of Investigating mechanisms for effluent pond sealing: the ...

University of Southern Queensland
Faculty of Engineering and Surveying
Investigating mechanisms for effluent pond sealing: the
effect of suspended organic particulate on soil hydraulic
conductivity
A dissertation submitted by
Bradley Warren
In fulfilment of the requirements of
Courses ENG 4111 and 4112 Research Project
towards the degree of
Bachelor of Engineering (Environmental)
Submitted: October, 2012
i
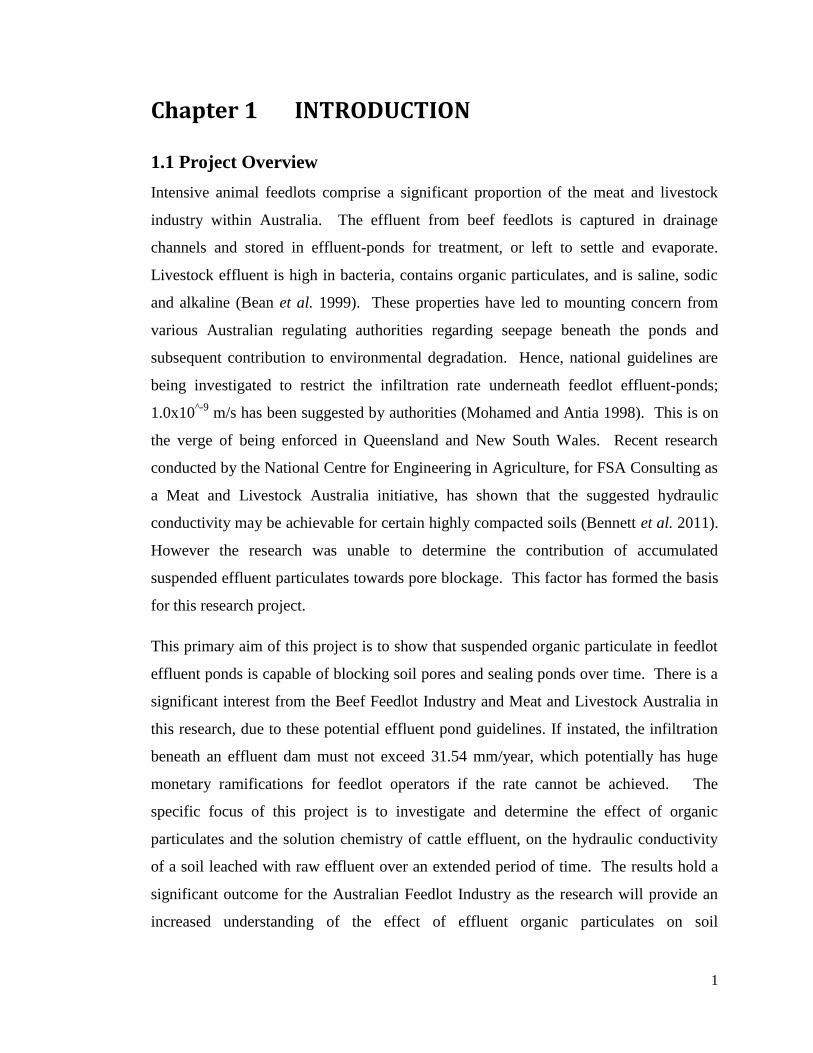
Abstract
Feedlot regulating authorities have proposed a pond seepage infiltration rate guideline
of 1.0x10^-9
m/s (31.54 mm/year) in an effort to control environmental degradation.
This project aims to investigate the effect of the organic particulates in feedlot effluent
upon physical pore blockage and a reduction in soil hydraulic conductivity (HC). Two
soils, a heavy clay and clay loam were treated with four solutions, calcium chloride,
synthetic effluent, filtered effluent and raw effluent, and the hydraulic conductivity
was calculated over an extended time period. The soils were compacted to 98%
maximum dry density (MDD) to ensure the best chance at achieving the guideline
infiltration rate. Hydraulic conductivity was calculated using a falling pressure head
method. Calcium chloride application caused a slight increase in HC, likely due to an
osmotic effect reducing the diffuse double layer. Synthetic effluent was compared
against actual effluent, results showed actual effluent caused a much slower flow rate,
from this observation it was concluded that accumulation of suspended solids was the
major reason for a reduction in HC, not dispersion or swelling. The raw and filtered
effluent samples were also compared and as expected the raw effluent produced a
slower HC, due to the higher amount of total suspended solids (TSS) in the solution,
although it was determined that particulate <3 μm was primarily responsible for pore
blockage. A reduction in TSS from the percolating solution to leachate meant that
solid organic matter has accumulating within the soil profile. It was concluded that
the organic particulate in feedlot effluent does contribute to pore blockage and a
reduction in HC. Regarding the guideline rate, the heavy clay achieved this target
after approximately 500 hours of leaching with a final HC of 9.39x10^-10
m/s. The
clay loam was unable to reach this rate during the time period finishing with a HC of
1.52x10^-9
. However, HC trends indicate that given time the clay loam HC could be
expected to achieve the guideline rate. This potential for a large cost saving, due to
negation of the requirement for expensive plastic liners to limit HC, was identified.
This project provides the groundwork for a more comprehensive study, involving a
wider range of soils and effluent sources, which have the potential to ensure the
sustainable operation of beef feedlot ponds by restricting pond seepage through
organic particulate pore blockage.

ii
University of Southern Queensland
Faculty of Engineering and Surveying
ENG4111 Research Project Part 1 &
ENG4112 Research Project Part 2
Limitations of Use
The Council of the University of Southern Queensland, its Faculty of Engineering
and Surveying, and the staff of the University of Southern Queensland, do not accept
any responsibility for the truth, accuracy or completeness of material contained
within or associated with this dissertation.
Persons using all or any part of this material do so at their own risk, and not at the
risk of the Council of the University of Southern Queensland, its Faculty of
Engineering and Surveying or the staff of the University of Southern Queensland.
This dissertation reports an educational exercise and has no purpose or validity
beyond this exercise. The sole purpose of the course pair entitled “Research
Project” is to contribute to the overall education within the student's chosen degree
program. This document, the associated hardware, software, drawings, and other
material set out in the associated appendices should not be used for any other
purpose: if they are so used, it is entirely at the risk of the user.
Professor Frank Bullen
Dean
Faculty of Engineering and Surveying

iii
CERTIFICATION
I certify that the ideas, designs and experimental work, results, analyses and conclusions
set out in this dissertation are entirely my own effort, except where otherwise indicated
and acknowledged.
I further certify that the work is original and has not been previously submitted for
assessment in any other course or institution, except where specifically stated.
Student Name: Bradley R Warren
Student Number: 0050101423
____________________________ Signature
____________________________
Date

iv
Acknowledgements
Firstly I would like to acknowledge and thank Dr John Bennett as my supervisor for
his time, assistance and guidance throughout this research project. His expertise on
the subject area was of great value in designing the experimental procedure and
analysing/ understanding the results. Finally his in-depth feedback regarding my
process was greatly appreciated.
I would also like to acknowledge the NCEA and Faculty of Engineering Laboratory
Staff, in particular Friederike Eberhard for her assistance and guidance regarding all
experimental and laboratory matters. Another staff whose assistance was greatly
appreciated included Daniel Eising for assisting me with the soil compaction
equipment. Finally I’d like to acknowledge NCEA office staff for helping with
equipment purchasing and mechanical engineering laboratory staff for manufacturing
sections of poly-pipe for use as soil cores.
I would also like to acknowledge FSA Consulting, in particular Mr Rod Davis, for
providing $500 funding towards purchasing experiment apparatus, and for allowing
me access to their full range of research papers and resources.
Finally I would like to mention the support of my family and close friends
throughout this year. Their willingness to assist me regarding computer software
usage, general feedback and all-around support made this research project enjoyable
and satisfying.

v
Table of Contents
Abstract i
Acknowledgements iv
List of Figures viii
List of Tables x
Chapter 1 INTRODUCTION 1
1.1 Project Overview 1
1.1 Project Objectives 2
1.2 Assessment of Consequential Effects 3
Chapter 2 LITERATURE REVIEW 6
2.1 Introduction 6
2.2 Soil Hydraulic Conductivity 8
2.3 Factors controlling hydraulic conductivity within the soil matrix 10
2.3.1 Clay content and relative soil pore size 10
2.3.2 Clay swelling properties 11
2.3.3 Clay dispersive potential 12
2.3.4 Diffuse double layer theory 13
2.3.5 Threshold electrolyte concentration 14
2.3.6 Effect of dispersion on pore networks 16
2.4 Bulk density 17
2.5 Percolating solution considerations 20
2.6 Potential for effluent solutions to seal clay lined ponds 21
2.6.1 Bio-physical Properties 21
2.6.2 Specific Past Research 22
2.7 Conclusion 24
Chapter 3 METHODOLOGY 26
3.1 Overview 26
3.2 Initial Preparation 26

vi
3.3 Solution Preparation 27
3.3.1 Calcium Chloride CaCl2 27
3.3.2 Synthetic Effluent 28
3.3.3 Filtered Effluent 28
3.3.4 Raw Effluent 30
3.4 Soil Preparation 30
3.5 Experiment Assembly 33
3.6 Hydraulic Conductivity Measurements 35
3.6.1 Falling head technique using 1.32 m of hydraulic head 35
3.6.2 Falling head technique using pipettes 35
3.8 Total Suspended Solids 36
3.9 Statistical Analysis 37
Chapter 4 RESULTS 38
4.1 Hydraulic Conductivity 38
4.1.1 Calcium Chloride 38
4.1.2 Raw and Filtered Effluent 39
4.1.3 Synthetic Effluent Comparison 41
4.1.4 Pore Volumes 43
4.1.5 Final Hydraulic Conductivity 44
4.2 Total Suspended Solids 46
Chapter 5 DISCUSSION 49
5.1 Soil Hydraulic Conductivity after CaCl2 application 49
5.2 Chemical effects of Synthetic Effluent 51
5.3 Effluent Particle Size 53
5.4 Total Suspended Solids Analysis 53
5.5 Contribution of Organic Particulate to a reduction in HC 55
5.6 Implications for Beef Feedlot Industry 56
Chapter 6 CONCLUSIONS 58
6.1 Conclusions of Results 58
6.2 Future Work 60

vii
List of References 61
Appendix A: Project Specification 67
Appendix B: Experimental Design and Planning 68
B.1 Initial Design 68
B.2 Risk Assessment 69
B.3 Resource Requirements 70
B.4 Timeline 72
Appendix C: Raw Data 73
C.1 Raw HC Data Sample 73
C.2 Hydraulic Conductivity Averages 75
C.3 Discharge Volume 76
C.4 Total Suspended Solids 77
Appendix D: Statistical Error Minitab Output 78

viii
List of Figures
Figure 2.1: Gravitational Flow in a vertical soil column (source: Hillel 2004) 9
Figure 2.2: Diffuse double layer: (a) Colloidal surface when dry; (b) Colloidal surface when wet
(Hillel 2004) 13
Figure 2.3: Threshold Concentration Curve with respect to salt concentration (mmol/L) and
SAR (Sumner 1993) 16
Figure 2.4: Influence of SAR on pore distribution and dispersion (Awedat et al. 2012) 17
Figure 2.5: Photograph showing void space ratio before and after compaction (Semmel 1993) 19
Figure 2.6: Reduction in saturated HC due to long term compaction (Semmel 1993) 19
Figure 3.1: Secondary filtration process using 3 um pore size, Whatman filter paper for fine
particle retention 30
Figure 3.2: Quick release compaction cylinder and standard hammer used in soil compaction
process 32
Figure 3.2: Soil Core Construction: A) soil core, B) 90 mm mesh filter socket, C) 90mm
coupling, D) 3 mm thick neoprene gasket, E) screw-on end cap, F) 19mm nozzle, G) o-ring,
H) brass nut 33
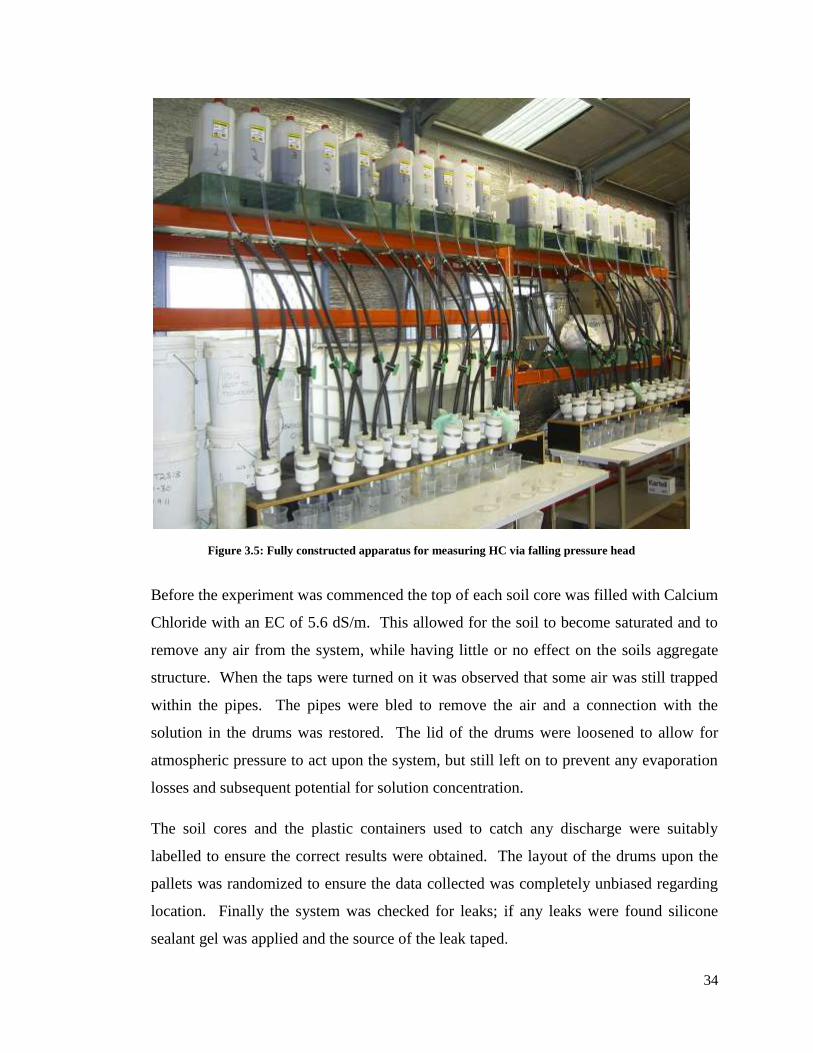
Figure 3.4: Fully constructed apparatus for measuring HC via falling pressure head 34
Figure 3.5: Pipette analysis to obtain the final HC reading 36
Figure 4.1: HC Curve for soils treated with calcium chloride solution, error bars show least
significant difference 39
Figure 4.2: HC Curve for soils treated with filtered (3) and raw (4) feedlot effluent, error bars
show least significant difference statistical results, the black line represents proposed
infiltration rate 40
Figure 4.3: Final HC of soils leached with filtered and raw effluent solutions, error bars show
least significant difference between treatments for each soil, clay loam (soil E) and heavy
clay (soil D) 41
Figure 4.4: HC Curve for Clay Loam (E) treated with synthetic (2), filtered (3) and raw (4)
effluent solutions over initial 50 hours, error bars show least significant difference with
respect to the synthetic treatment 42
Figure 4.5: HC Curve for Heavy Clay (D) treated with synthetic (2), filtered (3) and raw (4)
effluent solutions over initial 50 hours, error bars show least significant difference with
respect to the synthetic treatment 43
Figure 4.6: Final HC for soils leached with Calcium Chloride (1) and Synthetic effluent (2)
solutions, HSD error bars included 45

ix
Figure 4.7: Total Suspended Solids TSS (g/L) measured at different time periods throughout the
experiment, time zero shows permeate TSS while time 5-310 shows leachate TSS, HSD
bars represent difference of each treatment compared to time zero 47
Figure 4.8: Colour difference between permeate (darker) and leachate solutions (lighter) 47
Figure B1: Preliminary Falling Pressure Head Design 68
Figure B2: Timeline Graphical Chart 72
Figure C1: Day 1 Raw Data 73
Figure C2: Day 9 Raw Data 74
Figure C3: Average Hydraulic Conductivity Data 75
Figure D1: HC Stats Analysis Example Plots 79
Figure D2: TSS Stats Example Plots 80
x
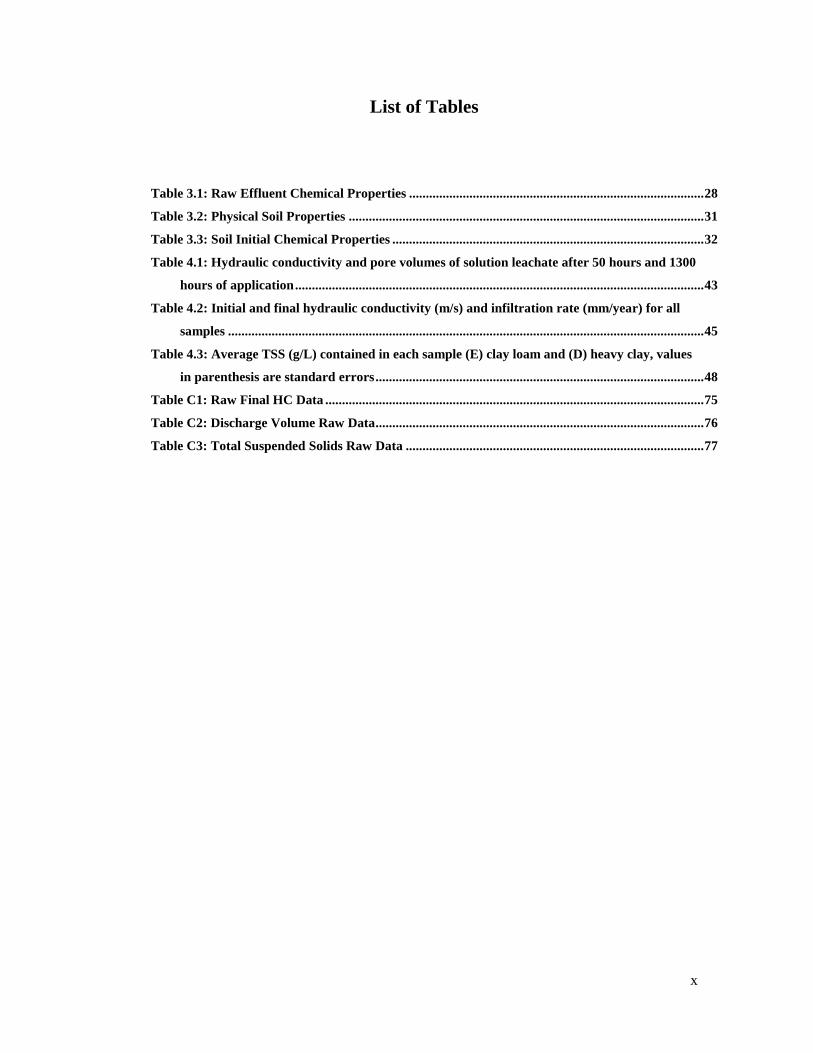
List of Tables
Table 3.1: Raw Effluent Chemical Properties ........................................................................................ 28
Table 3.2: Physical Soil Properties .......................................................................................................... 31
Table 3.3: Soil Initial Chemical Properties ............................................................................................. 32
Table 4.1: Hydraulic conductivity and pore volumes of solution leachate after 50 hours and 1300
hours of application .......................................................................................................................... 43
Table 4.2: Initial and final hydraulic conductivity (m/s) and infiltration rate (mm/year) for all
samples .............................................................................................................................................. 45
Table 4.3: Average TSS (g/L) contained in each sample (E) clay loam and (D) heavy clay, values
in parenthesis are standard errors .................................................................................................. 48
Table C1: Raw Final HC Data ................................................................................................................. 75
Table C2: Discharge Volume Raw Data .................................................................................................. 76
Table C3: Total Suspended Solids Raw Data ......................................................................................... 77
1
Chapter 1 INTRODUCTION
1.1 Project Overview
Intensive animal feedlots comprise a significant proportion of the meat and livestock
industry within Australia. The effluent from beef feedlots is captured in drainage
channels and stored in effluent-ponds for treatment, or left to settle and evaporate.
Livestock effluent is high in bacteria, contains organic particulates, and is saline, sodic
and alkaline (Bean et al. 1999). These properties have led to mounting concern from
various Australian regulating authorities regarding seepage beneath the ponds and
subsequent contribution to environmental degradation. Hence, national guidelines are
being investigated to restrict the infiltration rate underneath feedlot effluent-ponds;
1.0x10^-9
m/s has been suggested by authorities (Mohamed and Antia 1998). This is on
the verge of being enforced in Queensland and New South Wales. Recent research
conducted by the National Centre for Engineering in Agriculture, for FSA Consulting as
a Meat and Livestock Australia initiative, has shown that the suggested hydraulic
conductivity may be achievable for certain highly compacted soils (Bennett et al. 2011).
However the research was unable to determine the contribution of accumulated
suspended effluent particulates towards pore blockage. This factor has formed the basis
for this research project.
This primary aim of this project is to show that suspended organic particulate in feedlot
effluent ponds is capable of blocking soil pores and sealing ponds over time. There is a
significant interest from the Beef Feedlot Industry and Meat and Livestock Australia in
this research, due to these potential effluent pond guidelines. If instated, the infiltration
beneath an effluent dam must not exceed 31.54 mm/year, which potentially has huge
monetary ramifications for feedlot operators if the rate cannot be achieved. The
specific focus of this project is to investigate and determine the effect of organic
particulates and the solution chemistry of cattle effluent, on the hydraulic conductivity
of a soil leached with raw effluent over an extended period of time. The results hold a
significant outcome for the Australian Feedlot Industry as the research will provide an
increased understanding of the effect of effluent organic particulates on soil

2
permeability. Bennett et al. (2011) clearly showed that soils compacted to 98% of their
maximum dry density (MDD) exhibited the greatest potential for achieving a hydraulic
conductivity <1x10⁻⁹
m/s. Thus, effluent inherent organic particulate will presumably
also have the greatest potential to reduce hydraulic conductivity when soil is compacted
to 98% of the MDD. If a combination of soil compaction and pore blockage by organic
particulate can achieve sufficient reduction in hydraulic conductivity, then the
alternative method constructing plastic lined dams can be avoided and substantial
savings made.
1.1 Project Objectives
The specific objectives of this project include;
1. Determine if effluent inherent organic particulate is capable of reducing soil
hydraulic conductivity below the stated guideline, 1x10^-9
m/s, for soils
compacted to 98% of the MDD
2. Investigate the extent of soil hydraulic conductivity reduction attributable to
effluent chemical properties.
3. Determine the effect of effluent inherent organic particulate particle size on soil
pore blockage
To satisfy the project objectives an experimental procedure was developed. The
hydraulic conductivity of two different soils, a heavy clay (fine textured) and clay loam
(coarser textured), will be calculated using filtered and non-filtered feedlot effluent,
synthetic effluent and calcium chloride. The soils will be compacted to 98% bulk
density to ensure the infiltration rate is kept to a minimum, and therefore has the greatest
chance of reaching the suggested infiltration rate guideline. The hydraulic conductivity
will be calculated using Darcy’s equation for a falling pressure head. The results
collected will show the relationship between hydraulic conductivity and time for each
sample. From these results an analysis of the physical and chemical effects each
solution had upon soil hydraulic conductivity will be under-taken. To analyse the effect
particle size has upon bore blockage the total suspended solids of the percolating and

3
leachate solution will be analysed. It is expected that the leachate will contain less
solids then the permeate which allows the assumption that a certain amount of solid
particulate is being trapped inside the pore structure as the solution passes through the
core. If the expected results are obtained the total suspended solids analysis will support
the theory of organic particulates contributing to pore blockage.
1.2 Assessment of Consequential Effects
The outcomes of this research project will have various consequences for the feedlot
industry, society and the public. Many of the project consequences will impact upon
sustainability. The institution of Engineers Australia has an ongoing initiative with
regard to sustainability and engineering practice. The assessment of consequential
effects as a result of this project will be undertaken with regards to the Engineers
Australia, 10 aspects of sustainability.
The project experimental procedure will make use of some finite resources such as poly
pipe, plastic couplings and plastic drums. However the usage of this material is quite
limited and most of the equipment such as the drums and poly-pipe can be re-used in
future experiments. The natural resources being used include feedlot effluent and soil.
The majority of the effluent is disposed of throughout the experiment running time; a
small amount is kept in sample jars in case further analysis is required.
The major aim of this project is to reduce environmental degradation through reduction
of seepage below effluent ponds. The experimental design has no effect on
environmental condition as it is carried out in a controlled laboratory environment using.
If a desired outcome is reached then the project will have a positive influence on
environmental conditions, in particular surrounding feedlots. As this research only
involves two different soils, a larger study would likely results from any promising
results
The issue of involving all concerned citizens in environmental issues is not related to
this project work. As the research being undertaken is preliminary in its nature, i.e. it is
a scoping study and further research will be needed to make any industry based

4
recommendations. If a solution is put forward in several years’ time then the
agricultural community, in particular any area involved with feedlot operations, will
need to be notified and involved in the implementation process.
The pollution caused by implementing any potential solutions recommended by this
project or future work includes are extremely minimal. The environmental impact
associated with compacting the clay lined dams to the required level is the only real
opportunity for environmental pollution. In this case, the heavy earthworks machinery
required will have an impact on the environment due to fuel emissions.
The project and its outcomes don’t involve the ‘differences in living standards and the
participation of woman, youth or indigenous people’. The project aims to solve an
environmental problem using a naturally occurring phenomenon, thus there is no impact
on jobs through the process of automation. The only employees required to implement
the project outcome involve labourers or contractors who are hired to complete the
earthworks. As mentioned this has no impact on poverty or the reduction in the
differences of living standards.
If the project has meaningful and successful outcomes which are properly implemented
in Australian Feedlots then there is potential for the same information to be incorporated
in international countries, both developed and developing. The sustainability of the
project would be the same in any countries as the implementation of compacted clay
liners for effluent ponds is not heavily reliant on advanced technology, but will be
contingent on soil type. Differences in the pricing and method of the solution would be
dependent on the country. The equipment available to Feedlot operators would be the
defining factor, not the actual research behind the solution to achieving low infiltration
rates.
The final point raised by Engineers Australia regarding sustainable practices involves
the contribution of engineering to international understanding and peace. This particular
project will have no effect upon this area of sustainability. This is because the suggested
guidelines that form the basis for this study are for Australia only. While it is possible
that this research will be beneficial to feedlots in other countries there is no connection

5
between implementing this research worldwide and supporting international understand;
this project has no involvement with international politics.
It is also noted that the Engineers Australia Code of Ethics has been adhered to
throughout this project. The researcher takes full responsibility for conducting this
project in a manner that upholds the ethical nature in which professional engineers are
required to operate. The outcomes of this project will be presented in a way which is
equal and fair to all those involved and interested in this field of research.

6
Chapter 2 LITERATURE REVIEW
The potential for intensive livestock effluent inherent organic
particulates to reduce soil permeability
2.1 Introduction
Throughout the past several decades the global population has increased significantly.
With this trend expected to continue, the demand for agricultural produce in order to
sustain the population will also increase. Given this escalation in agricultural demand,
pressure is placed on current agricultural areas to produce more on the same land
resource. In order to achieve this, farm management systems will need to change to
allow for more intensive agriculture. In response, the occurrence of intensive livestock
feedlots has increased (MLA 2009). Large scale beef feedlots have become much more
common over the past two decades with cattle numbers increasing from two hundred
thousand to over a million. Individually these feedlots contain anywhere from 5000 to
50,000 head of cattle (ALFA 2011). While the intensive nature of this industry
addresses the demand for food and fibre, it also creates a significant and intensified
waste source that requires management in order to limit any potential environmental
impacts. Of particular concern is the localised concentration of nutrients and salts from
cattle effluent contributing to the potential for toxic accumulations and soil permeability
decline. To address this, liquid and organic particulate runoff caused during rainfall and
washing practices is often diverted from feedlot pens to be captured in clay lined
effluent ponds. Due to the chemical properties of the effluent, regulating environmental
authorities have begun to enforce beneath pond seepage limits. High seepage rates
create the possibility of contaminating ground water and soil in close proximity. Due to
the risk of environmental contamination the Queensland guidelines for establishment
and operation of beef cattle feedlots have proposed an allowable pond infiltration rate of
1.0 x 10⁻⁹
m/s (31.5 mm/year). Mohamed and Antia (1998) have suggested that this low
infiltration rate can be achieved by clay lined effluent ponds. Other states have yet to
enforce this particular infiltration guideline (WA Department of Agriculture 2002);

7
however it would be likely that this figure will be incorporated into more feedlot design
guidelines in the future.
Importing suitable clay onto feedlot sites to create a clay liner is an expensive task,
although less than the cost of rubber lining ponds. However, soils in the immediate
location of pond construction sites could potentially achieve the infiltration rate limit
proposed by Queensland regulatory authorities, through both chemical and physical
manipulation of the soil structure. The sodicity of feedlot effluent will likely result in a
solution with high sodium absorption ratio (SAR) which could cause a reduction in soil
permeability through swelling and dispersion of soil aggregates (Quirk and Schofield
1955). However, feedlot effluent also has a high electrical conductivity (EC) which
may cause the soil to maintain its structure even in the presence of sodic solutions, due
to increased osmotic potential (Quirk and Schofield 1955; McNeal and Coleman 1966;
Bennett and Raine 2012). Mechanical compaction of pond soil surfaces prior to
commissioning will further reduce the hydraulic conductivity as soil porosity is a
function of soil bulk density (Hillel 2004). Hence, as compactive effort increases, bulk
density is increased, which decreases soil porosity and reduces soil hydraulic
conductivity. Different levels of compaction have been used by feedlots in the past;
however to achieve the 1.0 x 10⁻⁹
m/s guideline it is highly recommended that a 98%
compaction level is used. In a report compiled by Bennett et al. (2011) it was found that
the guideline infiltration rate was not achieved over the running length of the project for
the majority of 17 Australian soils. This raises some doubt as to whether the proposed
guideline is actually achievable. Another option for feedlot operators is to construct
effluent holding ponds with rubber liners; however this is undesirable due to the high
expense of the rubber liner and construction costs. Thus, if possible, compacted clay
liners are the most suitable practice for the industry.
In the study of Bennett et al. (2011) soil compacted at 90, 95 and 98% of the maximum
dry density (MDD) was observed to act as a filter for organic particulates contained in
an intensive livestock cattle effluent solution. While reductions in permeability were
measured, it was determined that these reductions were primarily due the compaction
treatments, although entrainment of particulate within the soil pore matrix was likely to
8
have contributed. Continued settling of solid components within effluents onto pond
floors may therefore provide a means to completely seal ponds. Hence, this literature
review aims to investigate the factors influencing hydraulic conductivity in soils and the
potential for effluent contained organic particulates to induce pore blockage.
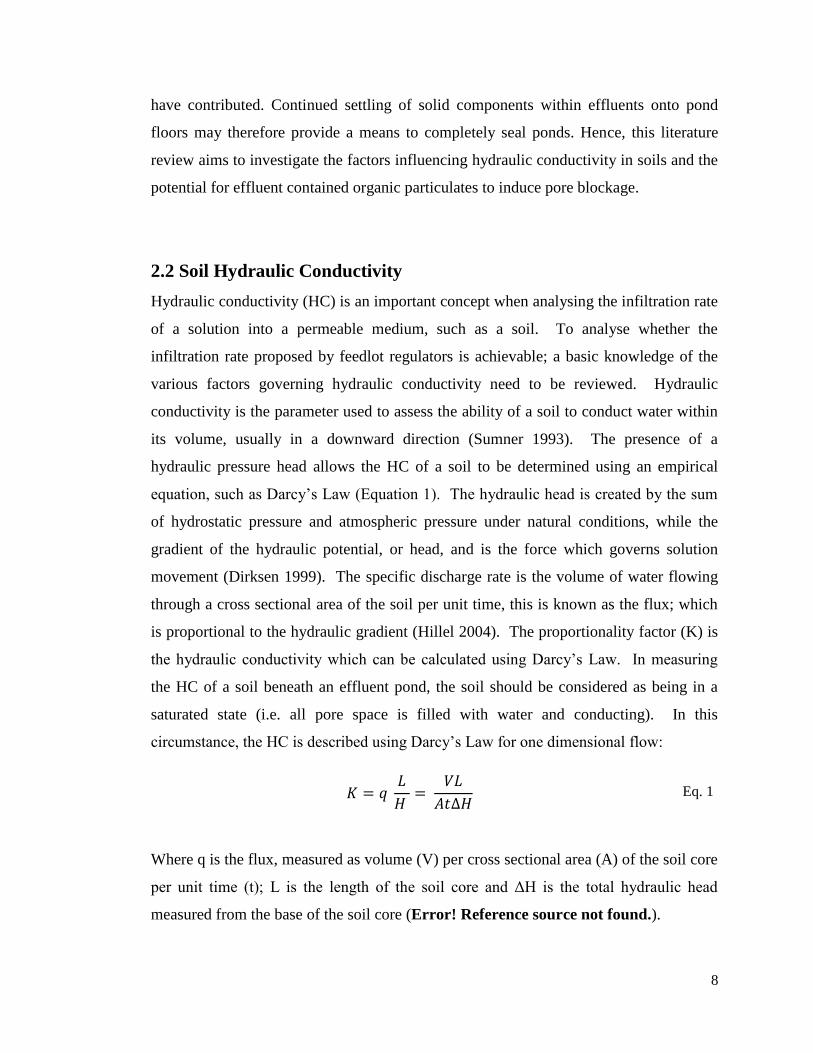
2.2 Soil Hydraulic Conductivity
Hydraulic conductivity (HC) is an important concept when analysing the infiltration rate
of a solution into a permeable medium, such as a soil. To analyse whether the
infiltration rate proposed by feedlot regulators is achievable; a basic knowledge of the
various factors governing hydraulic conductivity need to be reviewed. Hydraulic
conductivity is the parameter used to assess the ability of a soil to conduct water within
its volume, usually in a downward direction (Sumner 1993). The presence of a
hydraulic pressure head allows the HC of a soil to be determined using an empirical
equation, such as Darcy’s Law (Equation 1). The hydraulic head is created by the sum
of hydrostatic pressure and atmospheric pressure under natural conditions, while the
gradient of the hydraulic potential, or head, and is the force which governs solution
movement (Dirksen 1999). The specific discharge rate is the volume of water flowing
through a cross sectional area of the soil per unit time, this is known as the flux; which
is proportional to the hydraulic gradient (Hillel 2004). The proportionality factor (K) is
the hydraulic conductivity which can be calculated using Darcy’s Law. In measuring
the HC of a soil beneath an effluent pond, the soil should be considered as being in a
saturated state (i.e. all pore space is filled with water and conducting). In this
circumstance, the HC is described using Darcy’s Law for one dimensional flow:
Eq. 1
Where q is the flux, measured as volume (V) per cross sectional area (A) of the soil core
per unit time (t); L is the length of the soil core and ΔH is the total hydraulic head
measured from the base of the soil core (Error! Reference source not found.).

9
In a medium such as soil, solution flow is usually laminar, as it occurs at relatively low
velocities and in narrow flow paths where laminar flow is known to be predominant.
Under laminar flow, the average flow velocity is proportional to the hydraulic pressure
drop. This occurs as the pressure required to transport the fluid is equal to the frictional
resistance created by shear forces acting on the circumferential area of the flow path.
Additionally, laminar flow is constant, as there is no acceleration caused by axial forces
(Hillel 2004). These conditions allow for the application of Darcy’s law to measure HC.
As the velocity or cross sectional area increases flow approaches a turbulent state; in this
state the mean velocity is no longer proportional to the pressure head and it becomes
much harder to measure HC. Thus, in turbulent flow Darcy’s law is inapplicable as the
hydraulic gradient is no longer proportional to the flux (Hillel 2004). While the flow in
soils is assumed to be laminar, due to the narrow pore spaces, turbulent flow can still
occur under natural conditions, due to large cracks or crevices in the soil profile (e.g.
dry, un-swollen Vertosols). However, given that soil beneath effluent ponds is in a
saturated state and has undergone complete clay swelling, turbulent flow would be
Figure 2.1: Gravitational Flow in a vertical soil
column (source: Hillel 2004)
10
highly unlikely, especially where compactive effort has been applied. Thus, the use of
Darcy’s Law to describe the HC of effluent pond floors is warranted.
The HC of a soil greatly depends on the physical and chemical characteristics of a
particular soil, and the flow properties of the fluid. Soil HC measurements help
indicate the effects that other soil parameters have on infiltration rates, such as: the
tortuosity of the flow path, pore size distribution of the soil, and viscosity and density of
the liquid (Sumner 1993). Soil matrix structure can be altered by changes in the soil
solution chemical composition and concentration, which may increase or decrease
swelling and dispersive-potential. Thereby, it is important to realise that the HC value
will also be affected. Other factors with potential to affect HC include organic matter
accumulation (Vinten et al. 1983) and soil bulk density (Braunack & Peatey 1999;
Paydar & Ringrose-Voase 2003); the impact of these two factors form the basis for
analysing if clay lined dams can meet the infiltration rate guideline. Under normal
circumstances the HC of a soil decreases over time due to various chemical, physical
and biological effects (Vinten 1983; Rengasamy 1993; Magesan 1999; Abedi-Koupai
2006). The extent of the effect these factors have upon the HC of a soil will be explored
throughout the remainder of the literature review.
2.3 Factors controlling hydraulic conductivity within the soil matrix
2.3.1 Clay content and relative soil pore size
As discussed in preceding sections, soil physical properties have a large effect on
infiltration rates. Soil particles are classified into clay, silt and sand depending upon
particle size (clay <2 μm, 2 μm <Silt<20 μm, 20 μm <sand<2000 μm). Soils with a
high clay particle concentration are known as fine textured soil and have smaller pore
spaces, due to each particles minimal surface area (Isbell 2002). The resultant situation
in clay dominated soil is one where infiltration rates are low, as compared to sandier
coarse textured soil, due to higher flow resistance. Clay soils also have a higher water
holding capacity as the smaller pores create a higher tension force or suction within the
soil matrix (Ward & Trimble 2004). Specifically, the suction force occurs at the
boundary of the air and water contained in each pore, while the surface tension forces

11
are caused by adhesion and cohesion. Adhesion refers to the attraction of the water to
the sides of the pore while cohesion is the attraction of water to the existing water
surface. The height (head) of water in a pore is inversely proportional to the radius of
the pore, which means smaller pores attract more water. Thus, the smaller pores fill first
as they exert larger tension forces (Ward & Trimble 2004). Due to these properties,
soils with high clay content are chosen to line dams. As the clay content of many
Australian subsoils is high (Northcote and Skene 1972), it stands that in-situ soil may
well be suitable for reducing beneath pond permeability.
2.3.2 Clay swelling properties
Clay minerals have been found to contain a crystalline structure (Charman & Murphy
1991). Clay crystalline structures are either tetrahedral or octrahedral. Tetrahedral
structure occurs where four oxygen atoms surround a central cation, often Si4+
; while
octahedral structure has six oxygen atoms or hydroxyls surrounding a larger cation of
lower valency like Al3+
or Mg2+
(Rengasamy 1993; Hillel 2004). Tetrahedra and
octrahedra join together at the corners of a shared oxygen atom to form silica or alumina
sheets, as can be seen in Figure 2.2.
Figure 2.2: Clay crystalline structure; a) Tetrahedral forming a silica sheet; and b) Octahedra forming an
alumina sheet (Hillel 2004)

12
There are two main types of clay aluminosilicate layers which depend on the ratio of
tetrahedral to octahedral sheets, either 1:1 or 2:1. The most common 1:1 clay mineral is
kaolinite. The structure of this clay type is a pair of silica-alumina sheets that are
stacked together in alternating fashion. Holding the sheets together is hydrogen bonding
in a strong, multilayered lattice (Charman & Murphy 1991; Hillel 2004). Water and
ions cannot enter between these layers and only the outer edges of the structure are
exposed, this means Kaolinite has a low specific surface area. These characteristics
result in Kaolinite exhibiting less swelling and cracking than other clays.
Montmorillonite is the most present 2:1 clay type. The lamellae (composite layers) are
stacked in loose layers known as tactoids (Hillel 2004). The cleavage planes in-between
the lamellae draw in water and ions which results in expansion of the layers. As the
lamellae expand a greater percentage of the crystals surface becomes exposed, thus
dramatically increasing the effective specific surface area (Hillel 2004).
Montmorrillonite clay is often classed as plastic in its nature and will often undergo
greater swelling when upon wetting, due to this plasticity (Charman & Murphy 1991).
During drying, the soil cracks and forms hard peds reducing the ability for water to
infiltrate effectively within these peds, but also produces large fissures that encourage
rapid infiltration until the point that swelling once again closes the fissures
(Karathanasis & Hajek 1985).
2.3.3 Clay dispersive potential
The dispersive potential of a clay soil depends on several governing factors including;
the quantity of exchangeable sodium ions within the soil cation exchange capacity
(CEC), the electrolyte concentration of the soil solution, and the degree of mechanical
disturbance the soil has undergone. However, the primary reason for dispersion in soil
is due to chemical instability. This generally occurs when there is an abundance of
sodium present within the soil solution – termed sodicity. Northcote and Skene (1972)
defined that an Australian sodic soil has an exchangeable sodium percentage (ESP) of
>6.These phenomena are discussed in further detail below.

13
2.3.4 Diffuse double layer theory
Dispersion of soil aggregates into clay silt and sand is chemically governed by the
electrostatic or diffuse double layer. When a colloidal particle is dry, the neutralizing
counter-ions are attached to its surface creating an equilibrium state. When the particles
become wet some of the ions dissociate from the surface and enter into solution. The
negatively charged colloidal surface and the positively charged cations in solution form
the diffuse double layer (Sposito 1989; Sparks 2003); this is demonstrated in Figure 2.3
below.
This condition occurs due to the equilibrium between two opposite attractions; the bond
between positive and negative ions, which pull the cations closer to the colloidal
surface; and the kinetic motion of the fluid molecules, which causes the outward
diffusion of the cations to maintain equilibrium throughout the soil solution (Sposito
1989; Sparks 2003; Hillel 2004). The valencies of the ions in solution also play an
important role in relation to the size of the diffuse double layer. Divalent cations such
as calcium (Ca2+
) are attached closer to the colloidal surface due to a stronger attraction
to the clay anions (Sumner 1993). However if a greater concentration of monovalent
Figure 2.2: Diffuse double layer: (a) Colloidal surface when dry; (b) Colloidal surface
when wet (Hillel 2004)
14
cations like sodium (Na+) are present in the solution, the distance of the diffuse double
layer from the colloidal surface will be greater due to the weaker attraction force (Hillel
2004).
Soil cation exchange reactions have the ability to affect clay dispersion due to the
valency of ions and concentration of the soil solution. Cation exchange reactions occur
rapidly as a result of changes in the concentration of the soil solution; this is usually
caused by applying saline water. Therefor the composition of the CEC adapts in order to
reach equilibrium, the change in CEC properties affect swelling and dispersion
tendencies (Hillel 2004; Shainberg & Levy 2005). Mechanical dispersion can also
occur within sodic soils, either due to solution mixing or energy applied through
raindrops on the surface. This occurs when hydrated clay particles in equilibrium with a
low SAR solution are further separated by applying mechanical pressure (Shainberg &
Levy 2005). Clay particles close to the soil surface are more susceptible to dispersion
through mechanical disturbance.
The hydrated radius of different cations also has an effect upon the dispersive potential
of soil. Ions with a larger hydrated radius are held less strongly than ions with a small
radius (Hillel 2004). This explains why sodium ions have such a dispersive effect; in
combination with its monovalency, Na+ also has a large hydrated radius, which creates
an extremely weak attraction force. Hence, Na+ provides conditions that allow a
significant increase in the size of the diffuse double layer. Both calcium and magnesium
are divalent cations; however, due to the smaller hydrated radius of calcium, calcium
has greater stabilising properties when compared to magnesium (Sposito 1989).
2.3.5 Threshold electrolyte concentration
While sodicity and dispersion are primarily known to occur due to an adverse ESP, it is
possible that a soil will not undergo dispersion even in the presence of adverse sodium
levels. Due to an osmotic effect, soil stability can be maintained in the presence of
sodium. Such an effect is a function of soil salinity. If a percolating solution of greater
electrolyte concentration than the soil solution is applied to a soil; the soil solution
(lower EC) is contained close to the colloidal surface, where it is effectively pulled

15
through the diffuse double layer due to kinetic energy (Sparling et al. 1989). This
osmotic effect is generated due to the soil solution solute load. This osmotic effect
allows the positive attraction forces to prevail, which maintains a degree of soil stability,
even in the presence of excess sodium ions (Northcote and Skene 1972).
Bodman and Fireman (1950) first demonstrated that soil permeability is a function of
both ESP and EC. It was found that a high ESP (SAR) and low EC resulted in a
reduction of HC. Quirk and Schofield (1955) later proposed the ‘threshold
concentration’ concept (termed threshold electrolyte concentration; TEC), which refers
to the electrolyte concentration required to maintain soil permeability at an acceptable
level in the presence of a given ESP or SAR value. TEC is the concentration of salt
which causes a 10 to 15 % decrease in soil permeability (Quirk & Schofield 1955).
Experimental results for a soil leached with various solutions showed that NaCl had the
lowest molar threshold concentration of 2.5 x 10⁻¹
M. The decrease in permeability was
greatest for sodium saturated soils and least for the calcium saturated soils. Further
investigation by Quirk and Schofield (1955) showed that montmorillonite pads became
visibly swollen and impermeable when leached with 0.25 M of NaCl, while maintaining
reasonable flow rate when leached with 0.1 M of CaCl2. . The TEC varies depending
on other factors such as clay content, organic matter content, and bulk density which all
strongly influence the permeability of a soil (Frenkel et al. 1978; Shainberg et al. 1991).
During dispersion the clay particles separate from the silt and clay causing pores to
become blocked, dependent on pore size and the extent of dispersion. This phenomenon
has caused many researchers to propose that swelling and dispersion are the major
mechanisms contributing to the reduction in HC as EC is reduced (Quirk and Schofield
1955; Shainberg et al. 1991; Sumner 1993). Soils begin to swell as the EC of the
solution is lowered; this is more noticeable for SAR values greater than 10 as is shown
in Figure 2.4 below, although the effect is highly soil specific (Bennett and Raine 2012).
Figure 2.4 shows that soil stability, measured as a 25% reduction in HC, can be
maintained at a given SAR provide a sufficiently high concentration of salt is present in
solution (Sumner 1993). The threshold curve on the graph shows the relationship
between SAR, salt concentration and the level at which soil becomes unstable. The

16
values below the curve indicate soil in a stable condition, while values above the TEC
curve result in soil dispersion.
2.3.6 Effect of dispersion on pore networks
The images below re-iterate the theory of increased SAR causing reduction in HC. This
occurs through blockage of pores by dispersed clay, which results in a reduction of the
pore network. A study by Awedat et al. (2012) showed the effect of SAR on soil pore
distribution. Figure 2.5, illustrates pore network reduction due to increasing SAR of the
Figure 2.3: Threshold Concentration Curve with respect to salt concentration (mmol/L) and SAR (Sumner
1993)

17
permeating solution, where the green and yellow represent dyed resin filled pores and
the brown and red portions are soil particles. As the SAR increases there is a noticeable
decrease in pore spaces due to soil dispersion, once again this results in a significant
decrease in HC.
2.4 Bulk density
The term ‘bulk density’ expresses the ratio of the mass of solids to the total soil volume
(Hillel 2004). Dry bulk density and total porosity are often used to characterise the state
of soil compactness (Lipiec & Hatano 2003). When a soil is heavily compacted there is
an increase in bulk density which causes several changes regarding the physical
characteristics of a particular soil. These include soil strength, aeration, hydraulic,
thermal and structural properties (Lipiec& Hatano 2003). This literature review will
focus on the hydraulic properties of a compacted soil as this is highly relevant when
analysing compacted clay liners used in feedlot-effluent ponds.
Sassouline et al. (1997) showed that soil compaction decreases volumetric water content
at high matric potentials, while slightly increasing at low potentials. This results from a
decrease in the proportion of large pores and an increase in small pores. A drastic
reduction of hydraulic conductivity under increasing compaction has been reported by
several researchers such as Hakansson & Medvedev (1995) and Lipiec and Hatano
(2003). Saturated hydraulic conductivity is likely to occur beneath effluent ponds, due
Figure 2.4: Influence of SAR on pore distribution and dispersion (Awedat et al. 2012)

18
to the ponded hydraulic head that is the pond. Saturated water flow in a soil occurs
mainly through the larger pores, this is known as preferential flow. As discussed these
pores are greatly diminished under compaction and as a result water movement is
greatly restricted. Research has also indicated that compaction reduces not only the
volume of macropores but also their continuity, which effectively increases the tortuous
nature of the pore spaces within the structure (Lipiec & Hatano 2003). The active
macropores are known to significantly contribute to water flow; it was found that 10%
of macropores (>0.5 mm) and mesopores (0.06 – 0.5 mm) contribute to approximately
90% of the total water flux (Lin et al. 1996). Hence, a reduction of pore diameter in this
soil to <0.06 mm would likely result in approximately a 90% decrease in soil HC.
Another study by Hayashi et al. (2006) showed the relationship between pore sizes and
hydraulic conductivity, micropores classified by a diameter of less than 60 μm had a
slower HC than larger pores. Hayashi et al. (2006) concluded this was due to
micropores requiring more energy to absorb water. Furthermore, a study by Horn et al.
(1995) showed that soil porosity and hydraulic conductivity of a soil 40 cm below the
surface decreased from 4.5x10⁻¹
cm/s to 3.5x10⁻¹
cm/s after compaction occurred. In
this case compaction has been caused by excessive traffic from heavy machinery and
farm vehicles; approximately 100 kPa of stress was placed upon the A horizon of the
soil profile. Figure 2.6 shows that after compaction there is a significant decrease in
pore volume, which results in a significant increase in bulk density from 0.87 Mg m-3
to
1.46 Mg m-3
.
19
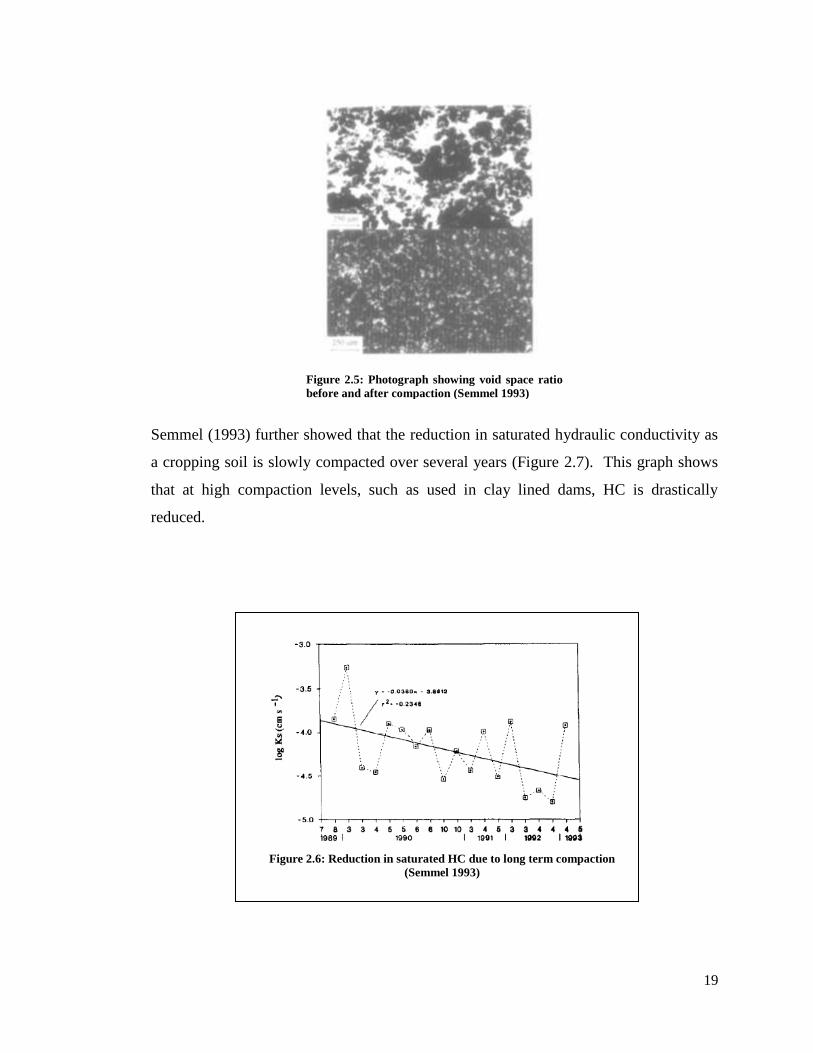
Figure 2.5: Photograph showing void space ratio
before and after compaction (Semmel 1993)
Semmel (1993) further showed that the reduction in saturated hydraulic conductivity as
a cropping soil is slowly compacted over several years (Figure 2.7). This graph shows
that at high compaction levels, such as used in clay lined dams, HC is drastically
reduced.
Figure 2.6: Reduction in saturated HC due to long term compaction
(Semmel 1993)

20
This research regarding compaction and reduced hydraulic conductivity has formed the
basis for implementing compacted clay liners to reduce infiltration rates from below
feedlot-effluent ponds. Higher levels of compaction will result in a higher bulk density
which will produce the best result when attempting to restrict permeability to below the
guideline rate (McCurdy & McSweeney 1993).
2.5 Percolating solution considerations
Irrigating with saline-sodic water has various chemical and physical affects upon a soil.
Salinity is a measure of soluble salts and influences soil properties and plant growth
(Vance et al. 2008). Salinity problems in Australia are in majority caused by excessive
sodium; any process that accumulates NaCl salt in the soil profile leads to soil
sodification unless a sufficient source of soluble calcium or magnesium minerals is
present (Rengasamy 1993). This further causes swelling of the diffuse double layer and
potentially dispersion of clay particles (Sumner 1993), thus resulting in a blockage of
pore spaces and a reduction in permeability (So and Aylmore 1993).
Research has shown that irrigation with saline-sodic waters cause soils to experience,
low plant available water capacity, low hydraulic conductivity, increased swelling and
high bulk density (Rengasamy and Olsson 1993; Vance et al. 2008; Ezlit 2010). If the
salinity of the percolating solution is high and the sodicity low, then the solution is
likely to have a positive chemical effect on soil hydraulic conductivity through osmosis.
A study involving land application of coal seam gas water (highly saline and sodic) by
Vance et al. (2008) analysed the chemical and physical soil properties. Results showed
that clay soils were at risk of increased bulk density from swelling of clay on wetting
and from potential clay particle dispersion. Dispersed clay particles accumulated in
subsurface pores as leaching continued. Surface water infiltration rates were also
significantly decreased in depths up to 120 cm. The reduction in infiltration was likely
caused by surface seal formation, clay dispersion, plugging of soil pores, and swelling
from increased SAR in soil solutions (Ben-Hur et al. 1985). This is further evidence
21
that saline-sodic solutions, such as feedlot effluent, may influence various soil
parameters to cause a reduction in HC.
2.6 Potential for effluent solutions to seal clay lined ponds
2.6.1 Bio-physical Properties
The physical characteristics of wastewater and soil play a major role regarding soil
hydro-physical properties. Several studies over the past three decades have shown that
treated wastewater used to irrigate agricultural land reduced the HC of a soil at a greater
rate than fresh water. This reduction in hydraulic conductivity has been associated with
the clogging of soil pores in the upper soil horizon with suspended solids (Vinten et al.
1983), as Wastewater contains a higher load of suspended solids and organic matter than
fresh water obtained from a bore or dam. The extent of soil sealing due to organic
particulates depends heavily on the pore size distribution of the soil. Organic matter
will block micropores within the soil structure quicker than macropores; in the case of
compacted clay the majority of the remaining pore spaces are micropores due to the
results of compaction (Feigin et al. 1991).
The growth of microorganisms and extracellular carbohydrate production due to high
nutrient content in the wastewater was also shown to contribute to pore blockage
(Magesan et al. 1999). This study conducted by Magesan et al. (1999) suggested that the
mechanism for the decrease in HC after wastewater was applied to land, was due to
increased microbial growth and extracellular carbohydrate production. Microorganisms
in the soil accumulate in the soil due to growth accelerated by an abundance of
nutrients; this causes pore blockage and a further reduction of hydraulic conductivity
(Magesan et al. 1999). These can be assumed to be a change in the biological soil
properties. Magesan et al. (1999) also noted the reduction in HC due to wastewater
application on the environment varies with soil type, wastewater characteristics, and the
vegetation of the irrigated soil.
Results for wastewater treated to different levels produced inconsistent results. For
example Levy et al. (1999) found that treated wastewater that has received primary
22
treatment, usually involving screening, settling, flocculation and filtering; produced
almost identical results to fresh water. On the other hand, Tarchitzky et al. (1999)
reported a decrease in hydraulic conductivity.
2.6.2 Specific Past Research
Bennett et al. (2011) conducted a research project to evaluate the effect of feedlot
effluent water on the permeability of soil used for constructing effluent dams. The
project aimed to determine if the infiltration guideline of 1x10^-9
(m/s) could be
achieved with compacted feedlot soils. Results showed that while there was a
substantial reduction in hydraulic conductivity post leaching with effluent, the guideline
was only satisfied by one soil. The reduction in HC was suggested to be caused
primarily due to soil compaction in conjunction with dispersed clay. However, organic
particulate accumulation was also suggested as a means of HC reduction. While this
study shows the potential of organic matter as a contributor to soil sealing the magnitude
of its effect was not considered in the original experimental design. In this study, the
soils were leached for two and a half months; a longer time period may have further
reduced HC due to extended accumulation of organic matter.
Furthermore, Bean et al. (1999) showed that the effect on HC of leaching compacted
soil with feedlot effluent was drastically different to leaching with water from the local
council supply. When leaching with either filtered effluent or raw effluent, there was a
significant decrease in soil permeability compared with water. Results showed a HC of
1x10^-6
(m/s) for water and 5x10^
-8 (m/) for feedlot effluent. Furthermore, when the
clay soil samples were removed from their mould and bisected a manure stain could be
seen within selected voids, indicating that effluent contained organic matter was
becoming trapped within the soil pores, thus contributing to the decrease in permeability
over time (Bean et al. 1999).
There has been very little research on the potential of agricultural effluent as a means of
reducing the hydraulic conductivity of clay lined ponds, although the impact of
irrigating agricultural land with treated wastewater has been relatively well researched
throughout the past few decades (Vinten et al. 1983, Halliwell et al. 2001; Magesan et
al. 1999). Land application of treated wastewater in agricultural areas is a method of

23
effluent disposal and a means to sustain agricultural production, especially in regions
where there is a shortage of freshwater (Mandal et al. 2008). There are various
similarities between treated wastewater and feedlot effluent, often including high
sodicity, high EC, high organic matter content (OMC), and the presence of suspended
solids. However, treated wastewater usually has fewer suspended solids and a lower
amount of organic matter present, due to removal during settling and filtration
processes. It has been shown that soils subjected to treated wastewater with high
sodium concentrations were generally found to have a substantial reduction of 20 to
30% HC compared to soils leached with calcium dominated water, (Hansen 2010).
Soil hydraulic conductivity may also be decreased through physical blocking of soil
pores, as a result of high amounts of suspended solids in the applied wastewater. It was
found that continued application of wastewater with high loads of suspended solids
[total suspended solids (TSS) ranged from 57-304 mg/L], may cause the formation of
restricted layers that can severely decrease the infiltration rate if not controlled
(Halliwell et al. 2001; Viviani et al. 2004). The effect of wastewater upon infiltration
rate when applied to soils was also observed by Vinten et al. (1983). When analysing
the influence of the suspended particles within the wastewater on the hydraulic
conductivity, they found that soil with majority smaller particle size, such as a clay
loam, decreased in HC more severely than in a sandy soil. This is a function of pore
size, as influenced by clay percentage. Wastewater irrigation was also found to
increase ESP and a reduce soil porosity (Abedi-Koupai et al. 2006). These findings
indicate that reduction in soil HC after application of wastewater is due to both the
retention of organic matter during infiltration and the change in pore size distribution
resulting from expansion and dispersion of clay particles (Vinten et al. 1983; Abedi-
Koupai et al. 2006).
A recent study by Awedat et al. (2012) highlighted the effect that pore size has upon
pore blockage and therefor HC Solutions containing various suspended clay
concentrations; 0, 5, 10 and 20 g/L; were leached through soils at two bulk densities,
1.0 g cm-3
and 1.2 g cm-3
. After percolating 10 pore volumes the water retention of each
core was measured. Results showed that soils with lower bulk density retained less
24
water even at high clay concentrations. This shows that soils with greater porosity will
allow a greater percentage TSS to pass through the core. Both bulk densities showed a
significant increase in water retention at the surface compared to the subsurface,
indicating that the water soil interface acts as the throttle to HC. Due to the high
concentrations of suspended solids contained in effluent it could also be expected that a
pore blockage would similarly occur at the surface.
From the literature presented above it is evident that potential exists for effluent to act as
a sealant for compacted, clay lined ponds, through both chemical and physical blockage
mechanisms. However, there is a dearth of information examining the effects of
untreated and unfiltered effluent, in particular the extent by which it may reduce the
hydraulic conductivity of a soil. From previous studies, most dealing with treated
wastewater application to agricultural land, it can be deduced that the hydraulic
conductivity of a soil will be reduced due to three processes: 1) biological - the growth
of microcellular bacteria and extracellular carbohydrates; 2) physical - the soil pores
becoming blocked by suspended solids and organic matter; and 3) chemical - dispersion
and swelling of clay particles caused by the high SAR of the wastewater. There were no
studies related to the application of treated wastewater to highly compacted clay soils.
Past studies have also neglected to investigate the impacts of applying and/or leaching
effluent to/through soil for a prolonged period.
2.7 Conclusion
This literature review has examined the ways in which feedlot pond effluent and its
chemical, biological and physical characteristics can affect soil physical and chemical
properties that are responsible for governing HC. In the circumstance of effluent ponds,
a reduction in HC for the pond floor is a positive outcome, and in this regard previous
studies have shown promise for saline-sodic water, treated wastewater and effluent in
reducing the HC of various soils (fine and coarse textured). Literature shows potential
exists for effluent to reduce the hydraulic conductivity in compacted soils to below the

25
guideline limit of 1x10^-9
(m/s). It was also highlighted that there is a requirement for
further understanding of the role of suspended organic particulate in decreasing soil HC.

26
Chapter 3 METHODOLOGY
3.1 Overview
To achieve the project aims outlined in the introductory chapter the following
experimental process was developed. Two soils, heavy clay from Undabri Feedlot in
Queensland, and clay loam from Rangers Valley Feedlot in New South Wales were
selected for analysis. These two soils were chosen due to their contrasting clay content,
which allowed for comparisons in hydraulic conductivity between fine and coarser
textured soils. Soil was compacted into soil cores at 98% compaction of the maximum
dry density (MDD). Each soil and solution contained five replicates to limit
uncontrolled variation. Four treatment solutions were then prepared:
1. Calcium Chloride CaCl2
2. Synthetic Effluent Solution
3. Filtered Feedlot Effluent
4. Raw Feedlot Effluent
The soil cores were then leached with the appropriate treatment solution for
approximately three months, with measurements for the hydraulic conductivity (HC)
being taken daily for the first ten days and then weekly for the remainder of the
experiment. Total suspended solids (TSS) of the filtered and raw effluent treatments
was determined and periodically compared to TSS of leachates obtained throughout the
experimental duration in order to assess the soils ability to entrain effluent inherent
organic particulates.
3.2 Initial Preparation
The first stage of the experimental procedure was the initial preparation period. This
involved being inducted into the laboratory and shown where all the equipment was
stored and where the personal protective equipment was located. A large proportion of
this stage was spent organizing funding for the experimental equipment not available
from the laboratory. Before parts were purchased quotes were collected which allowed

27
for a cost analysis of the entire experiment, more detail on the project budget will be
given in the resource requirements contained in Appendix B. The final task in this stage
was to thoroughly clean the secondary IBC tank. This was completed using a gurney
capable of applying hot water which effectively removed the existing grime from inside
the tank.
3.3 Solution Preparation
As mentioned in the overview the project was designed around the hydraulic
conductivity testing of four unique solutions. Preparing each solution was a significant
and vital part of the total experimental preparation stage. The four treatment solutions
were prepared as follows. Justification for each solution is also provided in the
respective sections below.
3.3.1 Calcium Chloride CaCl2
A calcium chloride (CaCl2) solution prepared at the same EC as the effluent (5.6 dS/m)
was used as a control because this removed the osmotic effect on soil structure as a
variable and ensured that soil structural integrity was maintained. In doing this, a
baseline hydraulic conductivity relative to the soil specific structure and osmotic effect
of permeating solutions was obtained.
The chemical properties of the effluent had previously been examined by Bennett et al.
(2011) (Table 3.1). Hence the CaCl2 solution was formulated to match the electrical
conductivity (EC) of the raw effluent which was 5.6 dS/m. To create ten liters of
solution 41.216 g of Calcium chloride dehydrate (CaCl2 2H2O) powder was mixed with
10L of de-ionized water.
28
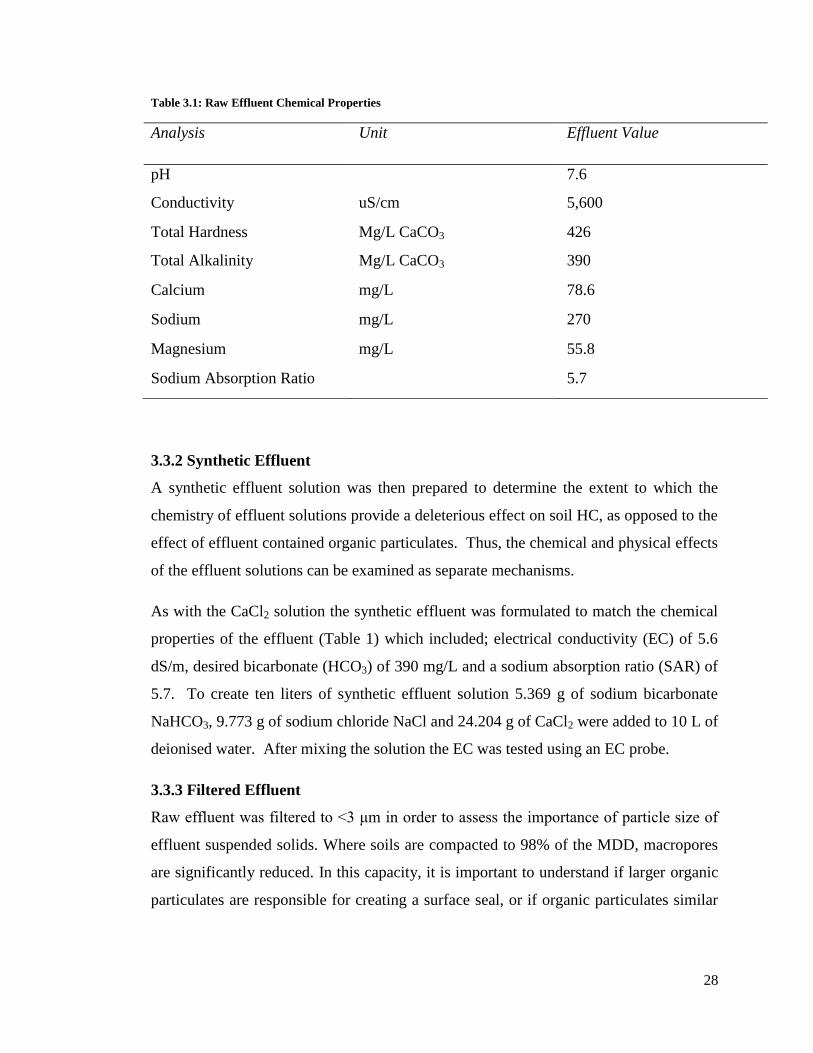
Table 3.1: Raw Effluent Chemical Properties
Analysis Unit Effluent Value
pH 7.6
Conductivity uS/cm 5,600
Total Hardness Mg/L CaCO3 426
Total Alkalinity Mg/L CaCO3 390
Calcium mg/L 78.6
Sodium mg/L 270
Magnesium mg/L 55.8
Sodium Absorption Ratio 5.7
3.3.2 Synthetic Effluent
A synthetic effluent solution was then prepared to determine the extent to which the
chemistry of effluent solutions provide a deleterious effect on soil HC, as opposed to the
effect of effluent contained organic particulates. Thus, the chemical and physical effects
of the effluent solutions can be examined as separate mechanisms.
As with the CaCl2 solution the synthetic effluent was formulated to match the chemical
properties of the effluent (Table 1) which included; electrical conductivity (EC) of 5.6
dS/m, desired bicarbonate (HCO3) of 390 mg/L and a sodium absorption ratio (SAR) of
5.7. To create ten liters of synthetic effluent solution 5.369 g of sodium bicarbonate
NaHCO3, 9.773 g of sodium chloride NaCl and 24.204 g of CaCl2 were added to 10 L of
deionised water. After mixing the solution the EC was tested using an EC probe.
3.3.3 Filtered Effluent
Raw effluent was filtered to <3 μm in order to assess the importance of particle size of
effluent suspended solids. Where soils are compacted to 98% of the MDD, macropores
are significantly reduced. In this capacity, it is important to understand if larger organic
particulates are responsible for creating a surface seal, or if organic particulates similar
29
in particle size to dispersed clay (<2 μm) are more effective in blocking fine pore
networks.
The suspended solids and organic particulate contained in the raw effluent was filtered
using a two tier filtration process. The initial filtration implemented the use of a geo-
textile fabric which was folded inside a large funnel (150 mm diameter). Gravitational
pressure head was used to transport the effluent from an IBC tank situated at an elevated
level, through the porous geo-textile material into a second IBC tank at ground level.
The geo-textile material allowed the effluent to flow through at a fast rate while still
retaining larger suspended solids. Removing the larger particles in the initial filtration
prevents the fine filter paper used in the secondary tier process from prematurely
clogging and blocking effluent flow.
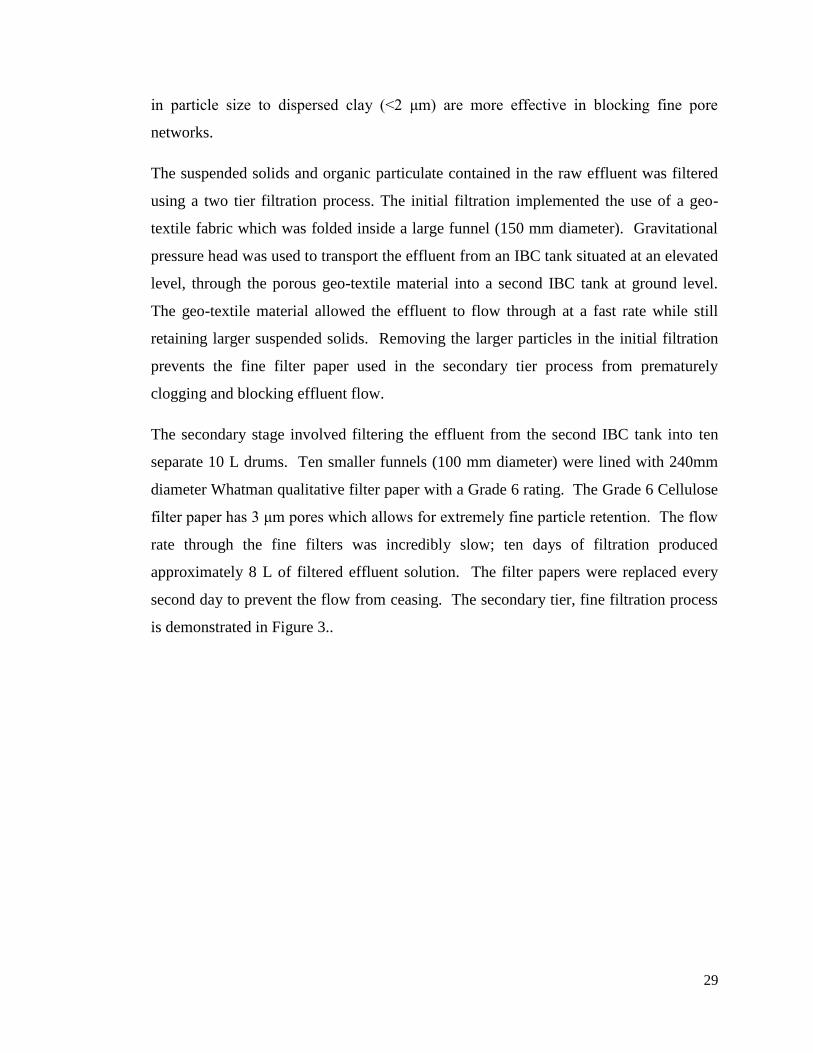
The secondary stage involved filtering the effluent from the second IBC tank into ten
separate 10 L drums. Ten smaller funnels (100 mm diameter) were lined with 240mm
diameter Whatman qualitative filter paper with a Grade 6 rating. The Grade 6 Cellulose
filter paper has 3 μm pores which allows for extremely fine particle retention. The flow
rate through the fine filters was incredibly slow; ten days of filtration produced
approximately 8 L of filtered effluent solution. The filter papers were replaced every
second day to prevent the flow from ceasing. The secondary tier, fine filtration process
is demonstrated in Figure 3..
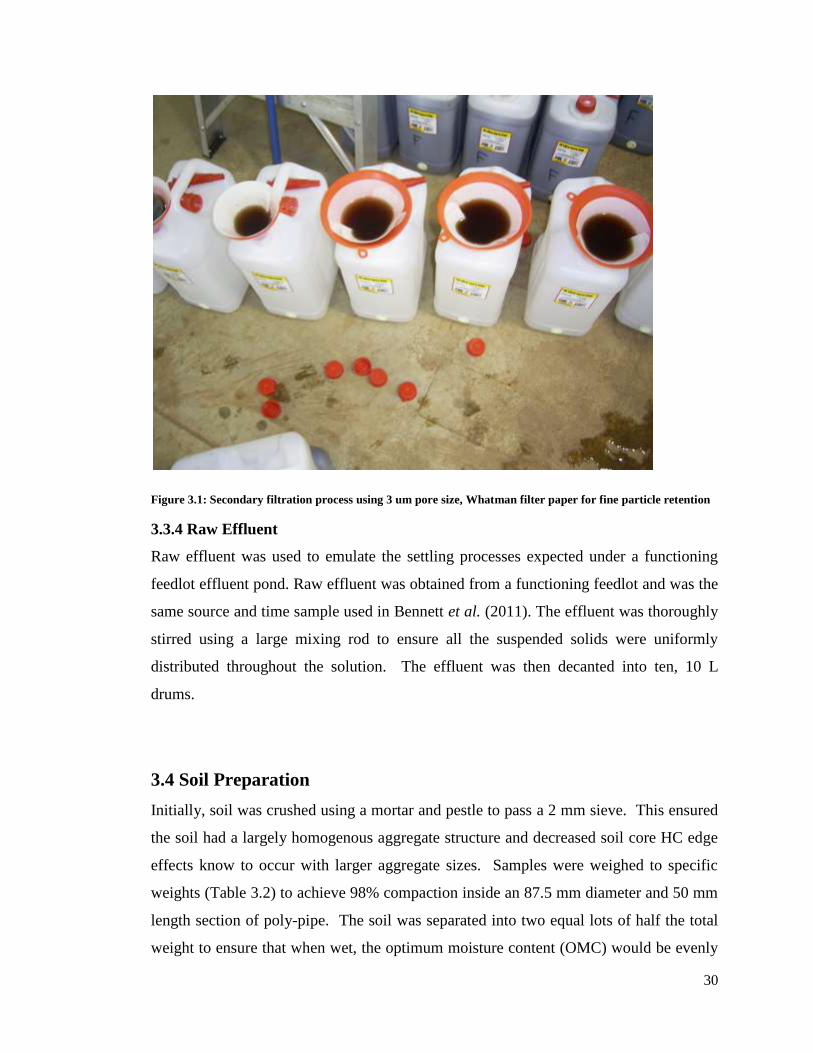
30
Figure 3.1: Secondary filtration process using 3 um pore size, Whatman filter paper for fine particle retention
3.3.4 Raw Effluent
Raw effluent was used to emulate the settling processes expected under a functioning
feedlot effluent pond. Raw effluent was obtained from a functioning feedlot and was the
same source and time sample used in Bennett et al. (2011). The effluent was thoroughly
stirred using a large mixing rod to ensure all the suspended solids were uniformly
distributed throughout the solution. The effluent was then decanted into ten, 10 L
drums.
3.4 Soil Preparation
Initially, soil was crushed using a mortar and pestle to pass a 2 mm sieve. This ensured
the soil had a largely homogenous aggregate structure and decreased soil core HC edge
effects know to occur with larger aggregate sizes. Samples were weighed to specific
weights (Table 3.2) to achieve 98% compaction inside an 87.5 mm diameter and 50 mm
length section of poly-pipe. The soil was separated into two equal lots of half the total
weight to ensure that when wet, the optimum moisture content (OMC) would be evenly

31
distributed throughout the soil sample which results in even compaction levels
throughout the soil core. This is important as by compacting the soil as a single weight
would result in over-compaction at the top of the core and under-compaction at the base
of the core with bulk density correct when averaged across the compaction gradient.
This un-even compaction would then likely alter HC measurements at the infiltration
interface. The required soil weight and amount of deionised water to achieve OMC is
shown in Table 3.2 below. The core size is 8.75 x 5 cm which gives a volume of 300.66
cm3.
Table 3.2: Physical Soil Properties
Soil
MDD
(t/m3)
OMC
(%)
98%
MDD
(t/m3)
Soil
weight for
98% (g)
Moisture to
achieve OMC at
98% (mL)
50% soil
weight for
98% (g)
50% OMC at
98%
compaction
(mL)
Undabri 1.492 8.1 1.46216 440 76 220 38
Rangers 1.689 5.36 1.65522 498 37 249 18
After the soil samples had been prepared to correct OMC soils were compacted to 98%
of the MDD inside storm water-pipe soil rings. The poly-pipe was measured and
marked to ensure that the compaction level was accurate. This is demonstrated in
Figure 3.2 below. A compaction cylinder, hammer and ring were used to compact the
soil to the appropriate level inside the poly-pipe. This usually involved approximately
four or five drops of the hammer; an example of the compaction equipment used is
displayed in Figure 3.2. The soil chemical attributes for the soils in their initial state are
presented in Table 3.3.

32
Table 3.3: Soil Initial Chemical Properties
Soil ID/ Type
pH OM (%) EC (dS/m) ESP (%) ECEC
(cmol/kg)
Ca:Mg
D (heavy clay) 7.8 1.6 0.13 6.7 41.76 1.7
E (clay loam) 6.8 0.5 0.06 1.7 13.29 2.4
Once the soil was compacted the plastic core was placed into a mesh cylinder with two
standard Grade 1 90 mm Whatman filter papers. This formed the bottom of the core. A
90 mm plastic coupling was then placed on the top half of the core with two more
identical filter papers placed on the top of the soil. The mesh bottom and coupling top
were firmly fitted together to ensure there was no gap. Electric tape was wrapped
around the connection between the mesh and coupling to secure the core. The thread of
the coupling was wrapped in plumber’s tape to reduce the chance of leakage from the
lid. Finally, a neoprene gasket was placed inside the lid and the lid was connected to the
coupling and tightened so as to be water tight. The apparatus used to construct the core
as explained above is shown in Figure 3.4.
Figure 3.2: Soil Core Compaction depth measurement
for 98% MDD
Figure 3.3: Quick release compaction cylinder and
standard hammer used in soil compaction process

33
Figure 3.4: Soil Core Construction: A) soil core, B) 90 mm mesh filter socket, C) 90mm coupling, D) 3 mm
thick neoprene gasket, E) screw-on end cap, F) 19mm nozzle, G) o-ring, H) brass nut
3.5 Experiment Assembly
After preparation of the solutions and soils was complete, construction of the piping and
valve system was undertaken. The drums containing the various treatment solutions
were placed on elevated pallet racks approximately 1.32 m above the base of the core.
The soils cores, in Buchner funnels and supported by leaching racks, were placed on a
stainless-steel bench below the treatment solutions (Figure 3.5). To allow solutions to
permeate the soil, and for the hydraulic conductivity to be measured using a falling
pressure head a pipe system was designed.
A 35 cm section of clear 13 mm diameter polyvinyl tubing was connected to the tap on
each drum using a steel clamp. This was then merged to 19 mm irrigation pipe with a
13 mm to 19 mm pipe adapter. All pipe joins were heated using a heat gun to ensure
water tight connections were made between barbed adaptors/joiners and the pipe. This
section of 19 mm irrigation pipe was cut to 65 cm lengths. A 19 mm plastic barbed
valve, which allowed for easy control of the flow from ground level, was then attached.
Finally another section of 19 mm pipe, of appropriate length, was run from the valve to
the soil core intake where it was firmly connected (Figure 3.5).
34
Before the experiment was commenced the top of each soil core was filled with Calcium
Chloride with an EC of 5.6 dS/m. This allowed for the soil to become saturated and to
remove any air from the system, while having little or no effect on the soils aggregate
structure. When the taps were turned on it was observed that some air was still trapped
within the pipes. The pipes were bled to remove the air and a connection with the
solution in the drums was restored. The lid of the drums were loosened to allow for
atmospheric pressure to act upon the system, but still left on to prevent any evaporation
losses and subsequent potential for solution concentration.
The soil cores and the plastic containers used to catch any discharge were suitably
labelled to ensure the correct results were obtained. The layout of the drums upon the
pallets was randomized to ensure the data collected was completely unbiased regarding
location. Finally the system was checked for leaks; if any leaks were found silicone
sealant gel was applied and the source of the leak taped.
Figure 3.5: Fully constructed apparatus for measuring HC via falling pressure head

35
3.6 Hydraulic Conductivity Measurements
3.6.1 Falling head technique using 1.32 m of hydraulic head
The system was turned on at the beginning of each day and turned off in the late
afternoon for the first ten days of operation, with time in operation meticulously
recorded. After this ten day period the Calcium Chloride permeate was switched off as
ample solution volume had passed through the soil (up to 10 L). From this point the
remaining treatment solution measurements were taken weekly with the apparatus
constantly flowing, due to the extremely slow infiltration rate. The discharge collected
in the plastic containers below the soil core was measured and recorded at the end of
each measurement period. The initial height of the solution in the drums and the height
at the end of each measurement period were also recorded in order to calculate the
hydraulic conductivity using Darcy’s Law adapted for a falling pressure head (Equation
1). The time the system operated between each measurement cycle was also recorded.
(1)
Where a is the internal cross sectional surface area of the pipette, L is the core length, A
is the cross sectional area of the soil core, t is the time over which the change in head
was measured, and h1/h2 is the height differential between the initial head (h1) and the
final head height (h2).
3.6.2 Falling head technique using pipettes
After approximately three months of treatment solution percolation through the soil
cores, the final HC rate was measured using in a highly precise manner. The pipe and
drum system was disconnected and replaced with pipettes secured in place by watertight
rubber grommets. The temperature of the room was controlled at 20˚C as to control
changes in water temperature that would affect solution viscosity and density. Pipettes
were then filled to the maximum mark with the respective treatment solution and placed
into the soil core reservoir that was filled with the same respective treatment solution
(Figure 3.6). This formed the falling pressure head. HC was then calculated using
Equation 1.
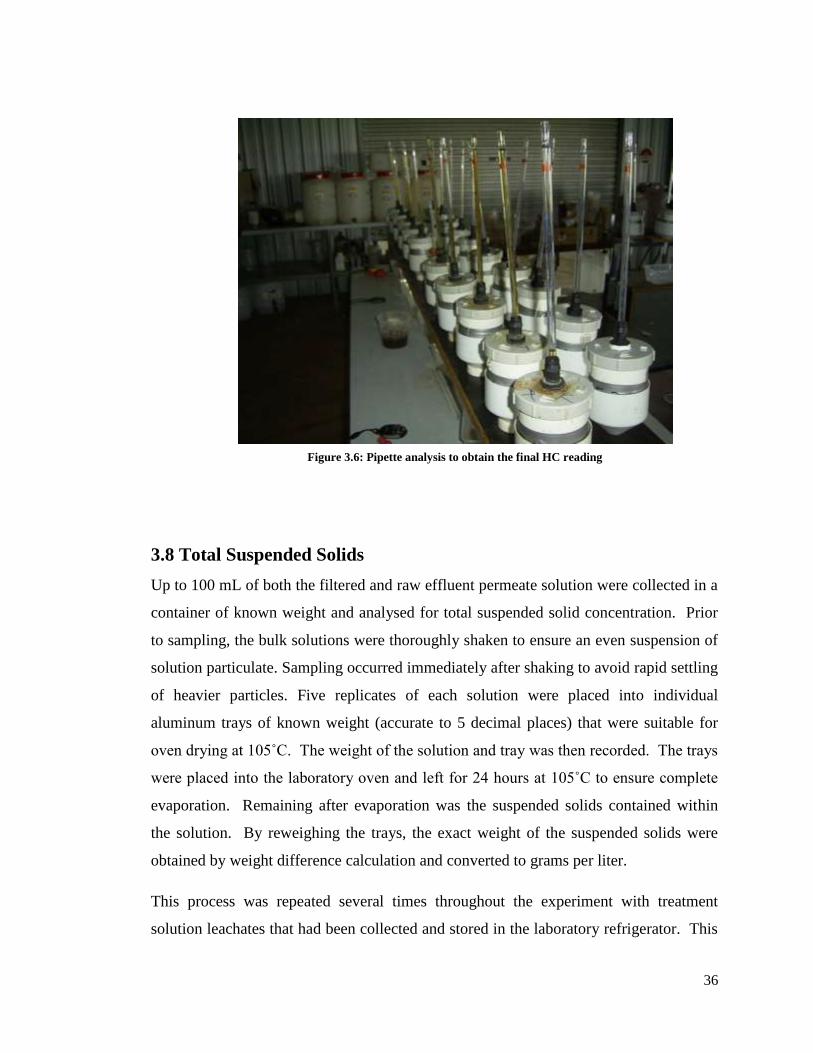
36
3.8 Total Suspended Solids
Up to 100 mL of both the filtered and raw effluent permeate solution were collected in a
container of known weight and analysed for total suspended solid concentration. Prior
to sampling, the bulk solutions were thoroughly shaken to ensure an even suspension of
solution particulate. Sampling occurred immediately after shaking to avoid rapid settling
of heavier particles. Five replicates of each solution were placed into individual
aluminum trays of known weight (accurate to 5 decimal places) that were suitable for
oven drying at 105˚C. The weight of the solution and tray was then recorded. The trays
were placed into the laboratory oven and left for 24 hours at 105˚C to ensure complete
evaporation. Remaining after evaporation was the suspended solids contained within
the solution. By reweighing the trays, the exact weight of the suspended solids were
obtained by weight difference calculation and converted to grams per liter.
This process was repeated several times throughout the experiment with treatment
solution leachates that had been collected and stored in the laboratory refrigerator. This
Figure 3.6: Pipette analysis to obtain the final HC reading

37
data was used to determine the extent to which soils were acting as filters for the
suspended particulates contained in the effluent.
3.9 Statistical Analysis
To thoroughly analyse the accuracy of hydraulic conductivity and total suspended solids
data collected in the experiment a statistical analysis was performed. The Minitab 14
Student Version software package was used to conduct one-way analysis of variance
(ANOVA). Where significant differences were found, Tukey’s multiple comparison
tests (honest significant difference, HSD) were used to investigate differences between
mean pairs. The HSD value was then applied as an error bar for each graph. A 95%
confidence interval was used in the case of both ANOVA and Tukey analysis.
38
Chapter 4 RESULTS
4.1 Hydraulic Conductivity
4.1.1 Calcium Chloride
As explained in the introductory chapter the main objective of this research project is to
discover if organic particulate contained in feedlot effluent contributes to pore blockage
and a reduction of hydraulic conductivity below 1x10^-9 m/s. To achieve this, the HC of
two soils leached with four solutions over an extended period of time was examined.
Figure 1 shows the hydraulic conductivity of the two soils when leached with calcium
chloride solution of EC 5.6 dS/m. As expected the clay loam ‘E’ soil had a faster
infiltration rate; the clay loam has a lower amount of clay particles (<0.002 mm) and a
higher amount of silt (0.002-0.02 mm) and sand (>0.02 mm), which results in a coarser
aggregate structure.
Figure 4.1 shows a gradual increase in the HC of the clay loam soil during the 50 hour
leaching period, while the heavy clay reaches a maximum around 50 hours before
decreasing back towards the initial HC. The HSD bars show there is a significant
increase between the initial and final HC of the clay loam. The change in heavy clay
HC reached a significant stage from about 35 to 60 hours, however considering the
reduction in HC after the 60 hour mark, the difference between the initial and final HC
at 75 hours is stable and not significant.
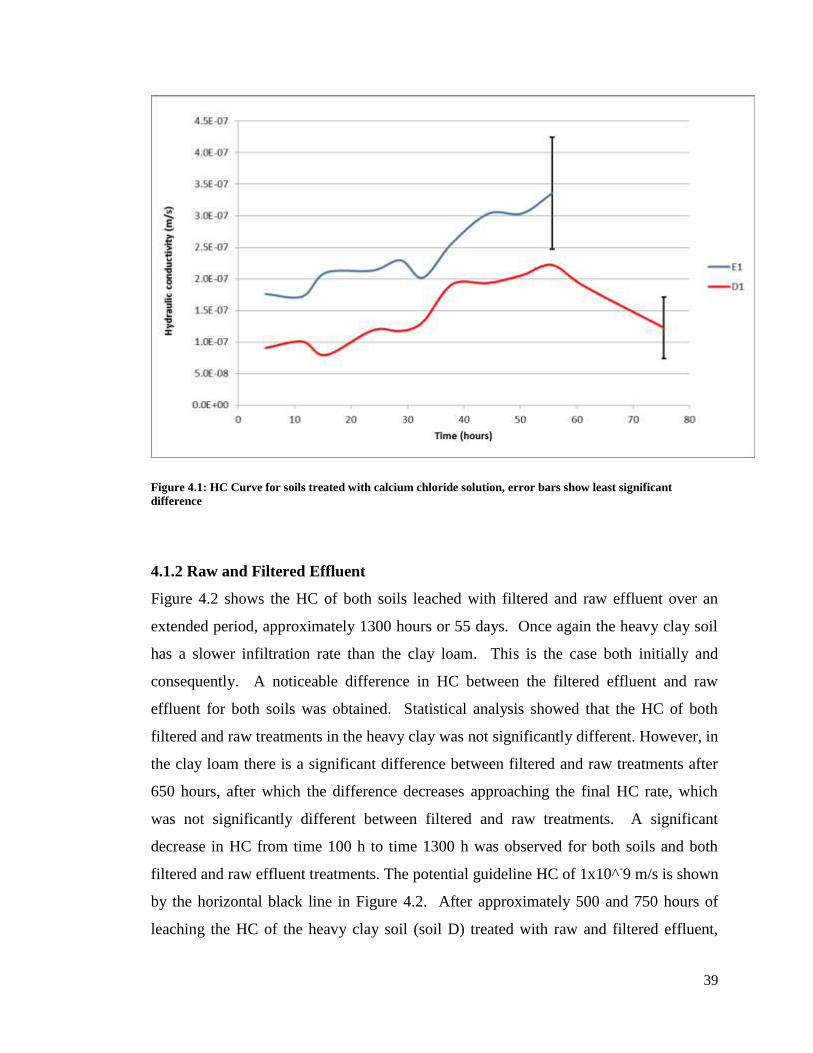
39
Figure 4.1: HC Curve for soils treated with calcium chloride solution, error bars show least significant
difference
4.1.2 Raw and Filtered Effluent
Figure 4.2 shows the HC of both soils leached with filtered and raw effluent over an
extended period, approximately 1300 hours or 55 days. Once again the heavy clay soil
has a slower infiltration rate than the clay loam. This is the case both initially and
consequently. A noticeable difference in HC between the filtered effluent and raw
effluent for both soils was obtained. Statistical analysis showed that the HC of both
filtered and raw treatments in the heavy clay was not significantly different. However, in
the clay loam there is a significant difference between filtered and raw treatments after
650 hours, after which the difference decreases approaching the final HC rate, which
was not significantly different between filtered and raw treatments. A significant
decrease in HC from time 100 h to time 1300 h was observed for both soils and both
filtered and raw effluent treatments. The potential guideline HC of 1x10^-9 m/s is shown
by the horizontal black line in Figure 4.2. After approximately 500 and 750 hours of
leaching the HC of the heavy clay soil (soil D) treated with raw and filtered effluent,

40
respectively, was below this rate. The clay loam soil (soil E) has not met the guideline
hydraulic conductivity on average for the raw and filtered treatments. However, final
variation for the filtered treatment suggests that the guideline has been statistically met
and the trend of both raw and filtered treatment HCs to be steadily declining suggests
the target HC will likely be achieved.
Figure 4.2: HC Curve for soils treated with filtered (3) and raw (4) feedlot effluent, error bars show least
significant difference statistical results, the black line represents proposed infiltration rate
HSD Soil E
HSD Soil D

41
Figure 4.3: Final HC of soils leached with filtered and raw effluent solutions, error bars show least significant
difference between treatments for each soil, clay loam (soil E) and heavy clay (soil D)
Figure 4.3 shows the final HC of both soils after approximately 1300 hours or 55 days
of leaching with filtered effluent and raw effluent. As expected the infiltration rate of
the heavy clay soil (soil D) is significantly lower than the clay loam (soil E). For both
soils, the difference in final HC between soils treated with filtered and raw effluents is
not significant.
4.1.3 Synthetic Effluent Comparison
Figure 4.4 and 4.5 compares soil HC when treated with synthetic effluent, filtered
effluent and raw effluent solutions for the first 50 h. The HC of the treatments applied
to the clay loam are shown in Figure 4.4 while the heavy clay results are displayed in
Figure 4.5. The synthetic effluent treatments were applied for 50 hours so it was only
possible to compare throughout this time-period. In the clay loam (Soil E), Figure 4.4,
the synthetic effluent HC has increased from 1.7x10⁻⁷
to 3.4x10⁻⁷
m/s. After 45 h, soils

42
leached with synthetic effluent have a significantly higher HC than those leached with
filtered or raw effluent. For the heavy clay soil (D), Figure 4.5, similarities in HC
between the synthetic, filtered, and raw effluent can be observed after 50 h. In the
heavy clay the difference between the solutions HC was analysed statistically analysed
at 50 hours. The raw and filtered effluent is similar to the synthetic effluent at 25hours;
however at 50 hours the HSD bars shows these same treatments to have significantly
lower HC as compared to the synthetic solution.
Figure 4.4: HC Curve for Clay Loam (E) treated with synthetic (2), filtered (3) and raw (4) effluent solutions
over initial 50 hours, error bars show least significant difference with respect to the synthetic treatment

43
Figure 4.5: HC Curve for Heavy Clay (D) treated with synthetic (2), filtered (3) and raw (4) effluent solutions
over initial 50 hours, error bars show least significant difference with respect to the synthetic treatment
4.1.4 Pore Volumes
Table 4.1: Hydraulic conductivity and pore volumes of solution leachate after 50 hours and 1300 hours of
application
Sample
50 Hours Application 1300 Hours Application
HC (m/s) PV HC (m/s) PV
E2 3.53E-07 75 - -
E3 2.17E-08 12 2.66E-09 36
E4 3.58E-08 10 1.52E-09 28
D2 4.72E-08 11 - -
D3 1.24E-08 2 1.03E-09 9
D4 6.99E-09 2 9.39E-10 7
44
Table 4.1 shows that after 50 hours of treatment application, there is a significant
difference for both soils with respect to synthetic effluent compared to either filtered or
raw effluent. In both soils at least five times the pore volume (PV) of synthetic solution,
passed through the core compared to the actual effluent solutions. This result highlights
that synthetic effluent is not an accurate representation of a soil’s HC behaviour under
real effluent application. After 1300 hours of treatment a greater difference between the
HC and PV of filtered and actual effluent has prevailed, this is especially the case for the
clay loam, where there is eight PV’s difference, this equates to approximately 1 L of
discharge. The pore volume achieved after 50 hours compared to 1300 hours also
demonstrates how the infiltration rate has reduced over time. Pore volumes leached at a
faster rate during the initial stages compared to the later stages, for example in the raw
treatment for heavy clay pore volumes passed through at 1 per 25 hours initially
compared to 1 per 185 hours towards the end. Furthermore, by 1300 h of experimental
run-time the raw/filtered effluent treatments have leached less PVs than the synthetic
treatment leached in 50 h, for both soils. The HC after 1300h was also 1–2 orders of
magnitude less than that of the synthetic treatment post 50 h for raw/filtered effluent
treatments.
4.1.5 Final Hydraulic Conductivity
As displayed in Figure 4.6, the final experimental HC of the heavy clay soil was
significantly slower than the clay loam, which was expected given the difference in clay
content. It is apparent that the final HC rate of the synthetic effluent is significantly
slower than the calcium chloride for the heavy clay (soil D). In the clay loam (soil E)
the final HC of after leaching with synthetic effluent was slightly higher than the
calcium chloride, but not statistically significant.

45
Figure 4.6: Final HC for soils leached with Calcium Chloride (1) and Synthetic effluent (2) solutions, HSD
error bars included
Table 4.2: Initial and final hydraulic conductivity (m/s) and infiltration rate (mm/year) for all samples
Hydraulic Conductivity (m/s) Infiltration Rate (mm/year)
Sample Initial Final Initial Final
D1 9.07E-08 1.23E-07 2859.2 3867.6
D2 6.92E-08 3.46E-08 2181.4 1090.9
D3 2.15E-08 1.03E-09 678.9 32.4
D4 2.14E-08 9.39E-10 674.7 29.6
E1 1.76E-07 3.36E-07 5552.0 10590.0
E2 1.59E-07 4.20E-07 5026.1 13232.3
E3 1.04E-07 2.66E-09 3268.0 83.8
E4 1.04E-07 1.52E-09 3293.7 47.8

46
Table 4.2 shows the initial and final hydraulic conductivity and infiltration rate (IR) for
all samples. As the results show the soils leached with effluent experience a large
reduction in HC and IR over 1350 hours. Both soils leached with CaCl2 experienced a
small increase in HC over the time period. The synthetic solution caused an increase of
HC by approximately 2.5 times in the clay loam while a reduction of about 50% was
measured in the heavy clay. This was after approximately 55 hours of experiment run-
time.
4.2 Total Suspended Solids
The total suspended solids (TSS) results are shown in Figure 4.7. Time zero represents
the permeating solution while the following time steps represent the reduction in TSS of
the leachate at that particular time. Significantly higher TSS concentration was
contained in the percolating solutions (t=0) compared to the leachate solutions, ranging
from 0.4 to 1.0 g/L. Regarding the percolating solutions, the filtered effluent contains
approximately 0.25 g/L less suspended solids than the raw effluent. Analysing the
leachate solutions it can be seen that in both soil types the filtered leachate samples
contain less TSS. The leachate or discharge from the heavy clay soil on average
contains less TSS compared to the clay loam.
There is no distinguishable relationship or trend regarding the concentration of TSS
contained in the leachate as the experiment progresses. Figure 4.7 shows that the
filtered effluent leachate contains less TSS than raw effluent. Soil D, the heavy clay,
traps a higher amount of TSS within its structure which results in a lower amount of
TSS compared to the clay loam. The error bars on the column graph show the least
significant difference of each sample’s results compared to the initial permeate results.
There is a significant difference between the percolate and leachate for the filtered
treatment of both the clay loam and heavy clay.

47
Figure 4.7: Total Suspended Solids TSS (g/L) measured at different time periods throughout the experiment,
time zero shows permeate TSS while time 5-310 shows leachate TSS, HSD bars represent difference of each
treatment compared to time zero
Figure 4.8: Colour difference between permeate (darker) and leachate solutions (lighter)

48
Figure 4.8 shows the permeate and leachate solutions side-by-side. The leachate
solutions shown here are taken after 61 hours of application. The difference in colour
between the permeate and leachate solutions is quite obvious indicating filtration of
suspended solids (Table 4.3). The TSS values in Table 4.3 are taken from an overall
average of each of the five time-step results.
Table 4.3: Average TSS (g/L) contained in each sample (E) clay loam and (D) heavy clay, values in parenthesis
are standard errors
Sample Average TSS (g/L)
Filtered 3.304 (0.432)
Raw 3.532 (0.432)
E3 2.607 (0.472)
E4 2.783 (0.284)
D3 2.257 (0.479)
D4 2.498 (0.096)

49
Chapter 5 DISCUSSION
The two soils, a heavy clay and clay loam, were selected for analysis as their differing
structural and chemical properties allowed for a comparison with respect to particle size
and hydraulic conductivity. The soils were compacted to 98% MDD, which due to a
high bulk density reduces pore volume and the soils infiltration potential, thus allowing
the lowest physically manipulated HC rate to be achieved (Lipiec & Hatano 2003). The
initial chemical properties of the soils are shown in Table 3.3.
Physical differences between the soils are due to variances in particle size distribution.
The heavy clay contains a higher percentage of clay particles which reduce porosity
throughout the structure, as they have a small surface area. The clay loam contains
more silt and sand particles and has a less dense structure which results in a higher
porosity. This meant that a greater weight of clay loam was needed to reach the same
compaction level as the heavy clay; however less water was required to achieve
optimum moisture (OM), the clay loam also has a lower OM %. Analysing the
chemical differences it is apparent the heavy clay has a greater EC, exchangeable
sodium percentage, and a greater cation exchange capacity. Due to these higher values,
in particular the ECEC, the heavy clay is less susceptible to sodic solutions, as compared
to the clay loam. Considering both chemical and physical soil properties; there are
significant differences between the two soils which comparison good comparative
analysis of solutions effects.
5.1 Soil Hydraulic Conductivity after CaCl2 application
Calcium Chloride Solution with an Electrical Conductivity of 5.6 dS/m was applied to
heavy clay and clay loam soils compacted to 98% maximum dry density. The results
displayed in Figure 4.1 showed a gradual increase in HC throughout the application
period for the clay loam while the HC of heavy clay increased before decreasing
towards the initial rate after 50 hours. There was a significant increase in HC for the
clay loam from the initial to final stage. The heavy clay was significantly different at
points where fluctuations were high, however when the difference in initial and final
50
infiltration was analysed the change was not statistically significant. Due to the high
concentration of Ca2+
ions present in this solution the diffuse double layer could have
been reduced in size through an osmotic effect for the clay loam. Due to soils desire to
maintain equilibrium between the colloidal surface and soil solution the excess calcium
ions in solution may have permeated through the diffuse double layer; this is known as
the osmotic effect. Osmosis ensures the positive attraction forces prevail and the diffuse
double layer remains compressed preserving structural stability (Sparks 2003). This
would result in an increase in soil porosity which explains the slight increase in HC.
The soil Ca:Mg ratio would also have been increased; this is due to the smaller hydrated
radius of calcium ions compared to magnesium, as a result the diffused double layer is
further reduced (Sposito 1989). The CaCl2 discharge also maintained a clear
appearance, devoid of any soil sediments, which is also reflection of the soil aggregates
remaining stable.
The chemical effects of CaCl2 application explained above provide theoretical reasoning
to the gradual increase in HC. The results also show several fluctuations in the HC
curve which reflect certain errors within the experiment. The statistical analysis showed
the CaCl2 treatments had the highest standard errors over each day of measurements. As
this solution generally had the fastest infiltration rate of all treatments, a greater range of
results from each replicate was expected. It is plausible that fast, or increased, flow was
responsible for gradual erosion of pores through turbulent flow (Hillel 2004), although
the absence of suspended solids in the leachate suggests this to be unlikely. Hence, the
increase in hydraulic conductivity is most likely to be a ramification of chemistry
alteration. The large cross sectional area of the drums and the fact laboratory
temperature wasn’t controlled could have potentially contributed to measurement errors.
In summary, there is theoretical basis for the gradual increase in HC experienced in the
project results; however it was expected the HC would remain at a more stable level.
When leached with calcium chloride the HC of both soils is theoretically expected to
maintain a stable rate. This is due to the Ca2+
ions decreasing the size of the diffuse
double layer, which restricts swelling and/or dispersion. Upon further analysis the high
standard deviation of the results raise concern that data errors may have influenced this
particular result. While the CaCl2 is considered appropriate for determining stable soil

51
hydraulic conductivity, it can be concluded it is not representative of effluent treatment
effects and should not be used as a substitute permeate in laboratories that cannot
receive raw effluent solutions.
5.2 Chemical effects of Synthetic Effluent
Synthetic Effluent containing identical chemical properties to the actual effluent was
applied to both soils. In doing this, the difference between the synthetic and raw/filtered
effluent samples is that the raw/filtered effluent contains suspended solids. This allows
the chemical effect of the effluent solutions to be analysed for its role in HC reduction.
Synthetic effluent was also assessed for its applicability in estimating the soil HC that
would be achieved through application of actual effluent solution. The importance of
this is that many laboratories are not certified to receive and handle effluent in its raw
state. If the chemical properties were entirely responsible for reducing HC, then
theoretically the HC of the synthetic and raw/filtered effluent would be statistically
similar. However, results showed this was not necessarily the case. Comparing the two
soils, there is a major variation in the behaviour of the synthetic treatment HC curves.
This is likely caused by the soils initial chemical properties detailed in Table 3.3, which
results in different mechanisms controlling hydraulic properties when the treatment is
applied. Due to the different reactions of each soil the effects will be discussed
separately. It should also be noted that the synthetic treatment was abandoned after 50 h
of infiltration, as adequate pore volumes of synthetic solution had passed through in this
time to obtain a satisfactory appreciation of the hydraulic conductivity.
The clay loam experienced a significant increase in the HC over the leaching period
compared to actual effluent solutions as Figure 4.4 shows. A far greater number of pore
volumes of this treatment also passed through compared to other treatments as displayed
in Table 4.1 This result was not surprising given past research that has showed sodic
solutions, such as the effluent solution; reduce soil permeability (Rengasamy and Olsson
1993; Shainberg & Levy 2005; Vance et al. 2008; Ezlit 2010). The increase in HC
experienced is likely a result of the initial soil chemical properties. The clay loam has a

52
low initial ESP (1.7%) and the SAR (5.7) of the synthetic treatment is considered to be
suitable for irrigation in Australia (ANZECC 2000). Although there would be a slight
contribution to the soils sodicity levels, the EC of the permeate was likely sufficient to
provide an osmotic effect that improved soil structure, given the low ESP. In this case,
the EC is the driving mechanism for the synthetic solutions effect on the clay loam’s
HC. Sparling et al. (1983) found that if a percolating solution of greater EC than the
soil solution is applied the ions within the existing soil solution are pulled through the
colloidal surface to maintain structural equilibrium. This reduces swelling of the diffuse
double layer and therefore maintains or improves soil permeability. That is to say, it is
likely that the soil TEC is satisfied. While this theory provides a possible explanation to
the increase in HC, the actual effluent with the same chemical properties caused a
substantial reduction in HC over the same period. This suggests the physical effect of
pore blockage due to suspended solids was the dominant factor causing a reduction in
HC for the clay loam.
Regarding the heavy clay, soil HC over the initial 30 hours is not significantly different
to the filtered effluent it should still be noted that the HC of synthetic effluent dropped
significantly throughout the leaching period as displayed in Figure 4.5. This is likely
due to various chemical effects; firstly the Na+ ions have contained in the synthetic
treatment have contributed to the soils already sodic ESP and increased the size of the
diffuse double layer due to weaker attraction forces (Shainberg & Levy 2005).
Secondly, the heavy clay has a high ESP of 6.7%, meaning that when even small
increases in soil exchangeable sodium are likely going to exacerbate the sodicity effect.
Given the relative similarity of the synthetic and effluent treatments HC, it is likely that
the threshold electrolyte concentration (TEC) is not satisfied by the solution EC
(Sumner 1993); this causes clay particle dispersion that contributes to pore blockages.
However, when both soils are considered in terms of the treatment PVs to have leached
through the soil cores, it can be seen in Table 4.1 that the synthetic treatment has
infiltrated greater than 7 times that of the effluent solutions. Additionally, after 1300 h,
the effluent solutions still have not infiltrated an equivalent number of PVs to the
synthetic treatment and have reduced in HC by 1–2 orders of magnitude. Hence,
53
synthetically produced solutions to match raw effluent chemical properties are not a
suitable replacement for actual effluent, when measuring soil HC changes.
5.3 Effluent Particle Size
Suspended solids in the effluent of greater than 3 µm particle size were removed by
filtration in the filtered effluent treatment.
The raw effluent contained 3.53 g/L of suspended solids while the filtered effluent
contained 3.30 g/L. While this was a noticeable difference, initial expectations were for
a larger difference in TSS between the solutions. Hence, the overwhelming majority
(93%) of TSS within raw effluent were less than 3 µm diameter.
Ultra filtration of solutions is an expensive proposition and given the time and budget
constraints of this project more technologically advanced filtration devices were not
accessible or practical. Recommendations for future work involving the filtration of
effluent include using pipettes sealed with meniscus liners to ensure even minuscule
particles are captured. This method was quickly explored but ultimately was decided
against due to cost and time issues. Using sand and soil filters is another method often
used in water treatment facilities; once again the time it would take to produce the
required 100 Litres of solution while maintaining a reasonable budget wasn’t
practicable. However, it would be advantageous to understand the particle size
proportions of effluent and their subsequent effects on pore blockage.
5.4 Total Suspended Solids Analysis
A total suspended analysis was also carried out on the leachate solution so a comparison
between the discharge and percolating solution was possible. There is a difference
ranging from 0.4–1.0 g/L TSS between the permeate and leachate depending on the
treatment and soil. It is likely that some soil sediments are contributing to the TSS in
the leachate due to the soil having undergone dispersion, which means the difference in
permeate and leachate TSS is likely greater than the results demonstrate. In reducing
54
the TSS content in the leachate the soil column has acted as a filtration device by
removing sediments from the solution. It was observed that the colour of the leachate
was significantly lighter (clearer) than the permeate, which further supports that the soil
has filtered out solids. It is highly likely the solid matter has been trapped within the
soil pores forming a physical barrier.
The results also showed the TSS in the leachate differed between each soil. The heavy
clay was a more effective filter, presumably due to a finer texture and initial pore
structure and the ESP of the soil. The clay loam on the other hand has a coarse texture
and therefore a coarser initial pore structure, meaning that more suspended solids are
required to block preferential flow paths. This soil was also initially non-sodic and thus
had a higher initial conductivity than the heavy clay, again meaning that preferential
flows paths were less likely to be blocked.
The TSS results also showed the concentrations of solids in the leachate compared to the
permeate, measured over five separate time-steps throughout the period. There was no
trend of either increasing or decrease TSS over the experiment run-time, except for the
reduction in TSS between permeate and leachate. It was hypothesised that continued
accumulation of suspended solids in the pore network would occur and that leachate
TSS would continue reduce over time. It is possible that this effect may have been
negated by continued dispersion and break-down of the soils structure due to the sodic
nature of the solution; which infers soil sediments may have broken away from the
bottom of the core and thus contributed to TSS content in the discharge. Even still, TSS
analysis shows there is a significant decrease of TSS between the permeate and leachate
which indicates solid matter is accumulating within the soil. This result provides
confirmation to the observations noted by Bennett et al. (2011), who also saw a
significant colour difference between the effluent leachate and permeate and assumed
this was due to organic matter accumulation.

55
5.5 Contribution of Organic Particulate to a reduction in HC
To achieve the main project objective of discovering if organic particulate in feedlot
effluent contributes to pore blockage in soils compacted to 98% MDD, the HC results of
raw and filtered effluent were analysed. The raw effluent, containing the full amount of
organic particulate, caused greater pore blockage than the filtered effluent, although
these differences were not significant after 1300 h for the heavy clay. The TSS test
showed that a portion of the solids are accumulating in the soil and the HC results
further support this notion. The hypothesis that feedlot effluent inherent organic
particulate contributes to a reduction in HC in compacted clay liners due to pore
blockage, has been confirmed by both TSS and HC results. Furthermore, the synthetic
effluent results clearly suggest that in the long term pore blockage occurs physically due
to TSS rather than chemically due to solution chemistry. Hence, pore blockage is the
major mechanism by which soil HC is lowered.
The final HC for both soils is lower when the raw effluent treatment was applied,
significantly so in the clay loam. In the heavy clay, the difference in HC after 1300
hours of leaching with raw and filtered effluent is less at 8.97x10⁻¹¹
m/s compared to the
clay loam at 1.14x10⁻⁹
m/s. Analysing in terms of infiltration rate of mm/year the raw
effluent of the heavy clay reached 29.6 mm/year while the filtered effluent reached 32.9
mm/year. In the clay loam the raw effluent reached 47.8 mm/year while the filtered
samples reached 83.8 mm/year. However the HC curve still shows a noticeable
difference between the two rates for both soils throughout the leaching time. The
smaller variance is likely due to the fine sediments present in the filtered solution still
accumulating in the tight pore network of the heavy clay. This would still have occurred
in the clay loam but the mineralogy of the soil makes the results less noticeable over this
time period of leaching. These assumptions are in line with Awedat et al. (2012) who
found that even low amounts of suspended clay concentrations still contributed to pore
blockage especially if the soil had a high bulk density.
The results achieved in this project support the findings by various past researchers who
applied treated waste-water, similar properties to effluent, to agricultural soils. Vinten
et al. (1983) found suspended solids contained in wastewater were blocking soil pores in

56
the upper soil horizon and reducing infiltration characteristics. Viviani et al. (2004) and
Abedi-Koupai et al. (2006) also saw a reduction in HC after applying sodic wastewater
to soils, and contributed this to retention of organic matter and changes in pore size
distribution from clay particle dispersion. Halliwell et al. (2001) found that continuous
application of suspended solids to soil caused the formations of restrictive layers near
the soil surface. It is likely that the majority of the suspended solids are trapped at, or
near the surface of the core which results in surface sealing. This was observed when
the cores when taken apart at the end of the leaching period. Cores where effluent had
been applied had a thick coating of organic matter which formed a crust on the soil
surface; there was no obvious change in appearance at the base of the core. It was
observed in cores leached with synthetic effluent or CaCl2 that there were no signs of
surface sealing, thus it can be assumed this was caused by the organic particulate
contained in the effluent. From these observations it’s likely the organic matter has
been trapped in the upper layer of the core; this hypothesis will be tested in the future
using a total carbon analysing machine; due to operating difficulties and time constraints
it was unable to be completed at this time.
The project has quantified the effect of organic matter build-up upon soil HC, which is a
significant finding for the beef feedlot industry. The results show that physical pore
blockage and, potentially, surface sealing due to organic matter accumulation
significantly restricts the infiltration potential of soils. Further project work will involve
the analysis of soil organic carbon content, which will enable the location of organic
matter accumulation within the soil to be investigated.
5.6 Implications for Beef Feedlot Industry
The suggested infiltration rate guideline of 1.0x10^-9
m/s or 31.5 mm/year was achieved
in the 98% MDD compacted heavy clay after approximately 500 hours of raw effluent
application as displayed. The filtered effluent treated heavy clay reached this level after
750 hours and remained close to this level for the remainder of the experiment. These
results firstly show that the proposed guideline is possible to be met in heavily

57
compacted clay liners. This is a positive result for the feedlot industry as the current
alternative is construction of rubber lined ponds, which are very expensive. Secondly,
the ability for the guideline to be achieved is also dependent upon the soil type; the clay
loam, containing a higher infiltration potential, did not meet the guideline after 1300 h.
However, the HC results curve show that the clay loam’s HC was still decreasing after
1300 hours of leaching which suggests that this soil may still reach the stipulated
guideline. Further testing on a wider range of soils with differing chemical and physical
properties is recommended to obtain a wider understanding of the impacts feedlot-
effluent TSS has upon soil HC. It should also be noted that feedlot effluent chemical
and physical properties will differ between feedlots which means that feedlot effluent
TSS sand chemical properties should be survey and investigated for their potential to
reduce HC.
Importantly, the potential to save the Australian Feedlot Industry large sums of money
and reduce environmental degradation has been identified.
58
Chapter 6 CONCLUSIONS
6.1 Conclusions of Results
This research project was conducted to investigate the effect of organic particulate
contained in beef feedlot effluent upon soil hydraulic conductivity. The major project
aim was to investigate if effluent inherent organic particulate is capable of reducing soil
hydraulic conductivity to the proposed rate of 1.0X10^-9
m/s or 31.5 mm/year. This
infiltration rate guideline has been proposed by feedlot regulating authorities to restrict
the contamination of surrounding land and the water table caused by seepage of effluent.
It was shown that the raw effluent treatment produced the slowest HC in both soils when
compared to filtered effluent that only contained suspended solids greater than 3 µm. It
was concluded from these results that the organic particulate contained in feedlot
effluent accumulates within the soils structure and contributes to pore blockage. The
stated guideline was achieved in the heavy clay soil but not in the clay loam, and both
soils treated with raw/filtered achieved HC 1–2 orders of magnitude lower than a
synthetic solution with matched chemical properties to raw effluent with less PV of
effluent required to realise this effect. From this result it can be concluded that the
infiltration rate guideline of 1.0X10^-9
m/s is achievable primarily due to the physical
mechanism of pore blockage. It is recommended that further studies test the HC of a
wider range of soil types with effluent and a wider range of effluent sources
Synthetic effluent, with identical chemical properties to feedlot effluent, was shown to
be unsuitable as a substitute for raw/filtered effluent in terms of HC reduction potential.
The heavy clay experienced a gradual reduction in HC which was expected given the
sodic nature of the solution causing clay particle dispersion. The HC was still faster
than the filtered effluent solution but this may be due to remnant suspended solids
remaining after the filtration process. When the pore volumes were analysed it was
found that several times the amount of synthetic effluent had infiltrated the soil
compared to actual effluent within 50 h and that after 1300 h raw/filtered effluent still
had not leached equivalent PV as compared to synthetic effluent. From this result it
could be concluded that the major reason causing a reduction in soil HC was the organic

59
matter accumulation. In the clay loam the HC increased when treated with synthetic
effluent, this result highlights the importance of initial soil chemical properties. As the
clay loam had a much lower ESP and EC values than the heavy clay the osmotic effect
reduced the soil diffuse double layer when a solution with much higher EC was applied.
The final project objective was to analyse the effect of effluent inherent particulate
particle size on soil pore blockage. A comprehensive total suspended solid analyse of
both percolating and leachate solutions was conducted. It was found that the filtered
permeate contained 0.25 g/L less TSS than the raw permeate. The majority of effluent
contained particulate matter was identified as less than 3 µm. The filtered effluent
caused less of a reduction in soil HC in both soils, and this was much more apparent in
the clay loam. However, it is concluded that particulate matter less than 3 µm is
primarily responsible for pore blockage. The mineralogy and bulk density of the soil is
also a factor with the more porous clay loam trapping fewer amounts of the small
suspended solids. The TSS analysis did show that the soil core acts as a filter by
reducing the number of suspended solids in solution by between 0.4 and 1.0 g/L. This
result provides proof that suspended solids are becoming entrained within the soil pores
and causing a significant reduction in soil HC.
This project has successfully investigated the chemical and physical effects that feedlot
effluent has upon the permeability of compacted clay soils. The guideline rate proposed
by authorities has been achieved, or has been projected to be achieved based on HC
trends, which likely negates the need for expensive plastic lined effluent ponds. It is
recommended that the soils selected for pond construction contain properties similar to
the heavy clay, fine textured soil used in this project. There is great potential for future
work regarding sustainable feedlot operations such as effluent capture and control; in
particular further testing on soil HC, for example organic carbon analysis, design of new
filtration methods and testing soil TEC. The ability for the chemical and physical
properties of effluent to seal compacted clay results in significant environmental
benefits for Australian agriculture, in particular the beef cattle feedlot sector. As many
feedlot corporations also manage a farming irrigation system, often to grow grain-feed
for their cattle, ensuring the water table and soil conditions are kept healthy is of great

60
importance. Sustainable farming operation and management is at the forefront of the
Australian agricultural industry, this research project has provided insight into a specific
area of environmental control, conveying beneficial results to the feedlot sector.
6.2 Future Work
As mentioned in the discussion section this report has provided the potential for
compacted clay liners to be effectively used as effluent pond liners even with regards to
the proposed infiltration rate. It is recommended that the effect of multiple feedlot
effluents, with differing chemical and physical properties be tested upon the same two
soils to identify the significance that slight changes in solution will have upon HC.
Experimentation using a wider range of soil types will provide a more comprehensive
picture of soil behaviour under effluent application. Finally it is also highly
recommended that the zones of organic matter accumulation within the soil profile be
identified. This will be achieved in the near future by testing layered samples for total
organic carbon.

61
List of References
Abedi-Koupai, J, Mostafazadeh-Fard, B., Afyuni, M., and Bagheri, M.R. 2006, 'Effect
of treated wastewater on soil chemical and physical properties in an arid region', Plant
Soil and Environment, vol. S2, no. 8, pp. 335-44,
ANZECC. 2000, ‘Australian and New Zealand guidelines for fresh and marine water
quality’, Australian Water Association
Awedat, AM, Bennett, J.McL., Raine, S.R., and Misra, R.K. 2012, 'The impact of rain
water on soil pore networks following irrigation with saline-sodic water', National
Centre for Engineering in Agriculture, The University of Southern Queensland,
Toowoomba,
Awedat, AM, Raine, S.R., Bennett, J.McL., and Misra, R.K. 2012, 'Influence of porosity
and permeate suspended clay concentration on clay entrainment within a Red Ferrosol',
National Centre for Engineering in Agriculture, The University of Southern
Queensland, Toowoomba,
Bean, JA, Southcott, P.H., and Lott, S.C. 1999, 'A comparison of soil permeability to
water and feedlot effluent', 8th Australia New Zealand Conference on Geomechanics,
Ben-Hur, M, Shainberg, I., Bakker, D., and Keren, R. 1985, 'Effect of soil texture and
CaCO3 content on water infiltration in crusted soil as related to water salinity', Irrigation
Science, vol. 6, pp. 282-94,
Bennett, JM, Dalby, T. and Raine, S.R. 2011, Effect of applying feedlot effluent pond
water on the permeability of soils: Final Report, National Center for Engineering in
Agriculture Publication.

62
Bhardwaj, AK, Goldstein, D., Azenkot, A., and Levy, G.J. 2007, 'Irrigation with treated
wastewater under two different irrigation methods: Effects on hydraulic conductivity of
a clay soil', Geoderma, vol. 140, pp. 199-206,
Bodman, GB, and Fireman, M. 1950, 'Changes in soil permeability and exchangeable
cation status during flow of different irrigation waters', Transactions 4th Int. Cong. Soil
Sci., vol. 1, pp. 397-400,
Braunack, MV, and Peatey, T.C. 1999, 'Changes in soil physical properties after one
pass of a sugarcane haulout unit', Australian Journal of Experimental Agriculture, vol.
39, no. 6, pp. 733-42,
Charman, PEV, and Murphy, B.W. 1991, Soils, their properties and management: A soil
conservation handbook for New South Wales, Sydney University Press, Melbourne.
Dikinya, O, Hinz, C and Alymore, G 2006, 'Dispersion and re-deposition of fine
particles and their effects on saturated hydraulic conductivity
', Australian Journal of Soil Research, no. 44, pp. 47-56, CSIRO Publishing,
Ezlit, YD, Smith, R.J., and Raine, S.R. 2012, A Review of Salinity and Sodicity in
Irrigation, Cooperative Research Centre for Irrigation Futures, University of Southern
Queensland, Toowoomba.
Feigin, H, Ravina, I., and Shalhevet, J. 1991, 'Irrigation with treated sewage effluent.
Management for environmental protection', Adv. Ser. Agric. Sci., vol. 17,
Frenkel, H, Goertzen, J.O., and Rhodes, J.D. 1978, 'Effects of clay type and content,
exchangeable sodium percentage and electrolyte concentration on clay dispersion and
soil', Soil Science Society of America, vol. 42, pp. 32-9,
63
Hakansson, I, and Medvedev, V.W. 1995, 'Protection of soils from mechancial
overloading by establishing limits for stresses caused by heavy vehicles', Soil Tillage
Research, vol. 35, pp. 85-97,
Halliwell, DJ, Barlow, K.M., and Nash, D.M. 2001, 'A review of the effects of
wastewater sodium on soil physical properties and their implications for irrigation
systems', Australian Journal of Soil Research, vol. 39, pp. 1259-67,
Hansen, L 2010, Quantifying the reduction in hydraulic conductivity of disturbed soil
columns as a function of the salinity and sodicity of applied water, USQ Project
[Unpublished].
Hayashi, Y, Ken'ichirou, K., and Mizuyama, T. 2006, 'Changes in pore size distribution
and hydraulic properties of forest soil resulting from structural development', Journel of
Hydrology, vol. 331, no. 1-2, pp. 85-102,
Hillel, D 2004, Introduction to Environmental Soil Physics, Elsevier Science, San
Diego, California.
Horn, R, Domzal, H., Slowinska-Jurkiewicz, A., and Van Ouwerkerk, C. 1995, 'Soil
Compaction processes and their effects on the structure of arable soils and the
environment', Soil Tillage Research, vol. 35, pp. 23-36,
Karathanasis, AD, and Hajek, B.F. 1985, 'Shrink-Swell Potential of Montmorillonitic
Soils in Udic Moisture Regimes', Soil Science Society of America, vol. 49, no. 1, pp.
159-66,
Levy, GJ, Rosenthal, A., Shainberg, I., Tarchitzky, J., and Chen, Y. 1999, 'Soil
hydraulic conductivity changer caused by irrigation with reclaimed waste-water',
Journal of Environmental Quality, vol. 28, pp. 1658-64,

64
Levy, GL, Goldstein, D., and Mamedov, A.I. 2005, 'Saturated Hydraulic Conductivity
of Semiarid Soils', Soil Science Society of America, vol. 69, no. 3, pp. 653-62,
Lin, HS, McInnes, K.J., Wilding, L.P., and Hallmark, C.T. 1996, 'Effective porosity and
flow rate with infiltration at low tensions in a well-structured subsoil', Trans. ASAE, vol.
39, pp. 131-3,
Lipiec, J, and Hatano, R. 2003, 'Quantification of compaction effects on soil physical
properties and crop growth', Geoderma, vol. 116, pp. 107-36,
Magesan, GN, Williamson, J.C., Sparling, G.P., Schipper, L.A., and Lloyd Jones, A.
1999, 'Hydraulic conductivity in soils irrigated with wastewaters of differing strengths:
field and laboratory studies', Australian Journal of Soil Research, vol. 37, no. 2, pp.
391-402,
Mamedov, AI, Shainberg, I., and Levy, G.J. 2000, 'Irrigation with Effluent Water:
Effects of Rainfall Energy on Soil Infiltration', Soil Science Society of America, vol. 64,
no. March-April,
Mandal, UK, Bhardwaj, A.K., Warrington, D.N., Goldstein, D., Bar Tal, A., and Levy,
G.J. 2008, 'Changes in soil hydraulic conductivity, runoff, and soil loss due to irrigation
with different types of saline-sodic water', Geoderma, vol. 144, pp. 509-16,
McCurdy, M, and McSweeney, K. 1993, 'The Origin and Identification of Macropores
in an Earthen-Lined Dairy Manure Storage Basin', Soil Science Society of America, vol.
22, no. 1, pp. 148-54,
McNeal, BL, and Coleman, N.T. 1966, 'Effect of Solution Composition on Soil
Hydraulic Conductivity', Soil Science Society of America, vol. 30, no. 3, pp. 308-12,
65
Mohamed, AMO, and Antia, H.E. 1998, Geoenvironmental Engineering, Elservier
Science, Amsterdam.
Northcote, KH, and Skene, J.M.K. 1972, 'Australian soils with saline and sodic
properties', CSIRO Australia Soil Publication, vol. 27,
Paydar, Z, and Ringrose-Voarse, A.J. 2003, 'Prediction of hydraulic conductivity for
some Australian soils', Australian Journal of Soil Research, vol. 41, no. 6, pp. 1077-88,
Quirk, JP, and Schofield, R.K., 1955, 'The effect of electrolyte concentration on soil
permeability', The Journal of Soil Science, vol. 6, no. 2, pp. 163-78,
Rengasamy, P, and Olsson, K.A. 1993, 'Irrigation and Sodicity', Australian Journal of
Soil Research, vol. 31, pp. 821-37,
Sepaskhah, AR, and Karizi, A. 2009, 'Effects of alternate use of wastewater and fresh
water on soil saturated hydraulic conductivity', Archives of Agronomy and Soil Science,
vol. 57, no. 2, pp. 149-58,
Shainberg, I, Gal, M., Ferreira, A.G., and Goldstein, D. 1991, 'Effect of water quality
and amendments on the hydraulic properties and erosion from several Mediterranean
soils', Soil Technology, vol. 4, no. 135-146,
Sparks, DL 2003, Environmental Soil Chemistry, Academic Press, San Diego,
California.
Sposito, G 1989, The Chemistry of Soils, Oxford University Press, New York.
Sumner, ME 1993, 'Sodic Soils: New Perspectives', Australian Journal of Soil
Research, vol. 31, pp. 683-750,

66
Tarchitzky, J, Golobati, Y., Keren, R., and Chen, Y. 1999, 'Waste water effects on
sodium and calcium montmorrillonite suspension and hydraulic properties of sandy soil',
Soil Science Society of America, vol. 63, pp. 554-60,
Tarchouna, LG, Merdy, P., Raynaud, M., Pfeifer, H.R., and Lucas, Y. 2010, 'Effects of
long-term irrigation with treated wastewater. Part 1: Evolution of soil physico-chemical
properties', Applied Geochemistry, vol. 25, pp. 1703-10,
Vance, GF, King, L.A., and Ganjegunte, G.K. 2008, 'Soil and Plant Responses from
Land Application of Saline-Sodic Waters: Implications of Management', Journal of
Environmental Quality, vol. 37, pp. 139-48,
Vinten, AJA, Mingelgrin, U., and Yaron, B. 1983, 'The Effect of Suspended Solids in
Wastewater on Soil Hydraulic Conductivity: 2. Vertical Distribution of Suspended
Solids', Soil Science Society of America, vol. 47, no. 3, pp. 408-12,
Viviani, G, and Iovino, M. 2004, 'Wastewater Reuse Effects on Soil Hydraulic
Conductivity', Journal of Irrigation and Drainage Engineering,

67
Appendix A: Project Specification

68
Appendix B: Experimental Design and Planning
B.1 Initial Design
Figure B1: Preliminary Falling Pressure Head Design
69
B.2 Risk Assessment
Effluent
The first risk identified when specifying this research project was the involvement of raw cattle
feedlot effluent. As the effluent is a core part of the experiment the researcher will be working
in close proximity with this substance on a daily basis. The hazard proposed by the effluent is
the chance of biological infection resulting from the handling of the product. As a waste
product the effluent contains large amount of potentially dangerous bacteria which have the
potential to cause serious illness when someone is heavily exposed. To reduce the chance of
contracting any disease plastic gloves can be worn when handling the effluent. Other means of
managing this risk include wearing a lab coat or face mask. This reduces the chance of coming
in contact with the solution or inhaling any fumes produced from the effluent. Carefully
handling the effluent during the filtration and measurement process as well as wearing the
appropriate protective equipment will significantly reduce the chance of this particular hazard.
Chemical Exposure
Mixing the solutions requires measuring out portions of chemical powders which have various
health dangers. It is recommended to avoid contact with skin or eyes when handling these
chemical as a severe irritation can occur. To prevent this from occurring safety gloves and
glasses can be worn. If any contact with the skin occurs then it should be washed off
immediately to reduce the severity of any irritation. The relevant MSDS forms for handling
chemicals were adhered while handling any chemicals to ensure correct procedures were
followed and safety hazards were recognized.
Heat Gun
When assembling the pipe system the ends of the 19mm pipe had to be heated so they could be
connected to the adapter. This required the use of a heat gun which introduces a health and
safety risk. The heat gun is powered using an electrical cord which is plugged into a power
output. Safe handling and connection of this power cable is required to ensure there is no
danger of an electrical shock. The heat gun itself has the potential to cause severe burns if it
comes in contact with bare skin. To negate the chance of this occurring, large oven gloves were
worn when operating this tool.

70
Pipe Cutter
To cut the pipe into the required lengths a cutting blade was used. Due to the sharp edge of this
tool a risk was introduced. The hazard caused by this risk is cutting a finger or hand while
handling the pipe. To control this risk safety gloves were used to reduce the chance of an
accident occurring. This control method does not negate the chance of the hazard as the blade
could still cut through the glove. This meant that extreme care was also taken while using the
blade.
Taking measurements
The final risk involved in this project is introduced when taking the daily pressure head height
measurements. As the pallets with the drums on them are located approximately 2.5 meters
above ground level a ladder is required. The ladder is bolted to ensure it is stable. When
crouching on the pallets to take the measurements there is a danger of losing balance and falling.
The pallets do provide solid support as they are rated to hold well over a ton. There is no real
way to control this risk apart from taking extreme care when on the pallets, the measurements
are vital to achieve the hydraulic conductivity results.
B.3 Resource Requirements
Due to the extensive nature of the experimental work required in this project there is a
large demand for resources. Many of the required materials are already present in the
laboratory, either left unused from previous experiments or just generally available.
However many resources were still required from outside sources for example,
Tradelink, Total Eden Water and Bunnings warehouse. Approximately one month of
the experiment preparation was spent acquiring the costs and availability of the required
materials. As some of the resources had to be specially ordered, such as the drums and
filter paper, it had to be organized early so they would arrive on time.
There were direct cash payments involved from the researcher to cover small costs such
as funnels and the geotextile fabric. After all the parts required were purchased the
project budget reached $1150, refer to budget spreadsheet below. The budget is
acceptable given the scale and size of the experimental set-up.

71
Item Supplier Quantity
Individual
Cost Total Cost
90mm socket couplings Tradelink Plumbing 40
$92
19mm polypipe tap (2 pack) Bunnings 20 $10.81 $216.20
10L clear plastic drums Bunnings 40 $10.95 $438.00
IBC couplings Total Eden Water 2 $44.25 $88.50
Price Dimensions
Geotextile BMS Mitre 10
$3.65/m 12mm depth
Geofabric CJR Industries
$1.14/m 600mm width
Geofabric CJR Industries
$3.80/m 2000mm width
Geotextile matting Tradelink Plumbing
$94/roll 1m x 50m
Estimated
Total
Other
$1,149.90
IBC connections $70
Clamps/Pipes $70
Funnels $20
Drum Taps $60
Filter Paper $80
The funding for the project was provided by the NCEA and FSA Consulting. FSA
footed the cost for the 10L drums which was $440 in total. FSA are overseeing the
project and will report the results to the Australian Meat and Livestock Industry as part
of their contract. NCEA covered the cost for the other parts as most of the equipment
would be useful for further research experiments conducted by this organization. The
purchasing arrangements were agreed on by the NCEA and FSA consulting in the initial
stages of the project. Since then all payments have been completed successfully.
If any of the parts failed to be obtained the make-up of the project experiment would
need to be altered to make more use of parts already present in the lab. This would
likely mean reusing soil couplings and drums, this would create extra work as cleaning
these parts to the required standard would involve significant time and effort. The other
solution if parts were not available would be to use another supplier. While possible in
most cases the suppliers chosen for the materials offered the lowest prices and best
value. Using other suppliers would increase the budget of the project which given the
already high cost, is not acceptable.

72
B.4 Timeline
Figure B2: Timeline Graphical Chart
The chart above shows a simplistic view of the tasks involved with the project and the
timeline for completion. Each task represents a milestone for the project, achieving
each milestone by the set date is an important part of ensuring that the project runs
smoothly. The most critical areas of the timeline are insuring the experiment
preparation and methodology (design/ construction) are completed on time. This is vital
as a major aim of the project is to test the hydraulic conductivity of the soils over a
significant time period. This means that starting the experiment on time is essential.
When the experiment is finished sufficient time has been allowed to analyse the results
and produce the final dissertation.
Time
Tasks Mar Apr May June July Aug Sept Oct
Allocation
Specification
Objectives
Literature Review
Experiment Preperation
Experiment Methodology
Experiment Run Time
Results Analysis
Dissertation
Project Timeline
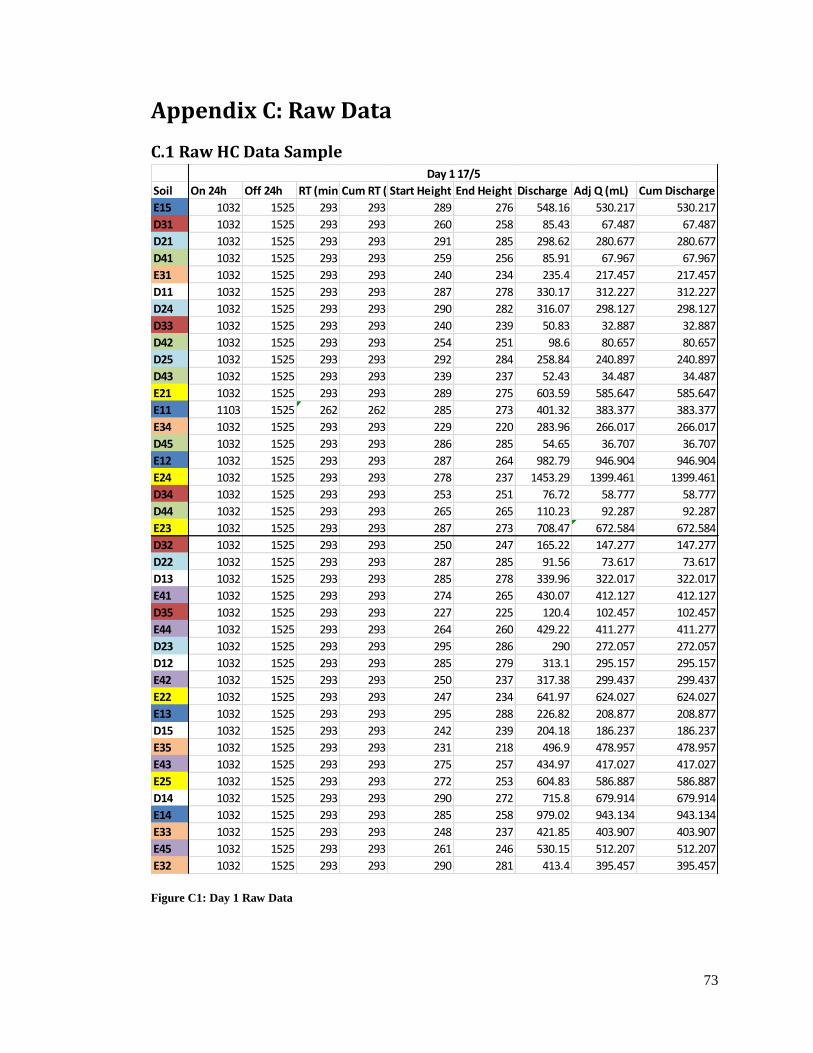
73
Appendix C: Raw Data
C.1 Raw HC Data Sample
Figure C1: Day 1 Raw Data
Soil On 24h Off 24h RT (min)Cum RT (min)Start Height (mm)End Height (mm)Discharge (mL)Adj Q (mL) Cum Discharge (mL)
E15 1032 1525 293 293 289 276 548.16 530.217 530.217
D31 1032 1525 293 293 260 258 85.43 67.487 67.487
D21 1032 1525 293 293 291 285 298.62 280.677 280.677
D41 1032 1525 293 293 259 256 85.91 67.967 67.967
E31 1032 1525 293 293 240 234 235.4 217.457 217.457
D11 1032 1525 293 293 287 278 330.17 312.227 312.227
D24 1032 1525 293 293 290 282 316.07 298.127 298.127
D33 1032 1525 293 293 240 239 50.83 32.887 32.887
D42 1032 1525 293 293 254 251 98.6 80.657 80.657
D25 1032 1525 293 293 292 284 258.84 240.897 240.897
D43 1032 1525 293 293 239 237 52.43 34.487 34.487
E21 1032 1525 293 293 289 275 603.59 585.647 585.647
E11 1103 1525 262 262 285 273 401.32 383.377 383.377
E34 1032 1525 293 293 229 220 283.96 266.017 266.017
D45 1032 1525 293 293 286 285 54.65 36.707 36.707
E12 1032 1525 293 293 287 264 982.79 946.904 946.904
E24 1032 1525 293 293 278 237 1453.29 1399.461 1399.461
D34 1032 1525 293 293 253 251 76.72 58.777 58.777
D44 1032 1525 293 293 265 265 110.23 92.287 92.287
E23 1032 1525 293 293 287 273 708.47 672.584 672.584
D32 1032 1525 293 293 250 247 165.22 147.277 147.277
D22 1032 1525 293 293 287 285 91.56 73.617 73.617
D13 1032 1525 293 293 285 278 339.96 322.017 322.017
E41 1032 1525 293 293 274 265 430.07 412.127 412.127
D35 1032 1525 293 293 227 225 120.4 102.457 102.457
E44 1032 1525 293 293 264 260 429.22 411.277 411.277
D23 1032 1525 293 293 295 286 290 272.057 272.057
D12 1032 1525 293 293 285 279 313.1 295.157 295.157
E42 1032 1525 293 293 250 237 317.38 299.437 299.437
E22 1032 1525 293 293 247 234 641.97 624.027 624.027
E13 1032 1525 293 293 295 288 226.82 208.877 208.877
D15 1032 1525 293 293 242 239 204.18 186.237 186.237
E35 1032 1525 293 293 231 218 496.9 478.957 478.957
E43 1032 1525 293 293 275 257 434.97 417.027 417.027
E25 1032 1525 293 293 272 253 604.83 586.887 586.887
D14 1032 1525 293 293 290 272 715.8 679.914 679.914
E14 1032 1525 293 293 285 258 979.02 943.134 943.134
E33 1032 1525 293 293 248 237 421.85 403.907 403.907
E45 1032 1525 293 293 261 246 530.15 512.207 512.207
E32 1032 1525 293 293 290 281 413.4 395.457 395.457
Day 1 17/5

74
Figure C2: Day 9 Raw Data
Soil On 24h Off 24h RT (min) Cum RT (min)Start Height (cm)End Height (cm)Discharge (mL)Adj Q (mL)Cum Discharge (mL)
E15 930 1530 360 3019 143 121 733.78 697.894 5414.368
D31 930 1530 360 3019 212 212 31.87 13.927 222.203
D21 930 1530 360 3019 252 246 149.51 131.567 1564.803
D41 930 1530 360 3019 252 250 29.98 12.037 199.083
E31 930 1530 360 3019 196 193 90.41 72.467 1346.853
D11 930 1530 360 3019 214 198 508.89 490.947 2967.993
D24 930 1530 360 3019 230 225 303.57 285.627 2335.933
D33 930 1530 360 3019 231 231 27 9.057 117.603
D42 930 1530 360 3019 245 244 30.27 12.327 225.513
D25 930 1530 360 3019 259 252 110.75 92.807 1214.893
D43 930 1530 360 3019 231 231 27.35 9.407 117.913
E21 930 1214 164 2823 82 62 646.03 628.087 7478.782
E11 930 1530 360 2988 164 147 519.3 501.357 4078.78
E34 930 1530 360 3019 183 181 69.54 51.597 1055.003
D45 930 1530 360 3019 278 278 30.82 12.877 198.103
E12 930 1207 157 2816 101 76 979.95 944.064 10577.9
E24 930 1207 157 2816 94 58 1333.03 1297.144 14051.35
D34 930 1530 360 3019 233 230 34.67 16.727 252.343
D44 930 1530 360 3019 255 254 36.2 18.257 291.053
E23 930 1207 157 2816 95 80 637.33 619.387 6896.282
D32 930 1530 360 3019 236 234 40.28 22.337 422.193
D22 930 1530 360 3019 274 271 70.26 52.317 492.813
D13 930 1530 360 3019 157 132 951.85 915.964 5172.784
E41 930 1530 360 3019 239 237 72.35 54.407 1272.993
D35 930 1530 360 3019 216 214 40.22 22.277 351.683
E44 930 1530 360 3019 237 236 67.15 49.207 1195.503
D23 930 1530 360 3019 249 243 208.92 190.977 1704.963
D12 930 1530 360 3019 198 174 740.41 704.524 3735.187
E42 930 1530 360 3019 216 209 61.79 43.847 1030.283
E22 930 1530 360 3019 138 92 1593.68 1539.851 8532.429
E13 930 1530 360 3019 238 232 217.5 199.557 1977.293
D15 930 1530 360 3019 187 176 363.21 345.267 2048.153
E35 930 1530 360 3019 183 180 83.9 65.957 1511.093
E43 930 1530 360 3019 204 195 57.67 39.727 1057.373
E25 930 1530 360 3019 109 88 685.57 649.684 5296.438
D14 930 1207 157 2816 105 90 521.86 503.917 6499.535
E14 930 1207 157 2816 86 62 926.69 890.804 9877.366
E33 930 1530 360 3019 204 201 73.32 55.377 1346.253
E45 930 1530 360 3019 219 218 67.81 49.867 1340.423
E32 930 1530 360 3019 253 252 70.15 52.207 1298.923
Day 9 31/5
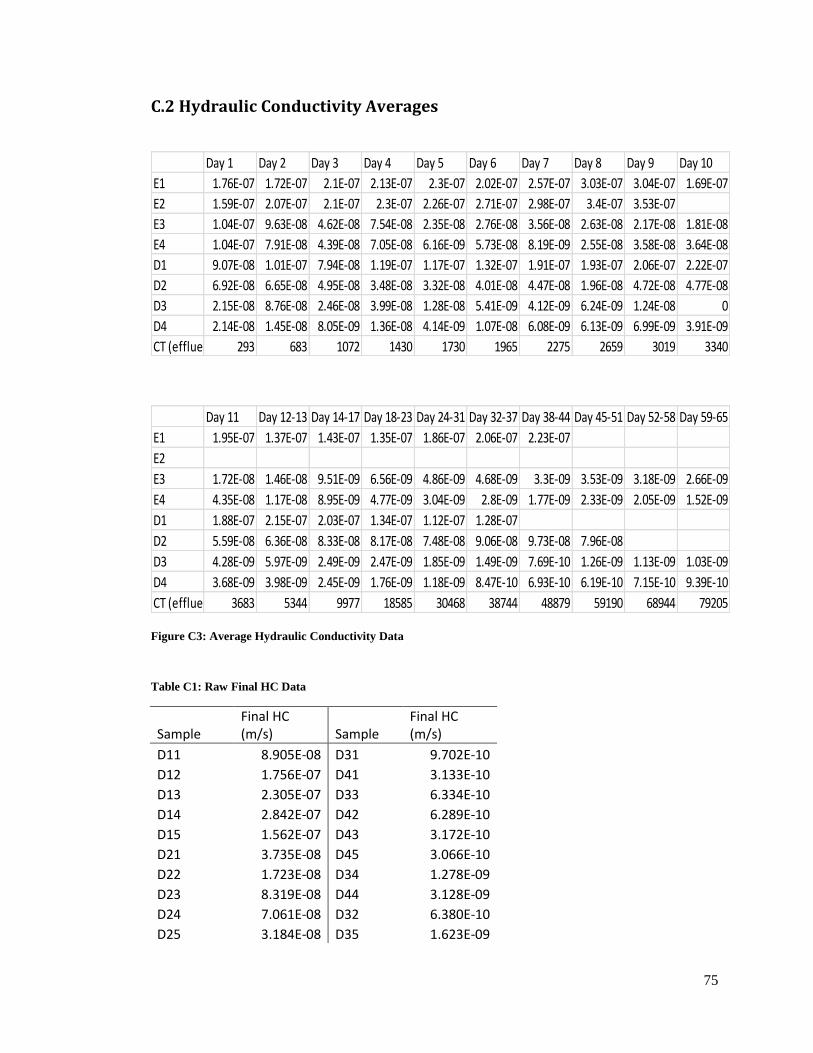
75
C.2 Hydraulic Conductivity Averages
Figure C3: Average Hydraulic Conductivity Data
Table C1: Raw Final HC Data
Sample Final HC (m/s) Sample
Final HC (m/s)
D11 8.905E-08 D31 9.702E-10
D12 1.756E-07 D41 3.133E-10
D13 2.305E-07 D33 6.334E-10
D14 2.842E-07 D42 6.289E-10
D15 1.562E-07 D43 3.172E-10
D21 3.735E-08 D45 3.066E-10
D22 1.723E-08 D34 1.278E-09
D23 8.319E-08 D44 3.128E-09
D24 7.061E-08 D32 6.380E-10
D25 3.184E-08 D35 1.623E-09
Day 1 Day 2 Day 3 Day 4 Day 5 Day 6 Day 7 Day 8 Day 9 Day 10
E1 1.76E-07 1.72E-07 2.1E-07 2.13E-07 2.3E-07 2.02E-07 2.57E-07 3.03E-07 3.04E-07 1.69E-07
E2 1.59E-07 2.07E-07 2.1E-07 2.3E-07 2.26E-07 2.71E-07 2.98E-07 3.4E-07 3.53E-07
E3 1.04E-07 9.63E-08 4.62E-08 7.54E-08 2.35E-08 2.76E-08 3.56E-08 2.63E-08 2.17E-08 1.81E-08
E4 1.04E-07 7.91E-08 4.39E-08 7.05E-08 6.16E-09 5.73E-08 8.19E-09 2.55E-08 3.58E-08 3.64E-08
D1 9.07E-08 1.01E-07 7.94E-08 1.19E-07 1.17E-07 1.32E-07 1.91E-07 1.93E-07 2.06E-07 2.22E-07
D2 6.92E-08 6.65E-08 4.95E-08 3.48E-08 3.32E-08 4.01E-08 4.47E-08 1.96E-08 4.72E-08 4.77E-08
D3 2.15E-08 8.76E-08 2.46E-08 3.99E-08 1.28E-08 5.41E-09 4.12E-09 6.24E-09 1.24E-08 0
D4 2.14E-08 1.45E-08 8.05E-09 1.36E-08 4.14E-09 1.07E-08 6.08E-09 6.13E-09 6.99E-09 3.91E-09
CT (effluent) 293 683 1072 1430 1730 1965 2275 2659 3019 3340
Day 11 Day 12-13 Day 14-17 Day 18-23 Day 24-31 Day 32-37 Day 38-44 Day 45-51 Day 52-58 Day 59-65
E1 1.95E-07 1.37E-07 1.43E-07 1.35E-07 1.86E-07 2.06E-07 2.23E-07
E2
E3 1.72E-08 1.46E-08 9.51E-09 6.56E-09 4.86E-09 4.68E-09 3.3E-09 3.53E-09 3.18E-09 2.66E-09
E4 4.35E-08 1.17E-08 8.95E-09 4.77E-09 3.04E-09 2.8E-09 1.77E-09 2.33E-09 2.05E-09 1.52E-09
D1 1.88E-07 2.15E-07 2.03E-07 1.34E-07 1.12E-07 1.28E-07
D2 5.59E-08 6.36E-08 8.33E-08 8.17E-08 7.48E-08 9.06E-08 9.73E-08 7.96E-08
D3 4.28E-09 5.97E-09 2.49E-09 2.47E-09 1.85E-09 1.49E-09 7.69E-10 1.26E-09 1.13E-09 1.03E-09
D4 3.68E-09 3.98E-09 2.45E-09 1.76E-09 1.18E-09 8.47E-10 6.93E-10 6.19E-10 7.15E-10 9.39E-10
CT (effluent) 3683 5344 9977 18585 30468 38744 48879 59190 68944 79205

76
E11 2.191E-07 E31 1.713E-09
E12 4.525E-07 E34 3.462E-09
E13 2.243E-07 E41 1.641E-09
E14 5.503E-07 E44 1.299E-09
E15 4.525E-07 E42 1.996E-09
E21 3.859E-07 E35 2.784E-09
E22 5.218E-07 E43 1.657E-09
E23 4.515E-07 E33 2.387E-09
E25 3.192E-07 E45 9.880E-10
E32 2.940E-09
C.3 Discharge Volume
Table C2: Discharge Volume Raw Data
Day 9 Discharge Volume (mL)
D2 D3 D4 E2 E3 E4
1564.803 222.203 199.083 7478.782 1346.853 1272.993
2335.933 117.603 225.513 14051.35 1055.003 1195.503
1214.893 252.343 117.913 6896.282 1511.093 1030.283
492.813 422.193 198.103 8532.429 1346.253 1057.373
1704.963 351.683 291.053 5296.438 1298.923 1340.423
1462.681 273.205 206.333 8451.055 1311.625 1179.315
Day 65 Discharge Volume (mL)
D3 D4 E3 E4
1104.053 851.233 3888.257 3633.66
646.233 1014.333 3714.94 3118.683
1444.4 669.943 4738.167 2952.523
1383.133 822.153 4179.527 2726.523
1347.913 1100.703 3742.62 3252.713
1185.146 891.673 4052.702 3136.82

77
C.4 Total Suspended Solids
Table C3: Total Suspended Solids Raw Data
Leachate TSS (g/L)
Hours 5 24 61 166 310
E31 3.504 2.516 2.136 2.6 2.744
E32 2.66 2.732 2.152 2.508 2.812
E33 2.584 2.676 2.188 2.524 2.764
E41 3.632 2.616 2.684 2.472 2.8
E42 2.276 3.024 2.68 2.804 2.812
E43
2.632 2.752 2.784
D31 3.228 2.088 2.188 2.036 2.236
D32 2.688 2.12
2.068 2.228
D33
2.08 2.264
D41 2.792 2.644 2.196 2.272 2.584
D42 2.884 2.756
2.228 2.548
D43
2.176 2.456
Permeate TSS
Sample TSS (g/L
3A 3.584
3B 2.78
3C 3.548
4A 3.608
4B 3.536
4C 3.452

78
Appendix D: Statistical Error Minitab Output
This appendix has been included to provide a sample of the Minitab Statistical Analysis
Output from which the HSD error was calculated.
HC Comparison for final raw and filtered effluent data (Heavy Clay)
One-way ANOVA: C2 versus C1 Source DF SS MS F P
C1 1 0.0000003 0.0000003 0.02 0.881
Error 8 0.0000881 0.0000110
Total 9 0.0000883
S = 0.003318 R-Sq = 0.30% R-Sq(adj) = 0.00%
Individual 95% CIs For Mean Based on
Pooled StDev
Level N Mean StDev +---------+---------+---------+---------
1 5 0.003703 0.001536 (-----------------*----------------)
2 5 0.003380 0.004434 (----------------*----------------)
+---------+---------+---------+---------
0.0000 0.0020 0.0040 0.0060
Pooled StDev = 0.003318
Tukey 95% Simultaneous Confidence Intervals
All Pairwise Comparisons among Levels of C1
Individual confidence level = 95.00%
C1 = 1 subtracted from:
C1 Lower Center Upper -------+---------+---------+---------+--
2 -0.005162 -0.000323 0.004516 (---------------*---------------)
-------+---------+---------+---------+--
-0.0030 0.0000 0.0030 0.0060

79
TSS Comparison for Leachate Filtered v Permeate Filtered Effluent (Clay Loam) One-way ANOVA: C2 versus C1 Source DF SS MS F P
C1 1 0.422 0.422 4.07 0.114
Error 4 0.415 0.104
Total 5 0.837
S = 0.3221 R-Sq = 50.45% R-Sq(adj) = 38.06%
Individual 95% CIs For Mean Based on
Pooled StDev
Level N Mean StDev ----+---------+---------+---------+-----
1 3 2.7733 0.0349 (------------*------------)
2 3 3.3040 0.4542 (------------*------------)
----+---------+---------+---------+-----
2.40 2.80 3.20 3.60
Pooled StDev = 0.3221
Tukey 95% Simultaneous Confidence Intervals
All Pairwise Comparisons among Levels of C1
Individual confidence level = 95.00%
Residual
Pe
rce
nt
0.0100.0050.000-0.005
99
90
50
10
1
Fitted Value
Re
sid
ua
l
0.00370.00360.00350.0034
0.009
0.006
0.003
0.000
Residual
Fre
qu
en
cy
0.0080.0060.0040.0020.000-0.002
6.0
4.5
3.0
1.5
0.0
Observation Order
Re
sid
ua
l
10987654321
0.009
0.006
0.003
0.000
Normal Probability Plot of the Residuals Residuals Versus the Fitted Values
Histogram of the Residuals Residuals Versus the Order of the Data
Residual Plots for C2
Figure D1: HC Stats Analysis Example Plots

80
C1 = 1 subtracted from:
C1 Lower Center Upper -----+---------+---------+---------+----
2 -0.1995 0.5307 1.2608 (--------------*-------------)
-----+---------+---------+---------+----
-0.50 0.00 0.50 1.00
Figure D2: TSS Stats Example Plots
Residual
Pe
rce
nt
0.80.40.0-0.4-0.8
99
90
50
10
1
Fitted ValueR
esid
ua
l
3.303.153.002.852.70
0.2
0.0
-0.2
-0.4
-0.6
Residual
Fre
qu
en
cy
0.20.0-0.2-0.4-0.6
3
2
1
0
Observation Order
Re
sid
ua
l
654321
0.2
0.0
-0.2
-0.4
-0.6
Normal Probability Plot of the Residuals Residuals Versus the Fitted Values
Histogram of the Residuals Residuals Versus the Order of the Data
Residual Plots for C2