Investigating mechanism of inclined CPT in granular …epubs.surrey.ac.uk/806175/11/Investigating...
23
1 Investigating mechanism of inclined CPT in granular ground using DEM Mingjing Jiang 1 , Yongsheng Dai 2 , Liang Cui 3 , Zhifu Shen 4 , Xinxin Wang 5 1 Professor, “Distinguished Professor of Tongji University”, Dept. of Geotechnical Engineering and State Key Laboratory Disaster Reduction in Civil Engineering, Tongji University, Shanghai, 200092, China (corresponding author). E-mail: [email protected] Fax: 0086-21-65985210; Tel: 0086-21-65980238 2 MSc student, Dept. of Geotechnical Engineering, college of Civil Engineering, Tongji University, Shanghai 200092, China. E-mail: [email protected] 3 Lecturer, Dept of Civil and Environmental Engineering, University of Surrey, Guildford, Surrey, GU2 7XH, UK E-mail: [email protected] 4 PhD student, Dept. of Geotechnical Engineering, college of Civil Engineering, Tongji University, Shanghai 200092, China. E-mail: [email protected] 5 Former MSc student, Dept. of Geotechnical Engineering, college of Civil Engineering, Tongji University, Shanghai 200092, China. E-mail: [email protected]
Transcript of Investigating mechanism of inclined CPT in granular …epubs.surrey.ac.uk/806175/11/Investigating...

1
Investigating mechanism of inclined CPT in
granular ground using DEM
Mingjing Jiang1, Yongsheng Dai
2, Liang Cui
3, Zhifu Shen
4, Xinxin Wang
5
1Professor, “Distinguished Professor of Tongji University”, Dept. of
Geotechnical Engineering and State Key Laboratory Disaster Reduction in Civil
Engineering, Tongji University, Shanghai, 200092, China (corresponding
author).
E-mail: [email protected]
Fax: 0086-21-65985210; Tel: 0086-21-65980238
2MSc student, Dept. of Geotechnical Engineering, college of Civil Engineering,
Tongji University, Shanghai 200092, China.
E-mail: [email protected]
3Lecturer, Dept of Civil and Environmental Engineering, University of Surrey,
Guildford, Surrey, GU2 7XH, UK
E-mail: [email protected]
4PhD student, Dept. of Geotechnical Engineering, college of Civil Engineering,
Tongji University, Shanghai 200092, China.
E-mail: [email protected]
5Former MSc student, Dept. of Geotechnical Engineering, college of Civil
Engineering, Tongji University, Shanghai 200092, China.
E-mail: [email protected]

2
Abstract. This paper presents an investigation on mechanism of the inclined 1
cone penetration test (CPT) using the numerical discrete element method (DEM). 2
A series of penetration tests with the penetrometer inclined at different angles 3
(i.e., 0°,15°, 30°, 45° and 60°) were numerically performed under µ=0.0 and 4
µ=0.5, where µ is the frictional coefficient between the penetrometer and the soil. 5
The deformation patterns, displacements of soil particles adjacent to the cone tip, 6
velocity fields, rotations of the principal stresses and the averaged pure rotation 7
rate (APR) were analyzed. Special focus was placed on the effect of friction. The 8
DEM results showed that soils around the cone tip experienced complex 9
displacement paths at different positions as the inclined penetration proceeded, 10
and the friction only had significant effects on the soils adjacent to the 11
penetrometer side and tip. Soils exhibited characteristic velocity fields 12
corresponding to three different failure mechanisms and the right side was easier 13
to be disturbed by friction. Friction started to play its role when the tip approached 14
the observation points, while it had little influence on rotation rate. The 15
normalized tip resistance (qc= f /σv0) increased with friction as well as inclination 16
angle. The relationship between qc and relative depth (y/R) can be described as qc 17
=a×(y/R)-b
, with parameters a and b dependent on penetration direction. The 18
normalized resistance perpendicular to the penetrometer axis qp increases with the 19
inclination angle, thus the inclination angle should be carefully selected to ensure 20
the penetrometer not to deviate from its original direction or even be broken in 21
real tests. 22
Keywords: Inclined cone penetration; Distinct element method; Tip resistance; 23
Stress rotation; Particle rotation. 24
25

3
1. Introduction 26
The cone penetration test (CPT) is a reliable, fast and relatively economical in-situ 27
test to obtain information about soil stratification and mechanical properties. 28
When the cone-shaped penetrometer is pushed into the ground, the soil 29
experiences the compression, shear deformation and plastic flow, thus making the 30
mechanism of CPT complicated. Many investigations have been performed on the 31
CPT mechanism in the past and they can be attributed to three methods in general: 32
(1) analytical methods: the bearing capacity theory [1-3] and the cavity expansion 33
theory [4,5]; (2) experimental methods: laboratory chamber calibration tests [6,7] 34
and centrifuge methods [8]; (3) numerical analysis methods: small strain finite-35
element method [9], large strain finite-element method [10,11], strain path method 36
[12] and the distinct element method (DEM) [13,14]. Nevertheless, these studies 37
focus on the vertical CPT as an axisymmetric boundary problem. 38
In the in-situ test, due to the presence of existing buildings and 39
infrastructures or lack of access, the CPT technique cannot always be performed 40
in the vertical orientation, thus an inclined CPT is necessarily performed instead. 41
However, it is unclear whether the penetration mechanism of an inclined CPT still 42
keeps the same way in which the vertical penetration behaves. Therefore, a few 43
studies have been performed on the non-vertical penetration mechanism. Among 44
them, Broere [15] performed the CPTs horizontally and vertically in a 2 m rigid 45
wall calibration chamber using a 36-mm cone and showed evident differences 46
between horizontal and vertical CPT measurements. Wei et al. [10, 11] used a 47
large-strain finite element method to analyze the effect of soil anisotropy on the 48
inclined CPT in normally consolidated cohesive soils. The results showed that the 49

4
tip resistance increases with increasing inclination angle as the coefficient of earth 50
pressure at rest (K0) below 1.0. 51
The study on the inclined CPT still remains insufficient, especially its 52
mechanism considering the interaction between the soil and penetrometer. 53
Therefore, the purpose of the current paper is to present the numerical analyses on 54
the mechanism of an inclined CPT with the focus on the effect of friction. The 55
penetration mechanism was discussed in terms of deformation pattern, velocity 56
field, stress rotation and APR under different penetrometer-soil friction, where the 57
penetration angle was specified to be 30°. Then the relationship between the 58
normalized tip resistance and the inclination angle was examined with two values 59
of coefficient of friction. Another four values of inclination angles (i.e., 0°, 15°, 60
45°, and 60°) were considered. 61
2. DEM modeling of CPT 62
2.1 Ground characteristics 63
The granular ground is simulated in the current study, which is composed of ten 64
types of disks with a grain size distribution shown in Fig. 1. The maximum and 65
minimum diameter of soil particles are 9 mm and 6 mm respectively. It has an 66
average grain diameter d50 = 7.6 mm and uniformity coefficient d60/d10 = 1.3. 67
The macro mechanical behavior of the ground material, which consists of 68
24000 particles with planar void ratio of 0.27, was investigated using the 69
simulations of biaxial tests under a compression rate of 10%/min and confining 70
pressures of 50 kPa, 100 kPa and 200 kPa. Fig. 2 illustrates the basic mechanical 71
properties of the granular ground. The material shows typical characteristics of a 72
5
loose ground and the peak internal friction angle of the material has found to be 73
15.37°. 74
2.2 Model setup 75
The dimension of the penetrometer and ground in the simulations needs to be 76
carefully selected in order to minimize the boundary effect and obtain rational 77
results in a DEM model with the minimum particle number. Bolton et al.[16] 78
pointed out that the cone diameter D should be at least 20 times greater than the 79
mean grain size, and in such simulation the possible error in qc (tip resistance) is 80
at most 10%. Meanwhile Jiang et al [13] suggested that there should be no less 81
than 13 particles contacting with the tip face in order to get a steady qc. Based on 82
these two findings the cone diameter was set as 0.16 m in the current study. 83
Hence, the value of D/d50=21.05>20 and the penetrometer size can ensure that the 84
tip can be always in contact with about 13 particles and thus can provide 85
acceptable resistance values. The penetrometer was composed of rigid walls. The 86
frictional coefficient µ between the penetrometer and the soil was chosen to be 0.0 87
to simulate a perfectly smooth condition and 0.5 for comparison. The parameters 88
of the granular ground material adopted in the current simulations are presented in 89
Table 1. 90
Bolton et al [16] also suggested that no apparent increase in qc (tip 91
resistance) for a test done with W / R ≥ 40, where R and W are the cone radius and 92
the width of the ground, respectively. Therefore the ground was set to be 5.0 m in 93
width and 1.626 m in depth,resulting in a value of W / R=62.5, which satisfied 94
the aforementioned criterion. 95
The multilayer under-compaction method (UCM) proposed by Jiang et al 96
[17] was employed here to ensure homogeneity of ground sample before 97

6
consolidation under gravity. Thus, five equal layers of particles were generated in 98
a sequential way, with each layer containing 30000 particles and randomly 99
deposited into a rectangular container to form the granular ground shown in Fig. 100
3(a). To achieve the target planar void ratio of 0.27, the accumulated layers of 101
particles were compacted to an intermediate void ratio which is slightly higher 102
than the target void ratio when each new layer was added. According to the under-103
compaction criterion proposed by Jiang et al. [17], the intermediate void ratios for 104
the accumulated layers were; ep(1)=0.29, ep(1+2)=0.289, ep(1+2+3)=0.284, 105
ep(1+2+3+4)=0.276 and ep(1+2+3+4+5)=0.27. During the generation process, the wall-106
particle is frictionless in order to improve the homogeneity, while inter-particle 107
frictional coefficient is chosen to be 1.0 in order to produce a loose packing of 108
particles. 109
After the sample was generated, it was subjected to an amplified gravity field 110
of 20g similar to the centrifuge modeling. When the equilibrium of the entire 111
system was achieved, the penetrometer was generated at a distance of 3.0 m from 112
the left boundary of the ground in horizontal direction and driven downward along 113
an inclined direction at a constant rate of 1 m/s, as shown in Fig.3 (a). The relative 114
high penetration rate was used to reduce the computational time and would not 115
have a significant influence on the CPT results [18]. The configuration of CPT 116
model after consolidation is illustrated in Fig. 3(a) and the layout of selected 117
observation points accompanied by two measurement circles is illustrated in Fig. 118
3(b). 119

7
2.3 Features of the ground 120
The distribution of initial horizontal and vertical stresses as a function of depth is 121
illustrated in Fig. 4. As known in geo-mechanics, ground density can be 122
calculated as: 123
= (1 ) / (1 )S
w eρ ρ + + (1) 124
Where w is the water content and w = 0 in the current study as only dry soils 125
are considered; S
ρ is the particle density and S
ρ = 2600 kg/m3. Therefore, given 126
the void ratio, the ground density can be obtained as 2047 kg/m3. Thus the 127
relationship between the initial vertical stress and the corresponding depth can be 128
written as 129
0 (20 ) 32097 ( / )v
g y y Rσ ρ= = × (2) 130
The measurement circles were adopted to calculate the average stress from 131
the contact forces between particles with centroids located within the 132
measurement circle. Two factors were considered when arranging the 133
measurement circles: a) the measurement circle should not be too small in size so 134
as to include enough particles to reduce the statistical error; b) the measurement 135
circle should not be too big otherwise the localized characteristics will be 136
smoothed and cannot be clearly discovered. Therefore the diameter of the 137
measurement circle in the current study was chosen to be 0.18 m, which can meet 138
the aforementioned requirements. The vertical and horizontal stresses as obtained 139
in the measurement circles are shown in Fig. 4. It can be seen that the vertical 140
stress increases linearly with depth from 0 to 600 kPa, and the relationship 141
between initial vertical stress and relative depth is σv0 = 32693 ( / )y R× , which is 142
in good agreement with the theoretical solution in Eq.(2). The horizontal stress 143
was observed to keep a constant ratio over the vertical stress, i.e. K0=0.58 when 144

8
y/R<27. However, it begins to deviate slightly from its initial linearity when 145
y/R>27. This is possibly due to the kinematic constraint by the bottom boundary 146
and similar phenomenon can also be found on retaining walls for a finite media by 147
several researchers (e.g. [19]).The overall ground can still be assumed as a half-148
infinite media, though there is a slight deviation from the theoretical K0 condition. 149
3 Simulation results 150
3.1 Deformation pattern 151
3.1.1 Grid deformation 152
The painted grid method proposed by Jiang et al [13] is employed here to 153
investigate the grid deformation. The gird size should be carefully chose in order 154
to capture the high gradients of variables in the soil near the penetrometer and 155
capable of representing a ‘continuum element’ from the viewpoint of micro-and-156
macro mechanics. Hence, the width and height of grid was set close to R, which 157
can meet the two aforementioned demands. The grid deformation in the 158
conditions of µ=0.0 and µ=0.5 with inclination of 30° is illustrated in Fig. 5. Here, 159
the inclination angle was defined as the vertical direction to the central axis of 160
penetrometer. Fig. 5 shows that when the tip is driven into the ground, the 161
penetration results in heaving of the ground surface, which is more remarkable on 162
the left side than on the right side. The grids were stretched vertically on the left 163
side and horizontally on the right side, which indicates that the soils on the left 164
side underwent dilation, while the soils on the right side mainly underwent 165
compaction. Similar phenomenon can be observed for µ=0.5, however, the grids 166
adjacent to the penetrometer and the tip were distorted severely and the initial 167

9
shape can hardly be recognized in the process of penetration. It can be concluded 168
that the effect of friction is particularly evident in the soils adjacent to the 169
penetrometer and the tip. Such case cannot be simulated well by the finite element 170
method, which is only capable of dealing with small deformation problem. 171
Therefore, the CPT simulation using by the distinct element method is of great 172
advantage. 173
3.1.2 Particle trajectories 174
The trajectories of 48 particles were recorded until the relative depth y/R=13.5 175
was reached as shown in Fig. 6. In the case of µ=0.0, the particles on the left side 176
mainly move outwards and then upwards at y/R=1.5. The particles close to the 177
penetrometer move downwards then outwards, while other particles move 178
outwards and then upwards at y/R =5.5, 9.5. However, the particles near the tip 179
(y/R=13.5) only move outwards with few vertical movements. Contrasting to the 180
movements on the left side, particles on the right side all move downwards and 181
then outwards. These phenomena indicate that the soil on the left side tends to 182
heave and expand laterally as observed on the ground, while the soil on the right 183
side experience compression. This is in good agreement with the grid deformation 184
as shown in Fig. 5. For a further comparison, the final positions of particles in the 185
two cases were plotted together in Fig.7 to investigate the effect of friction. Figure 186
7 shows that the friction has little influence on soil compaction on the right side. 187
The particles close to penetrometer were dragged down due to the drag force 188
produced by friction and this influence is only significant along the penetrometer. 189
3.2 Velocity fields 190
The evolution of maximum particle velocity is shown in Fig. 8, where each datum 191
plotted represents the maximum particle velocity in the granular ground at the 192

10
time when the tip reaches specific relative depth during the penetration. Fig. 8 193
shows that when the tip was initially pushed into the ground, the soil particles 194
started to move from a static state, which resulted in an abruptly increase in 195
velocity followed by fluctuations around a steady value, indicating a stable state 196
of penetration. The particles were able to move along with the penetrometer due 197
to the frictional drag force in the case of µ=0.5, where the maximum velocity 198
approached the speed of penetrometer (1m/s). However, in a perfectly smooth 199
case, the maximum velocity was only 0.63 m/s. 200
Normalized by the corresponding maximum velocity in each case (values can 201
be found in Fig. 8), all velocities of particles were divided into seven groups of 202
magnitudes and rendered with different colors as shown in Fig. 9.The velocity 203
vectors described by different colors represent the sliding lines of particles, which 204
in turn can reflect the failure mechanism. Fig. 9(a) to Fig. 9(c) shows that the 205
maximum velocity group appears near the tip of the penetrometer, while the 206
particles next to both sides of the penetrometer all move at relative low velocity. 207
The zone of the maximum velocity group on the left side is larger than that on the 208
right side. As illustrated in Fig. 9, the velocity fields at different relative depths 209
show different shapes. Previous research on the vertical CPT [20] demonstrated 210
that these velocity fields can be classified as three typical failure mechanisms [1, 211
21-24], as illustrated in Fig. 10. By comparing the velocity fields near the tip in 212
the perfectly smooth case as shown in Fig. 9(a) to Fig. 9(c) with the sliding lines 213
in Fig. 10, it can be found that soils in the inclined CPT also experience three 214
failure mechanisms successively as the depth increases, i.e., Terzaghi mechanism 215
for shallow penetration followed by Biarez and Hu mechanism for medium 216
penetration, and finally Berezantev and Vesic mechanism for deep penetration. 217
All the three mechanisms are observed on the left side, while only the second and 218
11
third mechanisms are captured on the right side, as seen from Fig. 9(a) to Fig. 219
9(c), since the right-half of the tip disturbs deeper soils than the left-half. In 220
contrast to the perfectly smooth case, particles adjacent to both sides of the 221
penetrometer exhibit relative high velocities due to the effect of friction, while 222
only a very small region is influenced by the penetration. The failure mechanism 223
on the right side retains the same as that in the case of µ=0, while on the left side, 224
Terzaghi mechanism remains for the shallow penetration and then only 225
Berezantev and Vesic mechanism is observed at the medium and deep 226
penetration. 227
3.3 Stress rotation and APR 228
Two measurement circles as shown in Fig. 3(b) were arranged to investigate the 229
stress rotation of soil. Three factors were considered in determining the position: 230
1) the observation points should be placed at a depth when the penetration gets 231
steady; 2) the position should be close enough to the central axis in order to 232
capture the features of the stress variation of soils adjacent to the penetrometer; 3) 233
the area covered by the measurement circles should be guaranteed not to be 234
overlapped by the penetrometer when it passes by. As mentioned before, the 235
penetration reached stable soon after the tip is pushed into the ground, thus the 236
locations of the measurement circles at a relative depth y/R=13.5 can ensure a 237
steady penetration before the tip approaches that depth. The other two factors 238
were checked to be reasonable in the simulation process. 239
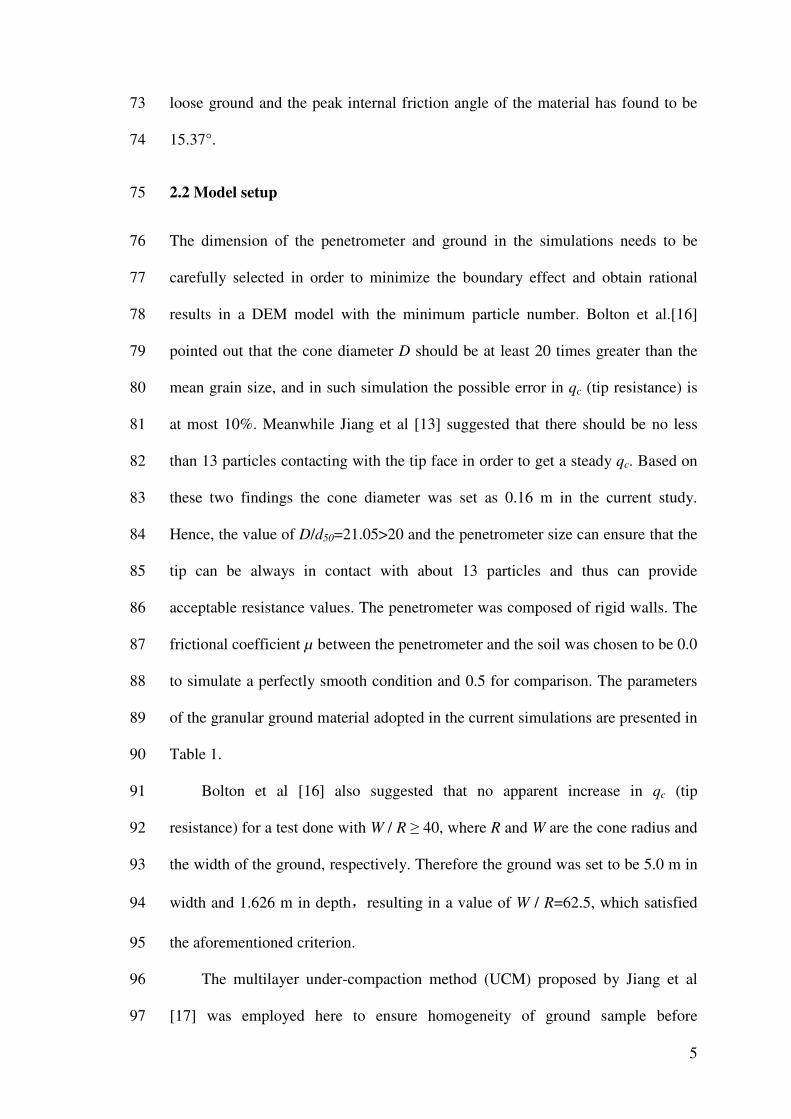
Fig. 11 provides the inclination angles of the major principal stresses with 240
respect to the vertical direction as measured in the measurement circles 29 and 32 241
during penetration. The initial orientation of the major principal stress is in the 242
vertical direction, i.e. inclination angle = 0°. A positive angle represents an 243

12
anticlockwise stress rotation and vice versa. Both frictional case and smooth case 244
are considered in Fig. 11. 245
Fig.11 shows that in the case of µ=0, the principal stresses in both 246
measurement circles undergo large rotations with values of over 180° on the left 247
side and nearly 180° on the right side. Before the penetration started, the major 248
principal stresses all head vertically as K0=0.58. When the tip was initially pushed 249
into the ground, the soil along the central axis line of penetrometer contacted 250
tightly because of compaction, and the principle stresses on both sides of 251
penetrometer tended to be parallel to penetration direction. Therefore, the major 252
principal stress moved from the vertical to the compaction direction. That's why 253
the two observation points initially rotated clockwise when penetration occurred 254
at shallow depth. When the tip approached the two observation points, the 255
influence of the tip face became significant. The principle stress at the observation 256
points tended to become perpendicular to the tip face, as a result, the principal 257
stress at the left observation point continually rotated clockwise, while the 258
principal stress at the right observation point began to rotate counterclockwise. 259
When the tip passed over the two observation points, the penetrometer side began 260
to take effect instead of tip, thus resulting in an apparent leap. After that, the stress 261
rotation tends to be constant, especially on the right side. From these observations 262
it can be inferred that the effect of side friction on the stress rotation of the soil 263
adjacent to penetrometer is constant once penetration gets steady. This 264
phenomenon is almost the same in the case of µ=0.5 except more rotation on the 265
right side. 266
Fig.12 presents the average pure rotation rates (APR) within the 267
measurement circles 29 and 32 during penetration. 12. APR is denoted by 3
cw and 268
defined in [25] as 269

13
3 1 1 2 2
1 1
1 1 1( )
cNNc p k k k k
kk k
r rN N r
ω θ θ θ= =
= = +
∑ ∑& & & (3) 270
where the summation is over the Nc particle contacts in a measurement circle. 271
Contact k is between two particles with the radii of 1
kr and 2
kr , and the angular 272
velocities of 1
kθ& and 2
kθ& (positive denoting counter-clockwise rotation), 273
respectively. kr is the common radius defined as 274
1 2
1 2
2 k kk
k k
r rr
r r=
+ (4) 275
APR is a microscopic kinematic variable to describe the rotation features of 276
particles, which is important but neglected in continuum mechanics. Fig. 11 277
shows that friction has no apparent effect on the rotation rate. Therefore, only two 278
APRs in perfectly smooth penetration are investigated here. It is interesting to 279
note that the sign of APRs are generally the same with the principal stress rotation 280
angles. Moreover, the magnitudes of APRs are closely associated with the rotation 281
angle of the principal stresses. These observations indicate that the continuum-282
based qualities such as the principal stress direction may be related to the micro-283
scale particle behavior to a certain extent, which is worth further study. 284
3.5 Normalization of tip resistance in the inclined penetration 285
For geotechnical engineers, the tip resistance qc in a typical CPT is of great 286
interest since qc is important and useful in determining the bearing capacity and 287
relative density of a ground. In addition to the previous simulations with an 288
inclination angle of 30°, the study is extended further to examine the effect of the 289
inclination angle with values of 0°, 15°, 45° and 60°. Every penetration was 290
performed with two different coefficients of friction between penetrometer and 291
particles. The tip resistance qc is obtained by the summation of the contact force 292

14
components exerted on the tip parallel to the central axis of the penetrometer 293
divided by the penetrometer diameter or a half. For convenience in the analysis, 294
normalized tip resistance was adopted in this paper in our post process, as shown 295
in Eqs. (5)-(7): 296
. .c left c right
c
vo
f fq
D σ
+=
⋅ (5) 297
.
.( / 2)
c left
c left
vo
fq
D σ=
⋅ (6) 298
.
.( / 2)
c right
c right
vo
fq
D σ=
⋅ (7) 299
where .c leftf and .c right
f correspond to the summation of the contact force 300
components exerted on the tip parallel to the central axis of the penetrometer, 301
respectively. D is the cone diameter and σv0 is the initial vertical stress in the 302
ground, as shown in Fig. 4. 303
Fig.13 provides the relationship between the normalized resistance and the 304
relative depth (y/R) in different penetration directions for the two values of 305
friction. In each figure, the resistances on both sides together with resultant 306
resistance are included. It is shown in the figure that similar to the field tests, the 307
resistances in the simulations are quite fluctuating. The resistances on both sides 308
show similar developing trend and are virtually equal in vertical penetration due 309
to the symmetric stress condition. On the contrary, qc,right tends to be larger than 310
qc,left at shallow depth when inclined penetration occurs and this phenomenon is 311
more significant as inclination angle increases. Further investigation shows that 312
the tip resistances on both sides finally approach a same value at a relatively deep 313
depth. This may be explained in view of stress conditions in which the side 314
experienced: when the inclined CPT initially began, the stress condition was quite 315
different where the stress was larger on the right side and this resulted in a higher 316

15
resistance as shown in Figure 13. As penetration continued, the stress difference 317
tended to be smaller and the resistances then grew synchronously. Same as qc,right, 318
qc also decays with penetration depth in a decreasing rate. Fitting curves are 319
proposed in the form of qc =a×(y/R)-b
, where a and b are two parameters varying 320
with penetration direction. At the same penetration depth, qc gradually increases 321
as the penetration direction changes gradually from a vertical direction to 60°. 322
These observations are consistent with the investigation described in [15], where 323
the tip resistance measured in the horizontal direction is about 20% larger than 324
that in the vertical. The similar phenomenon observed in DEM simulation and 325
chamber tests can be explained by the soil stress state K0=0.58, i.e. the vertical 326
stress is higher than the horizontal stress. Nevertheless, it is evident in the figure 327
that the friction results in higher tip resistance, which can be easily explained as 328
that more energy is required to compensate the work done by the frictional force. 329
Curves shown in Fig. 14 were given to compare the evolution trend, from 330
which it can be easily found that the difference of normalized tip resistance tends 331
to decrease with increasing depth regardless of friction. The relationship between 332
parameters (a,b) and inclination angles is shown in Fig. 15. In the smooth 333
condition, parameter a has an evident increase as the penetration direction 334
changes from 0° to 60° while in the case of µ=0.5, the value in vertical penetration 335
show some inconsistency. Parameter b also exhibits increasing trend, but on a 336
smaller scale in both cases, also accompanied by inconsistency in the case of 337
vertical penetration when µ=0.5. 338
In addition to the force aligned along the axis of the penetrometer, there is 339
also a force perpendicular to the penetrometer axis as soon as the test is inclined, 340
which is always ignored in the analysis of traditional cone penetration tests as the 341
forces are balanced in axisymmetric condition. However, this force in an inclined 342

16
CPT is of great importance from a practical view as it may deviate or even break 343
the penetrometer in real tests. Therefore, the evolution of the normalized 344
resistance perpendicular to the penetrometer axis, which is denoted qp in this 345
paper, is also investigated. Its definition is as follow: 346
. .
3
2
p left p right
p
vo
f fq
D σ
+=
⋅ ⋅
(8) 347
Where .p leftf
and .p rightf
correspond to the summation of the contact force 348
components exerted on the tip perpendicular to the central axis of the 349
penetrometer, respectively. D is the cone diameter and σv0 is the initial vertical 350
stress in the ground, as shown in Fig. 4. 351
Fig. 16 shows the relationship between the normalized resistance 352
perpendicular to the penetrometer axis qp and the relative depth (y/R) in different 353
penetration directions for the two values of friction. As shown in the figure, qp 354
approximately equals zero when performed in vertical direction as the two sides 355
of tip experienced equal and opposite reaction. However, it increases significantly 356
with the inclination angle at shallow depth in the same way as the normalized 357
resistance qc. One apparent difference between qc and qp lies in the deep 358
penetration where equal values on both sides do not appear in normalized 359
resistance qp. The unbalanced force applied perpendicular to the penetrometer axis 360
may deviate the cone from its desired penetration direction. The phenomenon 361
described here is limited to the cone tip which should be the same to the 362
penetrometer side, thus qp on both sides of penetrometer is not included in this 363
paper. Based on the above analysis, when performing inclined cone penetration 364
tests, the inclination angle should be carefully selected to ensure the penetrometer 365
not to deviate from its original direction or even be broken in real tests. Same as 366

17
the normalized resistance qp, higher friction results in higher normalized 367
resistance qp.. 368
5. Discussions 369
The material used in the simulations has quite different internal friction from 370
the real materials. The internal friction angle considered in this paper is only 371
15.37° and corresponds to a typical loose sample with low relative density. Such a 372
small value is normal with models that ignore the possibility of particle rolling 373
resistance at contacts [26, 27]. There are two available approaches in DEM 374
analyses which can increase the friction angle for the material considered: The 375
first approach is to use irregular grains such as clustered disks/spheres, 376
polygon/polyhedron or ploy-ellipsoids etc. This may significantly increase the 377
internal friction angle but require more computational time in contact detection, 378
making it difficult to apply to large-scale boundary value problem. Alternately, 379
the rolling resistance may be preferred without considering the details at the 380
particle scale such as the particle shape. However, it can simultaneously satisfy 381
the demand of improving internal friction angle and computational efficiency 382
[26]. In addition, there have been many researches investigating the relationship 383
of tip resistance and relative density [16, 28, 29] or internal friction angle [30-32] 384
and several empirical formulas have been proposed. Thus results obtained from 385
the low internal friction angle material may be used to predict the responses of 386
more frictional material once the relative density or internal friction angle are 387
given. 388
In this paper, we mainly focused on the tip resistance as previous works [32-389
34] have shown that the sleeve friction is small compared to the tip resistance, 390
only around 10% or even smaller. Besides, the friction effect on sleeve friction 391
18
has been investigated in our previous papers [13, 20] hence only the tip resistance 392
is included in our analysis for simplicity. 393
Cone penetration is actually a three-dimensional problem however it is 394
simulated in plane-strain conditions in the current study. It is obvious that a two-395
dimensional simulation cannot accurately represent a three-dimensional deposit of 396
a granular material that consists of spherical particles. However, there is no 397
intention in this paper to link the result of numerical simulations to field CPT 398
quantitatively. The results presented herein will be analyzed strictly from a 399
mechanism point of view. In terms of investigating the mechanism of inclined 400
CPT, 2D DEM is still a reasonable option for our analysis. This is because: (a) 401
Both 2-D and 3-D assemblies are a type of mechanical system, they must obey 402
and share basic laws. It is these laws that would enhance understanding the 403
behavior of natural soils and subsequently establishing their practical macro-404
constitutive models. Hence, the mechanism of particle movement obtained from a 405
two-dimensional simulation is expected to be similar to that from a three-406
dimensional simulation. (b) To simulate large-scale boundary-value problems in 407
geotechnical engineering using current PCs, the size effect and boundary effect 408
must be reduced to the minimum, which requires an extremely large number of 409
particles hence possible by 2D DEM for current PCs. (c) 2D DEM has been 410
proved to be efficient in describing soil behavior qualitatively with numbers of 411
studies. 412
Therefore, the soil in 3D simulations should also experience dilation and 413
compression during the penetration as observed in this paper. However, 414
quantitative comparison of failure mechanisms is impossible in this paper, since 415
rigid plasticity is assumed in the three typical failure mechanisms proposed by 416
Terzaghi, Biarez and Berezantev etc.[1,21-24], but it is not true for granular 417

19
materials in the simulations. The stress rotation described in this paper is 418
restricted to in-plane while the out-of-plane rotation is not considered. Besides, 419
the out-of-plane constraint necessary to enforce a state of plane strain is not 420
present in 2D DEM and this may results somewhat different tip resistance. For 421
those reasons, the stress rotation and tip resistance measured in 2D DEM should 422
be properly modified when extrapolated to 3D problems. Alternatively, three-423
dimensonal problem like CPT maybe reduced to a particular 2-dimensonal case 424
by limiting the size of the media domain as has been introduced in [35]. 425
6. Concluding remarks 426
The distinct element method was used to investigate the effect of friction on the 427
inclined cone penetration mechanism in this paper. Based on the numerical 428
simulations, the following conclusions can be made: 429
(1) Soils on the left side of the inclined penetration experience dilation, while on 430
the right side undergo compaction. The effect of friction is particularly evident in 431
the region adjacent to the penetrometer and the tip. 432
(2) Soils experience three different failure mechanisms successively during the 433
penetration as the depth increases. The friction mainly affects the failure 434
mechanism on the left side of the tip. 435
(3) The principal stresses of soils around the cone tip undergo large rotation 436
accompanied by apparent particle rotations, and this rotation is nearly independent 437
on friction. 438
(4) The normalized tip resistance increases with friction as well as inclination 439
angle. The relationship between the normalized resistance (qc= qc /σv0) and 440
relative depth (y/R) can be described by qc =a×(y/R)-b
, with parameters a and b 441
dependent on the penetration direction. 442

20
(5) The inclination angle should be carefully selected to ensure the penetrometer 443
not to deviate from its original direction or even be broken in real tests. 444
Acknowledgements 445
The work reported in this paper was funded by China National Funds for 446
Distinguished Young Scientists with Grant No.51025932 and National Natural 447
Science Foundation of China with grant number 51179128. The support of the 448
Itasca Consulting Group is also gratefully acknowledged. Thanks also go to Dr. 449
Banglu Xi from Tongji University, China, for his contribution on the paper. All 450
the supports are greatly appreciated 451
References 452
1. Terzaghi, K.. Theoretical soil mechanics. Wiley: New York (1943). 453
2. Meyerhof, G.G.. The ultimate bearing capacity of foundations. Geotechnique, 2(4), pp.301–454
32 (1951). 455
3. Hu, G.C.. Bearing capacity of foundations with overburden shear. Sols-Soils , 4(13), pp. 11-456
18 (1965). 457
4. Farrell, D.A., Greacen, E.L.. Resistance to penetration on fine probes in compressible soil. 458
Australian Journal of Soil Research, 4(1), pp. 1–17 (1966). 459
5. Rohani, R.B., Baladi, G.Y.. Correlation of mobility cone index with fundamental engineering 460
properties of soil. In: Proc. of the 7th int. conf. of the society for terrain-vehicle systems, vol. 461
3,Calgary, Alberta, Canada; pp. 959–90 (1981). 462
6. Ahmadi, M.M., Robertson, P.K.. Calibration chamber size and boundary effect for CPT q(c) 463
measurements. Geotechnical and Geophysical Site Characterization. vols. 1 and 2, pp. 829-464
833 (2004). 465
7. EI-Kelesh, A.M., Matsul, T.. Calibration chamber modeling of compaction grouting. 466
Geotechnical testing journal,31(4),pp.295-307 (2008). 467

21
8. Sharp, M.K., Dobry, R., Phillips, R.. CPT-Based Evaluation of Liquefaction and Lateral 468
Spreading in Centrifuge. Journal of geotechnical and geoenvironmental engineering. 136(10), 469
pp.1334-1346 (2010). 470
9. De, B.C., Vermeer, P.A.. Finite element analysis of static penetration tests. Geotechnique, 471
34(2), pp.199–210 (1984). 472
10. Wei, L.. Numerical simulation and field verification of inclined piezocone penetration test in 473
cohesive soils. PhD thesis, Louisiana State University (2004). 474
11. Wei, L., Abu-Farsakh, M.Y., Tumay, M.T.. Finite-element analysis of inclined piezocone 475
penetration test in clays. International Journal of Geomechanics, 9,pp. 167-278 (2005). 476
12. Baligh, M.M.. The strain path method. Journal of Geotechnical Engineering, 111, pp. 1108-477
1136 (1985). 478
13. Jiang, M.J., Yu, H.S., Harris, D.. Discrete element modelling of deep penetration in granular 479
soils. International journal for numerical and analytical methods in geomechanics , 30(4), 480
pp.335–361 (2006). 481
14. Huang, A.B., Ma, M.Y.. An analytical study of cone penetration tests in granular material. 482
Canadian Geotechnical Journal,31, pp.91–103 (1994). 483
15. Broere, W., van Tol, A. F.. Horizontal cone penetration testing. Geotechnical Site 484
Characterization, pp. 989 – 994 (1998). 485
16. Bolton, M.D., Gui, M.W., Garnier, J., Corte, J.F., Bagge, G., Laue, J., Renzi, R.. Centrifuge 486
cone penetration tests in sand. Geotechnique, 49(4), pp. 543-552 (1999). 487
17. Jiang, M.J., Konard, J.M., Leroueil, S.. An efficient technique for generating homogeneous 488
specimens for DEM studies. Computers and Geotechnics, 30(7), pp. 579-597 (2003). 489
18. Dayal, , U., Allen, J.H.. The effect of penetration rate on the strength of remolded clay and 490
sand samples, Canadian Geotechnical Journal, pp.336-348 (1975). 491
19. Take, W.A., Valsangkar, A.J.. Earth pressure on unyielding retaining walls of narrow backfill 492
width. Canadian Geotechnical Journal, 38(6), pp.1220–1230 (2001). 493
20. Jiang, M.J, Zhu, H.H., Harris, D.. Classical and non-classical kinematic fields of two-494
dimensional penetration tests on granular ground by discrete element method analyses. 495
Granular Matter, 10, pp.439-455 (2008). 496
21. Biarez, J., Burel, M., Wack, B..Contribution à l’étude de la force portent des foundation. 497
Proc. 5th Int. Conf. Soil Mech. Found. Eng., Paris 1, 603–609 (1961) 498

22
22. Hu, G.. Bearing capacity of foundations with overburden shear. Sols-Soils 13, 11–18 (1965) 499
23. Berezantev, K., Golubkov.. Load bearing capacity and deformation of piled foundations. 500
Proc. 5th Int. Conf. Soil Mech, Found. Eng.1, 11–27 (1961) 501
24. Vesic, A.S.. Bearing capacity of deep foundations in sand. Hwy. Res. Board Rec. 39, 112–502
153 (1963) 503
25. Jiang, M.J., Yu, H.S., Harris, D.. Kinematic variables bridging discrete and continuum 504
granular mechanics. Mechanics Research Communication, 33, pp. 651-666 (2006). 505
26. Jiang M. J., Yu H. S., Harris D.. A novel discrete model for granular material incorporating 506
rolling resistance [J].Computers and Geotechnics . 32(5): 340-357. (2005) 507
27. Jiang M. J., Leroueil S., Zhu H. H., Yu H. S., Konrad J.M.. Two-Dimensional discrete 508
element theory for rough particles [J].International Journal of Geomechanics. 9(1): 20-33. 509
(2009) 510
28. Huang A. B., HSU H. H.. Cone penetration tests under simulated field conditions [J]. 511
Geotechnique. 55(5): 345-354. (2005). 512
29. LEE J., Salgado R.. Estimation of bearing capacity of circular footings on sands based on 513
cone penetration test [J]. Journal of Geotechnical and Geoenvironmental Engineering. 514
131(4):442-452. (2005) 515
30. Durgunoglu, H.T., Mitchell, J.K.. Static penetration resistance of soils. In: Proceedings of the 516
Specialty Conference in In-Situ Measurements of Soil Properties. ASCE, Vol. I. pp: 151-189. 517
(1975) 518
31. Houlsby G. T., Hitchman R.. Calibration chamber tests of a cone penetrometer in sand [J]. 519
Geotechnique. 38(1), 39-44. (1988) 520
32. Susila, E., Hryciw, R. D.. Large displacement FEM modeling of the cone penetration test 521
(CPT) in normally consolidated sand. International Journal for Numerical and Analytical 522
Methods in Geomechanics. 32(5): 340-357. (2005) 523
33. DeJong, J. T., Frost, J. D., Cargill, P. E.. Effect of Surface Texturing on CPT Friction Sleeve 524
Measurements. Journal of Geotechnical and Geoenvironmental Engineering. 127(2): 158–525
168. (2001) 526
34. Silva, M. F., Bolton, M. D.. Centrifuge penetration tests in saturated layered sands. In: 527
Proceedings of 2nd International Conference on Site Characterization. Vols 1 and 2: 377-384. 528
(2004) 529

23
35. Balevicius, R., Dziugys, A., Kacianauskas, R.. Discrete element method and its application to 530
the analysis of penetration into granular media. Journal of Civil Engineering and 531
Management, 10(1): 3–14. (2004) 532