Investigating Ferroelastic and Piezoelectric Vibration ... · 3.3 Results and Discussion ......
109
Investigating Ferroelastic and Piezoelectric Vibration Damping Behavior in Nickel-Barium Titanate and Nickel-PZT Composites Ted Ankomahene Asare Dissertation submitted to the Faculty of the Virginia Polytechnic Institute and State University in partial fulfillment of the requirement for the degree of DOCTOR OF PHILOSOPHY in Materials Science and Engineering APPROVED: Professor Stephen L. Kampe, Chairman Professor Alexander O. Aning Professor William T. Reynolds Jr. Professor Gary R. Pickrell Dr. Jeffery P. Schultz September 26, 2007 Blacksburg, Virginia Keywords: damping capacity, ferroelasticity, ferroelectricity, piezoelectricity, barium titanate, metal matrix composites
Transcript of Investigating Ferroelastic and Piezoelectric Vibration ... · 3.3 Results and Discussion ......

i
Investigating Ferroelastic and Piezoelectric Vibration Damping Behavior in Nickel-Barium Titanate and Nickel-PZT
Composites
Ted Ankomahene Asare
Dissertation submitted to the Faculty of the Virginia Polytechnic Institute and State University in partial fulfillment of the requirement for the degree of
DOCTOR OF PHILOSOPHY in
Materials Science and Engineering
APPROVED:
Professor Stephen L. Kampe, Chairman
Professor Alexander O. Aning
Professor William T. Reynolds Jr.
Professor Gary R. Pickrell
Dr. Jeffery P. Schultz
September 26, 2007
Blacksburg, Virginia
Keywords: damping capacity, ferroelasticity, ferroelectricity, piezoelectricity, barium titanate, metal matrix composites

ii
Investigating Ferroelastic and Piezoelectric Vibration Damping Behavior in Nickel- Barium Titanate and Nickel-PZT Composites
by
Ted Ankomahene Asare
(ABSRACT)
Ferroelectric and piezoelectric ceramic reinforced metal matrix composites are new
materials being explored for vibration damping purposes. The high damping ability of
ferroelectric and piezoelectric ceramics such as barium titanate (BaTiO3) and lead
zirconate titanate (PZT) is due to the anelastic response of ferroelastic domain walls to
applied external stress. In piezoelectric ceramics, vibration energy can also be dissipated
through the direct piezoelectric effect if the appropriate electric circuit is connected
across the ceramic.
In this work we have examined the vibration damping behavior of BaTiO3, nickel-barium
titanate (Ni-BaTiO3) composites and nickel-lead zirconate titanate (Ni-PZT) composites.
BaTiO3 ceramics were fabricated by a combination of uniaxial pressing and cold isostatic
pressing followed by sintering in air. Low frequency (0.1Hz-10Hz) damping capacity of
BaTiO3, tanδ has been measured in three-point bend configuration on a dynamic
mechanical analyzer. Tanδ has been found to increase with temperature up to the Curie
temperature (Tc) of BaTiO3, after which there was a drop in damping capacity values due
to the disappearance of ferroelectric domains above Tc. Furthermore within the
frequency range tested, tanδ has been found to decrease with increasing vibration
frequency. We also observed that tanδ decays with the number of vibration cycles (N).
The decrease in tanδ with N, however, is fully recovered if BaTiO3 is heated above the
Tc.
Ni-BaTiO3 composite composed of a layer of BaTiO3 ceramic sandwiched between two
layers of Ni were fabricated using a combination of electroless plating and
electroforming. The damping behavior of the composite was analyzed in terms of the
damping mechanisms below Tc and the damping mechanisms above Tc of BaTiO3.

iii
Below Tc, vibration damping ability of the composite was highly influenced by
ferroelastic damping in the BaTiO3 component. Above the Curie temperature, the
damping capacity was influence more by the inherent damping mechanisms in the nickel
matrix.
The damping mechanisms in Ni-PZT composites were evaluated at a low vibration
frequency of 1Hz. In these composites we identified ferroelastic domain wall motion as
the main damping mechanism active below the Tc of PZT. Using a poled PZT ceramic
enhanced the damping capacity of the composite because of favorable ferroelastic
domain orientation in the direction of applied stress. Based on our experimental results,
we found no evidence of a direct piezoelectric damping mechanism in the Ni-PZT
composites.

iv
This Work is Dedicated to My Mum
Dora Asare

v
Acknowledgements
I would like to express my appreciation to my advisor Dr. Steve Kampe for his support
and guidance throughout the course of this research. Special thanks to Dr. Alex Aning
for recruiting me to Virginia Tech and for serving on my committee. My sincere thanks
to Dr. Jeff Schultz for his invaluable assistance and advice in making this work a success.
I would also like to thank Dr. Bill Reynolds and Dr Gary Pickrell for serving on my
committee.
Next, I would like to thank DARPA, ARO and the MSE department for providing
financial support for this work. I would like to thank my colleague Ben Poquette for
being a great friend and a wonderful lab partner for the past 5 years. Special thanks to
current and past members of Kamposites and KAG Research Groups at Virginia Tech for
their great company throughout the years.
To the department head, Dr David Clark, and the faculty, staff and students of MSE, I
would like to say thank you for providing a welcoming and pleasant atmosphere to work
in. I would especially like to thank David Berry and Susette Sowers, who were always
willing to lend a helping hand.
Special thanks to Richard Johnson and Dr. Senanu Ashiabor for their friendship, prayers,
and comic relief throughout the years
I would also like to thank my mother, father and my siblings Mike, Esther and Kojo for
believing in me. To my beautiful wife Doreen, thanks for your love, patience, and
encouragement.
Finally, for giving me the strength to carry on, thank you GOD.

vi
Table of Contents
List of Figures………………………………………………………………………….. viii List of Tables………………………………………………………………………......... xi
1 Chapter 1: Introduction, Research Objectives and Dissertation Format..................... 1
1.1 Introduction......................................................................................................... 1 1.2 Research Objectives............................................................................................ 3
1.2.1 Ferroelectric Ceramic Reinforced Metal Matrix Composites (FRMMC) ...... 3 1.2.1.1 Verification of Ferroelastic Domain Switching Damping Mechanism .. 3 1.2.1.2 Damping Capacity Behavior of Metal- BaTiO3 Composites.................. 7
1.2.2 Piezoelectric Ceramic Reinforced Metal Matrix Composites (PRMMC) ...... 9 1.3 Thesis Format.................................................................................................... 10
2 Chapter 2- Literature Review.................................................................................... 11
2.1 Anelasticity in Materials ................................................................................... 11 2.1.1 Quantifying Material Damping..................................................................... 11
2.2 Applications of Internal Friction....................................................................... 17 2.3 Apparatus for Measuring Material Damping.................................................... 17 2.4 Mechanisms for Material Damping .................................................................. 19
2.4.1 Point Defect Damping................................................................................... 19 2.4.2 Dislocation Damping .................................................................................... 20 2.4.3 Grain Boundary Damping............................................................................. 21 2.4.4 Thermoelastic Damping................................................................................ 22 2.4.5 Interfacial Damping ...................................................................................... 22
2.5 Domain Damping.............................................................................................. 23 2.5.1 Ferromagnetic Domain Damping ................................................................. 23 2.5.2 Ferroelastic Domain Damping...................................................................... 24 2.5.3 Damping in Ferroelectric Materials .............................................................. 24
2.5.3.1 Interactions of Mobile 90o Domain Walls with Mobile Point Defects. 25 2.5.3.2 Interaction of Immobile Domain Walls with Mobile Point Defect ...... 25 2.5.3.3 Ferroelectric Damping Due To Viscous Domain Wall Motion............ 26
2.6 Summary ........................................................................................................... 27
3 Chapter 3: Damping in BaTiO3 and Ni-BaTiO3 Composites ................................... 29
3.1 Introduction....................................................................................................... 29 3.2 Experimental Procedure.................................................................................... 32
3.2.1 Fabrication of BaTiO3 Samples .................................................................... 32 3.2.2 Characterization of Sintered BaTiO3 ............................................................ 33
3.2.2.1 X-ray Diffraction .................................................................................. 33 3.2.2.2 Differential Scanning Calorimetry........................................................ 33
3.2.3 Fabrication of Nickel BaTiO3 Composite (Ni-BaTiO3)................................ 34 3.2.4 Dynamic Mechanical Analysis of BaTiO3.................................................... 34
3.2.4.1 Effect of Microstructural Morphology on Damping Capacity ............. 34 3.2.4.2 Effect of Vibration Frequency on Damping Capacity of BaTiO3......... 34 3.2.4.3 Effect of Time on the Damping Capacity of BaTiO3 ........................... 35
3.2.5 Dynamic Mechanical Analysis of Nickel- BaTiO3 Composites................... 35

vii
3.3 Results and Discussion ..................................................................................... 35 3.3.1 DSC............................................................................................................... 35 3.3.2 X-ray Diffraction Results.............................................................................. 36
3.3.2.1 Determination of Tetragonality of BaTiO3 ........................................... 39 3.3.3 Dynamic Mechanical Analysis of BaTiO3 Samples ..................................... 48
3.3.3.1 Damping Below the Curie Temperature ............................................... 48 3.3.3.2 Damping Capacity and Grain Morphology of BaTiO3 ......................... 50 3.3.3.3 Damping at the Curie Temperature....................................................... 53 3.3.3.4 Damping above the Curie Temperature................................................ 53
3.3.4 Effect of Frequency on Damping Capacity of BaTiO3................................. 54 3.3.5 Dependence of tanδ on Number of Vibration Cycles ................................... 56
3.3.5.1 Recovery of Drop in tanδ...................................................................... 59 3.3.5.2 Recovery of Drop in tanδ and Aging in BaTiO3................................... 60
3.3.6 Effect of Domain Structure on the Mechanical Properties of BaTiO3.......... 61 3.4 Nickel- BaTiO3 (Ni-BaTiO3) Composites ........................................................ 63 3.5 Damping Capacity Behavior of Ni-BaTiO3 Composites .................................. 63 3.6 Summary ........................................................................................................... 66
4 Chapter 4: Vibration Damping in Ni-PZT Composites ............................................ 68
4.1 Introduction....................................................................................................... 68 4.2 Piezoelectric Damping ...................................................................................... 69
4.2.1 Piezoelectric Ceramic Reinforced Metal Matrix Composites (PRMMC) .... 70 4.3 Experimental Procedure.................................................................................... 72
4.3.1 Sample Preparation ....................................................................................... 72 4.3.2 Damping Capacity Measurements ................................................................ 73
4.4 Results and Discussion ..................................................................................... 75 4.4.1 Dynamic Mechanical Analysis ..................................................................... 75
4.5 Damping Mechanisms in Ni-PZT Composites ................................................. 78 4.5.1 Differences in Damping Capacity of Poled and Depoled PZT Ceramic ...... 80
4.6 Summary ........................................................................................................... 82
5 Chapter 5: Summary and Conclusions...................................................................... 84
5.1 Summary ........................................................................................................... 84 5.2 Conclusions....................................................................................................... 84
5.2.1 Damping Capacity Behavior of BaTiO3 ....................................................... 84 5.2.2 Damping of Ni-BaTiO3 Composites............................................................. 85 5.2.3 Damping Mechanisms in Ni-PZT Composites ............................................. 85
5.3 Future Work ...................................................................................................... 86
6 Chapter 6: Electroless Plating and Electroforming................................................... 87
6.1 Electroless Ni Plating........................................................................................ 87 6.1.1 Experimental Procedure................................................................................ 88
6.2 Nickel Electroforming ..................................................................................... 90 References………………………………………………………………………………. 93 Vitae…………………………………………………………………………………….. 98

viii
List of Figures
Figure 1-1: Shift in (200) and (002) peak intensity in tetragonal BaTiO3 during compressive loading in-situ neutron scattering experiment........................................ 4
Figure 1-2: Estimated change in intensity of (200) and (002) peaks in tetragonal BaTiO3 during compressive loading in-situ neutron scattering experiment. ........................... 5
Figure 1-3: (200) and (002) peak intensity in tetragonal BaTiO3 during unloading in-situ neutron scattering experiment..................................................................................... 6
Figure 1-4: Ratio of (200) and (002) peak intensity in tetragonal BaTiO3 during loading and unloading in-situ neutron scattering experiment.................................................. 6
Figure 2-1: Stress-strain hysteresis loop due to anelasticity........................................... 12 Figure 2-2: Strain response of a material under cyclic stress. ........................................ 13 Figure 2-3: Vector representation of complex modulus. ................................................ 14 Figure 2-4: Amplitude versus time for log decrement determination............................. 15 Figure 2-5: Resonance response of a material subjected to forced vibrations................ 16 Figure 2-6: Sketch of dynamic mechanical analyzer..................................................... 18 Figure 3-1: The crystalline structure of BaTiO3 (a) Cubic structure above the Curie
temperature; (b) Tetragonal structure with Ba2+ and Ti4+ ions displaced relative to O2- ions ..................................................................................................................... 30
Figure 3-2: Domain structure in tetragonal BaTiO3 ceramic.......................................... 30 Figure 3-3: DSC curves for barium titanate samples...................................................... 36 Figure 3-4: X-ray diffraction pattern for as-received BaTiO3 powder. .......................... 37 Figure 3-5: X-ray diffraction pattern for BaTiO3 sample sintered at 1000oC................. 37 Figure 3-6: X-ray diffraction pattern for BaTiO3 sample sintered at 1200oC................. 38 Figure 3-7: X-ray diffraction pattern for BaTiO3 sample sintered at 1250oC................. 38 Figure 3-8: X-ray diffraction pattern for BaTiO3 sample sintered at 1450oC................. 39 Figure 3-9: Cu K–α x-ray diffraction pattern for tetragonal BaTiO3.............................. 40 Figure 3-10: Evolution of (002) and (200) peaks in BaTiO3 with increasing sintering
temperature. .............................................................................................................. 40 Figure 3-11: Curve fitting for BaTiO3 sintered at 1350oC. ............................................. 41 Figure 3-12: Curve fitting for BaTiO3 sintered at 1000oC.............................................. 41 Figure 3-13: c/a ratio as a function of sintering temperature.......................................... 43 Figure 3-14: X-ray diffraction pattern for as–received BaTiO3 showing detailed peak
shape. ........................................................................................................................ 44 Figure 3-15: X-ray diffraction pattern for BaTiO3 sintered at 1200oC showing detailed
peak shape................................................................................................................. 44 Figure 3-16: X-ray diffraction pattern for BaTiO3 sintered at 1250oC showing detailed
peak shape................................................................................................................. 45 Figure 3-17: X-ray diffraction pattern for BaTiO3 sintered at 1450oC showing detailed
peak shape................................................................................................................. 45 Figure 3-18: SEM image of BaTiO3 sample sintered at 1000oC. ................................... 46 Figure 3-19: SEM image of BaTiO3 sample sintered at 1250oC..................................... 47 Figure 3-20: SEM image of BaTiO3 sample sintered at 1450oC. ................................... 47 Figure 3-21: Typical damping capacity profile for sintered BaTiO3 samples. Damping
capacity was measured at 1Hz. ................................................................................. 48 Figure 3-22: Illustration of domain wall motion in a ferroelectric material. .................. 49

ix
Figure 3-23: Ferroelastic switching in BaTiO3. .............................................................. 49 Figure 3-24: Optical microscope image of BaTiO3 sintered at 1250o C. ........................ 50 Figure 3-25: Optical microscope image of BaTiO3 sintered at 1450o C. ........................ 51 Figure 3-26: Domain structure of BaTiO3 sample sintered at 1250oC. .......................... 51 Figure 3-27: Domain structure of BaTiO3 sample sintered at 1450oC. .......................... 52 Figure 3-28: Damping capacity as a function of temperature for BaTiO3 samples
sintered at 1200oC, 1250oC and 1450oC. .................................................................. 53 Figure 3-29: Damping capacity, tanδ, of BaTiO3 ceramic above the curie temperature. 54 Figure 3-30: Effect of frequency on damping capacity profile of BaTiO3 ..................... 55 Figure 3-31: Comparison of tanδ values of BaTiO3 at different vibration frequencies. . 55 Figure 3-32: Decay of tanδ with number of vibration cycles .......................................... 56 Figure 3-33: Illustration of domain orientation before stress application....................... 57 Figure 3-34: Illustration of domain orientation after stress is applied............................ 57 Figure 3-35: Effect of increased stress on ferroelastic switching. ................................... 58 Figure 3-36: Effect of maximum strain on drop in tanδ with number of cycles............ 59 Figure 3-37: Partial recovery of decrease in tanδ after two days.................................... 60 Figure 3-38: Recovery of loss in tanδ after heating through Tc. .................................... 60 Figure 3-39: Damping capacity and modulus profiles of BaTiO3 as a function of
temperature. .............................................................................................................. 62 Figure 3-40: Stress- strain plots for BaTiO3 measured at temperatures below and above
the Curie temperature................................................................................................ 62 Figure 3-41: Optical image of Ni-BaTiO3 composite.................................................... 63 Figure 3-42: Damping capacity of Ni-BaTiO3 (Ni-34% BaTiO3) and monolithic Ni as a
function of temperature............................................................................................. 64 Figure 3-43: Damping capacity of Ni-BaTiO3 composites at different frequencies as a
function of temperature............................................................................................. 66 Figure 4-1: Poling process: (a) random arrangement of domains. (b) Domains begin to
align in the direction of applied electric field. (c) Fully polarized state. (d) Remnant polarization after removal of electric field................................................................ 69
Figure 4-2: Illustration of the direct piezoelectric damping model in metal matrix composites................................................................................................................. 70
Figure 4-3: Predicted joule heating versus volume fraction BaTiO3 for 1m3 of composite material. .................................................................................................................... 71
Figure 4-4: Poled PZT, open circuit. PZT bar is piezoelectric. ..................................... 74 Figure 4-5: Depoled PZT, open circuit. PZT is not piezoelectric.................................. 74 Figure 4-6: Poled Ni-PZT composite, closed circuit. PZT is piezoelectric. .................. 74 Figure 4-7: Depoled Ni-PZT composite, closed circuit. PZT is not piezoelectric. ....... 74 Figure 4-8: Optical image of a PZT bar coated with Ni layer ....................................... 75 Figure 4-9: Damping capacity behavior of Ni-PZT composites as a function of
temperature. .............................................................................................................. 76 Figure 4-10: Damping capacity values for Ni-PZT composites at selected temperatures.
................................................................................................................................... 76 Figure 4-11: Damping capacity of Cu-PZT composites as function of temperature....... 77 Figure 4-12: Possible damping mechanisms in poled Ni-PZT system, close circuit;
direct piezoelectric damping and ferroelastic domain switching.............................. 78

x
Figure 4-13: Possible damping mechanism in depoled Ni PZT system, closed circuit; ferroelastic domain wall switching. .......................................................................... 78
Figure 4-14: Damping capacity of poled and depoled PZT bars as a function of temperature ............................................................................................................... 80
Figure 4-15: Illustration of domain configuration in poled and depoled PZT................ 81 Figure 4-16: Illustration of domain alignment in poled and depoled PZT. .................... 81 Figure 4-17: Ferroelastic damping in PZT as a function of temperature. Heating stage
1: high damping due to favorable domain orientation (due to poling) in direction of applied stress. Heating stages 2 and 3, low damping due to fewer domains aligned in direction of stress in the depoled state. ................................................................. 82
Figure 6-1: Illustration of electroless Ni plating bath..................................................... 88 Figure 6-2: Illustration of Ni electroforming bath. ......................................................... 91 Figure 6-3: Ni coated PZT ceramic sample. ................................................................... 91 Figure 6-4: Ni coated BaTiO3 sample............................................................................. 92 Figure 6-5: Image showing electroless Ni layer and electroformed Ni layer. ................ 92

xi
List of Tables
Table 3-1: c/a ratios for different BaTiO3 samples......................................................... 42 Table 3-2: Summary of damping capacity of Ni-34% BaTiO3 composite and Ni at
different temperatures ............................................................................................... 65 Table 4-1: Average tanδ values for Ni-PZT composites ................................................ 77 Table 6-1: Sensitizing and activating steps for electroless Ni plating ............................ 89 Table 6-2: Composition of Ni electroless plating Bath ................................................... 89 Table 6-3: Chemical list for electroless Ni plating .......................................................... 90

1
1 Chapter 1: Introduction, Research Objectives and Dissertation Format
1.1 Introduction
Damping capacity or internal friction is a physical property that measures the ability of a
material to convert mechanical energy of vibrations to heat which is dissipated through
the volume of the material. Damping decreases the amplitude of mechanical vibrations
which helps to reduce the harmful effects of noise and mechanical vibrations. Some of
the important consequences of uncontrolled mechanical vibrations include personal
discomfort, noise pollution, loss of accuracy in high precision instruments and fatigue
failure in mechanical structures.
A material that combines good mechanical properties and a high vibration damping
ability is therefore highly desirable for structural applications where the effect of noise
and vibrations are intolerable, for instance, in military submarine propellers and
aerospace structures. Materials that possess high damping abilities unfortunately usually
exhibit poor mechanical properties. For example although viscoelastic materials such as
natural rubber and other polymers and plastics have the ability to damp out vibrations,
their poor mechanical performance limit their use as structural materials. Furthermore,
because of their low melting temperatures, polymers are not suitable for vibration
damping at elevated temperatures. Hence for applications that requires a combination of
good mechanical properties and good vibration and noise attenuation capability at
elevated temperatures, a high damping metal is the best option.
Most structural metals have low damping capacities. A table constructed by Sugimoto
[1] that compares specific damping index and tensile strength of common structural
metals indicate that a high damping capacity is often associated with a low tensile
strength. The reason for this behavior is due to the fact that the mechanisms that
generally enhance damping capacity in metals negatively influence mechanical properties
as well.

2
An intuitive approach to enhance the inherent damping capacity of structural metals
while maintaining good mechanical properties is by reinforcing the metal matrix with a
second component. The often cited example is grey cast iron which is well known and
used extensively for various applications because of its high damping capacity. The good
vibration damping ability in grey cast iron is attributed to dislocation damping in the
graphite precipitates [2] and also due to the energy dissipated at the interface between
iron and graphite. To mimic the high damping of the natural composite, grey cast iron,
the damping behavior of several metal matrix composites reinforced with graphite and
other reinforcement materials have been analyzed by several authors [3-5].
When a metal matrix is reinforced with a second phase, the main sources of energy
dissipation that leads to vibration damping are:
1. Viscous sliding at the metal-reinforcement interface.
2. Increased dislocation density at matrix areas close to the interface which
result from thermal mismatch between the metal and reinforcement.
3. The intrinsic damping of the reinforcement.
Traditionally, ceramics such as alumina (Al2O3), silicon carbide (SiC) and titanium
diboride (TiB2) have been used to reinforce metal matrices. These materials exhibit low
damping and the contribution of their intrinsic internal friction to the overall damping
capacity of the composite is insignificant. To increase the damping obtained in metal
matrix composites, high damping reinforcement materials such as shape memory alloys
[6] and magnetostrictive materials [7] have been used with varying degrees of success.
In these composites, the inherent damping capacity of the reinforcement is a major
contributor to the vibration damping in the composites.
In this work, we explore two high damping materials, ferroelectric and piezoelectric
ceramics, that can be used to augment the damping capacity of structural metals.
Ferroelectric and piezoelectric ceramics can exhibit considerable high vibration damping
capacity due to the anelastic response of ferroelastic domains to an external applied
stress. If an external electric circuit with appropriate resistance is connected to a

3
piezoelectric ceramic, vibration damping is enhanced by the conversion of vibration
energy to electrical energy by the piezoelectric ceramic which is then dissipated as heat
through the external circuit.
1.2 Research Objectives
The current research is divided into two main parts. Part one builds on previous efforts
aimed at understanding the damping behavior of ferroelectric ceramic reinforced metal
matrix composites. In the second part of this project, we explore the damping capacity
behavior of a piezoelectric ceramic embedded in a metal matrix.
1.2.1 Ferroelectric Ceramic Reinforced Metal Matrix Composites
(FRMMC)
FRMMCs are metal based composites reinforced with ferroelectric ceramic purposely to
augment the vibration damping ability of the metal [8, 9]. In previous studies, the
vibration damping behavior of several metal matrices reinforced with particulate barium
titanate was studied. Ferroelastic domain switching was proposed as the main damping
mechanism in these composites. The ferroelastic damping model assumes that
mechanical vibrations from the metallic matrix is transferred to the ferroelectric
reinforcement. The cyclic stress from the vibrations then causes the ferroelastic domains
to switch back and forth. Each cycle of ferroelastic switching absorbs and dissipates
vibrations as heat thus ultimately damping out the vibration.
1.2.1.1 Verification of Ferroelastic Domain Switching Damping Mechanism
In order to verify the ferroelastic domain switching as a major damping mechanism in the
composite, in-situ neutron scattering experiments were performed on a copper-tin metal
matrix reinforced with barium titanate (BaTiO3) particulates. The neutron diffraction
experiments were performed on the Spectrometer for Materials Research at Temperature
and Stress (SMARTS) at the Los Alamos Neutron Science Center (LANSCE). The
composite samples in the shape of cylinders were loaded in compression and then
unloaded. Neutron diffraction data were collected at specific stress values during the

4
loading and unloading experiments. The diffraction results indicated stress transfer from
the metal matrix to the BaTiO3 reinforcement which caused ferroelastic domain
reorientation. Figure 1-1 [10] shows the neutron diffraction peaks of the (200) and (002)
planes in tetragonal BaTiO3 at different stress levels during the compressive loading
experiments. We can observe a shift in the intensity of the peaks as the compressive
stress was increased from 1MPa to 80MPa. The peak shifting is due to ferroelastic
domain switching or reorientation of the ferroelastic dipoles in response to the
compressive stress. The change in peak intensities of the (200) plane (i200) and intensity
of the (002) plane (i002) during the loading experiments is shown in Figure 1-2 [10]. In
this plot the peak intensity, i200, increases with increasing compressive stress at the
expense of the peak intensity i002.
0.00E+00
1.70E-07
3.40E-07
2.50E+01 2.60E+01 2.70E+01
1MPa24MPa48MPa72MPa80MPa
Time of flight
Nor
mal
ized
inte
nsity
Noticeable peak shifting during compressive loading
Figure 1-1: Shift in (200) and (002) peak intensity in tetragonal BaTiO3 during compressive loading in-situ neutron scattering experiment.

5
Figure 1-2: Estimated change in intensity of (200) and (002) peaks in tetragonal BaTiO3 during compressive loading in-situ neutron scattering experiment.
The (200) and (002) peak positions during the unloading experiments are shown in
Figure 1-3 [10]. Here we can observe a less noticeable peak shift during the unloading
experiments. This showed that not all of the ferroelastic domains that switched during
the loading phase reverted back to their initial state after stress removal. Figure 1-4 [10]
shows the change in the ratio of the i002/i200 peak intensities for both the loading and
unloading experiments. We can see that the initial value of the ratio i002/i002 was about
0.6 and decreased progressively as the compressive stress was increased. Upon complete
removal of the compressive stress, the value of the i002/i200 came up to about 0.4,
showing that not all the domains that switched during loading reverted back the their
original orientation after stress removal.

6
0.00E+00
2.50E-07
5.00E-07
2.50E+01 2.60E+01 2.70E+01
80MPa72MPa48MPa24MPa1MPa
Time of flight
Nor
mal
ized
inte
nsity
Less noticeable peak shifting during unloading
Figure 1-3: (200) and (002) peak intensity in tetragonal BaTiO3 during unloading in-situ neutron scattering experiment.
0
0.2
0.4
0.6
0.8
1
1.2
-80-70-60-50-40-30-20-100
i002/i200 b1 A3 (raw)I002/I200 b2 A3i002/i200 b1 b3I002/I200 b2 (B3)
i002
/i200
b1
A3
(raw
)
EndStress
i002/i200
Figure 1-4: Ratio of (200) and (002) peak intensity in tetragonal BaTiO3 during loading and unloading in-situ neutron scattering experiment.

7
Similar results of some ferroelastic domain not switching back after stress removal has
been reported by Forrester et al [11]. In-situ neutron scattering compression loading
experiments on polycrystalline BaTiO3 showed that at a maximum load of 150MPa, 12%
of the ferroelastic domains are switched. Upon removal of the load, the authors
calculations revealed that about 5% of the 12% of domains that switched reversed while
the rest stayed in the new orientation. Hence an important question that can be asked is
that if some of the switched domains are not reversible during each loading cycle; will
the damping capacity of BaTiO3 (which originates from ferroelastic domain switching)
saturate after a specific time period of vibration? In this research we will investigate the
effect of vibration cycling on the damping capacity of BaTiO3 in an attempt to answer the
above question.
1.2.1.2 Damping Capacity Behavior of Metal- BaTiO3 Composites
In our earlier experiments, the damping capacity of particulate BaTiO3 reinforced metal
matrix composites was found to be dependent on temperature, the volume fraction of
reinforcement and most importantly on the particulate size of the BaTiO3 reinforcement.
The damping capacity of the composites was high from room temperature up to the Curie
temperature (Tc) of BaTiO3 after which there was a decrease in damping capacity. It was
obvious that the drop in damping capacity was due to the disappearance of the
ferroelectric domain structure in BaTiO3 above Tc.
In Cu-BaTiO3 (Cu-30vol % BaTiO3) composites fabricated using BaTiO3 particulates of
average size 2µm and 66µm [9], the damping capacity of the composites reinforced with
2µm particles was found to be considerably lower when compared to the composite with
66µm particulates. This behavior in the damping capacity values was attributed to the
decrease in ferroelectric properties of BaTiO3 as particle size decreases.
BaTiO3 has been known to exhibit grain size or particle size effect [12-14]. Grain size or
particle size effect is a phenomenon where there is a dramatic change in the physical
properties of certain materials’ changes in grain size or particle size. The decrease in
tetragonality with deceasing grain size has important consequences on many of the
physical properties of BaTiO3. A common example is the enhanced dielectric response

8
of polycrystalline BaTiO3 with grain-size of about 1µm [15]. In order to optimize
vibration damping in metal-BaTiO3 composites, it is imperative to understand the effect
of microstructural morphology on the damping capacity of BaTiO3. We will therefore
study the influence of microstructural morphology on the damping capacity of bulk
BaTiO3.
In summary, the present understanding of ferroelastic damping in BaTiO3 reinforced
metal matrix composites can be stated as follows:
1. Below Tc, ferroelastic damping is a major contributor to vibration damping in
composites reinforced with large BaTiO3 particulates.
2. Ferroelastic damping increased with increasing volume fraction of BaTiO3
particulates.
3. At the same volume fraction, ferroelastic damping decreased with decreasing
particulate size of BaTiO3. This was due to the fact that the tetragonality of
BaTiO3 decreased with decreasing particulate size.
As stated earlier, the primary objective of part of this thesis is to investigate the effect of
continuous cycling over a long time period on ferroelastic domain damping in BaTiO3
and to explore the influence of microstructural morphology on damping capacity.
Additionally, the damping behavior of a nickel–BaTiO3 laminate composite will be
examined. Since damping capacity of particulate BaTiO3 diminishes with decreasing
particulate size, it is expected that the use of bulk BaTiO3 sheet will provide better
vibration damping abilities than particulates. The laminate composite would be
composed of a layer of BaTiO3 sandwiched between two nickel layers.
The specific goals to be achieved are:
1. Fabricate and characterize BaTiO3 samples with different microstructural
morphologies.
2. Investigate factors that influence the dynamic mechanical response of bulk
BaTiO3 sheets.

9
3. Fabricate and analyze the damping behavior of nickel-BaTiO3 laminate
composites.
1.2.2 Piezoelectric Ceramic Reinforced Metal Matrix Composites (PRMMC)
The second part of this research deals with vibration damping analysis of metal-
piezoelectric ceramic composites. A damping mechanism based on the direct
piezoelectric effect has been proposed by Goff et al [16] for piezoelectric ceramics
embedded in a metal matrix. In this mechanism, it is assumed that stress from
mechanical vibrations is transferred from the metal matrix to the piezoelectric ceramic.
The stress induces electrical charges on the piezoelectric ceramic. With the metal matrix
completing the electrical circuit, the electrical charges are dissipated as joule heating
through the metal matrix.
The direct piezoelectric damping mechanism has not been verified experimentally in any
metal-piezoelectric ceramic system. This is due to the fact that the high temperatures
involved in traditional metal matrix composite processing are not suitable for the
piezoelectric ceramic. Piezoelectric ceramics looses their piezoelectric properties above
their Curie temperature, which for most ceramics is below the temperatures used in
traditional metal matrix processing techniques. The objective of this section of the
research is to investigate the mechanisms responsible for vibration damping in a nickel-
lead zirconate titanate (PZT) composite system.
The specific goals to be achieved are:
1. Embed a poled PZT ceramic in a nickel matrix at processing temperatures below
the Curie temperature of PZT.
2. Compare the damping behavior of composites fabricated using poled PZT and
composites fabricated using depoled PZT ceramic.
3. Investigate the main damping mechanisms in Ni-PZT composites.

10
1.3 Thesis Format
The rest of the thesis is arranged as follows:
Chapter 2 is a literature review on vibration damping in materials. The sources of energy
dissipation in materials that leads to vibration damping are reviewed.
Chapter 3 is concerned with fabrication and dynamic mechanical analysis of BaTiO3 and
Ni-BaTiO3 composites. BaTiO3 samples are characterized using differential scanning
calorimetry (DSC) and x-ray diffraction (XRD). The damping capacity of BaTiO3 and
Ni-BaTiO3 composites is determined using a dynamic mechanical analyzer (DMA).
Chapter 4 focuses on damping capacity evaluation of Ni-PZT composites. Here the
damping capacity of composites fabricated using poled PZT and depoled PZT ceramic
are compared.
In chapter 5, the major conclusions drawn from this study and the future direction of
metal-ferroelectric and metal-piezoelectric ceramic composites for vibration damping
purposes are discussed.
Chapter 6 provides details of the electroless plating and electroforming techniques used
to fabricate the Ni-BaTiO3 and Ni-PZT composites.
11
2 Chapter 2- Literature Review
2.1 Anelasticity in Materials
According to classical Hooke’s law, the strain response of a material to stress is elastic
and independent of time. Assuming Hooke’s law is true, then if a cyclic stress in the
form of mechanical vibrations is applied to a material, the resulting strain must be
proportional and in phase with the stress. The consequence of such a scenario is that the
material vibrates continuously with constant amplitude. In reality, this does not happen
since the amplitude of mechanical vibrations does decrease with time until it is
completely damped out. In order words, energy dissipation occurs in the material
resulting in vibration attenuation. This implies that Hooke’s law is not entirely obeyed.
There is in fact a time dependent component of strain that is out of phase with the applied
stress which accounts for the energy dissipation in materials. The time dependent part of
the strain is called anelasticity [17-22] and the energy dissipated is known as material
damping or internal friction. Anelasticity occurs to some extent in all materials. In most
structural metals, with the unique exception of grey cast iron [23, 24], the energy
dissipated is so small that it may not be observed during measurement. The anelastic
effect in structural metals can, however, be significant depending on factors such as
composition, microstructure, stress and temperature. The general mechanisms for energy
dissipation or anelasticity in materials are reviewed later on in this chapter.
2.1.1 Quantifying Material Damping
If a material is taken through one complete reversible stress cycle, an elastic hysteresis
loop like the one shown in Figure 2-1 is formed. The amount of energy dissipated within
the material is the difference between the work done in straining the material and the
work done by the elastic restoring forces. The total energy dissipated within the material
for the complete cycle can be found by calculating the area enclosed by the hysteresis
loop [25, 26]. The size of the hysteresis loop can therefore be used as a qualitative tool in

12
comparing the vibration damping abilities of different materials if measurements are
performed under similar conditions.
ε
σ
εo
σo
Figure 2-1: Stress-strain hysteresis loop due to anelasticity.
Several factors are used to quantify material damping. Very often, the use of a particular
damping quantity depends on the researcher and on the type of instrument available for
measurement.
When a cyclic stress σ is applied to a material, the cyclic strain response ε, the stress by a
phase angle δ as represented in Figure 2-2.

13
δ
ωt
Amplitude
σmaxεmax
Stress
Strain
Figure 2-2: Strain response of a material under cyclic stress.
Mathematical expressions for the stress and strain may be written as
tmax
iωeσσ = [1]
⎟⎠⎞
⎜⎝⎛ −
=iδiω
eεεt
max [2]
where σmax and εmax are the stress and strain amplitudes respectively. ω is the angular
frequency and t is time. The complex modulus, Ec for the material can easily be derived
by dividing the stress by the strain,
max
max ⎟⎠⎞
⎜⎝⎛
⎟⎠⎞
⎜⎝⎛ =
ωiδe
ε
σωcE [3]
Equation 2.3 can further be expressed as

14
⎟⎠⎞
⎜⎝⎛
⎟⎠⎞
⎜⎝⎛⎟
⎠⎞
⎜⎝⎛ =
ωiδeωEωcE [4]
( ) ( ) δsinEiδcosEcE += [5]
Equation 5 is represented as a vector diagram Figure 2-3.
|E|
δ
Eװ
Eו
Figure 2-3: Vector representation of complex modulus.
The tangent of the phase angle δ, tanδ is calculated as
( )( ) E'
E"δcosE
δsinEtanδ == [6]
E″ and E′ are the storage modulus and loss modulus of the material, respectively. The
storage modulus represents the amount of mechanical energy stored during deformation
while the loss modulus denotes energy lost as heat during the same deformation cycle.
The tangent of the phase angle, tanδ, is a dimensionless physical property which is
referred to as damping capacity. The damping capacity of a material is a measure of the
amount of energy dissipated as heat during one cycle of mechanical vibration. Typical
values of tanδ ranges from 0.001 to 0.01 for most structural metals, 10-4 to 10-5 for
structural ceramics and >2 for natural rubber and viscoelastic polymers. Any metal with
tanδ above 10-2 is classified as a high damping metal or HIDAMET [1]. Examples of

15
HIDAMETs include the Cu-Mn based alloy Sonoston [27, 28] and the Fe-Cr based metal
Silentalloy [1, 29].
Besides tanδ, other factors are used frequently to represent vibration damping in metals.
The specific damping capacity, ψ, is defined as the ratio of the total energy dissipated per
cycle of vibration, ∆W, to the maximum energy stored per cycle of vibration, W, that is,
W∆Wψ = [7]
The expressions for ∆W and W are given in Equations 8 and 9 respectively as
2o
''ω2π
0
επEσdε ∆W ∫ == [8]
2εEεdεE W
2o
'ε
0
'o
∫ == [9]
Another damping factor, the logarithmic decrement, τ, measures the rate of vibration
amplitude decay as a function of time when a material is allowed to vibrate freely after an
initial exciting force is removed. A typical logarithmic decrement curve is shown in
Figure 2- 4.
Amplitude
Ao
An
time
Figure 2-4: Amplitude versus time for log decrement determination.

16
The logarithmic decrement is given as,
⎟⎟⎠
⎞⎜⎜⎝
⎛=
+no
o
AAln
n1lnτ [10]
Ao and An are vibration amplitudes located n cycles from each other.
The inverse quality factor Q-1 is obtained from the resonance response peak curve of a
material subjected to forced vibrations such as illustrated in Figure 2-5.
ω1 ωr ω2
Amplitude
Amax/√2
Amax
ω
Figure 2-5: Resonance response of a material subjected to forced vibrations.
r
211
ωωωQ −
=− [11]
ωr is the resonance frequency, ω1 and ω2 are the frequencies on either side of ωr where
the amplitude is 1/√2 of the resonance amplitude.
When the damping capacity is low, that is, tanδ <<< 0.1, the various factors are
interchangeable and are related by Equation 12 [19, 30].

17
2πψ
πτQδtanδ 1 ===≅ − [12]
2.2 Applications of Internal Friction
Below is a list of some of the important applications of internal friction measurements.
1. High damping materials are used for vibration suppression structural elements
such as turbine blades, hulls of ships and transmission wires.
2. Internal friction measurement have been used by physicists and material scientists
for the study of crystal defects and atomic level phenomena such as diffusion and
phase transformations in materials
3. In industry, internal friction measurements are utilized as a quality control tool for
nondestructive testing; for example, to evaluate defect concentration in welded
joints and cast parts.
2.3 Apparatus for Measuring Material Damping
A number of instruments have been developed to measure damping capacity. Excellent
reviews on internal friction measuring techniques has been done by Zhang et al [31], and
Riviere [32]. Although the instruments may differ in design and construction, the
underlying principle is the use of either free or forced vibration techniques to measure
damping capacities of materials. In experiments involving free vibrations (free decay),
the material is allowed to vibrate at its natural frequency after an initial exciting force is
removed. The torsion pendulum, developed by Ke [33] is an example of an instrument
based on free decay. In forced vibrations, a periodic exciting force is applied for
determination of resonant frequencies from which the damping capacity of the material
can be determined. Examples of measuring equipment based on forced vibration

18
techniques are the free-free beam and the piezoelectric ultrasonic composite oscillator
(PUCOT) [26, 34].
In this work, a dynamic mechanical analyzer (DMA) was used for tanδ measurements. A
DMA is a versatile instrument capable of simultaneously measuring many dynamic
mechanical properties of materials. For example, tanδ, phase transition temperature and
dynamic elastic modulus of a material can be obtained from a single DMA scan. The test
is non-destructive and it offers the flexibility of testing relatively small samples in several
test configurations. The TA DMA model Q800 used in this study is equipped with a
three-point bending platform, tensile and compression platforms and a platform for
performing cantilever type experiments. The frequency range for this particular DMA is
from 1Hz to 100Hz. The upper limit of the DMA furnace is 600oC. The lower
temperature limit, however, depends on the type of cooling system employed. -145oC
can be reached if the equipment is cooled with liquid nitrogen.
Displacement signal
Oscillator
Sample platformSample
Furnace
Force
Figure 2-6: Sketch of dynamic mechanical analyzer.
In a typical DMA test, the material is subjected to forced cyclic force. The cyclic strain
lags the applied force by phase angle δ. Damping capacity results computed by a

19
computer program is presented in the form of tanδ as a function of temperature or
frequency.
2.4 Mechanisms for Material Damping
Vibration damping occurs in materials because of internal resistive forces that interact
with cyclic stresses from mechanical vibrations. The type of interaction differs for the
different classes of materials. For example, dislocation motion is known to be a main
damping mechanism in metals while the high damping in polymeric materials is due to
elongation of long polymer chains. Even within the same class of materials, the
interactions leading to damping can be very different because of different microstructural
configuration. The damping capacity in a material is generally due to the sum of several
energy dissipative mechanisms. The purpose of this section is to briefly review some of
the important mechanisms that lead to vibration damping in materials.
2.4.1 Point Defect Damping
Vacancies, self interstitial atoms, substitutional or interstitial impurity atoms are single
point defects localized over a few atomic sites in a crystal. Point defect pairs can also
occur when two single point defects such as a vacancy and a substitutional atom are
formed together. Defect pairs are more common in ionic crystals where a single defect in
one sublattice must be compensated for by a defect of opposite charge in the other
sublattice to maintain electrical neutrality.
When a point defect is introduced into a perfect crystal, the defect destroys the symmetry
of the perfect crystal creating what is known as defect symmetry. The defect symmetry
can only be equal to or less than the symmetry of the perfect crystal. If the defect
symmetry is less than that of the perfect crystal, then there exist more than one
distinguishable configurations or orientations of the defect [35]. A point defect in a
perfect crystal also creates an elastic distortion leading to the formation of an elastic
dipole, λ [20]. The elastic dipole, λ, is unique to a particular orientation of the point

20
defects. Thus, point defects that have different orientations are represented by different λ
tensors.
When a homogenous stress is applied to a crystal containing a point defect with two
orientations represented by elastic dipoles λ1 and λ2, the stress-elastic dipole interaction
will be energetically favored in one orientation than the other. This leads to a
redistribution of the point defects over the two orientations. The reorientation of the
dipoles results in anelastic relaxation and energy dissipation [17]. Thus for point defect
damping to occur, the defect symmetry must be lower than the perfect crystal symmetry.
In other words, the number of independent λ (or point defect orientation) must be greater
than 1. Consequently, point defect relaxations occur in low symmetry defects such as
vacancy-impurity pairs and di-vacancies. On the other hand, point defect damping does
not occur in defects such as single vacancies since the defect symmetry is equal to that of
the perfect symmetry. In metals, Snoek [36] and Zener [21] relaxations are common
examples of point defect damping. The Snoek relaxation involves interstitial solute
atoms in bcc metals, for example interstitial carbon in iron. Zener relaxation which
involves the reorientation of solute atom pairs occurs in fcc, hcp and bcc metals.
2.4.2 Dislocation Damping
A dislocation is a line defect that extends over a macroscopic distance in one dimension.
Read [37] recognized dislocation motion as the primary mechanism for damping in pure
metals at ambient temperatures. Read observed that the damping capacity profiles for
pure metals could be divided into two distinct regions: a strain-independent part at small
strains and a strain-dependent part which occurs above strain amplitudes of the order 10-7
- 10-6. The vibrating string model (GL model) initially suggested by Koehler [38] and
later developed by Granato Lückee [39, 40] has been used to explain the amplitude
independent and amplitude dependent part of Read’s observation. The model depicts the
motion of a dislocation segment of length l pined at its ends undergoing forced vibration
due to an externally applied cyclic stress with frequency ω. The equation of motion takes
into account the effective mass of the dislocation, a damping term B and a restoring force.
Values of B calculated by Elshelby for several metals are available in a book by Mason

21
[18]. The expression for the amplitude-independent damping at low strains (<10-6) is
given by equation 13
2
4
36GbωΛBltanδ = [13]
Where Λ is the dislocation density, G is the shear modulus and b the magnitude of the
Burgers vector.
In a typical material there will be a distribution of dislocation segments of which some
are weakly pinned while others are strongly pinned. Some of the weakly pinned
dislocations may break away as strain amplitude increases while the strongly pinned
dislocations are anchored at the major pining points. The amplitude dependent part of
dislocation damping sets in when the breakaway dislocations sweep out an increased area
on the slip planes resulting in a sharp increase in damping. For an exponential
distribution of dislocation loop lengths, the amplitude- dependent damping predicted by
the GL model is
⎟⎟⎠
⎞⎜⎜⎝
⎛ −=
o
2
o
1
εCexp
εCδ [14]
C1 and C2 are physical constants which depend on anisotropy of the material’s elastic
constants, the orientation of specimen with respect to applied stress, the size of pinning
solute atoms, the lattice parameter of specimen and the dislocation density [26].
2.4.3 Grain Boundary Damping
Grain boundaries are disordered regions separating different grains in polycrystalline
materials. Damping by viscous grain boundary sliding was first proposed by Zener [21]
and later experimentally analyzed by Kê [33]. Ke’s experiments on single crystal
aluminum and polycrystalline aluminum revealed a damping peak in polycrystalline
aluminum at 285oC at vibration frequency of 0.8Hz which was completely absent in

22
single crystalline aluminum. Since then, several grain boundary damping peaks have
been observed in both metallic and ceramic systems. Examples include copper (99.999%
purity) at 250oC, pure iron at 490oC, and Ni-Cr alloy at 817oC [41].
2.4.4 Thermoelastic Damping
Thermoelastic damping describes energy dissipation arising from stress induced thermal
gradients in a material. When a material is heated, the temperature rise causes
dimensional changes. Likewise when a material is stressed, the strain developed causes a
rise in temperature. If the stress is homogeneous, the strain response is uniform and the
temperature rise is even throughout. If the stress is inhomogeneous, local thermal
gradients are developed in the materials which results in heat flow. The heat flow causes
anelastic strain and hence, energy dissipation. Thermoelastic damping therefore occurs
in heterogeneous deformations such as bending in beams, where heat flow from hotter
compressive regions to colder sections in tension. In metal matrix composites, the
existence of high stress concentrations around reinforcement phases causes thermal
gradients during vibration [18, 31]. Thermoelastic damping is dependent on the
frequency of vibration. If the frequency of oscillation is very rapid, there will be no time
for heat equilibrization. If the oscillation is too slow, the material stays in thermal
equilibrium with no energy dissipation. Bishop and Kinra [42] investigated thermoelastic
damping in particulate reinforced alumina composites. Their results indicate
thermoelastic damping is only significant at frequencies above 100Hz.
2.4.5 Interfacial Damping
The Schoeck theory has been used to describe material damping arising from the
interface formed between precipitates and a metal matrix [43]. This theory identifies two
types of precipitates that will lead to material damping: precipitates that are coherent and
have the same elastic constants as that of the matrix, and precipitates that are incoherent.
According to the Schoeck’s theory, material damping occurs due to interfacial relaxation
and anelastic strain arising from dislocations in the regions near the interface. This type
of damping is proportional to the volume fraction of the precipitates.

23
Another mechanism by which vibration energy can be dissipated at interfaces is by
sliding at weakly bonded interfaces. Details of the interfacial slip model has been
covered in great detail by Nelson and Hancock [44].
2.5 Domain Damping
A domain is a structural unit that occurs in certain materials due to the preferred
orientation of dipoles (examples are magnetic and electric dipoles). Adjacent to one
domain are other domains that are oriented approximately at right angles to the previous
domain resulting in domain structures that are separated by 90o or 180o domain walls.
2.5.1 Ferromagnetic Domain Damping
This form of damping occurs in metals such as nickel and iron which contain magnetic
domains. Basically the damping that arises from magnetic domains may be classified
under three mechanisms [45, 46],
1. Microeddy currents: this form of damping occurs due to the generation of eddy
currents caused by local changes in magnetization arising from stress induced
domain wall displacement. The damping capacity by this mechanism is largest in
the demagnetized state when domain wall area is large but decreases gradually
with increasing magnetization. Eddy current damping vanishes when the material
is fully magnetized when there is a great reduction in domain wall area.
2. Macroeddy current: damping is due to the bulk response to the change in
magnetic flux across a magnetic material under stress. Variation of the magnetic
field as a function of stress under cyclic stress results in eddy-currents being
generated in the sample. The eddy currents are dissipated as Joule heating
through the material. For most magnetic materials, macro eddy current shows a
maximum at intermediate magnetization.
3. Hysteresis damping: hysteresis damping occurs in magnetic materials because the
domain wall motion lags behind the applied stress. During mechanical vibrations,
the domain walls move back and forth and since the resulting strain is anelastic, a
hysteresis stress-strain loop is obtained. The magnitude of the hysteresis damping

24
is proportional to the area enclosed by the hysteresis loop for one complete stress
cycle.
2.5.2 Ferroelastic Domain Damping
The ferroelastic material is defined by having microstructural twins which can be
switched by the application of an external stress. Ferroelastic domains form as a result of
transformation twinning when the material is cooled from the high temperature
paraelastic state to the low temperature ferroelastic state. As in magnetic domains, the
motion of ferroelastic domain walls under the influence of a cyclic stress is irreversible
and results in a hysteresis stress strain diagram with associated vibration energy
dissipation. The response of certain ferroelastic minerals to cyclic vibrations is thought
to be important in the dissipation of seismic vibrations [47, 48].
2.5.3 Damping in Ferroelectric Materials
Ferroelectric materials exhibit a spontaneous ionic polarization below the Curie
temperature. Below the Curie temperature, the ferroelectric material has two or more
orientation states that can be shifted from one state to the other using an electric field.
The most common domain structure of ferroelectric ceramics consists of 180o
ferroelectric domains and 90o ferroelastic/ferroelectric domains. Hence 90o domains are
affected by stress and electric fields, while the 180o domains are only affected by electric
field. Material damping due to ferroelastic switching of the 90o domains under cyclic
stresses therefore occur in ferroelectric ceramics.
In addition to damping arising from ferroelastic domain switching, other material
damping peaks have been observed in ferroelectric ceramics which are attributed to the
interactions of 90o domain walls with point defects. Postnikov et al [49, 50] have derived
the damping resulting from the domain wall interactions with point defects. Two
mechanisms were considered by Postnikov: (1) interactions of mobile 90o domain walls
with mobile defects and (2) interaction of immobile domain walls with mobile point
defect

25
2.5.3.1 Interactions of Mobile 90o Domain Walls with Mobile Point Defects
According to this theory, a 90o domain wall will move from its equilibrium position under
an applied stress to a new position which is defined by the elastic forces and the
interaction forces with point defects. The surface density of the domain wall charge is
proportional to the spontaneous polarization Ps. If it is assumed that the crystal contains
charged mobile defects, then these defects move towards the new wall position as a
function of time. Since the motion of defects is diffusion controlled, there is a phase lag
between stress and strain. Postnikov showed that a Debye relaxation peak is obtained
with
221
τω1ωτ∆Q
+=− [15]
22s
2
LβαGxΩ∆ = [16]
Where Ω is an orientation factor, xs is the spontaneous strain given by xs=c/a-1 for lattice
parameters c and a, the shear modulus G and L is the distance between the domain wall;
and τ is the relaxation time with activation energy equal to that of point defect diffusion.
It can be noticed from Equation 16 that the relaxation strength varies as the inverse of the
domain size.
2.5.3.2 Interaction of Immobile Domain Walls with Mobile Point Defect
This theory assumes that a mechanical stress induces piezoelectric charges at the domain
boundaries. The stress causes an increase in polarization of the domains oriented in the
direction of the tension and a decrease in the polarization of those oriented in the
direction of compression. The change of polarization ∆P in the direction 3 due to the
applied stress is expressed as
( )σ3133 ddP −=∆ [17]

26
where dij are the piezoelectric constants. Due to the change of polarization, a bound
electric charge appears at the domain wall with a density
( )σρ 31332 dd −= [18]
The bound charges induce an electric field change within the domain and this is
accompanied by additional deformation of the crystal due to inverse piezoelectricity. As a
function of time, these charges are compensated by the mobile charged point defects,
which diffuse in the electric field towards the domain walls in order to achieve
equilibrium. However, the equilibrium established requires time and the additional
deformation is anelastic. For small concentration of mobile point defects, Postnikov
derived the height of the Debye internal friction peak as
( )
kTskkLcddQ
or
o224
2231331
max2
π−
=− [19]
Where co is the equilibrium concentration of points defects (in the absences of an electric
field). L is the domain wall width; s the elastic shear compliance, kr is the dielectric
constant and ko the vacuum permittivity. From equation 21, it can be seen that the
damping capacity is dependent on the square of the domain size.
2.5.3.3 Ferroelectric Damping Due To Viscous Domain Wall Motion
Wang et al [51] derived the internal friction relationship for the viscous motion of domain
walls by considering the various forces acting on the domain wall. If Fext is the force on
the domain wall resulting from the applied external stress, then other forces acting on the
domain wall can be identified. These are the interaction force between the nearest
neighbor domain walls, F1, the viscous force, -η..
x , resulting from the movement of the
domain walls in the lattice, and the recovering force –kox due to pinning defects. The
equation of motion of a domain wall under an applied stress is given as:

27
exto FFxkxxM =−+η+ 1
...
[20]
Where η is the coefficient of viscosity, x the domain wall displacement and M is the
effective mass per unit area of the domain wall. Expressions derived by Wang for F1, Fext
from the energy changed due to domain wall motion are,
[ ]
dx
F
xNCF
sij
dij
ijsijext
sijijij
εε
σε
ε
=
=
−=
2
2 21
[21]
where sijε is the spontaneous shear strain, Cijij is the corresponding elastic constants, ijσ is
the effective shear stress which provides the domain wall motion, dijε is the shear strain
caused by the displacement x of the domain wall under the applied stress, N is the number
of parallel walls per unit length and d is the distance between the nearest-neighbor
walls(N=d-1).
When a periodic stress is applied, the internal friction peak is given as:
[ ]22
2
1
12
τωωτε
+=−
JkN
Qsij [22]
J is the compliance and kη=τ is the relaxation time.
The energy absorbed and dissipated by ferroelectric ceramics can be considerable; thus,
there is ongoing effort to use the energy dissipation property in ferroelectric ceramics
toughen other materials [52, 53].
2.6 Summary
The anelastic response of materials to applied stress results in material damping.
Mechanisms that lead to vibration damping are different for different class of materials.
In metals, vibration energy dissipation damping is mostly due to point defect damping,
dislocations damping, and grain boundary damping. The energy dissipated through these

28
mechanisms is usually low, resulting in low damping abilities in structural metals.
Efforts have been made to increase the damping capacity of structural metals by using
high damping materials such as shape memory alloys and magnetrostrictive materials. In
the next chapter, ferroelastic domain damping in ferroelectric BaTiO3 is explored as a
high damping mechanism for metal matrix composites.

29
3 Chapter 3: Damping in BaTiO3 and Ni-BaTiO3 Composites
3.1 Introduction
BaTiO3, the first commercial piezoelectric ceramic, was independently discovered by
researchers in USA, Japan, and Russia in the early 1940s. BaTiO3 and its chemical
modified variants like barium strontium titanate are widely used in a variety of
applications including actuators, sensors and transducers.
BaTiO3 assumes five different crystal structures: hexagonal, cubic, tetragonal,
orthorhombic, and the rhombohedral structures. The hexagonal and cubic structures are
paraelectric while the tetragonal, orthorhombic and the rhombohedra forms are
ferroelectric. Above 1460oC, the hexagonal structure is stable. On cooling BaTiO3
below 1460oC, a reconstructive transformation of the hexagonal phase to the cubic phase
occurs. Of utmost importance is the paraelectric- ferroelectric transition which occurs at
the Curie temperature (around 130oC). At the Curie temperature (Tc), paraelectric cubic
BaTiO3 transforms into the ferroelectric tetragonal structure by elongating along an edge.
The tetragonal phase is stable until 0oC where it transforms into the orthorhombic phase
by elongating along a phase diagonal. Finally, there is a low temperature transition of the
orthorhombic phase to the rhombohedral phase at -90oC. For the purpose of this work,
only the tetragonal and cubic phases will be referred to.
In BaTiO3, the paraelectric to ferroelectric transition at the Curie temperature (Tc) occurs
around 130oC when the ceramic is cooled from high temperatures. Below the Curie
temperature the paraelectric cubic crystal structure transforms to the ferroelectric
tetragonal structure. Both the tetragonal and cubic crystal structures are based on the
perovskite structure. Named after the mineral form of calcium titanate (CaTiO3), the
perovskites are represented by the general formula ABO3. The structure can be
visualized as a simple cubic unit cell with A2+ cations occupying the corners, and the
relatively smaller B4+ cations at the body center position The oxygen ions (O2-) occupy
the face center positions. Figure 3-1 shows schematically atom positions in cubic and
tetragonal BaTiO3.

30
Ti4+ Ba2+O2-
Cooling below Tc
Cubic Tetragonal
Figure 3-1: The crystalline structure of BaTiO3 (a) Cubic structure above the Curie temperature;
(b) Tetragonal structure with Ba2+ and Ti4+ ions displaced relative to O2- ions
On cooling cubic BaTiO3 below the Curie temperature, there are three different directions
along which the cubic unit cell can elongate to form the tetragonal structure. When the
cubic unit cell elongates to form the tetragonal structure, the Ba2+ and Ti4+ ions are
slightly displaced relative to the O2- ions, Figure 3-1. The ion arrangement results in the
formation of electric dipoles which are grouped in domains structures and are separated
from each other by domain walls. The most common domain structures in BaTiO3 are
the 90o and 180o domains. Figure 3-2 is an SEM image that shows the domain structure
of a polycrystalline BaTiO3 ceramic.
2µm
90o
180o
Figure 3-2: Domain structure in tetragonal BaTiO3 ceramic. (Image taken by author)

31
The high vibration damping capacity in tetragonal BaTiO3 is attributed to the motion of
domain walls. Since there is no domain structures in cubic BaTiO3 the damping capacity
is very low. Therefore in our application of BaTiO3 ceramics for vibration damping
purposes, it is imperative that the tetragonal structure is maintained during composite
processing.
Although tetragonal BaTiO3 is the normal crystal structure at room temperature, the cubic
crystal structure can become stable at room temperature under certain conditions such as
at small grain sizes or small particulate sizes. A decrease in tetragonality with decreasing
grain or particulate size has been observed in BaTiO3 by several authors. Over the years,
theories have been put forward to explain why the cubic structure shows metastably at
room temperature. Devonshire’s surface-modified phenomenological theory [54]
postulates that every BaTiO3 particle consists of a cubic outer shell of constant thickness
surrounding an inner tetragonal core. According to this theory, as the particle size
decreases, the influence of the tetragonal core decreases while that of the outer layer
increases until the particle becomes entirely cubic at the critical size. Uchino [55]
attributed the stabilization of the cubic phase to the suppression of the phase transition
temperature by the high surface energies in fine BaTiO3 powders. At the critical particle
size, it was explained that the surface energy becomes sufficiently high to bring down the
Curie temperature below room temperature.
Another explanation which has been advanced in powders produced by hydrothermal
processes is the presence of residual hydroxyl ions (OH-) occupying oxygen ion (O2-)
sites in the BaTiO3 lattice. The charge disparities introduced into the structure by the
presence of hydroxyl ions are supposedly compensated for by cation vacancies, which
according to Lu [56] suppress polarization of BaTiO3 crystals and make tetragonal
particles cubic.
A mathematical model developed by Shih et al [57] attributed high depolarization energy
in small BaTiO3 particles as the cause of room temperature cubic phase stabilization.
Shih explained that large depolarization energy in fine tetragonal powders makes the
tetragonal crystal structure unstable. In an effort to lower depolarization energy, the
32
tetragonal structure transforms into the non- polarized cubic phase. In contrast, large
crystals are able to decrease the depolarization energy by forming multi domains,
consequently stabilizing the tetragonal phase.
The effect of depolarization energy on the crystalline structure of fine BaTiO3 powders
was demonstrated by Liu et al [58]. The investigators reported that depolarization energy
of fine BaTiO3 could be decreased by coating the ceramic with a conductive material.
The tetragonality of fine powders, quantified by the c/a* ratio, increased when the
particles were coated with a thick layer of copper. The c/a ratio, however, decreased
when the copper coating was removed by oxidation.
The purpose of this chapter is to investigate factors that influence the damping capacity
of BaTiO3 and Ni-BaTiO3 composites.
3.2 Experimental Procedure
3.2.1 Fabrication of BaTiO3 Samples
BaTiO3 powder, 99.995% pure with average particulate size 2µm, was obtained from
Sigma Aldrich, St. Louis, MO, USA. X-ray diffraction (XRD) and differential scanning
calorimetry (DSC) were used to characterize the as received BaTiO3 powder. The
powder was dispersed in isopropyl alcohol in a plastic bottle. The dispersion was milled
using zirconia balls for 24 hours and then dried in an oven at 80oC for 24 hours. Green
BaTiO3 discs about 4mm thick and 25mm in diameter were prepared by using a two-
stage pressing technique. The powder was uniaxially pressed into discs using a pressure
of 100MPa. Uniaxial pressing was followed by cold isostatic pressing at 207MPa. Final
consolidation of the discs was achieved by sintering. The discs were placed on zirconia
crucibles and sintered in air for 2 hours in a furnace. Sintering temperatures were varied
between 1000o C and 1450oC to obtain BaTiO3 ceramics with different grain
morphologies.
*c/a ratio defined as the ratio of the lengths of the c and a lattice parameters in tetragonal barium titanate.

33
3.2.2 Characterization of Sintered BaTiO3
Characterization of the sintered BaTiO3 discs was performed using x-ray diffraction and
differential scanning calorimerty. The grain morphology and domain structure of the
sintered samples were examined using an optical microscope and a field emission
scanning electron microscope.
3.2.2.1 X-ray Diffraction
X-ray diffraction patterns were collected on a Panalytical powder diffractometer using Cu
K-α radiation source with nickel filter. The Xpert data collection software that comes
with the diffractometer is able to automatically remove the Cu K- α 2 diffraction peaks.
Diffraction patterns for BaTiO3 were collected at 2θ angles from 20o to 85o.
3.2.2.2 Differential Scanning Calorimetry
A Netzsch 449C DSC was used to observe the tetragonal to cubic phase transition of
barium titanate that occurs at the Curie temperature. Basically, the DSC measures the
difference in heat flow into two small metal pans, one containing the test sample and the
other, a reference sample, as the pans are subjected to a uniform heating or cooling
program under controlled atmospheres. If an endothermic reaction such as the tetragonal
to cubic transition in barium titanate occurs during the temperature ramp, additional heat
is added to the system to compensate for the heat absorbed during the transition process.
The reverse happens in an exothermic processes; the extra heat generated from the
reaction is removed from the system. This results in a change in the difference of heat
flow into the system which is displayed as a peak on a plot of heat flow as a function of
temperature. The peak height and peak area represent the transition temperature and the
amount of energy absorbed or released during the transition respectively.
A DSC scan provides an easy way for identifying the room temperature phase in barium
titanate. An endothermic peak between room temperature and 200oC will likely represent
the cubic to tetragonal phase transition that occurs at the Curie temperature. BaTiO3
titanate samples were heated from 50oC to 220oC using a heating rate of 10oC/min in
helium gas atmosphere.

34
3.2.3 Fabrication of Nickel BaTiO3 Composite (Ni-BaTiO3)
Several Ni-BaTiO3 laminate composites were fabricated for damping capacity evaluation.
The Ni-BaTiO3 composites were all fabricated using BaTiO3 ceramic sintered at 1350oC
for 2 hours. In order to fabricate a composite sample, a sheet of barium titanate ceramic
with dimensions 25mmx4mmx0.25mm was carefully sectioned from a sintered disc using
a Struers Accutom-5 cutting machine. The sheet was then coated with about 20µm layer
of nickel using an electroless coating technique. The electroless nickel coated sheet was
then used as the depositing electrode in nickel sulfamate electroforming bath. The
electroforming process was used to coat the BaTiO3 sheet to the desired thickness.
Details of the electroless and electroforming techniques are described in chapter 6.
3.2.4 Dynamic Mechanical Analysis of BaTiO3
Sample bars with dimensions 25mmx3mmx1mm were machined from sintered BaTiO3
discs for dynamic mechanical analysis. To prevent plastic deformation during damping
capacity measurements, the strain at the yield point for samples was determined prior to
damping capacity measurements. The samples were subjected to cyclic stresses in three-
point bending mode on a TA DMA model Q800 until failure. The strain at the yield
point was noted and used as the upper limit of strain used for measuring damping
capacity. Several DMA experiments on BaTiO3 were performed. Details of the
experiments are described below.
3.2.4.1 Effect of Microstructural Morphology on Damping Capacity
The damping capacity, tanδ, of three BaTiO3 samples sintered at 1200oC, 1250oC and
1450oC were investigated to determine the effect of grain morphology on vibration
damping in BaTiO3. Test samples were loaded in three point bending mode at maximum
strain of 0.03% and vibration frequency of 1Hz. Tanδ was measured as a function of
temperature from 50oC to 250oC.
3.2.4.2 Effect of Vibration Frequency on Damping Capacity of BaTiO3
Effect of vibration frequency on the damping capacity of BaTiO3 was investigated by
measuring tanδ as a function of temperature at frequencies of 0.1Hz, 1Hz and 10Hz.

35
3.2.4.3 Effect of Time on the Damping Capacity of BaTiO3
To study the effect of prolonged cyclic mechanical vibrations on tanδ, BaTiO3 samples
were subjected to oscillatory stresses at room temperature for 10 hours. The experiments
were conducted at a vibration frequency of 1Hz.
3.2.5 Dynamic Mechanical Analysis of Nickel- BaTiO3 Composites
Damping capacity of Ni- BaTiO3 composites was measured as a function of temperature
from 50oC to 250oC. The composite samples had dimensions of 26x3mmx0.75mm. For
comparison purposes, a sample of pure nickel fabricated using electroforming was also
tested under similar conditions. In addition, the effect of maximum strain and vibration
frequency on the damping capacity profile of the composites was also investigated.
3.3 Results and Discussion
3.3.1 DSC
Figure 3-3 shows the DSC curves for both the sintered BaTiO3 discs and the as received
BaTiO3 powder. The discs sintered at temperatures of 1200oC and above clearly show
the characteristic tetragonal to cubic phase transition that occurs at Tc. The endothermic
peaks confirmed the room temperature tetragonality of those samples. The peak heights
also generally increase with sintering temperature, an indication of increasing
tetragonality of BaTiO3 with sintering temperature.
The DSC curves for the as received sample and the sample sintered at 1000oC did not
give any peak throughout the temperature range tested. The absence of a peak between
50oC and 180oC suggests either the crystal structure of the as received powder and the
disc sintered at 1200oC might not be tetragonal at room temperature or the degree of
tetragonality is small. The DSC data and the absence of a peak on its own cannot be
entirely relied upon to conclude the presence of the room temperature cubic phase.
Additional quantitative analysis by x-ray diffraction is needed to make such conclusions.

36
50 100 150 200 250
Temperature (oC)
End
othe
rmic
up
1450oC
1250oC
1200oC
1000oC
As Received
1350oC
Figure 3-3: DSC curves for barium titanate samples.
3.3.2 X-ray Diffraction Results
The Cu-Kα x-ray diffraction patterns for the as-received BaTiO3 powder and sintered
BaTiO3 discs collected at 2θ angles from 20o to 85o are shown in Figures 3-4 to 3-8.
From the diffraction patterns, we identified only tetragonal BaTiO3 peaks in both the as-
received and sintered discs. In sintered BaTiO3, there is the possibility of the hexagonal
phase being retained at room temperature, especially if the ceramic is exposed to
temperatures above 1450oC for an extended period of time. The room temperature
hexagonal phase contamination is easily identified by using x-ray diffraction. In Cu-Kα
x-ray diffraction the hexagonal peak occurs at 2θ angle value of 41.3o. In the sintered
BaTiO3 discs, there were no hexagonal peaks; all the diffraction peaks matched well with
the tetragonal phase of BaTiO3.

37
2 0 3 0 4 0 5 0 6 0 7 0 8 0
D i f f r a c t io n A n g le ,2 θ
B T O 7
001
100
101
110
111
002
200
210
102
112
211
201
202
220
212 22
130
0 103 30
131
0
113
311 22
2
BaTiO3 as-received
Inte
nsity
Diffraction angle, 2θ (deg)
Figure 3-4: X-ray diffraction pattern for as-received BaTiO3 powder.
2 0 3 0 4 0 5 0 6 0 7 0 8 0
D if f r a c t io n A n g le , 2 θ
1 0 0 0
001 10
0
101
110
111
002
200
21010
2
112
211
201
202 22
0
212
221
300 10
330
131
0
113 31
1 222
BaTiO3 sintered at 1000oC
Inte
nsity
Diffraction angle, 2θ (deg)
Figure 3-5: X-ray diffraction pattern for BaTiO3 sample sintered at 1000oC.

38
20 30 40 50 60 70 80
12 00
001
100
101 110
111
002 20
0
21010
2
112
211
201
202
220
212
221
300
103
301
310
113
311
222
BaTiO3 sintered at 1200oC
Diffraction angle, 2θ (deg)
Inte
nsity
Figure 3-6: X-ray diffraction pattern for BaTiO3 sample sintered at 1200oC.
2 0 3 0 4 0 5 0 6 0 7 0 8 0
1 2 5 0
001 10
0
101
110
111
002
200
210102
112
211
201
202
220
212 22
130
0 103
301
310
113 31
1 222
BaTiO3 sintered at 1250oC
Diffraction angle, 2θ (deg)
Inte
nsity
Figure 3-7: X-ray diffraction pattern for BaTiO3 sample sintered at 1250oC.

39
20 30 40 50 60 70 80
1350
001
100
101
110
111
002
200
210
102
112
211
201
202
220
212 22
130
010
330
131
011
331
1
222
BaTiO3 sintered at 1450oC
Diffraction angle, 2θ (deg)
Inte
nsity
Figure 3-8: X-ray diffraction pattern for BaTiO3 sample sintered at 1450oC.
3.3.2.1 Determination of Tetragonality of BaTiO3
An example of the standard Cu-Kα x-ray diffraction pattern for BaTiO3 from 2θ angles of
20o to 85o is shown in Figure 3-9. The inset shows a split peak which occurs around 45o
for tetragonal BaTiO3. The doublet is the reflections of the (002) and (200) planes in
tetragonal BaTiO3. Cubic BaTiO3 ceramic does not show this split peak since there is no
c axis. The position of the split peak can be used to calculate the c/a ratio, an important
value which provides a quantitative basis for comparing the tetragonality of BaTiO3
ceramics [55, 57]. Figure 3-10 shows in detail the evolution of the (002) and (200) peaks
with increasing sintering temperature.

40
1 0 2 0 3 0 4 0 5 0 6 0 7 0 8 0 9 0
Inte
nsity
D i f f r a c t io n A n g le ,2 θ ( d e g )
45 46
Inte
nsity
Diffraction Angle, 2θ
(002)
(200)
Figure 3-9: Cu K–α x-ray diffraction pattern for tetragonal BaTiO3.
44.0 44.5 45.0 45.5 46.0
Inte
nsity
D iffraction Angle, 2θ(deg)
As Received
1000oC
1250oC
1200oC
1350oC
1450oC
Figure 3-10: Evolution of (002) and (200) peaks in BaTiO3 with increasing sintering temperature.

41
To quantify the tetragonality of the BaTiO3 samples, the x-ray peaks between 2θ angles
of 44.5o and 46o were fitted using a Lorentz function in order to locate the peak positions.
Figures 3-11 and 3-12 are examples of the Lorentz fit for BaTiO3 samples sintered at
1350oC and 1000oC respectively.
44 45 46 47
Data: Sintered at 1350oC for 2 hoursM odel: LorentzEquation: y = y0 + (2*A/PI)*(w /(4*(x-xc)^2 + w^2))
Chi^2/DoF = 376.82464R^2= 0.98115 y0 6.58101 xc1 44.86317 w1 0.07592A1 38.90723 xc2 45.36461 w2 0.06199A2 77.39591
Diffraction Angle,2θ (deg)
Inte
nsity
Figure 3-11: Curve fitting for BaTiO3 sintered at 1350oC.
44 45 46 47
Data: S intered at 1000oC for 2 hoursModel: LorentzEquation: y = y0 + (2*A/PI)*(w/(4*(x-xc)^2 + w^2))
Chi^2/DoF = 171.62977R^2= 0.96773 y0 -9.83453 xc1 45.26215 w1 0.47377A1 97.79635 xc2 45.52994 w2 0.16677A2 57.49823
Diffraction Angle, 2θ
Inte
nsity
Figure 3-12: Curve fitting for BaTiO3 sintered at 1000oC.
After the peak positions were determined from the fitted curve, the c/a ratio was
estimated using Bragg’s law of diffraction as follows:

42
The d spacing according to Bragg’s law of diffraction is given by
θ
λSinnd = [23]
Where λ is the wavelength and n is a numerical integer. The expression for the ratio of
the d spacing of the c axis to that of the a axis is given by
)200(
)002(
)200(
)002(
θθ
SinSin
dd
ac
== [24]
The importance of the c/a ratio in BaTiO3 is that it represents the ferroelectric state of the
ceramic. A higher c/a ratio signifies a higher polarized sate and vice versa. Figure 3-8
shows the increase in the c/a ratio of BaTiO3 with increasing sintering temperature.
Table 3-1 contains the c/a ratios calculated for the BaTiO3 samples.
Table 3-1: c/a ratios for different BaTiO3 samples Sample ID Sintering temperature Sintering time c/a ratio
As received Powder - - 1.004965±0.00003
BT1 1000 oC 2 Hours 1.005603±0.00002
BT2 1200 oC 2 Hours 1.005843±0.00001
BT3 1250 oC 2 Hours 1.009941±0.00002
BT4 1350oC 2 Hours 1.010591±0.00001
BT5 1450 oC 2 Hours 1.010805±0.00001
Although there was not a tetragonal to cubic phase transition in the DSC curve for the as-
received powder and for the sample sintered at 1000oC, the c/a ratio for those samples
confirms the room temperature phase to be tetragonal. The degree of tetragonality of
BaTiO3, however, increases with increasing sintering temperature as shown in Figure 3-
13. Many authors attribute the increase in tetragonality of BaTiO3 with increasing
sintering temperature to grain size [13, 58].

43
-200 0 200 400 600 800 1000 1200 1400 16001.004
1.005
1.006
1.007
1.008
1.009
1.010
1.011
Tetra
gona
lity
(c/a
)
Sintering temperature (oC)
Figure 3-13: c/a ratio as a function of sintering temperature.
From Figure 3-13, there was a large difference in the c/a values for samples sintered at
1250oC and above when compared to the as-received powder and samples sintered at
1200oC and below. The reason for the large difference in the c/a values is apparent by
looking at the x-ray diffraction patterns for each sample. Figures 3-14 and 3-15 are the
diffraction patterns for the as-received BaTiO3 powder and BaTiO3 samples sintered at
1200oC
For the as-received BaTiO3 powder and the sample sintered at 1200oC, there was no clear
distinction between the (101) and (110) peaks, the (002) and (200) peaks, and the (112)
and (211) peaks. This observation is typical for fine BaTiO3 particulates or grains. In
fine BaTiO3 particulates, there is a large depolarization energy on the particulates[57]. In
order to reduce the high depolarization energy, there is a suppression of the tetragonal
distortion (polarization). The suppression of the tetragonal distortion results in a
reduction in the c/a ratio as seen in Figure 3-13 for the as-received sample and the
samples sintered at 1000oC and 1200oC.

44
Inte
nsity
3 0 3 5 4 0 4 5 5 0 5 5 6 0
D i f f r a c t i o n A n g l e , 2 θ
B T O 7
Diffraction angle, 2θ (deg)
BaTiO3 as-received
211
102
200
002
111
112
101
110
201
210
Figure 3-14: X-ray diffraction pattern for as–received BaTiO3 showing detailed peak shape.
3 0 3 5 4 0 4 5 5 0 5 5 6 0
1 2 0 0
Diffraction angle, 2θ (deg)
Inte
nsity
211
102
200
002
111
112
101
110
201
210
BaTiO3 sintered at 1200oC
Figure 3-15: X-ray diffraction pattern for BaTiO3 sintered at 1200oC showing detailed peak shape.
With temperature increase during sintering; the BaTiO3 grains begin to grow in size. The
depolarization energy in large BaTiO3 grains is compensated for by the formation of
domain structures. Hence in the BaTiO3 samples tested, the compensation of the
depolarization energy by the formation of complex domain structures in samples sintered
at 1250oC and above resulted in the appearance of distinct (101) and (110) peaks, (002)
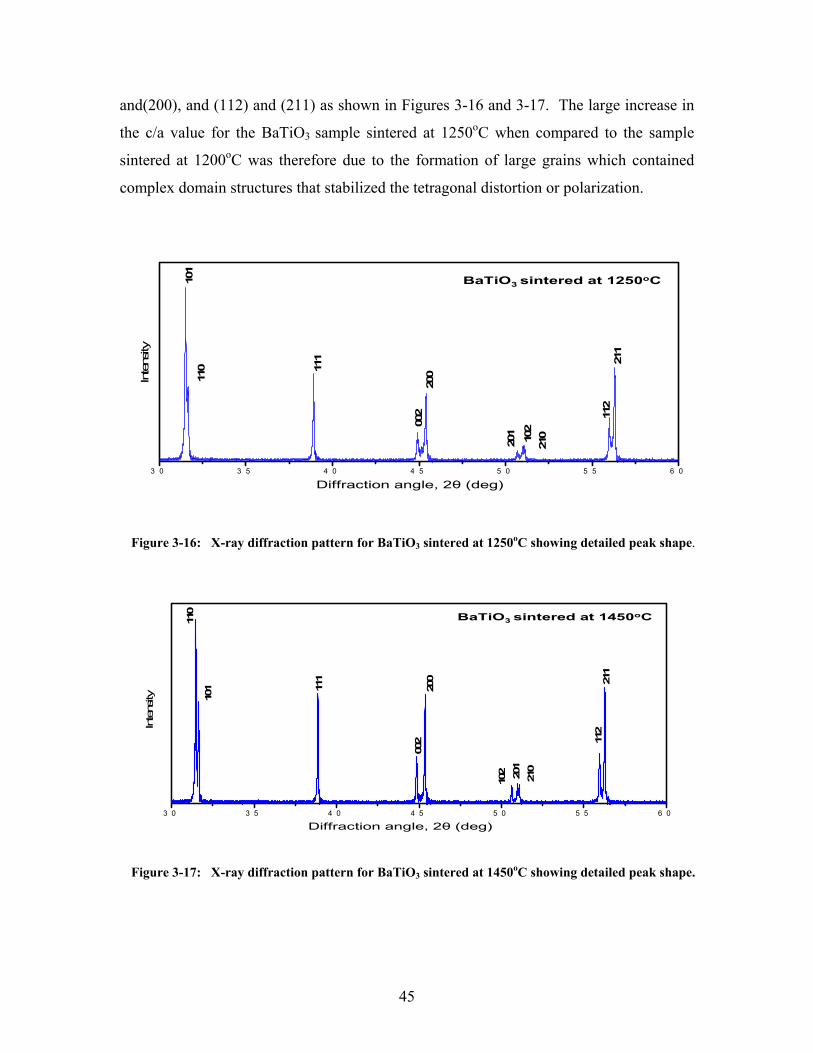
45
and(200), and (112) and (211) as shown in Figures 3-16 and 3-17. The large increase in
the c/a value for the BaTiO3 sample sintered at 1250oC when compared to the sample
sintered at 1200oC was therefore due to the formation of large grains which contained
complex domain structures that stabilized the tetragonal distortion or polarization.
3 0 3 5 4 0 4 5 5 0 5 5 6 0
1 2 5 0
101
110 11
1
002
200
210102
112
211
201
BaTiO3 sintered at 1250oC
Diffraction angle, 2θ (deg)
Intens
ity
Figure 3-16: X-ray diffraction pattern for BaTiO3 sintered at 1250oC showing detailed peak shape.
3 0 3 5 4 0 4 5 5 0 5 5 6 0
1 3 5 0
101
110
111
002
200
210
102
112
211
201
BaTiO3 sintered at 1450oC
Diffraction angle, 2θ (deg)
Intens
ity
Figure 3-17: X-ray diffraction pattern for BaTiO3 sintered at 1450oC showing detailed peak shape.

46
Figures 3-18 to 3-20 are the SEM images showing the microstructure of BaTiO3 samples
sintered at 1000oC, 1250oC and 1450oC respectively. At 1000oC, the microstructure
consists of aggregates of fine BaTiO3 grains. At 1250oC, there was grain growth which
resulted in the formation of grains with complex domain structures and regions of porous
grains as shown in Figure 3-19. At a higher sintering temperature of 1450oC, most of the
porosity were eliminated which resulted in the formation of a well developed ferroelectric
domain structure as shown in Figure 3-20.
1000
BaTiO3 aggregate
Figure 3-18: SEM image of BaTiO3 sample sintered at 1000oC. (Image taken by author)

47
Pores
Grain
Grain
Figure 3-19: SEM image of BaTiO3 sample sintered at 1250oC. (Image taken by author)
1450
Grain
Grain
Figure 3-20: SEM image of BaTiO3 sample sintered at 1450oC. (Image taken by author)

48
3.3.3 Dynamic Mechanical Analysis of BaTiO3 Samples
Figure 3-21 shows damping capacity, tanδ, as a function of temperature for three BaTiO3
samples measured at 1Hz. The peaks P1, P2 and P3 are those associated with the
tetragonal to cubic phase transition that occurs at Tc. Tanδ increases with increasing
temperature up to Tc, and then drops off after the Tc.
40 60 80 100 120 140 160 180 200 2200.00
0.02
0.04
0.06
0.08
0.10
0.12
Dam
ping
cap
acity
,tanδ
Temperature (oC)
Sintered at 1450oC
Sintered at 1200oC Sintered at 1250oC
P3
P1
P2
Figure 3-21: Typical damping capacity profile for sintered BaTiO3 samples. Damping capacity was measured at 1Hz.
In order to understand the damping profile of the three BaTiO3 samples shown in Figure
3-21, it is important to evaluate the damping mechanisms that are active in BaTiO3 below
the Curie temperature, at the Curie temperature, and above the Curie temperature.
3.3.3.1 Damping Below the Curie Temperature
Below the Curie temperature the crystal structure of the BaTiO3 samples is tetragonal, as
DSC and c/a values in Figures 3-13 and Table 3-1 show, respectively. The tetragonal
microstructure consists of both 180o and 90o domains of which the 90o domains are
ferroelastic. The high damping in the tetragonal phase is due to the 90o domain wall
motion caused by ferroelastic domain switching.
Ferroelastic switching in BaTiO3 can be explained by considering how a compressive
stress σ acts on a 90o domain wall as illustrated in Figure 3-22. Upon the application of
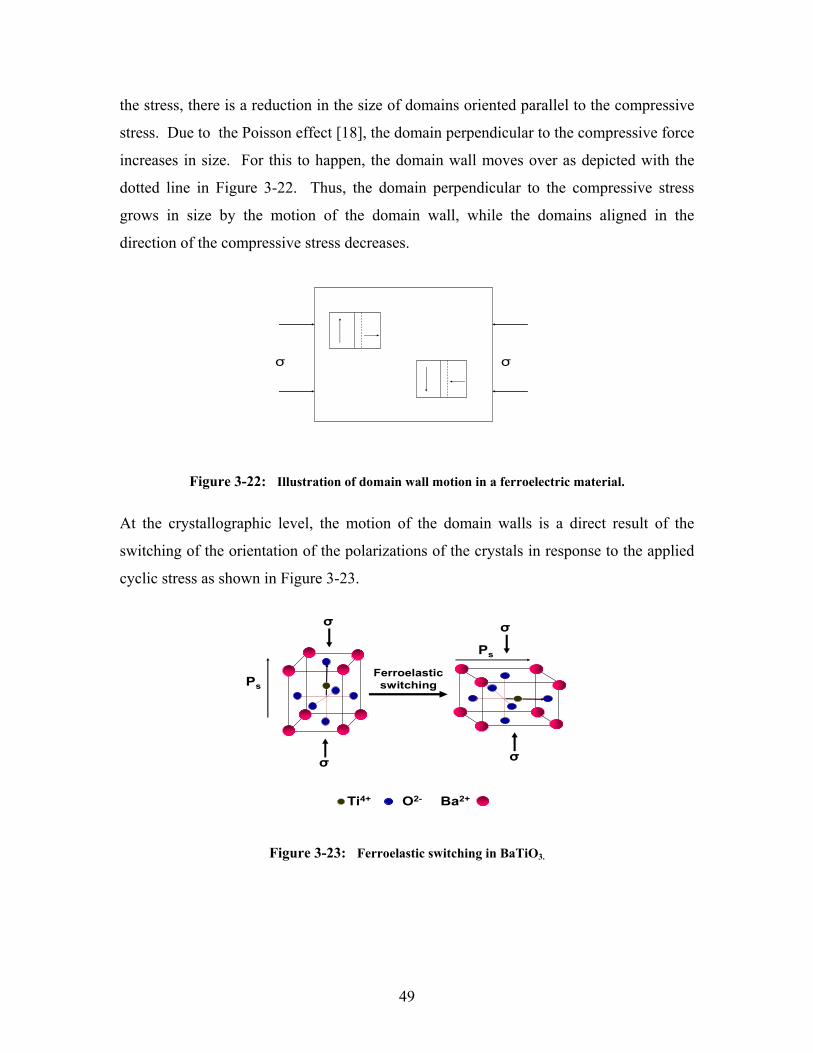
49
the stress, there is a reduction in the size of domains oriented parallel to the compressive
stress. Due to the Poisson effect [18], the domain perpendicular to the compressive force
increases in size. For this to happen, the domain wall moves over as depicted with the
dotted line in Figure 3-22. Thus, the domain perpendicular to the compressive stress
grows in size by the motion of the domain wall, while the domains aligned in the
direction of the compressive stress decreases.
σ σ
Figure 3-22: Illustration of domain wall motion in a ferroelectric material.
At the crystallographic level, the motion of the domain walls is a direct result of the
switching of the orientation of the polarizations of the crystals in response to the applied
cyclic stress as shown in Figure 3-23.
Ti4+ Ba2+O2-
Ferroelastic switchingPs
Ps
σ
σ σ
σ
Figure 3-23: Ferroelastic switching in BaTiO3.
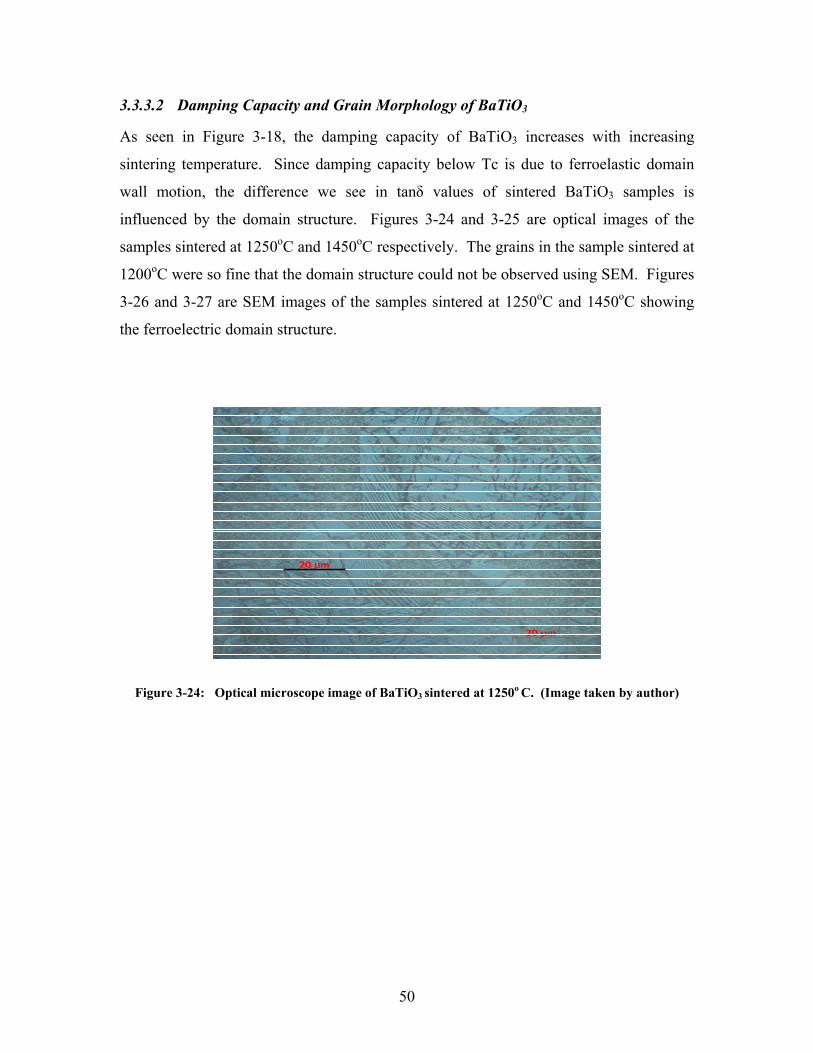
50
3.3.3.2 Damping Capacity and Grain Morphology of BaTiO3
As seen in Figure 3-18, the damping capacity of BaTiO3 increases with increasing
sintering temperature. Since damping capacity below Tc is due to ferroelastic domain
wall motion, the difference we see in tanδ values of sintered BaTiO3 samples is
influenced by the domain structure. Figures 3-24 and 3-25 are optical images of the
samples sintered at 1250oC and 1450oC respectively. The grains in the sample sintered at
1200oC were so fine that the domain structure could not be observed using SEM. Figures
3-26 and 3-27 are SEM images of the samples sintered at 1250oC and 1450oC showing
the ferroelectric domain structure.
Figure 3-24: Optical microscope image of BaTiO3 sintered at 1250o C. (Image taken by author)

51
Figure 3-25: Optical microscope image of BaTiO3 sintered at 1450o C. (Image taken by author)
Domain structure
Spongy area
Spongy area
Spongy area
Figure 3-26: Domain structure of BaTiO3 sample sintered at 1250oC. (Image taken by author)

52
Figure 3-27: Domain structure of BaTiO3 sample sintered at 1450oC. (Image taken by author)
From the optical images on Figures 3-24 and 3-25, there is a negligible difference
between the grain size of the samples sintered at 1450oC and 1250oC. However, below
Tc, the damping capacity of the sample sintered at 1450oC was significantly larger than
the sample sintered at 1250oC as depicted in Figure 3-28. Although the grain sizes are
comparable in these two samples, there is a big difference in the microstructural
morphology. In the sample sintered at 1250oC, the SEM image of the microstructure
shows that the ferroelectric domains are surrounded by regions of porous matter which
has been labeled as spongy area on Figure 3-26. In contrast, there are no spongy areas in
the microstructure of the sample sintered at 1450oC. By inspection we can say there are
more domains per given area in the samples sintered at 1450oC than the one sintered at
1250oC. Therefore the low damping capacity of the sample sintered at 1250oC may be
attributed to the fewer number of domains available for switching.

53
80 90 100 110 120
0.015
0.020
0.025
0.030
0.035
0.040
0.045
0.050
0.055
0.060
Dam
ping
cap
acity
,tanδ
Temperature (oC)
Sintered at 1450oC Sintered at 1250OC Sintered at 1200OC
Figure 3-28: Damping capacity as a function of temperature for BaTiO3 samples sintered at 1200oC,
1250oC and 1450oC.
3.3.3.3 Damping at the Curie Temperature
At Tc, there are two major damping mechanisms that are active in BaTiO3. These are
vibration damping due to enhanced domain wall motion at elevated temperatures and
energy dissipated by the tetragonal to cubic phase transition. The combination of these
two damping mechanisms results in tanδ peaking at Tc.
3.3.3.4 Damping above the Curie Temperature
Above the Curie temperature, the high symmetry paraelectric phase of BaTiO3 exists.
The ferroelastic twins disappear as the cubic structure forms. Hence, there is no material
damping from ferroelastic switching and BaTiO3 remains low damping. The low
damping capacity above Tc shows that ferroelastic domain wall motion is the main
damping mechanism in ferroelectric BaTiO3. In Figure 3-29, we can observe that there is
no difference in tanδ values for ceramics sintered at 1450oC, 1250oC and 1200oC. This
observation offers a proof that the damping capacity difference in the BaTiO3 samples

54
below Tc was mainly due to the different grain morphology. The global ceramic
structure therefore did not influence damping capacity of BaTiO3 in a significant way.
140 150 160 170 180 190 2000.001
0.002
0.003
0.004
0.005
0.006D
ampi
ng c
apac
ity,ta
nδ
Temperature (oC)
Sintered at 1450oC Sintered at 1250oC Sintered at 1200oC
Figure 3-29: Damping capacity, tanδ, of BaTiO3 ceramic above the curie temperature.
3.3.4 Effect of Frequency on Damping Capacity of BaTiO3
Damping capacity, tanδ, measured as a function of temperature at vibration frequencies
of 0.1Hz, 1Hz and 10Hz are shown in Figure 3-30. Figure 3-31 also shows average tanδ
values selected at various temperatures. Vibration damping decreases with an increase in
frequency below Tc. The phase transition temperature and tanδ above Tc are unaffected
by vibration frequency. In experiments performed by Cheng et al in the KHz range, the
authors reported very small damping capacity values [59].

55
60 80 100 120 140 160 180 200
1E-3
0.01
0.1
Dam
ping
cap
acity
, tan
δ
Temperature (oC)
0.1 Hz) 10 Hz 1 Hz
Figure 3-30: Effect of frequency on damping capacity profile of BaTiO3
60 80 100 120 140 160 180 200
1E-3
0.01
0.1
Dam
ping
cap
acity
,tanδ
Temperature (oC)
10Hz 0.1Hz 1Hz
Figure 3-31: Comparison of tanδ values of BaTiO3 at different vibration frequencies.

56
3.3.5 Dependence of tanδ on Number of Vibration Cycles
Figure 3-32 shows the decay of tanδ with number of vibration cycles (N) for a BaTiO3
sample tested at 1 Hz for 36000 cycles. Initially, there was a sharp decrease in tanδ but
the drop-off levels after about 2000 cycles. In the three point bending test used for
measuring tanδ, the BaTiO3 sample was taken through many stress cycles. The drop in
tanδ with N is due to irreversible ferroelastic domain switching when stress is applied to
the BaTiO3 sample.
0 5000 10000 15000 20000 25000 30000 35000
0.030
0.035
0.040
0.045
0.050
0.055
0.060
Dam
ping
cap
acity
, tan
δ
Number of cycles(N)
Figure 3-32: Decay of tanδ with number of vibration cycles
Ferroelastic switching is a concern when ferroelectric ceramics are used for electronic
applications. The piezoelectric properties of ferroelectric ceramics are known to degrade
if the material is subjected to prolonged cyclic stress. Because of this, ferroelastic
domain switching in ferroelectric ceramics under mechanical loading has been explored
by several authors [11, 60-65]. The non reversible switching of ferroelastic domains
during compressive loading of PZT was observed by Pojprapai et al [66] and in BaTiO3

57
by Forrester et al [11]. In both PZT and BaTiO3 the authors observed that some of the
domains that switch during compressive loading stay in the new configuration when the
load was removed. In order to understand how reversible and irreversible domain
switching affects tanδ, the behavior of differently oriented domains under external stress
is considered.
Figure 3-33 is a sketch of the possible orientations of ferroelastic domains in a BaTiO3,
The orientations are represented by positions 1, 2 and 3. Shown on Figure 3-34 are the
domain orientations when an external stress is applied to the material. The domains in
position 1 which have their c axis aligned in parallel to the direction of the applied stress
are completely switched into a new orientation. There is a permanent strain associated
with this type of domain switching. When the stress is removed, the domains remain in
the reoriented state. The domain switching is therefore irreversible. For domains which
have their c axis oriented perpendicular to the applied stress (position 2), there is no
switching of ferroelastic domains. For domains that are oriented in position 3, the stress
causes the domains to switch. Since the effective stress acting on the c axis is not high
enough to cause permanent strain, this type of domain switching is reversible.
1
2
3c
cc
Figure 3-33: Illustration of domain orientation before stress application.
1(irreversible)
2(unaffected)
3 (reversible)
c
c
c
Stress
Stress
Figure 3-34: Illustration of domain orientation after stress is applied.

58
In the BaTiO3 samples tested, the initial sharp drop in tanδ was due to the exhaustion of
all the irreversible domain switching. Saturation of the irreversible domain switching
occurred at about 2000 cycles after which a steady state of damping was reached. The
steady state damping after the initial drop was therefore due to reversible ferroelastic
domain switching. It must be noted here that a tensile stress produces an opposite effect
to that of the compressive stress. In the three-point bend geometry, the top of the BaTiO3
bar is in compression while the lower part is in tension. Hence in the lower part of the
bar, domains that have their c axes aligned parallel to the tensile stress grow at the
expense of domains perpendicular to the tensile stress.
When the maximum strain was increased, the increased stress caused some of the
reversible domains to deform permanently. This resulted in the number of irreversible
domains increasing at the expense of the reversible domains as illustrated in Figure 3-35.
Since the number of irreversible domains increased with increased maximum strain, there
was an increase in the drop in tanδ with increasing maximum strain. Figure 3-36 shows
the almost linear relationship between the drop in tanδ† and maximum strain.
1(irreversible)
2(unaffected)
3 (reversible)
c
c
c
Increased Stress
Increased stress
Permanently switched
Figure 3-35: Effect of increased stress on ferroelastic switching.
† Drop or decrease in tanδ is defined as the difference between the maximum value of tanδ at the beginning of the test and minimum value of tanδ at the end of the test

59
0.010 0.015 0.020 0.025 0.030
0.010
0.015
0.020
0.025
0.030
0.035
Dro
p in
tanδ
Maximum strain (%)
Figure 3-36: Effect of maximum strain on drop in tanδ with number of cycles
3.3.5.1 Recovery of Drop in tanδ
The decrease in tanδ was partially recovered when the BaTiO3 sample was allowed to age
at room temperature for some time after testing. Figure 3-37 shows tanδ versus number
of vibration cycles (N) for a BaTiO3 sample tested at various time intervals. Decay run 2
was performed about 2 hours after decay run 1. Here we noticed that some of the loss in
tanδ after run 1 was recovered as seen from the higher starting value of tanδ for run 2
when compared to the tanδ value after 36000 cycles for run 1. After allowing the sample
to rest for two days, the recovery of the drop in tanδ was even higher, as shown in Figure
3-37. There was, however, a complete recovery of the loss in tan tanδ with N when a
BaTiO3 sample was heated above the Tc, cooled and retested. Figure 3-38 shows the
recovery of the loss in damping of a BaTiO3 sample after heating through Tc and cooling
to allow complete realignment of previously pinned domains.

60
0 5000 10000 15000 20000 25000 30000 350000.010
0.015
0.020
0.025
0.030
0.035
0.040
Decay run 1 Decay run after 2 days Decay run 2
Dam
ping
cap
acity
,tanδ
Number of cycles (N)
Figure 3-37: Partial recovery of decrease in tanδ after two days
0 5000 10000 15000 20000 25000 30000 35000
0.024
0.027
0.030
0.033
0.036
0.039
0.042
Dam
ping
cap
acity
, tan
δ
Number of cycles (N)
Run 1 After heating Through Tc
Figure 3-38: Recovery of loss in tanδ after heating through Tc.
3.3.5.2 Recovery of Drop in tanδ and Aging in BaTiO3
The mechanisms that resulted in the recovery of the drop in tanδ with time are similar to
the mechanisms that are responsible for aging or the degradation of certain properties of
ferroelectric and piezoelectric ceramics with time. For instance, it is well established that
the dielectric constant of BaTiO3 diminish with time when the freshly fired ceramic is

61
cooled [67, 68]. Another example of aging is the loss of the permanent polarization of
polarized BaTiO3 with time [67]. The most common explanation for aging in
ferroelectric ceramics is attributed to the gradual change in domain wall orientation with
time to reduce mechanical stress and minimize energy [67, 69].
In a typical unstressed BaTiO3 grain, the domains are arranged such that the overall
energy on the grain is minimized. The theoretical domain arrangement to minimize
energy is that the polarizations of adjacent domains cancel each other out. In measuring
tanδ, the stress applied to the BaTiO3 samples caused individual domains to switch
orientations. Domain switching during tanδ measurements resulted in residual stresses to
develop in some parts of the grain. In the course of time, domain wall motions occured
to equalize the residual stress in the grain after the applied external stress was removed.
The domain wall motion, however, occurs very slowly and it takes a long time before the
stresses introduced into the grains are equalized. This is evident in the recovery curves
shown in 3-37; the recovery of tanδ is higher in the sample tested after two days when
compared to the sample tested after two hours. This is because after a long period of
time, the switched domains gradually reorient to the original orientation, therefore
increasing the number of domains available for ferroelastic switching. A complete
recovery of the loss in tanδ may not be possible even after a very long period of time
since the domain wall motion is impeded by defects, inclusions and pores. When a
previously tested BaTiO3 sample was heated above the Tc, the loss in tanδ was fully
restored, Figure 3-38. The reason for full tanδ being that the aging process was
accelerated by the removal of domain wall pinning effects.
3.3.6 Effect of Domain Structure on the Mechanical Properties of BaTiO3
The tetragonal-cubic phase transition has a dramatic effect on the mechanical properties
of BaTiO3. The interactions between domain walls and applied stress lead to a huge
reduction in the modulus of tetragonal BaTiO3. Figure 3-39 shows the complex modulus
(Equation 3) as a function of temperature of a BaTiO3 sample sintered at 1350oC. The
fracture stress of cubic BaTiO3 is considerably higher in tetragonal BaTiO3. This is also

62
due to interactions of domain walls with applied stress in tetragonal BaTiO3. Figure 3-40
shows the stress-strain plots of BaTiO3 ceramic measured below and above Tc.
40 60 80 100 120 140 160 180 200 2200
30
60
90
120
150
180
210
0.00
0.03
0.06
0.09
0.12
0.15
0.18
Dam
ping
cap
acity
,tanδ
Com
plex
mod
ulus
(GPa
)
Temperature (oC)
A
Figure 3-39: Damping capacity and modulus profiles of BaTiO3 as a function of temperature.
0.00 0.05 0.10 0.15 0.20 0.25 0.30
20
40
60
80
100
120
Stre
ss (M
Pa)
Strain (%)
Fracture
Fracture
Above Tc
Below Tc
T=30oC
T=160oC
Figure 3-40: Stress- strain plots for BaTiO3 measured at temperatures below and above the Curie temperature.

63
3.4 Nickel- BaTiO3 (Ni-BaTiO3) Composites
An optical image of a Ni-BaTiO3 fabricated using a combination of electroless nickel
plating and conventional nickel electroforming is shown in Figure 3-41. In this particular
sample, each nickel layer is about 130µm. The BaTiO3 layer is about 230µm. The
composite composition is therefore Ni-47vol% BaTiO3. The composites fabricated for
tanδ measurements had 32-34 vol% of BaTiO3.
BaTiO3 LayerNi Layer Ni Layer
Figure 3-41: Optical image of Ni-BaTiO3 composite. (Image taken by author)
3.5 Damping Capacity Behavior of Ni-BaTiO3 Composites
Figure 3-42 shows tanδ profile of Ni-BaTiO3 composite (Ni-34%BaTiO3) from 35oC to
200oC as a function of temperature performed at a vibration frequency of 1Hz. The
damping capacity profile of an electroformed Ni is also shown in the same plot.

64
0 20 40 60 80 100 120 140 160 180 200 2200.0000
0.0025
0.0050
0.0075
0.0100
0.0125
0.0150
0.0175
0.0200
0.0225
Dam
ping
Cap
acity
,tanδ
Temperatue (oC)
Approx Tc
Monolithic NiNi-34%BaTiO3
Figure 3-42: Damping capacity of Ni-BaTiO3 (Ni-34% BaTiO3) and monolithic Ni as a function of
temperature
The tanδ behavior of Ni-BaTiO3 composite as a function of temperature generally
follows the damping profile of BaTiO3. Damping capacity increases with increases
temperature up to Tc after which there is a drop in tanδ. In the Ni-BaTiO3 composite,
however, the drop in tanδ after Tc is not as great as in observed in the bulk BaTiO3
sample. In fact, after the initial drop, there is a further increase in tanδ. The behavior of
the damping capacity curve can be explained by evaluating the damping mechanism
active in both BaTiO3 and Ni and describe how they affect the overall damping capacity
of the composite.
Below Tc, BaTiO3 is tetragonal and vibration damping is due to ferroelastic domain wall
motion. As described earlier, ferroelastic domain walls become more mobile as
temperature increases. Hence the increase in the damping capacity with increasing
temperature is partly due to increased domain wall motion with increasing temperature.
Figure 3-42 also shows that the damping capacity of Ni increases with increasing
temperature. Ni is a ferromagnetic material and hence exhibit damping due to

65
ferromagnetic domain wall motion [46]. The increase in tanδ in nickel with temperature
increase is therefore likely to be due to dislocation and domain wall motion.
At Tc, tetragonal BaTiO3 begins to transform into cubic BaTiO3 with the associated
disappearance of the domain structure. Because of the loss of domains, tanδ decreases at
at Tc.
For the Ni-BaTiO3 composites, tanδ increases with increasing temperature. Although the
damping capacity of BaTiO3 becomes insignificant above Tc, the inherent vibration
damping capacity in Ni becomes important. As shown in Figure 3-42, tanδ for Ni above
Tc is higher than the composite. Thus above Tc, the overall damping capacity of the
composite is primarily due to the inherent damping in Ni.
We examined tanδ at temperatures below the Tc, and above Tc, for the Ni-BaTiO3
composites and Ni to evaluate the advantages of the Ni-BaTiO3 composite over
monolithic Ni. At 35oC, there was about 77% increase in the tanδ, at 100oC there was a
33% increase in tanδ and at 180oC, there was a reduction in tanδ by about by 14%.
Table 3-2: Summary of damping capacity of Ni-34% BaTiO3 composite and Ni at different temperatures
Temperature Tanδ of Ni Tanδ of Ni-BaTiO3 % Increase
35oC 0.00483± 0.00021 0.00854± 0.00015 76.8%
100oC 0.00845± 0.00018 0.01122± 0.00010 33.37%
180oC 0.0191± 0.00017 0.01641± 0.00024 -14.13%
The effect of vibration frequency on tanδ of the Ni-BaTiO3 composite is shown in Figure
3-43. As seen in bulk BaTiO3 tanδ decreases with increasing frequency. The damping
peak at Tc is completely absent in the sample tested at 50Hz.

66
60 80 100 120 140 160 1800.000
0.005
0.010
0.015
0.020
0.025
0.030
Dam
ping
cap
acity
,tanδ
Tem perature (oC )
0.1Hz
1Hz
10Hz
50Hz
Figure 3-43: Damping capacity of Ni-BaTiO3 composites at different frequencies as a function of temperature
3.6 Summary
The main conclusions from this chapter are summarized as follows:
1. The damping capacity, tanδ, of BaTiO3 below Tc is strongly microstructure-
dependent. Above Tc, however, tanδ values for BaTiO3 samples with different
grain morphologies are similar. This observation implies that the high damping in
BaTiO3 is solely due to ferroelastic domain motion. The general ceramic structure
(example effect of porosity) does not have a great effect on the damping capacity
of BaTiO3.
2. At constant maximum strain, tanδ decays with number of vibration cycles (N).
The decrease in tanδ increases with increasing maximum strain. The decrease in
tanδ is, however, restored if BaTiO3 is heated above Tc and cooled for the domain
structure to rearrange.

67
3. In Ni-BaTiO3 composites, vibration damping below Tc is dominated by
ferroelastic damping in BaTiO3. Above Tc, vibration damping is due to the
inherent damping ability of the Ni matrix.

68
4 Chapter 4: Vibration Damping in Ni-PZT Composites
4.1 Introduction
For most materials, the application of stress within the elastic limit produces deformation
or strain which is directly proportional to the stress. For piezoelectric materials, however,
in addition to deformation, an electric charge (P) proportional to the stress is also
generated. This phenomenon, known as direct piezoelectricity, was discovered by J. and
P. Curie in 1880 [70]. Further experimentation also revealed that when an electric field
(E) is applied to a piezoelectric material, a strain (ε) proportional to the applied electric
develops. This is known as the inverse piezoelectric effect.
The direct and inverse piezoelectric effect can be summarized by Equations 25 and 26
respectively.
σdP jkijk=i [25]
Ed jkijk=jkε [26]
The piezoelectric effect occurs naturally in crystals that have permanent dipole moment
such as quart, topaz, rochelle salt and tourmaline. In ferroelectric ceramics, the dipoles
are arranged randomly such that the dipole moments cancel each out. Hence the overall
net polarization on the ceramic is zero. Ferroelectric ceramics therefore do not exhibit
piezoelectric effects naturally, unless the dipoles are forced to be aligned in a common
direction by an external electric field in a process known as poling. The poling process,
represented in Figure 4-1, is essentially the realignment of electrical dipoles in the
direction of the applied field. Upon the removal of the field, there is a remnant
polarization; that is the ceramic retains a permanent dipole moment which imparts
piezoelectric properties to the ferroelectric ceramic.

69
Polarization
Electric field
(a)
(b)
(d)
(c)
Figure 4-1: Poling process: (a) random arrangement of domains. (b) Domains begin to align in the
direction of applied electric field. (c) Fully polarized state. (d) Remnant polarization after removal of
electric field.
If a poled ferroelectric ceramic is heated above the Curie temperature (Tc), the dipoles
revert to the random arrangement resulting in the destruction of the piezoelectric
properties.
4.2 Piezoelectric Damping
The use of piezoelectric materials for active vibration control has been extensively
covered by Fanson and Caughey [71], Hanagud et al [72, 73], and Bailey and Hubbard
[74]. In active control systems, the piezoelectric ceramic is supplied with a voltage
which produces a strain to counteract mechanical vibrations. As an alternative to active
piezoelectric damping, Hagood [75, 76] proposed a shunt piezoelectric passive damping
techniques which completely eliminates amplifies and sensors needed for active vibration
control. In the shunt piezoelectric damping technique, the piezoelectric ceramic converts
mechanical vibrations to electrical energy. The electrical charges are then dissipated as
heat through the circuit. There are several possible passive circuit designs. Common
examples include a resistor circuit and resistor-inductor series circuits. The advantage of

70
using a resistor-inductor series circuit is the ability to tune the setup to damp vibrations at
a particular frequency.
4.2.1 Piezoelectric Ceramic Reinforced Metal Matrix Composites (PRMMC)
In this study we will investigate the damping behavior of a piezoelectric ceramic
embedded in a metallic matrix. For a piezoelectric ceramic embedded in a metal matrix,
a direct piezoelectric damping mechanism has been proposed as a possible energy
dissipative mechanism. Figure 4-2 is an illustration of how the direct piezoelectric
damping mechanism may work in a metal matrix composite. The assumption is that a
cyclic stress from mechanical vibrations causes the piezoelectric ceramic to develop
electrical charges. The electrical charges are then dissipated as heat through the volume
of the metallic matrix which results in damping of the vibration. The metal matrix in this
case serves as the resistive medium that completes the electric circuit.
Metal matrix
Piezoelectric material
Cyclic stress from vibrations
Damped vibrations
Figure 4-2: Illustration of the direct piezoelectric damping model in metal matrix composites
The possibility of this type of damping mechanism in metal matrix composites was first
proposed by Goff et al [77]. Before that, a few authors studied material damping in
polymer matrix composites with piezoelectric ceramic particulates and carbon black
particulates [78, 79]. In this system the carbon black constituent served as the resistive
medium which dissipates the electrical energy generated in the piezoelectric ceramic.

71
The damping capacity results, however, indicated noticeable increase in damping
capacity could only obtained at high piezoelectric ceramic volume fraction of 50% and
above. It is obvious that for piezoelectric damping to be effective in this system, intimate
connection between carbon black and the piezoelectric ceramic is a needed, a
requirement that can only be achieved at high volume fractions of the piezoelectric
ceramic.
The energy dissipated as a result of piezoelectric particulates embedded in a metallic
matrix was theoretically treated by Goff et al. A theoretical model based on the Elsheby
inclusion model was used to estimate the energy dissipated in the form of joule heating
for various PRMMCs. Figure 4-3 is a plot showing theoretical results of energy
dissipated in the form of joule heating for various PRMMC systems.
0.0 0.1 0.2 0.3 0.4 0.5
0
50
100
150
200
250
300
Joul
e H
eatin
g (k
J/s)
Volume fraction BaTiO3
Aluminum Copper Mild steel Magnessium Nickel Titanium Tungsten
Figure 4-3: Predicted joule heating versus volume fraction BaTiO3 for 1m3 of composite material.
Experimentally, the direct piezoelectric vibration damping mechanism has not been
proven in a metal matrix composite. The Tc for most ferroelectric ceramics is low
compared to the temperatures metal matrix composites are processed. At processing
temperatures above Tc, the ceramic becomes depoled and losses the piezoelectric
properties. The aim of this section is to employ low temperature electroless plating and

72
electroforming technique to embed a piezoelectric ceramic in a Ni matrix and study the
damping behavior. It is the author’s goal to examine the damping mechanisms that are
active in a Ni-PZT system.
4.3 Experimental Procedure
The piezoelectric ceramic used in this study was a commercially available Navy type II
(Industry Type 5A) lead zirconate titanate sheet (PZT) obtained from Piezo System Inc,
Cambridge, MA, USA. The PZT sheet measuring 72mmx72mm x1.02mm was already
poled through the thickness by the manufacturer. According to the supplier, Ni was
deposited on the ceramic as contacts for poling the ceramic. The as received sheet was
carefully sectioned into smaller bars each measuring 72mmx4mmx1.02mm using a
Struers Accutom-5 cutting machine.
Smaller samples measuring about 2mmx2mmx1.02mm were sectioned for determination
of the piezoelectric d33 constant. The edges of these samples were polished slightly to
remove any trace of nickel electrodes in order to prevent short circuiting during the
electrical measurements. For the as received PZT, the d33 measured was 400 x 10-12 C/N
indicating a strong piezoelectric ceramic.
4.3.1 Sample Preparation
To completely embed a PZT bar in a Ni conductive medium, electroless plating was used
to coat the ceramic bar with a layer of Ni (about 20µm thick). The Ni coated bar was
then used as the depositing electrode in a Ni sulphamate electroforming bath. Time for
deposition was varied to completely coat the PZT bar to the desired thickness of Ni.
Both the electroless plating and electroforming processes were done at about 60oC which
is well below the Curie temperature of the PZT ceramic (Tc =350oC). Processing the
samples at temperatures below the Tc ensured that the piezoelectric properties of
composites fabricated with poled PZT were preserved. Details of the electroless coating
technique can be found in Chapter 6.

73
4.3.2 Damping Capacity Measurements
The motive for the damping capacity measurements was to investigate the effect of
poling on the vibration damping behavior of the Ni-PZT composites. For this reason,
damping capacity (tanδ) measurements of several samples of the as poled PZT, Ni-PZT
composites and depoled PZT was performed on a TA DMA model Q800. Four different
sample types were prepared for tanδ measurements. These are:
1. Poled PZT, open circuit: These samples were poled PZT bars with a thin Ni
layer on the top and bottom surfaces. Because the samples were poled, they
exhibited piezoelectric properties. The samples were open circuit because the
conductive Ni covers only the top and bottom surfaces of the PZT bar.
2. Depoled PZT, open circuit: These samples were depoled PZT bars with a thin
layer of Ni on the top and bottom surfaces. The PZT bars were depoled by
heating the samples above the Curie temperature. There was therefore no
permanent polarization on the PZT ceramic, hence, the samples were not
piezoelectric.
3. Poled Ni-PZT composites, closed circuit: These samples were prepared by
completely coating poled PZT bars with Ni. In these samples, the PZT bars were
piezoelectric. The samples were closed circuit because the PZT bar was
completely surrounded by a conductive Ni medium.
4. Depoled Ni-PZT composites, closed circuit: These samples were prepared by
completely coating depoled PZT bars with Ni. Because of the depoling process,
the PZT ceramics were not piezoelectric.
Figures 4-4 to 4-7 are sketches of the samples described above.

74
Figure 4-4: Poled PZT, open circuit. PZT bar is piezoelectric.
Figure 4-5: Depoled PZT, open circuit. PZT is not piezoelectric.
Figure 4-6: Poled Ni-PZT composite, closed circuit. PZT is piezoelectric.
Figure 4-7: Depoled Ni-PZT composite, closed circuit. PZT is not piezoelectric.

75
The strain at the yield point for all the samples was determined prior to damping capacity
measurements. This strain value was used as the upper limit for tanδ measurements in
order to prevent plastic deformation of the samples during testing. All tanδ
measurements were performed as a function of temperature at a vibration frequency of
1Hz.
4.4 Results and Discussion
Figure 4-8 is an optical image that shows a closed circuit Ni-PZT sample.
PZT sheet
Ni coating
Figure 4-8: Optical image of a PZT bar coated with Ni layer. (Image taken by author)
4.4.1 Dynamic Mechanical Analysis
Typical damping capacity profiles for Ni-PZT composites fabricated with poled and
depoled PZT are shown as a function of temperature in Figure 4-9. It can be seen in this
plot that tanδ is comparatively higher in composites fabricated with poled PZT. Figure 4-
10 shows the average damping capacity for poled Ni-PZT, closed circuit and depoled Ni-
PZT composites, closed circuit at selected temperatures. A summary of the damping
capacity values calculated at 40oC, 80oC, 120oC and 160oC for both composites is
provided in Table 4-1. On average we observed about 20% increase in tanδ for the poled

76
Ni-PZT, closed circuit sample when compared to the depoled Ni-PZT, closed circuit
sample.
20 40 60 80 100 120 140 160 180 200 2200.040
0.042
0.044
0.046
0.048
0.050
0.052
0.054
0.056
0.058
0.060D
ampi
ng c
apac
ity,ta
nδ
Temperature,oC
Average Poled Ni-PZT composite closed circuitAverage Depoled Ni-PZT composite closed circuit
Figure 4-9: Damping capacity behavior of Ni-PZT composites as a function of temperature.
40 60 80 100 120 140 1600.040
0.042
0.044
0.046
0.048
0.050
0.052
0.054
0.056
0.058
0.060
Dam
ping
cap
acity
,tanδ
Temperature (oC)
Depoled Ni-PZT composite open circuitPoled Ni-PZT composite closed circuit
Figure 4-10: Damping capacity values for Ni-PZT composites at selected temperatures.

77
Table 4-1: Average tanδ values for Ni-PZT composites
Temperature (oC) Average tanδ
(Poled Ni-PZT closed circuit)
Average tanδ (Depoled Ni-PZT closed
circuit)
Difference (%)
40 0.05387 0.04407 22.2
80 0.05383 0.04431 21.5
120 0.05312 0.04445 19.5
160 0.05233 0.04428 18.2
To verify the relatively high tanδ values observed in the poled Ni-PZT, closed circuit
composites, we fabricated a copper-PZT (Cu-PZT) composite using poled and depoled
PZT ceramic. Similar results as in the Ni-PZT system were observed. Figure 4-11 is a
typical damping capacity profile for Cu-PZT system that shows tanδ for the sample
fabricated using a poled PZT to be slightly higher than that of the sample fabricated using
depoled PZT at temperatures below the Curie temperature of PZT.
0 50 100 150 200 250 300 350 400 450
0.01
0.02
0.03
0.04
0.05
0.06
0.07
0.08
Dam
ping
cap
acity
,tanδ
Temperature (oC)
Cu-PZT poled Cu-PZT depoled
Figure 4-11: Damping capacity of Cu-PZT composites as function of temperature

78
4.5 Damping Mechanisms in Ni-PZT Composites
The idealized configuration of poled Ni-PZT composite, closed circuit and depoled Ni-
PZT composite, closed circuit under the effect of a stress are shown in Figures 4-12 and
4-13 respectively. For the poled Ni-PZT composite, closed circuit, there are two possible
mechanisms that can result in vibration damping when stress is applied. First is vibration
damping due to ferroelastic domain switching. The second mechanism results from the
piezoelectric properties of the PZT ceramic. Since the PZT bar is piezoelectric,
application of a stress will cause charges to be developed on the ceramic. With the Ni
conductive layer completing the electrical circuit, the electrical charges can be dissipated
as heat in the Ni matrix. For the depoled Ni-PZT composite, closed circuit, there is no
possibility of a direct piezoelectric damping mechanism since the PZT ceramic is
depoled. The applicable damping mechanism in the depoled Ni-PZT system is therefore
ferroelastic domain wall switching.
Figure 4-12: Possible damping mechanisms in poled Ni-PZT system, close circuit; direct piezoelectric damping and ferroelastic domain switching.
Figure 4-13: Possible damping mechanism in depoled Ni PZT system, closed circuit; ferroelastic domain wall switching.

79
From the possible damping mechanisms in the Ni-PZT composites described depicted in
Figures 4-12 and 4-13, the question arises if the relatively high tanδ values observed in
the poled Ni-PZT composite, closed circuit when compared to the depoled Ni-PZT,
closed circuit, system was due to the direct piezoelectric damping mechanism.
In an effort to answer this question, we measured tanδ of poled PZT, open circuit and
depoled PZT, open circuit samples to investigate the effect of poling on the damping
capacity values. In addition, we tested poled and depoled PZT samples completely
coated with about 20µm thick layer of Ni. These samples were denoted as poled PZT,
closed circuit, and depoled PZT, closed circuit, respectively.
Figure 4-14 shows tanδ versus temperature for the samples described above. In this
Figure, we observed that coating the ceramic with a conductive Ni layer did not have any
effect on the damping capacity of the sample. In other words, it did not matter whether
the poled PZT was short circuited or open circuited, the damping capacity values for both
samples were similar. The major differences seen was that the poled samples exhibited
higher tanδ values when compared to the depoled samples
If the direct piezoelectric mechanism described in Figure 4-12 was active, the expected
damping capacity of the poled Ni-PZT, closed circuit sample would have been higher
than the poled PZT, open circuit, sample. This is because in addition to ferroelastic
domain damping which occurs in both systems, the direct piezoelectric damping would
have added to the damping capacity of the closed circuit system. We, however, did not
observe any increases in the damping capacity of the poled closed circuit sample when
compared to the poled open circuit sample. This observation lead us to conclude that the
direct piezoelectric damping mechanism was not significant in the in the Ni-PZT system
studied. Looking at Figure 4-14 the differences in the damping capacity behavior for the
samples appears to be due to the fact that the samples with higher tanδ values were poled
while the samples with lower tanδ values were depoled.

80
0 50 100 150 200 250 300 350 400 450
0.00
0.01
0.02
0.03
0.04
0.05
0.06
0.07
0.08
Dam
ping
cap
acity
, tan
Temperature(oC)
Poled PZT,open circuit Depoled PZT,open circuit Depoled PZT, closed circuit Poled PZT, closed circuit
Figure 4-14: Damping capacity of poled and depoled PZT bars as a function of temperature
4.5.1 Differences in Damping Capacity of Poled and Depoled PZT Ceramic
In order to explain the reason for the relatively high damping capacity of poled PZT
compared to depoled PZT ceramic, we considered the possible domain arrangements in
poled and depoled PZT samples as illustrated in Figure 4-15. The as received was poled
through the thickness, hence most of domains were arranged in a general direction as
shown in Figure 4-15. For the depoled sample, the temperature increase above the Curie
temperature destroyed the unique arrangements of domains. Thus the domains were
randomly arranged as shown in the same figure.
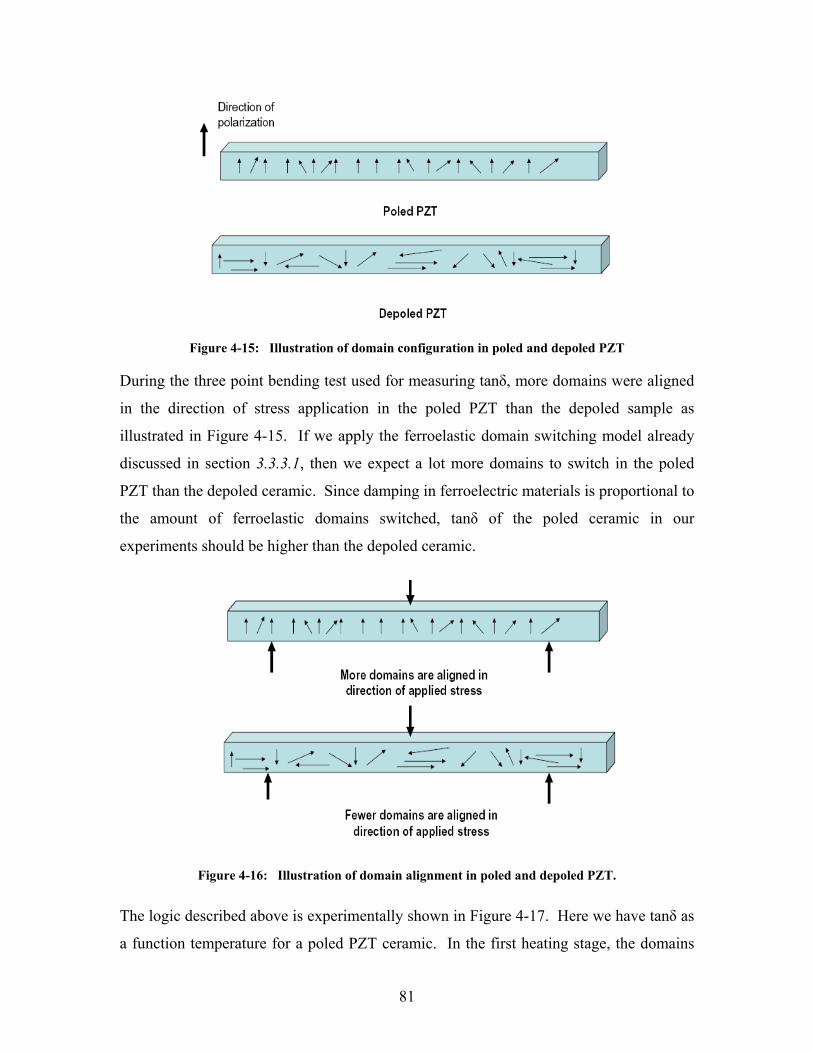
81
Figure 4-15: Illustration of domain configuration in poled and depoled PZT
During the three point bending test used for measuring tanδ, more domains were aligned
in the direction of stress application in the poled PZT than the depoled sample as
illustrated in Figure 4-15. If we apply the ferroelastic domain switching model already
discussed in section 3.3.3.1, then we expect a lot more domains to switch in the poled
PZT than the depoled ceramic. Since damping in ferroelectric materials is proportional to
the amount of ferroelastic domains switched, tanδ of the poled ceramic in our
experiments should be higher than the depoled ceramic.
Figure 4-16: Illustration of domain alignment in poled and depoled PZT.
The logic described above is experimentally shown in Figure 4-17. Here we have tanδ as
a function temperature for a poled PZT ceramic. In the first heating stage, the domains

82
are oriented favorably in the direction of stress application. Hence tanδ is relatively high
since more domains were switched. After the sample has been depoled by heating the
ceramic above the Curie temperature, tanδ for the subsequent heating stages 2 and 3 was
smaller. This is because fewer domains were favorably oriented to be switched in the
depoled state. Hence for the Ni-PZT, the mechanism for damping is ferroelastic domain
switching. In the poled Ni-PZT system, there is increased damping due to the fact that
the domains are aligned in a favorable direction for switching.
0 50 100 150 200 250 300 350 400 450
0.00
0.01
0.02
0.03
0.04
0.05
0.06
0.07
0.08
Heating stages 2 and 3
Dam
ping
cap
acity
, tan
δ
Temperature (oC)
Heating stage 1 Heating stage 2 Heating stage 3
Heating stage 1
Figure 4-17: Ferroelastic damping in PZT as a function of temperature. Heating stage 1: high damping due to favorable domain orientation (due to poling) in direction of applied stress. Heating stages 2 and 3, low damping due to fewer domains aligned in direction of stress in the depoled state.
4.6 Summary
The important conclusions from this section are summarized as follows:
1. The main damping mechanism identified in poled and short circuit and depoled
Ni-PZT composites was ferroelastic domain switching.

83
2. The high tanδ values measured in poled and short circuit Ni-PZT composites was
due to favorable domain orientation in the general direction of applied stress.
3. In the Ni-PZT we did not see any evidence of the direct piezoelectric damping
mechanism.

84
5 Chapter 5: Summary and Conclusions
5.1 Summary
In this study we investigated vibration damping of monolithic BaTiO3, Ni-BaTiO3
composites and Ni-PZT composites. The main purpose of this work was to understand
the effects of microstructural morphology and continual vibration cycling on damping
capacity of BaTiO3. Another goal for this research was to evaluate the damping capacity
of Ni-BaTiO3 and identify the damping mechanisms in a metal-piezoelectric ceramic
system (Ni-PZT). To achieve these objectives, BaTiO3 ceramics with different
microstructural morphologies were fabricated. Ni-BaTO3 and Ni-PZT were fabricated
using electroless plating and electroforming. Both poled and depoled PZT ceramics were
used in the fabrication of Ni-PZT composites. The damping capacity of BaTiO3 was
evaluated as a function of temperature and frequency. The effect of time and
microstructural morphology on the damping capacity was also evaluated. In the Ni-
BaTiO3, the major damping mechanisms at different temperature sections were evaluated
to understand the damping profile of the composite. In the Ni-PZT composite, we were
able to identify and explain the differences in the damping capacity of Ni-PZT
composites fabricated using poled and depoled PZT
5.2 Conclusions
5.2.1 Damping Capacity Behavior of BaTiO3
The damping capacity behavior of BaTiO3 can be summarized as follows.
1. Below the Curie temperature, tanδ is affected by grain size and microstructural
morphology. For the small grain ceramic, we found that tanδ did not increase
sharply with temperature as the coarse grain samples did. We attributed this to
pinning of domain walls in the small grain ceramic.

85
2. For coarse grain materials with comparable grain sizes, it was seen that tanδ was
relatively higher if the proportional of ferroelectric domains in the sample is
larger.
3. Under isothermal conditions and at constant strain amplitude, tanδ was found to
decrease with number of vibration cycles (N). There was an initial sharp drop in
tanδ for approximately 2000 cycles after which the decrease leveled off. The loss
in tanδ was found to be dependent on maximum strain. The higher the maxium
strain, the lower the drop in tanδ. The loss in tanδ with time was, however,
recoverable if BaTiO3 was heated above the Curie temperature and cooled.
4. Above the Curie temperature, we observed that tanδ for samples with different
microstructural morphologies and grain sizes were similar. We concluded that the
global ceramic structure (example presence of pores) did not have a significant
effect on damping capacity.
5.2.2 Damping of Ni-BaTiO3 Composites
Vibration damping in Ni-BaTiO3 was generally seen to follow the damping profile of
bulk BaTiO3 at temperatures below Tc. Above Tc, however, the characteristic quick drop
in tanδ in bulk BaTiO3 was not seen in the composite. Above Tc, tanδ increased with
increasing temperature apparently due enhanced intrinsic damping in the Ni component
at elevated temperatures. For Ni-BaTiO3 composites with approximate composition Ni-
34vol%BaTiO3 there was a 77% percent increase in tanδ at 35oC when compared to tanδ
of pure electroformed Ni. At 100oC there was an increase of 33%. At 180oC, however,
tanδ of the composite was 14% less than the pure Ni sample
5.2.3 Damping Mechanisms in Ni-PZT Composites
In the Ni-PZT composites, ferroelastic domain damping was identified as the main
damping mechanism in composites fabricated using poled and depoled PZT ceramic.
There was no evidence of a direct piezoelectric effect damping in the composites studied.
Tanδ was higher in composites fabricated using poled PZT. The increase in tanδ was not

86
due to the direct piezoelectric effect but due to more ferroelastic domains being oriented
favorably in the same general direction as the applied stress. This ensured that more
ferroelastic domains switched during cyclic vibrations which lead to higher tanδ values.
In the depoled state, fewer domains were oriented in the direction of the of the stress,
hence few ferroelastic domains were available for switching which ultimately lead to
relatively lower tanδ values
5.3 Future Work
Some future areas of opportunities for this project include a systematic study to relate
damping capacity and the degree of polarization. Another area of interest will be the use
of pure ferroelastic ceramics such as LaAlO3. Unlike ferroelectric ceramics which
contain non-ferroelastic 180o domains, ferroelastic materials contain only ferroelastic
domains which could be switched if correctly oriented. From a practical standpoint,
ceramic whiskers would be more useful as reinforcements instead of laminates or
particulates. Another area of opportunity is a further investigation of the damping
mechanisms in a poled open circuit and poled closed circuit metal-piezoelectric ceramic
system to determine if damping from eddy current generation in the poled ceramic (both
open and closed circuits) contributes to the overall damping capacity.

87
6 Chapter 6: Electroless Plating and Electroforming
6.1 Electroless Ni Plating
Electroless Ni plating is an auto-catalytic deposition process [80, 81] for coating
substrates with a nickel-phosphorous (Ni-P) layer. Ni-P coatings are widely used for
various applications because of their excellent wear properties [82], corrosion resistance,
non-magnetic properties and excellent uniformity. Unlike electroforming electroless Ni
plating does not require an electric current; deposition is achieved through the reduction
of Ni ions in aqueous environments. Because the process is aqueous based, substrates are
easily wetted, allowing virtually any surface to be coated regardless of geometry. Hard to
reach areas such as the inner surfaces of pipes and valves for example are easily coated
with great uniformity. The structure and properties of the coating depends on several
factors including the concentration of Ni ions in solution, PH and bath temperature. The
rate of deposition is known to increase with temperature. Decomposition of the solution
can, however, occur if the temperature is too high.
Ever since Bremer and Ridell inverted electroless Ni plating in 1946, the process has
been adapted for a variety of applications. For a substrate without a catalytic active
surface, a sensitizing step with SnCl2 followed by an activating step with PdCl2 has been
incorporated in the process prior to Ni plating. With this activating step, electroless Ni
plating has been used successfully to coat naturally non-catalytic active materials such as
SiC [83] and Al2O3 [84].
The main constituents of typical electroless Ni plating bath are
1. A source for Ni ions
2. Reducing agent which provides electrons for the depositing process
Other additives are usually added to control PH and enhance adhesion of the deposit unto
the substrate. In the deposition process, each layer of Ni that is deposited on the substrate
becomes a catalyst for the next layer. If the plating bath is constantly replenished, thick
coatings of Ni up to about 2mm can achieved.

88
6.1.1 Experimental Procedure
In this work, BaTiO3 and PZT bars were coated using electroless Ni plating. Sodium
hypophosphite (NaH2PO2) was used as the reducing agent.
The ceramic bars were cleaned in alkaline solution (1M NaOH solution) and acidic
solution (dilute HCl). The purpose of the cleaning step was to remove any organic
impurities on the surface of the ceramic bars. The ceramic bars were then sensitized in a
SnCl2 solution which was followed by activating with PdCl2 to create a catalytic active
surface suitable for Ni ions to be attached to.
Electroless Ni plating was performed in a beaker on a hot plate with a magnetic stirrer.
The samples were placed in a plastic basket and then hanged in the solution. The bath
temperature was maintained at 60oC. The ceramic bars were turned from time to time to
allow even access of the plating solution onto the samples. The electroless Ni plating
setup is illustrated in Figure 6-1. After plating, the coated bars were cleaned in an
ultrasonic bath and allowed to dry at room temperature in air.
Magnetic stirrer
Plating solution
Plastic basket holding sample
Sample
Figure 6-1: Illustration of electroless Ni plating bath.

89
A step by step instructions and chemical list for the electroless plating process used in
this work is given in Tables 6-1 - 6-3.
Table 6-1: Sensitizing and activating steps for electroless Ni plating
Purpose Constituents notes time, min oC Sensitizing - 120ml DI water
- 3.0g SnCl2•2H2O 98.2% - 5ml HCl
- stir and bring to temperature - pour over powder and stir - do not allow undissolved
SnCl2 to be transferred - DI rinse when done, 3x - Avoid drying
1-3 25-30
Activating - 125ml DI water - 0.03g PdCl2 99.9+% - 0.063ml HCl (~2 drops)
- stir and bring to temperature - pour over powder and stir - do not allow undissolved
PdCl2 to be transferred - DI rinse when done, 3x - rinse once in ethyl-alcohol - allow to dry in air
1-2 40-45
Table 6-2: Composition of Ni electroless plating Bath
Purpose Constituents notes time, min oC Solution 1 - provides Ni ions
- 90ml DI water - 2.5g NiSO4
- 4.0g Na4P2O7 - 2.3 ml NH4OH
- add NiSO4 and Na4P2O7 to DI water
- stir until dissolved - slowly add NH4OH, color will change from lime to emerald green - bring to temp
until dissolved 50
Solution 2 - reducer
- 10ml DI water - 2.5g NaH2PO2
- add NaH2PO2 to DI water - stir until dissolved - add to solution 1 - let stand 1 min - add material to be plated
until dissolved room

90
Table 6-3: Chemical list for electroless Ni plating
Chemical Company Item # Nickel Sulfate Hexahydrate
NiSO4•H2O Aldrich 227676
Sodium Pyrophosphate
Na4P2O7 Aldrich P8010
Sodium Hydroxide NaOH Aldrich 484024 Sodium Hypophosphite
NaH2PO2 Aldrich S5012
Ammonium Hydroxide
NH4OH Aldrich 228228
Tin Chloride Dihydrate
SnCl2•2H2O Aldrich 208035
Palladium Chloride PdCl2 Aldrich 323373 Hydrachloric Acid HCL Aldrich 258148
6.2 Nickel Electroforming
Ni electroplating is widely used to produce corrosion resistant and wear resistant Ni or
Ni-P coatings. Composite coatings such as Ni-SiC [85, 86], Ni-Al2O3 [87] has also been
produced by the by Ni electroplating process. The electroplating process can also be
adopted to produce bulk composites. Various particulate Ni matrix composites have been
fabricated by this process [88-90]. The advantage of using the electrofoming process is
that metal deposition occurs at a relatively low temperature (about 60oC). Hence
reinforcements for Ni matrix composites such as piezoelectric ceramics that can not be
processed at the high temperatures usually used in traditional metal matrix composite
In this work, a nickel sulphamate bath was used to coat electroless nickel coated BaTiO3
and PZT bars. Figure 6.2 is an illustration of the Ni electroplating set up. Nickel beads
on a titanium strip were used as the anode while the cathode consisted of the electroless
coated BaTiO3 and PZT suspended from a stainless steel bar by copper wires. The bath
temperature was maintained at 60o C. Stirring of the solution was accomplished by
means of a magnetic stirrer. A low current of 0.16mA was used for deposition. Time of
deposition was varied obtain Ni coating of desired thickness.
Figures 6-3 -6-5 shows optical microscope images of Ni coated BaTiO3 and PZT bars
formed using electroless Ni and electroplating process.

91
Magnetic stirrer
Ni sulphamate plating solution solution
Electroless Ni coated BaTiO3 or PZT bar
Cu Wire
Ni Bead
Titanium strip anode
Steel cathode
Figure 6-2: Illustration of Ni electroforming bath.
PZT
Ni
Figure 6-3: Ni coated PZT ceramic sample. (Image taken by author)

92
BaTiO3
Ni
Figure 6-4: Ni coated BaTiO3 sample. (Image taken by author)
Electroless Ni layer
Electroformed Ni layer
25.0
5µm
Figure 6-5: Image showing electroless Ni layer and electroformed Ni layer. (Image taken by author)

93
REFERENCES
[1] R. Schaller, Mater Sci Forum 366-3 (2001) 621.
[2] P. Millet, R. Schaller and W. Benoit, J Phys-Paris 46 (1985) 405.
[3] E. J. Lavernia, R. J. Perez and J. Zhang, Metall Mater Trans A 26 (1995) 2803.
[4] R. Schaller, J Alloy Compd 355 (2003) 131.
[5] A. Wolfenden and J. M. Wolla, Journal of Materials Science 24 (1989) 3205.
[6] W. Zhang, J. M. Kim and N. Koratkar, Smart Mater Struct 12 (2003) 642.
[7] K. B. Hathaway, A. E. Clark and J. P. Teter, Metall Mater Trans A 26 (1995) 2797.
[8] B. D. Poquette, Damping behavior in ferroelectric reinforced metal matrix composites in "Materials Science and Engineering" (Virginia Polytechnic Institute and State University, Blacksburg, 2005).
[9] T. Asare, Fabrication and damping behavior of particulate BaTiO3 ceramic reinforced copper matrix composites, in "Materials Science and Engineering" (Viginia Polytechnic Institute and State University, Blacksburg, 2004).
[10] J. Schultz, T. Asare, B. Poquette, S. Kampe and D. Brown, Unpublished work (2005).
[11] J. S. Forrester, E. H. Kisi and A. J. Studer, J Eur Ceram Soc 25 (2005) 447.
[12] T. Kanata, T. Yoshikawa and K. Kubota, Solid State Communications 62 (1987) 765.
[13] T. Takeuchi, M. Tabuchi, K. Ado, K. Honjo, O. Nakamura, H. Kageyama, Y. Suyama, N. Ohtori and M. Nagasawa, Journal of Materials Science 32 (1997) 4053.
[14] T. Takeuchi, K. Ado, T. Asai, H. Kageyama, Y. Saito, C. Masquelier and O. Nakamura, J Am Ceram Soc 77 (1994) 1665.
[15] G. Arlt, D. Hennings and G. Dewith, J Appl Phys 58 (1985) 1619.
[16] A. C. Goff, A. O. Aning and S. L. Kampe, TMS Letters (2004).
[17] R. D. Batist, Internal Friction of Structural Defects in Crystalline Solids (North-Holland Publishing Company, Amsterdam, 1972).
[18] W. P. Mason, Physical Accoustics And The Properties Of Solids (D.Van Nostrand Company, New York, 1958).
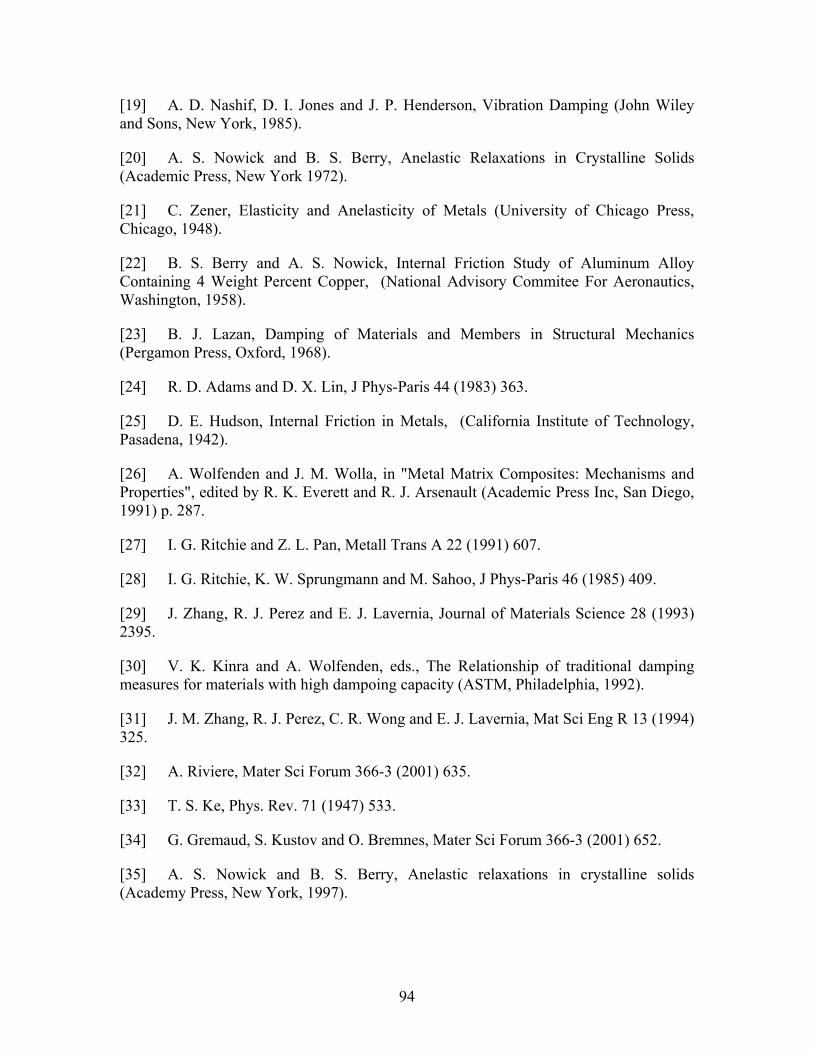
94
[19] A. D. Nashif, D. I. Jones and J. P. Henderson, Vibration Damping (John Wiley and Sons, New York, 1985).
[20] A. S. Nowick and B. S. Berry, Anelastic Relaxations in Crystalline Solids (Academic Press, New York 1972).
[21] C. Zener, Elasticity and Anelasticity of Metals (University of Chicago Press, Chicago, 1948).
[22] B. S. Berry and A. S. Nowick, Internal Friction Study of Aluminum Alloy Containing 4 Weight Percent Copper, (National Advisory Commitee For Aeronautics, Washington, 1958).
[23] B. J. Lazan, Damping of Materials and Members in Structural Mechanics (Pergamon Press, Oxford, 1968).
[24] R. D. Adams and D. X. Lin, J Phys-Paris 44 (1983) 363.
[25] D. E. Hudson, Internal Friction in Metals, (California Institute of Technology, Pasadena, 1942).
[26] A. Wolfenden and J. M. Wolla, in "Metal Matrix Composites: Mechanisms and Properties", edited by R. K. Everett and R. J. Arsenault (Academic Press Inc, San Diego, 1991) p. 287.
[27] I. G. Ritchie and Z. L. Pan, Metall Trans A 22 (1991) 607.
[28] I. G. Ritchie, K. W. Sprungmann and M. Sahoo, J Phys-Paris 46 (1985) 409.
[29] J. Zhang, R. J. Perez and E. J. Lavernia, Journal of Materials Science 28 (1993) 2395.
[30] V. K. Kinra and A. Wolfenden, eds., The Relationship of traditional damping measures for materials with high dampoing capacity (ASTM, Philadelphia, 1992).
[31] J. M. Zhang, R. J. Perez, C. R. Wong and E. J. Lavernia, Mat Sci Eng R 13 (1994) 325.
[32] A. Riviere, Mater Sci Forum 366-3 (2001) 635.
[33] T. S. Ke, Phys. Rev. 71 (1947) 533.
[34] G. Gremaud, S. Kustov and O. Bremnes, Mater Sci Forum 366-3 (2001) 652.
[35] A. S. Nowick and B. S. Berry, Anelastic relaxations in crystalline solids (Academy Press, New York, 1997).

95
[36] M. Weller, in "Mechanical Spectroscopy Q-1 2001 with Applications to Materials Science", edited by R. Schaller, G. Fantozzi and G. Gremaud (Trans Tech Publications Ltd, Switzerland, 2001) p. 95.
[37] T. A. Read, Phys. Rev. 58 (1940) 371.
[38] J. S. Koehler, (John Wiley & Sons, Inc, New York, 1952).
[39] A. Granato and K. Lücke, J Appl Phys 27 (1956) 583.
[40] A. Granato and K. Lücke, J Appl Phys 27 (1956) 789.
[41] W. Benoit, Mater Sci Forum 366-3 (2001) 291.
[42] J. E. Bishop and V. K. Kinra, Metall Mater Trans A 26 (1995) 2773.
[43] J. Zhang, R. J. Perez and E. J. Lavernia, Acta Metall Mater 42 (1994) 395.
[44] D. J. Nelson and J. W. Hancock, Journal of Materials Science 13 (1978) 2429.
[45] C. F. Burdettt and R. B. Layngs, J. PHYS. D 1 (1968) 1005.
[46] J. Degauque, Mater Sci Forum 366-3 (2001) 453.
[47] R. J. Harrison and S. A. Redfern, Phys Earth Planet In 134 (2002) 253.
[48] R. J. Harrison, S. A. T. Redfern and J. Street, Am Mineral 88 (2003) 574.
[49] V. S. Postnikov, V. S. Pavlov, S. A. Gridnev and S. K. Turkov, in Soviet Physics Solid State (1968) p. 1267.
[50] V. S. Postnikov, V. S. Pavlov and S. K. Turkov, Journal of Physics and Chemistry of Solids 31 (1970) 1785.
[51] Y. N. Wang, Y. N. Huang, H. M. Shen and Z. F. Zhang, Journal De Physique Iv 6 (1996) 505.
[52] S. Rattanachan, Y. Miyashita and Y. Mutoh, J Eur Ceram Soc 24 (2004) 775.
[53] V. Cannillo, T. Manfredini, M. Montorsi, F. Tavoni, E. J. Minay and A. R. Boccaccini, Mat Sci Eng a-Struct 399 (2005) 281.
[54] T. Lee and I. A. Aksay, Crystal Growth & Design 1 (2001) 401.
[55] K. Uchino, E. Sadanaga and T. Hirose, Journal of the American Ceramic Society 72 (1989) 1555.
[56] S. W. Lu, B. I. Lee, Z. L. Wang and W. D. Samuels, Journal of Crystal Growth 219 (2000) 269.

96
[57] W. Y. Shih, W. H. Shih and I. A. Aksay, Phys Rev B 50 (1994) 15575.
[58] X. H. Liu, W. Y. Shih and W. H. Shih, J Am Ceram Soc 80 (1997) 2781.
[59] B. L. Cheng, M. Gabbay, G. Fantozzi and W. Duffy, J Alloy Compd 212 (1994) 352.
[60] J. M. Calderon-Moreno and M. Popa, Mat Sci Eng a-Struct 336 (2002) 124.
[61] J. M. Calderon-Moreno, F. Guiu, B. Jimenez, M. J. Reece and K. S. Sohn, Ferroelectrics 228 (1999) 111.
[62] M. Alguero, B. L. Cheng, F. Guiu, M. J. Reece, M. Poole and N. Alford, J Eur Ceram Soc 21 (2001) 1437.
[63] B. L. Cheng, J. J. C. Busfield, F. Guiu, M. Aguero and M. J. Reece, Key Eng Mat 223 (2002) 61.
[64] B. L. Cheng and M. J. Reece, B Mater Sci 24 (2001) 165.
[65] B. L. Cheng, M. J. Reece, F. Guiu and M. Alguero, Scripta Mater 42 (2000) 353.
[66] S. Pojprapai, J. L. Jones and M. Hoffman, J Am Ceram Soc 89 (2006) 3567.
[67] W. P. Mason, The Journal of Acoustical Society of America 27 (1955).
[68] B. Jaffe, W. R. C. Jr and H. Jaffe, Piezoelectric Ceramics (Academic Press, 1971).
[69] L. Mitoseriu, V. Tura, M. Curteanu, D. Popovici and A. P. Anghel, Ieee T Dielect El In 8 (2001) 500.
[70] J. B, W. R. Cook Jr and H. Jaffe, Piezoelectric Ceramics (Academic Press, 1971).
[71] J. L. Fanson and T. K. Caughey, Aiaa J 28 (1990) 717.
[72] S. Hanagud and G. L. N. Babu, J Am Helicopter Soc 39 (1994) 69.
[73] S. Hanagud, M. W. Obal and A. J. Calise, J Guid Control Dynam 15 (1992) 1199.
[74] T. Bailey and J. E. Hubbard, J Guid Control Dynam 8 (1985) 605.
[75] N. W. Hagood and E. F. Crawley, J Guid Control Dynam 14 (1991) 1100.
[76] N. W. Hagood and A. Vonflotow, J Sound Vib 146 (1991) 243.
[77] S. L. Kampe, J. P. Schultz, A. O. Aning, A. Goff and J. Franklin, Piezoelectric ceramic-reinforced metal matrix composites (United States patent application number 20050073222 2005).

97
[78] M. Sumita, H. Gohda, S. Asai, K. Miyasaka, A. Furuta, Y. Suzuki and K. Uchino, Makromol Chem-Rapid 12 (1991) 657.
[79] Y. Suzuki, K. Uchino, H. Gouda, M. Sumita, R. E. Newnham and A. R. Ramachandran, Nippon Seram Kyo Gak 99 (1991) 1135.
[80] G. O. Mallory, ed., Electroless Plating: Fundermentals and Applications (AESF, Orlando, 1990).
[81] J. R. Henry, Met. Finish 97 (1999) 431.
[82] A. Ramalho and J. C. Miranda, Wear 259 (2005) 828.
[83] W. S. Chung, S. Y. Chang and S. J. Lin, Plat Surf Finish 83 (1996) 68.
[84] Y. J. Lin and B. F. Jiang, J Am Ceram Soc 81 (1998) 2481.
[85] P. Gyftou, E. A. Pavlatou, N. Spyrellis and K. S. Hatzilyberis, T I Met Finish 78 (2000) 223.
[86] P. Gyftou, M. Stroumbouli, E. A. Pavlatou and N. Spyrellis, T I Met Finish 80 (2002) 88.
[87] K. Barmak, S. W. Banovic, C. M. Petronis, D. F. Susan and A. R. Marder, J Microsc-Oxford 185 (1997) 265.
[88] L. Liu, H. J. Zhao, W. B. Hu and B. Shen, Mater Lett 59 (2005) 3014.
[89] H. J. Zhao, L. Liu, W. B. Hu and B. Shen, Mater Design 28 (2007) 1374.
[90] X. Y. Wei, Z. G. Zhu, P. D. Prewett and K. Jiang, Microelectron Eng 84 (2007) 1256.

98
VITAE
Ted Ankomahene Asare was born and raised in Ghana. He received his Bachelors degree
with First Class Honors in Materials Science and Engineering from the University of
Science and Technology, Ghana in 2001. He worked as a teaching assistant in the same
university for a year before enrolling in the Materials Science and Engineering
Department at Virginia Tech in Fall 2002. Ted joined the Kamposite metal matrix
composite research group in summer 2003, and went on to receive his MS in Materials
Science and Engineering in December 2004. After the completion of his MS, he
continued to conduct research on metal matrix composites for structural damping
applications under the direction of Professor Steve Kampe. Ted defended his PhD
dissertation in Fall 2007.