Investec Limited Annual Report - March 2021
158
Transcript of Investec Limited Annual Report - March 2021


2

01 Operational and strategic overview
Overview of the Investec group’s and Investec Limited’s organisational structure 3
Overview of the activities of Investec Limited 4
02 INL Audit Committee Report 7
03Annual financial statements
Directors’ report 19
Independent auditors’ report to the shareholders of Investec Limited 22
Income statements 29
Statements of total comprehensive income 30
Balance sheets 31
Statements of changes in equity 32
Cash flow statements 35
Accounting policies 36
Notes to the financial statements 49
Additional risk information 138
04 Shareholder analysis 149
05 Additional information 152
Glossary 154
Overview of the period Investec Limitedgroup and company annual financial statements 2021
CONTENTS
1


Operating structure
Investec Limited, which houses our Southern African operations, has been listed in South Africa since 1986.During July 2002, Investec Group Limited (since renamed Investec Limited) implemented a dual listed companies (DLC) structure and listed its offshore business on the London Stock Exchange (LSE).
In terms of the DLC structure, Investec Limited is the holding company of our businesses in Southern Africa and Investec plc is the holding company of our non-Southern African businesses. Investec Limited is listed on the Johannesburg Stock Exchange Limited (JSE) (since 1986) and Investec plc is listed on the LSE (since 2002).
In March 2020, the Asset Management business was demerged and separately listed as Ninety One plc on the LSE and Ninety One Limited on the JSE.
All references in this report to the group relate to Investec Limited, whereas references to Investec, Investec group or DLC relate to the combined DLC group comprising Investec plc and Investec Limited.
A circular on the establishment of our DLC structure was issued on 20 June 2002 and is available on our website.
Further information on the demerger can be found on our website.
The DLC structure and main operating subsidiaries at 31 March 2021
Investec plcLSE primary listing
JSE secondary listingSharing agreement
Investec LimitedJSE primary listing
NSX* secondary listingBSE* secondary listing
Non-Southern African operations
Southern African operations
Investec Bank plc
Investec Bank Limited
Investec Securities (Pty) Ltd^
Investec Property
Group Holdings (Pty)
Ltd
Investec Employee Benefits
Holdings (Pty) Ltd
Investec Wealth
& Investment Limited n
n
Operating activities key:Specialist BankingWealth & Investment
Investec Bank (Mauritius)
Limited
Investec Life Limited
* NSX - Namibian stock exchange; BSE - Botswana stock exchange. ^ Houses the Wealth & Investment business.
All shareholdings in the ordinary share capital of the subsidiaries shown are 100%. The Investec group retained a 25% shareholding in the Ninety One group, with 16.3% held through Investec plc and 8.7% held through Investec Limited.
Salient features of the DLC structureInvestec plc and Investec Limited are separate legal entities and listings, but are bound together by contractual agreements and mechanisms.
• Investec group operates as if it is a single unified economic enterprise.• Shareholders have common economic and voting interests as if Investec plc and Investec Limited were a single company.• Creditors, however, are ring-fenced to either Investec plc or Investec Limited as there are no cross-guarantees between
the companies.
01 Operational and strategic overview
Investec Limitedgroup and company annual financial statements 2021
OVERVIEW OF INVESTEC GROUP AND INVESTEC LIMITED'S ORGANISATIONAL STRUCTURE
3

Specialist Banking
Our specialist teams are well positioned to provide solutions to meet private, business, corporate and institutional clients' needs. Each business provides specialised products and services to defined target markets.
What makes us distinct?• Voted ‘Best Private Bank & Wealth Manager’ 2020
by London’s Financial Times (8 years in a row)• High-quality specialist banking solutions to corporate and
private clients with leading positions in selected areas• Provision of high-touch personalised service with the ability
to execute quickly• Ability to leverage international, cross-border platforms• Well positioned to capture opportunities between the
developed and the emerging world• Strong ability to originate, manufacture and distribute• Balanced business model with good business depth
and breadth.
Focus on helping our clients create and preserve wealth A highly valued partner and adviser to our clients
High-income and high net worth private clients Corporates/government/institutional clients
Private client banking activities Corporate, investment banking and other activities
Private Banking Corporate and Institutional Banking Investec for Business Investment Banking and
Principal Investments
• Transactional banking• Lending• Property finance• Savings
• Specialised lending• Treasury and trading
solutions• Institutional research,
sales and trading• Life assurance
products^
• Import and trade finance lending
• Cash flow lending• Asset finance
• Principal investments• Advisory• Debt and Equity
Capital Markets
Natural linkages between the private client and corporate business
^ Investec Life, which houses these products, is operationally part of Corporate and Institutional Banking although legally it is a subsidiary of Investec Limited.
Group Investments
We have separated these assets from our core banking activities to make a more meaningful assessment of the underlying performance and value of the franchise businesses, while providing transparency over the standalone values of the assets classified as Group Investments.
The assets include the 8.7% holding in Ninety One, 47.4% stake in the Investec Equity Partners (IEP) Group, 24.3% held in the Investec Property Fund (IPF) and some historical unlisted equity investments.
01 Operational and strategic overview
Investec Limitedgroup and company annual financial statements 2021
OVERVIEW OF THE ACTIVITIES OF INVESTEC LIMITED
4

Wealth & Investment
Investec Wealth & Investment is the largest manager of private client wealth in South Africa.
We instill confidence with our clients due to our scale, international reach and depth of investment process.
We manage approximately R1.2 trillion assets globally, with R333 billion managed by our South African business.
What makes us distinct?• Internationally recognised for excellence in wealth
management - voted ‘Best Private Bank & Wealth Manager’ 2020 by London’s Financial Times (8 years in a row)
• Unique One Place™ offering, enabling our clients to seamlessly bank and invest locally and internationally, all in One Place™
• Investment performance and track record supported by a rigorous global investment process and the deep expertise of our people
• Continual innovation to provide unique investment opportunities and value propositions for our clients.
Investec has established investment operations in the United Kingdom, Switzerland, Mauritius and South Africa, offering our clients a deep understanding of developed and emerging markets.
Our offering is built on the foundation of enduring client relationships with our dedicated investment managers. We partner with our clients in the active management of their wealth, based on an understanding of their investment needs. We have a rigorous approach to investments, ensuring the optimal allocation of our clients’ funds, both locally and internationally. We have a responsibility to preserve and grow the wealth that is entrusted to us over the long-term.
Sustainability is core to our fundamental investment approach by integrating environmental, social and governance considerations as well as actively engaging with the businesses that we invest in on behalf of our clients. As signatories of the United Nations PRI (Principles for Responsible Investment), our commitment to sustainability recognises the interconnected nature of our business, the economy, the environment and society.
Our service offering
Investec Wealth & Investment (IW&I) operates from nine offices across South Africa and provides portfolio management, wealth management and stockbroking services for private clients, charities, pension funds and trusts.
01 Operational and strategic overview
Investec Limitedgroup and company annual financial statements 2021
OVERVIEW OF THE ACTIVITIES OF INVESTEC LIMITEDCONTINUED
5


Zarina BassaChair of the Investec Limited Audit Committee
“The Committee believes that audit quality is essential to the fulfilment of the objectives of an effective and credible external audit. Consistent and sustainable high audit quality contributes to ensuring the continued relevance and value of audit and assurance services, which in turn are essential in providing trust and confidence to the users of financial information.”
Members Member sinceMeetings attended
Eligible to attend
Zarina Bassa (Chair) 1 Nov 2014 6 6
Philip Hourquebie 14 Aug 2017 6 6
Philisiwe Sibiya 9 Aug 2019 6 6
IntroductionThe Investec Limited Audit Committee (the Committee) is pleased to present its report for the financial year ended 31 March 2021. This report is intended to provide details on how the Committee satisfied its various statutory obligations, as well as on the key audit matters considered during the period. The Committee has further discharged its responsibilities and provided assurance on the integrity of the 2020/21 annual report and financial statements.
This report has been prepared based on the requirements of the South African Companies Act of 71 of 2008 (Companies Act), the King IV Report on Corporate Governance for South Africa 2016 (King IV), the JSE Listings Requirements, the applicable laws of establishment, Investec Limited’s memorandum of incorporation and other applicable regulatory requirements.
COVID-19 pandemicThe COVID-19 pandemic is of an unprecedented scale and has severely impacted the global economy and business across all industries. There is a significant degree of uncertainty about the further spread of the virus, the timing and the effectiveness of the vaccine roll-out and the further impact it will have on the world economy.
COVID-19 was a significant area of focus for the Committee during the year, specifically evaluating the impact of the pandemic on the:
• Integrity of internal control• Going concern and the viability
statement of Investec Limited• Expected credit loss (ECL)
assessment• Impairment of investments not
measured at fair value• Fair value measurement of complex/
illiquid assets• Impact on the quality of earnings.
Against this backdrop, Investec Limited remained profitable and capital ratios remained strong. Furthermore, liquidity within Investec Limited continued to be managed at conservative levels. Asset quality remained good, with Investec Limited active in providing COVID-19-related relief to clients where considered appropriate from an ongoing risk management and client relationship perspective.
Audit quality and independenceBusiness failures throughout global economies continue to place an increased focus on auditor independence, integrity, sufficient levels of professional scepticism of external audit, audit quality reviews and other oversight mechanisms.
The Committee treated this as a key audit matter and accordingly critically evaluated audit quality, effectiveness, independence and audit rotation requirements.
The Committee believes that audit quality is essential to the fulfilment of the objectives of a credible and effective independent external audit. Consistent and sustainable high audit quality contributes to ensuring the continued relevance and value of audit and assurance services, which in turn are essential in providing trust and confidence to the users of financial information.
01 INL Audit Committee Report Investec Limitedgroup and company annual financial statements 2021
INL AUDIT COMMITTEE REPORT
7

Role of the CommitteeThe Committee is an essential part of Investec Limited’s governance framework to which the board has delegated the following key functions:
• Overseeing Investec Limited’s financial reporting process and risks, ensuring the integrity thereof and satisfying itself that any significant judgements made by management are sound
• Reviewing Investec Limited’s internal controls and assurance processes
• Manage and oversee the performance, conduct, quality and effectiveness of Investec Limited's internal audit functions
• Oversight of group compliance• Overseeing Investec Limited’s
subsidiary audit committees, including in remote locations
• Appointing, managing and overseeing the relationship with Investec Limited’s external auditors, including the quality control, effectiveness and independence of the external audit function
• Approving the fees to be paid to external auditors
• Managing the level and nature of non-audit services provided by the external auditors
• Dealing with concerns, if any, from outside Investec Limited regarding accounting, reporting and financial control.
Further detailed responsibilities are in the terms of reference of the Committee as available on the website www.investec.com.
Committee composition, skills, experience and operationThe Committee is comprised entirely of independent non-executive directors who meet predetermined skill, competency and experience requirements. The members’ continuing independence is assessed annually by the DLC Nominations and Directors’ Affairs Committee (Nomdac), which in turn makes a recommendation on the members’ independence to the board. The DLC Nomdac and board have concluded that the Committee has the appropriate balance of knowledge and skills for them to discharge their duties.
Further details of the experience of the members can be found in their biographies on pages 80 to 82 of the Investec group's 2021 integrated annual report.
The Investec group executive, the chief financial officer, the Investec group chief operating officer (COO), the Investec group chief risk officer (CRO), the head of internal audit, the chief compliance officer and representatives from the external auditors are invited to attend all meetings. Other members of management are invited to attend meetings to provide the Committee with greater insights into specific issues or areas of Investec Limited.
The Committee chair has regular contact with the management team to discuss relevant matters directly. The internal and external auditors have direct access to the Chair, including closed sessions without management during the year, on any matter that they regard as relevant to the fulfilment of the Committee's responsibilities. The Chair meets with internal audit and the external auditors prior to Committee meetings and at other times as considered necessary by either party.
Structure of the Investec group’s Audit committees In terms of the DLC structure, the DLC board has mandated authority to the DLC Audit Committee to be the Audit Committee of the Investec group. The DLC Audit Committee oversees and considers group audit-related matters and has responsibility for audit-related
matters that are common to Investec plc and Investec Limited, and works in conjunction with these two committees to address all group reporting.
The Investec plc board has mandated authority to the Investec plc Audit Committee, and the Investec Limited board has mandated authority to the Investec Limited Audit Committee to be the Audit Committees for the respective companies and their subsidiaries. The IBP board has mandated authority to the IBP Audit Committee and the IW&I (UK) board has mandated the IW&I (UK) Audit Committee to be the Audit Committees for the respective companies and their subsidiaries. The IBP and IW&I (UK) Audit Committees report to the Investec plc Audit Committee. The IBL board has mandated authority to the IBL Audit Committee and the IW&I (South Africa) board has mandated the IW&I (South Africa) Audit Committee to be the Audit Committee of the companies and their subsidiaries. The IBL, IW&I (South Africa) and Investec Life Audit Committees report to the Investec Limited Audit Committee.
The Committee receives regular reports from the Investec Limited’s subsidiary audit committees as part of the over sight of subsidiary audit committees.
The Chair is also the chair of the following Audit Committees:
• Investec group• Investec plc• Investec Bank Limited• Investec Bank Mauritius (IBM)
The chair is also a member of the following Audit Committees:
• Investec Bank plc (IBP)• Investec Life.
The Chair attends the following committee meetings:
• Prudential Conduct and Control Committee
• Operational Risk Committee• The IT Risk and Governance
Committee• IW&I (South Africa) Audit Committee.
DLC Audit Committee
↑
Investec plc Audit Committee Investec Limited Audit Committee
↑ ↑ ↑ ↑ ↑Investec Bank plc Audit
Committee (UK)
Investec Bank Wealth & Investment Audit Committee
(UK)
Investec Bank Limited Audit
Committee
Investec Wealth & Investment Audit Committee (SA)
Investec LifeAudit Committee
01 INL Audit Committee Report Investec Limitedgroup and company annual financial statements 2021
INL AUDIT COMMITTEE REPORTCONTINUED
8

Areas covered by the Investec Limited Audit CommitteeDuring May and November, meetings were held to approve financial results. These meetings were held at a DLC group level and were classified as DLC Audit Committee meetings. The DLC Audit Committee result meetings were supplemented by dedicated meetings of the IBP and IBM Audit Committees.
The following is a summary of the meetings held by the Committee during the financial year.
2020June• Received updates in respect of outstanding matters to be
considered in the finalisation of the Investec Limited results including:– Audit status and key findings– Key valuations– Macro-economic scenarios and weighting into the IFRS 9
ECL models• Discussed and approved the financial results for the year
ended 31 March 2020• Received confirmation from all Investec Limited board sub-
committees that they have signed off on their respective reports contained in the 2020 integrated annual report
• Received confirmation that the relevant International Financial Reporting Standards (IFRS) and JSE Listings Requirements disclosure checklist had been completed in respect of the 2020 integrated annual reports of Investec Limited for the year ended 31 March 2020
• Considered the schedule of remaining audit differences• Received and considered an updated report from external
audit on the conduct and conclusions of the audit• Assessed and approved the going concern assessment and
the viability statement through a joint session with the DLC Board Risk and Capital Committee (BRCC)
• Considered the effectiveness of the finance function and chief financial officer, effectiveness of the external audit function and the re-appointment of the external auditors
• Discussed audit quality and the results of cross reviews• Received an update from group compliance
July• Deliberated the way forward in terms of auditor rotation
with input from the executive team• Put into place a process for Mandatory Audit Firm Rotation
(MAFR)• Considered the appointment of new external auditors to
commence shadowing one of the current joint auditors, starting during FY 2022
• Received an update from group compliance• Held discussions with the global leadership of our joint
audit firms on audit and reputational issues in the media
September (Two meetings were held)
• Received confirmation from assurance providers that no matters were identified which could have an impact on the interim results of Investec Limited
• Received an update from all Investec Limited subsidiary audit committees
• Received an update on amendments to the JSE Listings Requirements
• Considered and reviewed the South African Prudential Authority (PA) Trilateral arrangement letter
• Received an update from group compliance• Considered the impact of significant judgements and
estimates on the pre-close statement• Considered the appropriateness of the pre-close
announcement for the half year ended 30 September 2020
2021February• Received an update from group compliance• Reviewed a report stipulating the process followed by the
group to support the CEO and CFO control attestation to be included in financial statements
• Reviewed and discussed key audit matters for the financial year
• Considered detailed reports from all assurance providers
March• Received confirmation from assurance providers that no
matters were identified which could have an impact on the annual results of Investec Limited
• Received an update in respect of the JSE Proactive Monitoring Process
• Received and considered a report in respect of the effects of climate-related matters on financial statements
• Received an update from group compliance• Considered and reviewed applicable macro-economic
scenarios, ECLs and overlays in a joint DLC BRCC meeting held
• Reviewed and approved the pre-close announcement for the financial year ended 31 March 2021
01 INL Audit Committee Report Investec Limitedgroup and company annual financial statements 2021
INL AUDIT COMMITTEE REPORTCONTINUED
9

Areas covered by the Investec Limited Audit CommitteeKey audit mattersKey audit matters are those matters that in the view of the Committee:
• Required significant focus from the Committee.• Were considered to be significant or material in nature requiring exercise of judgement; or• Matters which were otherwise considered to be subjective from an accounting or auditing perspective. Common membership of the DLC, Investec plc, Investec Bank plc, Investec Ltd and Investec Bank Limited Audit Committees ensures that key audit matters and matters of mutual interest are communicated and addressed, where applicable. The members of the Committee may also attend other audit committee meetings, as appropriate.
The following key audit matters were deliberated by the Committee during the year:
Key audit matters What we did
Impact of COVID-19• The COVID-19 pandemic impacted the
global economy and businesses across all industries
• Considered the known accounting and operational impact of COVID-19 on the economy and business, mitigating steps and the resulting impact on the applicability of the macro-economic scenarios and the judgements and estimates used by management to prepare the annual financial statements. The areas most impacted by COVID-19 include:– Going concern and the viability statement, including liquidity– ECL assessment (IFRS 9 macro-economic scenarios, probabilities
and staging, impact on specific sectors such as aviation, hospitality, retail and property)
– Impact on quality of earnings– The financial control environment
Fair value measurement and the resulting IFRS 13 Fair Value Measurement disclosures. Steps taken by the Committee to consider these disclosures are specifically addressed below
Fair value of level 3 instruments and the resulting IFRS 13 Fair Value Measurement (IFRS 13) disclosure:• For level 3 instruments such as unlisted
investments in private equity businesses, investment properties, fair value loans and large bespoke derivative structures, there is necessarily a large degree of subjectivity surrounding the inputs to the valuations. With the lack of observable liquid market inputs, determining appropriate valuations continues to be highly judgemental
• Received presentations on the material investments across Investec Limited, including an analysis of the key judgements and assumptions applied, and approved the valuation adjustments proposed by management for the year ended 31 March 2021
• Challenged and debated significant subjective exposures and assumptions including:– The valuation principles applied for the valuation of level 3
investments (unlisted and private equity investments) and fair value loans. Particular focus was given to the impact of COVID-19 on these valuation principles
– Fair value of exposures in industries highly affected by COVID-19– The appropriateness of the IFRS 13 disclosures regarding fair value
• Considered the appropriateness of the valuation principles and inputs applied to determine the fair value of loans in the aviation industry
Investments in associates• Evaluated the appropriateness of the
carrying amount of investments in associates
• Received and reviewed technical accounting memoranda prepared by group finance on the material investments in associates across Investec Limited, addressing the appropriateness of the carrying value of the investments and the impairment assessment performed by management. This included an analysis of the key judgements and assumptions applied
• Evaluated the appropriateness of the accounting and disclosure relating to significant judgements and estimates, valuation methods and assumptions applied
Going concern and the Viability Statement• The directors are required to confirm that
they are satisfied that Investec Limited has adequate resources to continue in business for the foreseeable future
• Considered reports on Investec Limited’s budgets and forecasts, profitability, capital, liquidity and solvency, scenario stress testing and the impact of legal proceedings, if any
• Considered the results of various stress testing analyses based on different COVID-19 economic scenarios and the possible impact of COVID-19 on the ability of Investec Limited to continue as a going concern
• Jointly with the DLC BRCC, assessed the reasonableness of and approved the Viability Statement based on three-year capital plans produced by management
01 INL Audit Committee Report Investec Limitedgroup and company annual financial statements 2021
INL AUDIT COMMITTEE REPORTCONTINUED
10

Key audit matters What we did
ECL assessment• The appropriateness of the
allowance for ECLs is highly subjective and judgemental. The impact of COVID-19 and the resultant economic impacts in South Africa have resulted in additional key judgements and assumptions being made during the current year.
• Challenged the level of ECL, model methodology and assumptions applied to calculate the ECL provisions held by Investec Limited
• Reviewed and monitored Investec Limited's calculation of ECLs, trends in staging changes, model changes, scenario updates, post-model adjustments and volatility. Specific review and consideration were given to the macro-economic scenarios used to calculate the COVID-19 ECL overlays and the staging applied for COVID-19 restructured positions
• Assessed ECL experienced against forecast and considered whether the level of ECL was appropriate. Particular focus was given to COVID-19 restructured positions (payment holidays) and sectors highly impacted by COVID-19 and exposures which were specifically affected by the negative current macro-economic environment
• Evaluated the IFRS 9 disclosures for relevance and compliance with IFRS• Assessed the appropriateness of the ECL provision raised by Investec Limited for
large exposures in entities publicly perceived to be in financial distress• Reviewed the appropriateness of the forward-looking macro-economic scenarios
used in the measurement of ECL in South Africa. The Committee further evaluated the appropriateness of the management ECL overlay
• Reviewed the results of extensive benchmarking carried out by INP management on the credit loss ratio (CLR), economic scenarios applied and the coverage ratio compared to relevant peer banks. Concluded that the INP overall ECL position appeared to be reasonable compared to the industry
Cyber reporting, IT systems and controls impacting financial reporting
• Received and reviewed reports and controls in respect of cyber reporting, IT systems and controls impacting financial reporting
• Received regular minutes and reports from the DLC IT Risk and Governance Committee
External audit, audit quality and Mandatory Audit Firm Rotation (MAFR)
• Managed the relationship with the external auditors including their re-appointment.• Deliberated the way forward in terms of auditor appointment with input from the
executive team. Put in place a process for MAFR. Considered the appointment of new external auditors to commence shadowing one of the current joint auditors starting during the 2022 financial year
• Considered and approved a revised policy in respect of non-audit services rendered by external audit
• Pre-approved all non-audit services provided by external audit and confirmed the services to be within the approved non-audit services policy
• Assessed the independence and objectivity of the external auditors• Met with key members of Ernst & Young Inc. and KPMG Inc. prior to every Audit
Committee meeting to discuss the 2020/21 audit plan, key areas of focus, findings, scope and conclusions
• Met separately with the leadership of Ernst & Young Inc. and KPMG Inc. to discuss auditor accreditation, independence, firm quality control, results of internal and external regulator inspections of the firm and individual partners
• Met with Ernst & Young global leadership to discuss regulatory investigations across members firms to assess the impact on audit quality, if any, for Investec
• Obtained feedback from the cross-reviews performed by KPMG International on KPMG SA
• Discussed external audit feedback on Investec Limited’s critical accounting estimates and judgements. Noted the increased involvement of specialists from the audit firms in the more complex matters in the current year
• Discussed external auditors' draft report on specific control areas and the control environment ahead of the 2021 financial year end
• The Committee approved the external audit plan, audit fee and the main areas of focus
• Monitored audit quality and audit partner accreditation as specified by the JSEIn line with the conditions set out in Section 94(8) of the Companies Act and based on its assessment documented above, using the criteria set out by the King IV Code and the JSE Listings Requirements, the Investec Limited Audit Committee confirms its satisfaction with the performance and quality of external audit, the external auditors and lead partners.
01 INL Audit Committee Report Investec Limitedgroup and company annual financial statements 2021
INL AUDIT COMMITTEE REPORTCONTINUED
11

Key audit matters What we did
Regulatory compliance and reporting • Received regular reports from the regulatory compliance function, and reviewed the adequacy of the scope and the effectiveness of the regulatory compliance processes applied. This included the evaluation of the quality of regulatory reporting, the regulatory compliance universe, the scope and the integrity of the regulatory compliance process, the adequacy of internal regulatory compliance systems and processes, and the consideration and remediation of any findings of the internal and external auditors or regulator
Post balance sheet disclosure • Considered the need for post balance sheet disclosures. Specifically considered the impact of COVID-19 in the affected jurisdictions Investec Limited operates in as well as on specific sectors
Fair, balanced and understandable reporting• Investec Limited is required to ensure that its external
reporting is fair, balanced and understandable, and to consider whether it provides the information necessary for stakeholders to assess Investec Limited’s position, performance, business model and strategy
• Reviewed the outcomes of the combined assurance coverage model as discussed below
• The Committee undertakes an assessment on behalf of the board, to provide the board with assurance that it can make the statement
• Met with senior management to gain assurance that the processes underlying the compilation of the annual financial statements were appropriate
• Conducted an in-depth critical review of the annual financial statements and, where necessary, requested amendments to disclosure
• Reviewed the accounting treatment of key judgements and the quality of earnings assessment
• Assessed disclosure controls and procedures• Confirmed that management had reported on and
evidenced the basis on which representations to the external auditors were made
• Obtained input and assurance from the external auditors and considered the level of and conclusion on the summary of audit differences
• The Committee concluded that the processes underlying the preparation of the annual report and financial statements for the financial year ended 31 March 2021 were appropriate in ensuring that those statements were fair, balanced and understandable
• The Committee recommended to the board that the 2021 annual report and financial statements were fair, balanced and understandable
01 INL Audit Committee Report Investec Limitedgroup and company annual financial statements 2021
INL AUDIT COMMITTEE REPORTCONTINUED
12

Other matters considered by the Investec Limited Audit Committee:The Committee considered the following matters during the financial year ended 31 March 2021:
Other matters What we did
Combined assurance model • Satisfied itself with the appropriateness of the design and effectiveness of the combined assurance model applied, which incorporates the various disciplines of risk management, operational risk, legal, regulatory compliance, internal audit, external audit and other external assurance providers. Satisfied itself with the levels of assurance and mitigants so that, taken as a whole, there is sufficient and appropriate assurance regarding mitigants for the key risks
• Reviewed the year end conclusions from internal audit on internal control, the risk management framework and internal financial controls based on their planned and actual audit coverage for the year
• Reviewed the results of the Combined Assurance Matrix (CAM) coverage plan at the year end to assess the results of actual coverage and conclusions relative to planned coverage for the year. Concluded that the CAM formed an appropriate basis for assurance coverage and outcomes
Internal controls• The effectiveness of the overall control
environment, the status of any material control issues with emphasis on the progress of specific remediation plans
• Attended and received regular reports from the IBL BRCC. Based on this reporting, evaluated the impact of an evolving risk environment, including operational risk, on the internal control environment
• Evaluated and tracked the status of the most material control issues identified by internal and external audit and tracked the progress of the associated remediation plans against agreed time frames
• Reviewed reports from the independent audit committees of the group's subsidiaries
• Evaluated the impact of work from home on the overall control environment and operational risk
• Evaluated reports on the internal control environment from the internal and external auditors
• Monitored close-out of internal and external audit findings• Attended and received regular reports from the IT Risk and
Governance Committee regarding the monitoring and effectiveness of the group’s IT controls. Considered updates on key internal and external audit findings in relation to the IT control environment
• Reviewed and approved the combined assurance model, ensuring completeness of risks and adequacy, and effectiveness of assurance coverage
• Evaluated reports on cyber security within Investec Limited• Reviewed and evaluated the work performed by management to
support the control attestation to be made by the chief executive and CFO as required by the JSE Listings Requirements 3.84(k)
Business control environment• The effectiveness of the control
environment in each individual business, including the status of any material control issues and the progress of specific remediation plans
• Received regular reports from the subsidiary audit committees• Assessed reports on individual businesses and their control
environments, scrutinised any identified control failures and closely monitored the status of remediation plans
• Received updates from senior management and scrutinised action plans following internal audit findings
Finance function • Discussed and concluded that the finance functions of Investec Limited and its subsidiaries was adequately skilled, resourced and experienced to perform the financial reporting for Investec Limited
• Concluded that the chief financial officer, Nishlan Samujh, had the appropriate expertise and experience to meet the responsibilities of the position
01 INL Audit Committee Report Investec Limitedgroup and company annual financial statements 2021
INL AUDIT COMMITTEE REPORTCONTINUED
13

Internal audit• The performance of internal audit and
delivery of the internal audit plan, including scope of work performed, the level of resources, the risk assessment methodology and coverage of the internal audit plan
• The Committee is responsible for assessing audit quality in relation to internal audit
• Scrutinised and reviewed internal audit plans, risk assessments, methodology and staffing and approved the annual plan. Assumed responsibility for the monitoring and following up of internal audit control findings, including IT, and ensured appropriate mitigation and timeous close-out by management
• Received regular reports from internal audit on all significant issues identified
• Monitored delivery of the agreed audit plans, including assessing internal audit resources
• Tracked high and moderate risk findings, and monitored related remediation plans
• Met with the heads of internal audit prior to each Audit Committee meeting, without management being present, to discuss the remit of internal audit and any issues arising from the internal audits conducted
• Monitored audit quality in relation to internal audit• Confirmed that it was satisfied with the performance of the internal
audit function• Discussed and considered the internal audit quality assurance
programme. The internal audit quality assurance programme is designed in line with the Institute of Internal Auditors’ (IIA) International Professional Practices Framework (which includes the International Standards for the Professional Practice of Internal Auditing and the Code of Professional Conduct, including the Code of Ethics)
• The results of the post-engagement quality assurance programme inform any training interventions required within the team, and the results are consolidated and presented to the Committee on an annual basis
• Discussed and considered the quality assurance programme. The quality assurance programme is multi-faceted and includes the attraction, development and retention of adequately skilled staff that exercise proficiency and due professional care, adherence to the global internal audit governance framework and audit methodology, oversight and detailed review of every audit engagement and a quarterly post-engagement quality assurance programme
• Reviewed the Engagement Quality Assurance Review (EQAR) conducted by an external provider during 2020, with no material issues impacting reliance on the internal audit function. Tracked the progress of remediation of improvement plans as discussed and approved in a workshop with the Audit Committee and executive
• Received an opinion from internal audit on internal controls and the integrated risk management framework as part of the year end sign-off process
• Considered the succession, skills matrix and the Continuous Professional Development of internal audit
• Had a closed session of the Audit Committee with internal audit without management present
Other matters What we did
01 INL Audit Committee Report Investec Limitedgroup and company annual financial statements 2021
INL AUDIT COMMITTEE REPORTCONTINUED
14
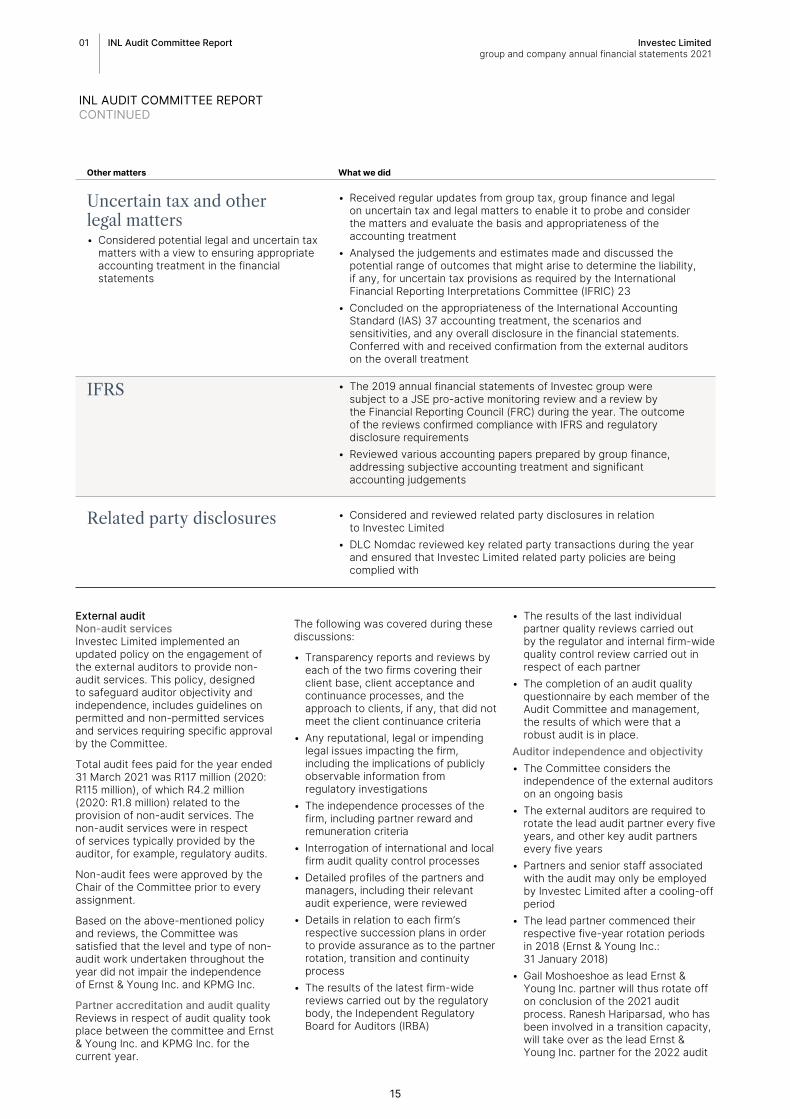
Uncertain tax and other legal matters• Considered potential legal and uncertain tax
matters with a view to ensuring appropriate accounting treatment in the financial statements
• Received regular updates from group tax, group finance and legal on uncertain tax and legal matters to enable it to probe and consider the matters and evaluate the basis and appropriateness of the accounting treatment
• Analysed the judgements and estimates made and discussed the potential range of outcomes that might arise to determine the liability, if any, for uncertain tax provisions as required by the International Financial Reporting Interpretations Committee (IFRIC) 23
• Concluded on the appropriateness of the International Accounting Standard (IAS) 37 accounting treatment, the scenarios and sensitivities, and any overall disclosure in the financial statements. Conferred with and received confirmation from the external auditors on the overall treatment
IFRS • The 2019 annual financial statements of Investec group were subject to a JSE pro-active monitoring review and a review by the Financial Reporting Council (FRC) during the year. The outcome of the reviews confirmed compliance with IFRS and regulatory disclosure requirements
• Reviewed various accounting papers prepared by group finance, addressing subjective accounting treatment and significant accounting judgements
Related party disclosures • Considered and reviewed related party disclosures in relation to Investec Limited
• DLC Nomdac reviewed key related party transactions during the year and ensured that Investec Limited related party policies are being complied with
Other matters What we did
External auditNon-audit servicesInvestec Limited implemented an updated policy on the engagement of the external auditors to provide non-audit services. This policy, designed to safeguard auditor objectivity and independence, includes guidelines on permitted and non-permitted services and services requiring specific approval by the Committee.
Total audit fees paid for the year ended 31 March 2021 was R117 million (2020: R115 million), of which R4.2 million (2020: R1.8 million) related to the provision of non-audit services. The non-audit services were in respect of services typically provided by the auditor, for example, regulatory audits.
Non-audit fees were approved by the Chair of the Committee prior to every assignment.
Based on the above-mentioned policy and reviews, the Committee was satisfied that the level and type of non-audit work undertaken throughout the year did not impair the independence of Ernst & Young Inc. and KPMG Inc.
Partner accreditation and audit qualityReviews in respect of audit quality took place between the committee and Ernst & Young Inc. and KPMG Inc. for the current year.
The following was covered during these discussions:
• Transparency reports and reviews by each of the two firms covering their client base, client acceptance and continuance processes, and the approach to clients, if any, that did not meet the client continuance criteria
• Any reputational, legal or impending legal issues impacting the firm, including the implications of publicly observable information from regulatory investigations
• The independence processes of the firm, including partner reward and remuneration criteria
• Interrogation of international and local firm audit quality control processes
• Detailed profiles of the partners and managers, including their relevant audit experience, were reviewed
• Details in relation to each firm’s respective succession plans in order to provide assurance as to the partner rotation, transition and continuity process
• The results of the latest firm-wide reviews carried out by the regulatory body, the Independent Regulatory Board for Auditors (IRBA)
• The results of the last individual partner quality reviews carried out by the regulator and internal firm-wide quality control review carried out in respect of each partner
• The completion of an audit quality questionnaire by each member of the Audit Committee and management, the results of which were that a robust audit is in place.
Auditor independence and objectivity• The Committee considers the
independence of the external auditors on an ongoing basis
• The external auditors are required to rotate the lead audit partner every five years, and other key audit partners every five years
• Partners and senior staff associated with the audit may only be employed by Investec Limited after a cooling-off period
• The lead partner commenced their respective five-year rotation periods in 2018 (Ernst & Young Inc.: 31 January 2018)
• Gail Moshoeshoe as lead Ernst & Young Inc. partner will thus rotate off on conclusion of the 2021 audit process. Ranesh Hariparsad, who has been involved in a transition capacity, will take over as the lead Ernst & Young Inc. partner for the 2022 audit
01 INL Audit Committee Report Investec Limitedgroup and company annual financial statements 2021
INL AUDIT COMMITTEE REPORTCONTINUED
15

Auditor independence and objectivity (continued)• The external auditors have confirmed
their independence and were requested to review and confirm the level of staff transactions with Investec, if any, to ensure that all auditors on the audit meet the independence criteria.
Following due consideration, we continue to believe that the following are adequate safeguards to ensure that the audit process is both objective and effective:
• The extent of audit cross-reviews, both between the joint auditors of Investec Limited reviews by KPMG International
• The additional cross-reviews by the Investec Limited and Investec plc auditors across Investec group supported by partner rotation
• Limitations on delivering non-audit services including pre-approval on non-audit work
• The confirmation of the independence of the firms and auditors involved
• Formal audit quality process undertaken by the Committee.
Mandatory Audit Firm RotationIn terms of the Banks Act in South Africa Investec Limited is required to appoint joint auditors.
The rule on MAFR as issued by the IRBA requires that an audit firm shall not serve as the appointed auditor of a public interest entity for more than ten consecutive financial years. Thereafter, the audit firm will only be eligible for reappointment as the auditor after the expiry of at least five financial years. The requirement is effective for financial years commencing on or after 1 April 2023. If, at the effective date, the entity has appointed joint auditors and both have had audit tenure of ten years or more, then only one audit firm is required to rotate at the effective date and the remaining audit firm will be granted an additional two years before rotation is required.
The Committee considered the implications of the MAFR rule as issued by IRBA, the requirements of the Companies Act and the state of the audit profession in South Africa including reputational or apparent audit failure perceptions. The views expressed by shareholders have been a key consideration, balanced with the implications of having joint auditors and the risks inherent to an audit transition. Based on this assessment, following a comprehensive tender process, PricewaterhouseCoopers Incorporated (PwC) was nominated as one of the new joint external auditors for the financial year starting 1 April 2023. The appointment of the firm and designated audit partner is subject to regulatory approval from the South African PA. The appointment of PwC will be recommended to the ordinary shareholders at the annual general meeting (AGM) to be held in August 2022. A formal transition process will commence from during 2022 whereby PwC will observe the full audit cycle performed by the incumbent joint external auditors.
A competitive tender process for the second rotation will commence during 2022 with the second incoming audit firm to perform the first audit for the financial year starting 1 April 2025, in accordance with the MAFR rules as published by the IRBA.
Re-election of auditorsThe Committee has considered the following in proposing the appointment of external auditors:
• The regulatory need for joint auditors• The state of the audit profession in
South Africa• The level of specialisation, footprint,
capacity and experience required by a firm in performing a joint audit of a bank or financial services group which is of systemic importance
• Level of quality control within the audit firms as evidenced by the results of internal and external regulatory reviews performed on audit firms and engagement partners
• The level of inherent risk in auditing a financial services group and the consequent audit risk
• Independence of the external auditor• The fundamental demands on audit
quality, the level of audit risk given the turmoil in the audit profession, balanced against shareholder views on firm rotation.
In line with the conditions set out in Section 94(8) of the Companies Act, and based on its assessment, using the criteria set out by the King IV Code and the JSE, and considering the guidance provided in the FRC guide on Audit Committees, the Committee confirms its satisfaction with the performance and quality of external audit, the external auditors and lead partners.
In making the recommendation for the re-election of Investec Limited’s auditors, the board and the Investec Limited Audit Committee have taken into consideration the Companies Act and the South African PA requirements with respect to joint auditors and mandatory firm rotation together with the results of the Audit Committee’s extensive, formalised process to satisfy itself as to auditor independence and audit quality. The board and the Committee is recommending the re-election of KPMG Inc. and Ernst & Young Inc. as joint auditors of Investec Limited at its AGM in August 2021.
Looking aheadThe role of the Committee will remain focused on:
• Ensuring the effective functioning of Investec Limited's financial systems, processes and controls, monitored by an effective combined assurance model
• Audit quality and independence• Management's response in respect
of future changes to IFRS and other regulations
• The appointment of the second external audit firm as part of the MAFR
• The implications of Environmental, Social and Governance risk (ESG) in measuring the sustainability and societal impact of an investment in a company or business
• The impact of COVID-19 on the economy and the consequent impact on financial systems and reporting, including viability, results of operations and financial position of Investec Limited
• Continue to exercise oversight over subsidiary audit committees.
Zarina BassaChair, INL Audit Committee23 June 2021
01 INL Audit Committee Report Investec Limitedgroup and company annual financial statements 2021
INL AUDIT COMMITTEE REPORTCONTINUED
16


The directors' report for the year ended 31 March 2021 comprises pages 18 to 21 of this report, together with the sections of the annual report incorporated by reference.
The directors’ report deals with the requirements of Investec Limited.
The following matters have been included in the strategic report in volume one of the Investec group's 2021 integrated annual report on pages 3 to 196, as the board considers them to be of strategic importance:
• Future business developments (throughout the strategic report)
• Risk management in volume two of the Investec group's 2021 integrated annual report
• Information on how the directors have had regard to the group's stakeholders, and the effect of that regard, on pages 23 to 33 of volume one of the Investec group's 2021 integrated annual report.
Information relating to financial instruments can be found on pages 74 to 90 in volume three of the Investec group's 2021 integrated annual report and is incorporated by reference.
For information on our approach to social, environmental and ethical matters, please refer to the 2021 Investec group sustainability and ESG supplementary report which is available on the website www.investec.com.
For information on the corporate governance of the Investec group, please refer to our corporate governance section in volume one of the Investec group’s 2021 integrated annual report.
Directors The membership of the board and biographical details of the directors are provided on pages 80 to 82 of volume one of the Investec group’s 2021 integrated annual report
Changes to the composition of the board during the year and up to the date of this report are shown in the table below:
Role
Effective date of departure/ appointment
Departures
David van der Walt
Executive director 4 June 2020
Ian Kantor Non-executive director 6 August 2020
Appointments
Ciaran Whelan Executive director 1 April 2020
Stephen Koseff
Non-executive director
17 September 2020
Richard Wainwright
Executive director
17 September 2020
Nicky Newton-King
Non-executive director 21 May 2021
Jasandra Nyker
Non-executive director 21 May 2021
Brian Stevenson
Non-executive director 22 June 2021
Ian Kantor, a non-executive director, co-founder and former chief executive of the group, did not stand for re-election at the 2020 AGM, and therefore stood down from the board in August 2020. The board is grateful to Ian for his exemplary service, commitment and contribution to the group, and wishes him well with his future endeavours.
Company secretaryThe company secretary of Investec Limited is Niki van Wyk.
The company secretary is professionally qualified and has gained experience over many years. Her performance is evaluated by board members during the annual board evaluation process. She is responsible for the flow of information to the board and its committees, and for ensuring compliance with board procedures. All directors have access to the advice and services of the company secretary, whose appointment and removal are a board matter.
In compliance with the King IV Code, the Companies Act and the JSE Listings Requirements, the board has considered and is satisfied that the company secretary is competent, and has the relevant qualifications and experience.
For information on compliance with King IV, please refer to our corporate governance section in volume one of the Investec group’s 2021 integrated annual report.
Debt OfficerLaurence Adams was appointed as the Debt Officer of Investec Limited with effect from 27 November 2020. In compliance with the JSE Listings Requirements, the board of Investec
Limited has considered and is satisfied with the competence, qualifications and experience of the Debt Officer.
Induction, training and developmentOn appointment to the board, all directors receive comprehensive induction which is tailored to the new director’s individual requirements. The induction schedule is designed to provide the new director with an understanding of how Investec Limited works and the key issues it faces. The company secretary consults the Chair when designing an induction schedule, giving consideration to the particular needs of the new director. When a director joins a board committee, the schedule includes an induction to the operations of that committee.
The Chair leads the training and development of directors and the board generally.
A comprehensive development programme is in place throughout the year, and comprises of both formal and informal training and information sessions.
Directors and their interestsDetails of the directors’ shareholdings and options to acquire shares are set out on pages 151 to 195 of volume one of the Investec group's 2021 integrated annual report
Directors' conflicts of interest Investec Limited has procedures in place for managing conflicts of interest. Should a director become aware that they, or any of their connected parties, have an interest in an existing or proposed transaction with Investec Limited, they are required to notify the board in writing immediately or at the next board meeting. Internal controls are in place to ensure that any related party transactions involving directors, or their connected parties, are conducted on an arm's length basis. Directors have a continuing duty to update any changes to these conflicts.
Directors’ and officers’ liability insuranceInvestec Limited maintains directors' and officers' liability insurance which provides appropriate cover for legal action brought against its directors.
Directors remuneration
Details of directors remuneration are set out on pages 153 to 195 of volume one of the Investec group's 2021 integrated annual report
03 Annual financial statements Investec Limitedgroup and company annual financial statements 2021
DIRECTORS' REPORT
18
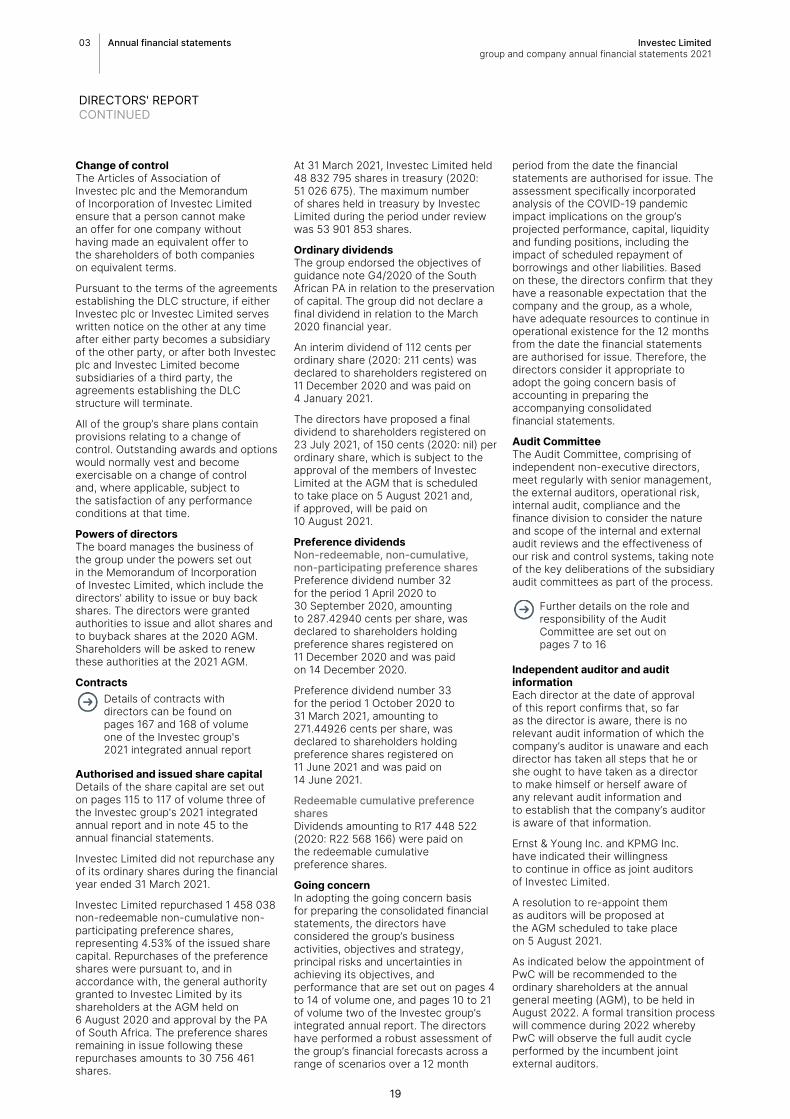
Change of controlThe Articles of Association of Investec plc and the Memorandum of Incorporation of Investec Limited ensure that a person cannot make an offer for one company without having made an equivalent offer to the shareholders of both companies on equivalent terms.
Pursuant to the terms of the agreements establishing the DLC structure, if either Investec plc or Investec Limited serves written notice on the other at any time after either party becomes a subsidiary of the other party, or after both Investec plc and Investec Limited become subsidiaries of a third party, the agreements establishing the DLC structure will terminate.
All of the group’s share plans contain provisions relating to a change of control. Outstanding awards and options would normally vest and become exercisable on a change of control and, where applicable, subject to the satisfaction of any performance conditions at that time.
Powers of directorsThe board manages the business of the group under the powers set out in the Memorandum of Incorporation of Investec Limited, which include the directors' ability to issue or buy back shares. The directors were granted authorities to issue and allot shares and to buyback shares at the 2020 AGM. Shareholders will be asked to renew these authorities at the 2021 AGM.
ContractsDetails of contracts with directors can be found on pages 167 and 168 of volume one of the Investec group's 2021 integrated annual report
Authorised and issued share capitalDetails of the share capital are set out on pages 115 to 117 of volume three of the Investec group's 2021 integrated annual report and in note 45 to the annual financial statements.
Investec Limited did not repurchase any of its ordinary shares during the financial year ended 31 March 2021.
Investec Limited repurchased 1 458 038 non-redeemable non-cumulative non-participating preference shares, representing 4.53% of the issued share capital. Repurchases of the preference shares were pursuant to, and in accordance with, the general authority granted to Investec Limited by its shareholders at the AGM held on 6 August 2020 and approval by the PA of South Africa. The preference shares remaining in issue following these repurchases amounts to 30 756 461 shares.
At 31 March 2021, Investec Limited held 48 832 795 shares in treasury (2020: 51 026 675). The maximum number of shares held in treasury by Investec Limited during the period under review was 53 901 853 shares.
Ordinary dividendsThe group endorsed the objectives of guidance note G4/2020 of the South African PA in relation to the preservation of capital. The group did not declare a final dividend in relation to the March 2020 financial year.
An interim dividend of 112 cents per ordinary share (2020: 211 cents) was declared to shareholders registered on 11 December 2020 and was paid on 4 January 2021.
The directors have proposed a final dividend to shareholders registered on 23 July 2021, of 150 cents (2020: nil) per ordinary share, which is subject to the approval of the members of Investec Limited at the AGM that is scheduled to take place on 5 August 2021 and, if approved, will be paid on 10 August 2021.
Preference dividendsNon-redeemable, non-cumulative, non-participating preference sharesPreference dividend number 32 for the period 1 April 2020 to 30 September 2020, amounting to 287.42940 cents per share, was declared to shareholders holding preference shares registered on 11 December 2020 and was paid on 14 December 2020.
Preference dividend number 33 for the period 1 October 2020 to 31 March 2021, amounting to 271.44926 cents per share, was declared to shareholders holding preference shares registered on 11 June 2021 and was paid on 14 June 2021.
Redeemable cumulative preference sharesDividends amounting to R17 448 522 (2020: R22 568 166) were paid on the redeemable cumulative preference shares.
Going concernIn adopting the going concern basis for preparing the consolidated financial statements, the directors have considered the group’s business activities, objectives and strategy, principal risks and uncertainties in achieving its objectives, and performance that are set out on pages 4 to 14 of volume one, and pages 10 to 21 of volume two of the Investec group’s integrated annual report. The directors have performed a robust assessment of the group’s financial forecasts across a range of scenarios over a 12 month
period from the date the financial statements are authorised for issue. The assessment specifically incorporated analysis of the COVID-19 pandemic impact implications on the group’s projected performance, capital, liquidity and funding positions, including the impact of scheduled repayment of borrowings and other liabilities. Based on these, the directors confirm that they have a reasonable expectation that the company and the group, as a whole, have adequate resources to continue in operational existence for the 12 months from the date the financial statements are authorised for issue. Therefore, the directors consider it appropriate to adopt the going concern basis of accounting in preparing the accompanying consolidated financial statements.
Audit CommitteeThe Audit Committee, comprising of independent non-executive directors, meet regularly with senior management, the external auditors, operational risk, internal audit, compliance and the finance division to consider the nature and scope of the internal and external audit reviews and the effectiveness of our risk and control systems, taking note of the key deliberations of the subsidiary audit committees as part of the process.
Further details on the role and responsibility of the Audit Committee are set out on pages 7 to 16
Independent auditor and audit informationEach director at the date of approval of this report confirms that, so far as the director is aware, there is no relevant audit information of which the company’s auditor is unaware and each director has taken all steps that he or she ought to have taken as a director to make himself or herself aware of any relevant audit information and to establish that the company’s auditor is aware of that information.
Ernst & Young Inc. and KPMG Inc. have indicated their willingness to continue in office as joint auditors of Investec Limited.
A resolution to re-appoint them as auditors will be proposed at the AGM scheduled to take place on 5 August 2021.
As indicated below the appointment of PwC will be recommended to the ordinary shareholders at the annual general meeting (AGM), to be held in August 2022. A formal transition process will commence during 2022 whereby PwC will observe the full audit cycle performed by the incumbent joint external auditors.
03 Annual financial statements Investec Limitedgroup and company annual financial statements 2021
DIRECTORS' REPORTCONTINUED
19

A competitive tender process for the second rotation will commence during 2022, with the second incoming audit firm to perform the first audit for the financial year starting 1 April 2025, in accordance with the MAFR rules as published by the IRBA.
Major shareholdersThe largest shareholders of Investec Limited are reflected on page 127 of volume one of the Investec group's 2021 integrated annual report
Special resolutionsInvestec LimitedAt the AGM held on 6 August 2020, the following special resolutions were passed in terms of which:
• A renewable authority was granted to Investec Limited and any of its subsidiaries to acquire its own ordinary shares in terms of the provisions of the Companies Act
• A renewable authority was granted to Investec Limited and any of its subsidiaries to acquire its own preference shares in terms of the provisions of the South African Companies Act
• A renewable authority was granted to Investec Limited to provide financial assistance in order to comply with the provisions of Sections 44 and 45 of the Companies Act
• A renewable authority was granted to Investec Limited to approve the directors’ remuneration in order to comply with the provisions of Sections 65(11)(h), 66(8) and 66(9) of the Companies Act.
AGM update statementAt the AGM on 6 August 2020, resolution 13 (approval of the DLC directors’ remuneration report for the year ended 31 March 2020), resolution 14 (approval of the DLC Directors’ Remuneration Policy), and resolution 21 (re-appointment of KPMG Inc. as joint auditors of Investec Limited), passed with a less than 80% majority.
The board recognises that effective communication is integral in building stakeholder value and is committed to providing meaningful, transparent, timely and accurate financial and non-financial information to our stakeholders. In addition to formal, written communication, executive management and non-executive board members continue to engage with our shareholders on a regular basis.
Commenting on the less than 80% vote received for the re-appointment of KPMG Inc. as joint auditors of Investec Limited
Following a comprehensive tender process, PricewaterhouseCoopers Incorporated (PwC) was nominated as one of the new joint external auditors effective 1 April 2023. The appointment of the firm and the designated audit partner is subject to regulatory approval from the PA of South Africa. The appointment of PwC will be recommended to shareholders at the AGM to be held in August 2022.
A formal transition process will commence during 2022, whereby the appointed firm will observe the full audit cycle performed by the incumbent joint external auditors. The appointment will be for the reporting period commencing 1 April 2023. The second rotation of the joint external auditors will take place within two years from 1 April 2023, in accordance with the MAFR rules as published by the IRBA.
Refer to pages 15 to 16 for further details in regards to the Audit Committee's review of the external auditors, and the MAFR process.
Commenting on the less than 80% vote received for the group’s Remuneration report and remuneration policyThe group engaged extensively with shareholders on the implementation of its remuneration report and the proposed remuneration policy in the months preceding the AGM, and the board and DLC Remuneration Committee welcomed the broad shareholder support for the remuneration report and remuneration policy.
Following the AGM, the group has continued to consult with shareholders on remuneration matters, including the remuneration targets for the 2020 Long-Term Incentive award and 2021 Short-Term Incentive award together with the proposed remuneration policy, which will be put to a shareholder vote at the AGM on 5 August 2021.
Refer to pages 160 to 171 of volume one of the Investec group's 2021 integrated annual report for a summary of the revised remuneration policy.
EmployeesInvestec Limited's approach is to recruit and promote on the basis of aptitude and attitude, with the deliberate intent to build a diverse workforce and promote an inclusive workplace, fully representative of the jurisdictions population. Investec Limited's policy is to adopt an open management style, thereby encouraging informal consultation at all levels about aspects of the group’s operations, and to incentivise employees to take an interest in the group’s performance by means of employee share schemes.
Further information is provided in the 2021 Investec group sustainability and ESG supplementary report
Empowerment and transformationInvestec Limited endeavours to prevent and/or eliminate any form of discrimination based on gender, race, ethnicity, religion, age, disability, nationality or sexual preferences. People with disabilities are an essential part of a diverse talent pool and are always considered, with every effort made to accommodate and facilitate an accessible environment. In the event of employees becoming disabled while in our employ, we are committed to ensuring their continued employment to the extent that this is possible. We have various processes to encourage debate and dialogue around valuing diversity and differences. Emerging and established leaders are invited to participate in discussions with the executive leadership around all issues related to talent management and diversity
Research and developmentIn the ordinary course of business, the group develops new products and services in each of its business divisions.
Political donations and expenditureInvestec Limited did not make any political donations in the financial year ended 31 March 2021 (2020: Nil).
Subsidiary and associated companiesDetails of principal subsidiary and associated companies are reflected on pages 132 to 137 of volume three of the Investec group's 2021 integrated annual report
Signed on behalf of the board of Investec Limited
Niki van WykCompany secretary23 June 2021
03 Annual financial statements Investec Limitedgroup and company annual financial statements 2021
DIRECTORS' REPORTCONTINUED
20

Directors’ responsibilitiesThe following statement, which should be read in conjunction with the auditor’s report set out on pages 22 to 28, is made with a view to distinguishing for shareholders the respective responsibilities of the directors and of the auditors in relation to the accounts.
The directors are required by the South African Companies Act to prepare group and company accounts for each financial year and, with regards to group accounts, in accordance with Article 4 of the IAS Regulation. The directors have prepared group and company accounts in accordance with IFRS.
The directors consider that, in preparing the financial statements the group and company have used appropriate accounting policies supported by reasonable judgements and estimates, and that all accounting standards which they consider to be applicable have been followed.
Having taken all the matters considered by the board and brought to the attention of the board during the year into account, the directors are satisfied that the annual report and financial statements, taken as a whole, are fair, balanced and understandable, and provide the information necessary for shareholders to assess the group and company’s position and performance, business model and strategy.
Directors are responsible for such internal control as they determine is necessary to enable the preparation of financial statements that are free from material misstatement, whether due to fraud or error.
Directors’ responsibility statementThe directors have a responsibility for ensuring that the company and the group keep accounting records which disclose, with reasonable accuracy, the financial position of the company and the group, and which enable them to ensure that the accounts comply with the Companies Act.
The directors are also responsible for preparing a strategic report, directors’ report, directors’ remuneration report and corporate governance statement in accordance with applicable laws and regulations.
The directors, whose names and functions are set out on pages 80 to 82 of volume one of the Investec group's 2021 integrated annual report confirm to the best of their knowledge that:
• The financial statements, prepared in accordance with the applicable set of accounting standards, give a true and fair view of the assets, liabilities, financial position and profit or loss of the company and the undertakings
included in the consolidation taken as a whole; and
• That the annual report, including the strategic report, includes a fair review of the development and performance of the business and the position of the company and undertakings, included in the consolidation taken as a whole, together with a description of the principal risks and uncertainties that they face;
• That they consider that the annual report, taken as a whole, is fair, balanced and understandable and provides the information necessary for shareholders to assess the company’s position, performance, business model and strategy.
Chief Executive and Group Finance Director responsibility statementThe directors, whose names are stated below, hereby confirm that:
• The annual financial statements set out on pages 25 to 51 of volume three of the Investec group’s 2021 integrated annual report, fairly present in all material respects the financial position, financial performance and cash flows of the issuer in terms of International Financial Reporting Standards (IFRS)
• No facts have been omitted or untrue statements made that would make the annual financial statements false or misleading
• Internal financial controls have been put in place to ensure that material information relating to the issuer and its consolidated subsidiaries have been provided to effectively prepare the financial statements of the issuer; and
• The internal financial controls are adequate and effective and can be relied upon in compiling the annual financial statements, having fulfilled our role and function within the combined assurance model pursuant to principle 15 of the King Code. Where we are not satisfied, we have disclosed to the audit committee and the auditors the deficiencies in design and operational effectiveness of the internal financial controls and any fraud that involves directors and have taken the necessary remedial action.
Fani TitiChief Executive23 June 2021
Nishlan SamujhGroup Finance Director23 June 2021
Financial resultsThe results of Investec Limited is set out in the annual financial statements and accompanying notes for the year ended 31 March 2021.
The preparation of these results were supervised by the Group Finance Director, Nishlan Samujh.
Approval of annual financial statementsThe directors’ report and the annual financial statements of the companies and Investec group, which appear on pages 78 to 130 in volume one and pages 25 to 151 of volume three of the Investec group’s 2021 integrated annual report, were approved by the board of directors on 23 June 2021.
The directors are responsible for the maintenance and integrity of the corporate and financial information included on the companies’ website.
Signed on behalf of the board of Investec Limited
Perry Crosthwaite Chair23 June 2021
Fani TitiChief Executive 23 June 2021
Declaration by the company secretaryIn terms of Section 88(2)(e) of the Companies Act, I hereby certify that, to the best of my knowledge and belief, Investec Limited has lodged with the Companies and Intellectual Property Commission, for the financial year ended 31 March 2021, all such returns and notices as are required in terms of the Companies Act and that all such returns and notices are true, correct and up to date.
Niki van WykCompany secretary23 June 2021
03 Annual financial statements Investec Limitedgroup and company annual financial statements 2021
DIRECTORS' REPORTCONTINUED
21

To the Shareholders of Investec LimitedReport on the Audit of the Consolidated Financial StatementsOpinionWe have audited the consolidated financial statements of Investec Limited and its subsidiaries (the group), which comprise the balance sheet at 31 March 2021, the income statement, the statement of total comprehensive income, the statement of changes in equity and the cash flow statement for the year then ended, accounting policies and the notes to the financial statements, as set out on pages 29 to 137.
In our opinion the consolidated financial statements of Investec Limited and its subsidiaries, for the year ended 31 March 2021 are prepared, in all material respects, in accordance with the basis of preparation disclosed in the accounting policies to the consolidated financial statements.
Basis for OpinionWe conducted our audit in accordance with International Standards on Auditing (ISAs). Our responsibilities under those standards are further described in the Auditors’ Responsibilities for the Audit of the Consolidated Financial Statements section of our report. We are independent of the group in accordance with the Independent Regulatory Board for Auditors’ Code of Professional Conduct for Registered Auditors (IRBA Code) and other independence requirements applicable to performing audits of financial statements of the group in South Africa. We have fulfilled our other ethical responsibilities in accordance with the IRBA Code and in accordance with other ethical requirements applicable to performing audits of the group in South Africa. The IRBA Code is consistent with the corresponding sections of the International Ethics Standards Board for Accountants’ International Code of Ethics for Professional Accountants (including International Independence Standards). We believe that the audit evidence we have obtained is sufficient and appropriate to provide a basis for our opinion.
Emphasis of Matter – Basis of AccountingWe draw attention to the basis of presentation disclosed in the accounting policies to the consolidated financial statements, which describes the basis of accounting. The consolidated financial statements are prepared in accordance with the group’s accounting policies for the purpose of providing financial information to the shareholders. As a result, the consolidated financial statements may not be suitable for another purpose. Our opinion is not modified in respect of this matter.
Key Audit MattersKey audit matters are those matters that, in our professional judgement, were of most significance in our audit of the consolidated financial statements of the current period. These matters were addressed in the context of our audit of the consolidated financial statements as a whole, and in forming our opinion thereon, and we do not provide a separate opinion on these matters. The following key audit matters are discussed:
• Adequacy of the allowance for expected credit losses on loans and advances to customers; and• Valuation of level 3 financial and non-financial assets and liabilities.
03 Annual financial statements Investec Limitedgroup and company annual financial statements 2021
INDEPENDENT AUDITORS' REPORT TO THE SHAREHOLDERS OF INVESTEC LIMITED
22

Adequacy of the allowance for expected credit losses on loans and advances to customers Refer to the Accounting policies (page 41); and Note 28 of the Consolidated Financial Statements (page 86).
The appropriateness of the allowance for expected credit losses (ECL) is highly subjective and judgmental. The ongoing impact of COVID-19 continues to result in additional judgments and assumptions being applied at 31 March 2021.
At the year-end the group reported total gross loans and advances to customers subject to ECL of R280 259 million; expected credit losses provisions of R2 704 million; and expected credit loss impairment charges of R621 million.
Given the subjective nature of the calculation of ECL there is a heightened risk that the extent of allowances could be misstated.
The areas of significant judgement within the ECL included:
• Staging/assessment of significant change in credit risk: Completeness of assets recognised in stages 2 and 3, including the triggers for an asset moving between stages;
• Multiple macro-economic scenarios: The inputs and assumptions used to estimate the impact of multiple macro-economic scenarios;
• ECL model: The assumptions used in the models to calculate ECL, including:
– Completeness and accuracy of historical data used to recalibrate the models;
– Completeness and accuracy of data used to run the models; and
– Key model assumptions and techniques, including in-model adjustment where the use of floors for the impact of macro-economic inputs have been applied.
Our work effort in auditing the ECL focussed on the following elements:
• Post model adjustments: Adequacy of post model adjustments (“overlays”), including post model adjustment in relation to the effects of COVID-19;
• Individually assessed provisions: Individually assessed provisions where the measurement of the provision is dependent on the valuation of collateral, estimates of exit values and the timing of cash flows; and
• Disclosures: Finance and credit processes to produce the financial statement disclosures.
Our audit included the following procedures to address the key audit matter:
Staging/assessment of significant increase in credit riskWe assessed the design and tested the operating effectiveness of key controls focusing on the following:
• Assessment and approval of a significant increase or reduction in credit risk and credit-impaired criteria and monitoring of asset levels in each stage. This included our consideration of management’s assessment of the impact of payment holidays granted to counterparties as a result of COVID-19;
• Approval of staging criteria; and• Assessment of manual overrides to staging outcomes.
We also analysed a sample of assets in stages 1, 2 and 3 to evaluate whether they were included in the appropriate stage.
Multiple macro-economic scenariosWe assessed the design and tested operating effectiveness of key controls focusing on the following:
• Generation and approval of the base case scenario;• Generation and approval of the methodology and output of
alternative scenarios, including the probability weights assigned; and
• Production and approval of models used to calculate the ECL impact of the scenarios.
We also reviewed the governance processes that the group have put in place to review and approve the economic scenarios. As part of this assessment we attended the DLC Board Risk and Capital Committee meetings where the economic scenarios were approved.
We involved our economists to assess both the base case and alternative scenarios generated, including the probability weights applied. This included independent analysis on economic forecasts, which incorporated the use of third-party data.
We involved our modelling specialists to assess the correlation of the macroeconomic factors forecast to the ECL and to test the scalars applied to the ECL that were calculated based on the scenarios.
ECL modelWe assessed the design and tested the operating effectiveness of key controls, focusing on model governance, including the design, build, testing, review, and approval of models used to determine the ECL. As part of this we assessed the accounting interpretations made for compliance with IFRS 9, Financial Instruments (IFRS 9).
We involved our modelling specialists to test assumptions and calculations used in the ECL model.
This included performing an assessment of:
• The model design documentation against accepted industry principles;
• The appropriateness of the methodology, considering alternative techniques including the in-model adjustments;
• The programming code to verify it was consistent with the design documentation; and
• A sample of the historical and reporting date data used in the models by tracing back to the source systems.
KEY AUDIT MATTER OUR AUDIT RESPONSE TO THE KEY AUDIT MATTER
03 Annual financial statements Investec Limitedgroup and company annual financial statements 2021
INDEPENDENT AUDITORS' REPORT TO THE SHAREHOLDERS OF INVESTEC LIMITEDCONTINUED
23

Adequacy of the allowance for expected credit losses on loans and advances to customers (continued)
Post model adjustments For the COVID-19 overlay in relation to emerging risks identified for certain categories of borrowers within the commercial real estate and mortgage portfolios we have assessed the reasonableness of management’s assumptions against independent sources.
Individually assessed provisionsWe assessed the design and tested operating effectiveness of key controls focusing on the following processes:
• The calculation of the ECL provision, incorporating collateral valuations and work out strategies and annual credit reviews;
• The estimation of the amount and timing of future cash flows, including the assessment and probability weights assigned to alternative scenarios, where applicable;
• The approval of the final ECL provision made by management’s impairment decision committee; and
• The existence and legal right to collateral.
We also selected a sample of loans to recalculate the ECL with the involvement of our valuation specialists, where appropriate. Our sample considered high-risk sectors we deem vulnerable to COVID-19, including aviation, trade finance, hotels, gaming and leisure businesses. For each item selected we formed an independent view of collateral or exit values, cash flow assumptions and exit strategies.
We also considered the potential alternative scenarios and the probability weights assigned. We assessed the discount rate used, re-performed the discounted cash flow calculations and compared our measurement outcomes to those prepared by management, investigating any differences that arose.
DisclosuresWe evaluated the adequacy of disclosures in the financial statements including the appropriateness of assumptions and sensitivities disclosed. We tested the data and calculations supporting the disclosures.
KEY AUDIT MATTER OUR AUDIT RESPONSE TO THE KEY AUDIT MATTER
03 Annual financial statements Investec Limitedgroup and company annual financial statements 2021
INDEPENDENT AUDITORS' REPORT TO THE SHAREHOLDERS OF INVESTEC LIMITEDCONTINUED
24

Valuation of level 3 financial and non-financial assets and liabilities Refer to the Accounting policies (page 39); and Note 16 of the Consolidated Financial Statements (page 71).
At the year end the group reported level 3 financial and non-financial assets of R11 466 million and level 3 financial and non-financial liabilities of R928 million.
For level 3 financial and non-financial assets and liabilities there is a large degree of subjectivity surrounding the inputs to their valuations.
With the lack of observable liquid market inputs, determining appropriate valuations continues to be highly judgmental. This may result in subjective fair value movements which are material.
The portfolio within level 3 financial and non-financial assets and liabilities with the greatest valuation uncertainty, which hence required the most significant accounting and auditing judgments, were the unlisted property investments portfolios.
Significant judgment is required by management due to the absence of verifiable third-party information to determine the key inputs and assumptions in the valuation models. This means there is a heightened risk that the timing and extent of changes in fair value estimates could be misstated.
Our audit included the following procedures to address the key audit matter:
• We assessed the design and tested operating effectiveness of key controls for the valuation of level 3 financial and non-financial assets and liabilities. For certain unlisted investments in private equity businesses and investment properties a detailed testing approach was taken.
• We performed a detailed examination of management’s valuation methodologies and assessed the appropriateness and consistency of model inputs, key assumptions, contractual obligations and exit values on a sample basis.
• Where inputs or assumptions were not observable in the market, we involved our valuation specialists to assess if the inputs and assumptions fell within an acceptable range, based on relevant industry knowledge and experience of the market.
In addition, for the fair value unlisted property portfolios we involved our property valuation specialists to independently assess the valuations.
KEY AUDIT MATTER OUR AUDIT RESPONSE TO THE KEY AUDIT MATTER
Other MatterThe group has separately prepared a combined consolidated set of financial statements for the year ended 31 March 2021 incorporating Investec Plc and its subsidiaries in accordance with International Financial Reporting Standards and the requirements of the Companies Act of South Africa on which separate auditor’s reports to the shareholders of Investec Limited and Investec Plc have been issued on 22 June 2021.
Other InformationThe directors are responsible for the other information. The other information comprises the information included in the 154 page document titled “Investec Limited group and company annual financial statements”, which includes the Declaration by the company secretary, the Directors’ report and the INL Audit committee report, as required by the Companies Act of South Africa. Other information does not include the consolidated financial statements and our auditors’ report thereon.
Our opinion on the consolidated financial statements does not cover the other information and we do not express an audit opinion or any form of assurance conclusion thereon.
In connection with our audit of the consolidated financial statements, our responsibility is to read the other information and, in doing so, consider whether the other information is
materially inconsistent with the consolidated financial statements or our knowledge obtained in the audit, or otherwise appears to be materially misstated. If, based on the work we have performed, we conclude that there is a material misstatement of this other information, we are required to report that fact. We have nothing to report in this regard.
Responsibilities of the Directors for the Consolidated Financial StatementsThe directors are responsible for the preparation of the consolidated financial statements in accordance with the basis of presentation disclosed in the accounting policies to the consolidated financial statements, for determining that the basis of preparation is acceptable in the circumstances and for such internal controls as the directors determine is necessary to enable the preparation of the consolidated financial statements that are free from material misstatement, whether due to fraud or error.
In preparing the consolidated financial statements, the directors are responsible for assessing the group’s ability to continue as a going concern, disclosing, as applicable, matters related to going concern and using the going concern basis of accounting unless the directors either intend to liquidate the group or to cease operations, or have no realistic alternative but to do so.
03 Annual financial statements Investec Limitedgroup and company annual financial statements 2021
INDEPENDENT AUDITORS' REPORT TO THE SHAREHOLDERS OF INVESTEC LIMITEDCONTINUED
25

Auditors’ Responsibilities for the Audit of the Consolidated Financial StatementsOur objectives are to obtain reasonable assurance about whether the consolidated financial statements as a whole are free from material misstatement, whether due to fraud or error, and to issue an auditors’ report that includes our opinion. Reasonable assurance is a high level of assurance but is not a guarantee that an audit conducted in accordance with ISAs will always detect a material misstatement when it exists. Misstatements can arise from fraud or error and are considered material if, individually or in the aggregate, they could reasonably be expected to influence the economic decisions of users taken on the basis of these consolidated financial statements.
As part of an audit in accordance with ISAs, we exercise professional judgement and maintain professional scepticism throughout the audit. We also:
• Identify and assess the risks of material misstatement of the consolidated financial statements, whether due to fraud or error, design and perform audit procedures responsive to those risks, and obtain audit evidence that is sufficient and appropriate to provide a basis for our opinion. The risk of not detecting a material misstatement resulting from fraud is higher than for one resulting from error, as fraud may involve collusion, forgery, intentional omissions, misrepresentations, or the override of internal control.
• Obtain an understanding of internal control relevant to the audit in order to design audit procedures that are appropriate in the circumstances, but not for the purpose of expressing an opinion on the effectiveness of the group’s internal control.
• Conclude on the appropriateness of the directors’ use of the going concern basis of accounting and based on the audit evidence obtained, whether a material uncertainty exists related to events or conditions that may cast significant doubt on the group’s ability to continue as a going concern. If we conclude that a material uncertainty exists, we are required to draw attention in our auditors’ report to the related disclosures in the consolidated financial statements or, if such disclosures are inadequate, to modify our opinion. Our conclusions are based on the audit evidence obtained up to the date of our auditors’ report. However, future events or conditions may cause the group to cease to continue as a going concern.
• Evaluate the appropriateness of accounting policies used and the reasonableness of accounting estimates and related disclosures made by the directors.
• Obtain sufficient appropriate audit evidence regarding the financial information of the entities and business activities within the group to express an opinion on the consolidated financial statements. We are responsible for the direction, supervision and performance of the group audit. We remain solely responsible for our audit opinion.
We communicate with the directors regarding, among other matters, the planned scope and timing of the audit and significant audit findings, including any significant deficiencies in internal control that we identify during our audit.
We also provide the directors with a statement that we have complied with relevant ethical requirements regarding independence, and to communicate with them all relationships and other matters that may reasonably be thought to bear on our independence, and where applicable, actions taken to eliminate threats or safeguards applied.
From the matters communicated with the directors, we determine those matters that were of most significance in the audit of the consolidated financial statements of the current period and are therefore the key audit matters. We describe these matters in our auditors’ report unless law or regulation precludes public disclosure about the matter or when, in extremely rare circumstances, we determine that a matter should not be communicated in our report because the adverse consequences of doing so would reasonably be expected to outweigh the public interest benefits of such communication.
Report on Other Legal and Regulatory Requirements
In terms of the IRBA Rule published in Government Gazette Number 39475 dated 4 December 2015, we report that Ernst & Young Inc. and KPMG Inc. have been the auditors of Investec Limited for 46 and 27 years, respectively.
Ernst & Young Inc. KPMG Inc.Registered Auditor Registered AuditorPer Gail Moshoeshoe Per Tracy MiddlemissChartered Accountant (SA) Chartered Accountant (SA)Registered Auditor Registered AuditorDirector Director23 June 2021 23 June 2021
03 Annual financial statements Investec Limitedgroup and company annual financial statements 2021
INDEPENDENT AUDITORS' REPORT TO THE SHAREHOLDERS OF INVESTEC LIMITEDCONTINUED
26

To the Shareholders of Investec Limited Report on the Audit of the Separate Financial StatementsOpinionWe have audited the separate financial statements of Investec Limited (the company), which comprise the balance sheet at 31 March 2021, the income statement, the statement of total comprehensive income, the statement of changes in equity and the cash flow statement for the year then ended, accounting policies and the notes to the financial statements, as set out on pages 29 to 137.
In our opinion, the separate financial statements present fairly, in all material respects, the separate financial position of Investec Limited at 31 March 2021, and its separate financial performance and separate cash flows for the year then ended in accordance with International Financial Reporting Standards and the requirements of the Companies Act of South Africa.
Basis for OpinionWe conducted our audit in accordance with International Standards on Auditing (ISAs). Our responsibilities under those standards are further described in the Auditors’ Responsibilities for the Audit of the Separate Financial Statements section of our report. We are independent of the company in accordance with the Independent Regulatory Board for Auditors’ Code of Professional Conduct for Registered Auditors (IRBA Code) and other independence requirements applicable to performing audits of financial statements of the company in South Africa. We have fulfilled our other ethical responsibilities in accordance with the IRBA Code and in accordance with other ethical requirements applicable to performing audits of the company in South Africa. The IRBA Code is consistent with the corresponding sections of the International Ethics Standards Board for Accountants’ International Code of Ethics for Professional Accountants (including International Independence Standards). We believe that the audit evidence we have obtained is sufficient and appropriate to provide a basis for our opinion.
Key Audit MattersKey audit matters are those matters that, in our professional judgement, were of most significance in our audit of the separate financial statements of the current period. We have determined that there are no key audit matters to communicate in our report.
Other InformationThe directors are responsible for the other information. The other information comprises the information included in the 154-page document titled “Investec Limited group and company annual financial statements”, which includes the Declaration by the company secretary, the Directors’ Report and the INL Audit committee report, as required by the Companies Act of South Africa. Other information does not include the separate financial statements and our auditors’ report thereon.
Our opinion on the separate financial statements does not cover the other information and we do not express an audit opinion or any form of assurance conclusion thereon.
In connection with our audit of the separate financial statements, our responsibility is to read the other information and in doing so, consider whether the other information is materially inconsistent with the separate financial statements or our knowledge obtained in the audit, or otherwise appears to be materially misstated. If, based on the work we have performed, we conclude that there is a material misstatement of this other information, we are required to report that fact. We have nothing to report in this regard.
Responsibilities of Directors for the Separate Financial StatementsThe directors are responsible for the preparation and fair presentation of the separate financial statements in accordance with International Financial Reporting Standards and the requirements of the Companies Act of South Africa, and for such internal control as the directors determine is necessary to enable the preparation of separate financial statements that are free from material misstatement, whether due to fraud or error.
In preparing the separate financial statements, the directors are responsible for assessing the company’s ability to continue as a going concern, disclosing, as applicable, matters related to going concern and using the going concern basis of accounting unless the directors either intend to liquidate the company or to cease operations, or have no realistic alternative but to do so.
Auditors’ Responsibilities for the Audit of the Separate Financial StatementsOur objectives are to obtain reasonable assurance about whether the separate financial statements as a whole are free from material misstatement, whether due to fraud or error, and to issue an auditors’ report that includes our opinion. Reasonable assurance is a high level of assurance but is not a guarantee that an audit conducted in accordance with ISAs will always detect a material misstatement when it exists. Misstatements can arise from fraud or error and are considered material if, individually or in the aggregate, they could reasonably be expected to influence the economic decisions of users taken on the basis of these separate financial statements.
03 Annual financial statements Investec Limitedgroup and company annual financial statements 2021
INDEPENDENT AUDITORS' REPORT TO THE SHAREHOLDERS OF INVESTEC LIMITEDCONTINUED
27

As part of an audit in accordance with ISAs, we exercise professional judgement and maintain professional scepticism throughout the audit. We also:
• Identify and assess the risks of material misstatement of the separate financial statements, whether due to fraud or error, design and perform audit procedures responsive to those risks, and obtain audit evidence that is sufficient and appropriate to provide a basis for our opinion. The risk of not detecting a material misstatement resulting from fraud is higher than for one resulting from error, as fraud may involve collusion, forgery, intentional omissions, misrepresentations, or the override of internal control.
• Obtain an understanding of internal control relevant to the audit in order to design audit procedures that are appropriate in the circumstances, but not for the purpose of expressing an opinion on the effectiveness of the company’s internal control.
• Evaluate the appropriateness of accounting policies used and the reasonableness of accounting estimates and related disclosures made by the directors.
• Conclude on the appropriateness of the directors’ use of the going concern basis of accounting and based on the audit evidence obtained, whether a material uncertainty exists related to events or conditions that may cast significant doubt on the company’s ability to continue as a going concern. If we conclude that a material uncertainty exists, we are required to draw attention in our auditors’ report to the related disclosures in the separate financial statements or, if such disclosures are inadequate, to modify our opinion. Our conclusions are based on the audit evidence obtained up to the date of our auditors’ report. However, future events or conditions may cause the company to cease to continue as a going concern.
• Evaluate the overall presentation, structure and content of the separate financial statements, including the disclosures, and whether the separate financial statements represent the underlying transactions and events in a manner that achieves fair presentation.
We communicate with the directors regarding, among other matters, the planned scope and timing of the audit and significant audit findings, including any significant deficiencies in internal control that we identify during our audit.
We also provide the directors with a statement that we have complied with relevant ethical requirements regarding independence, and to communicate with them all relationships and other matters that may reasonably be thought to bear on our independence, and where applicable, actions taken to eliminate threats or related safeguards applied.
From the matters communicated with the directors, we determine those matters that were of most significance in the audit of the separate financial statements of the current period and are therefore the key audit matters. We describe these matters in our auditors’ report unless law or regulation precludes public disclosure about the matter or when, in extremely rare circumstances, we determine that a matter should not be communicated in our report because the adverse consequences of doing so would reasonably be expected to outweigh the public interest benefits of such communication.
Report on Other Legal and Regulatory RequirementsIn terms of the IRBA Rule published in Government Gazette Number 39475 dated 4 December 2015, we report that Ernst & Young Inc. and KPMG Inc. have been the auditors of Investec Limited for 46 and 27 years, respectively.
Ernst & Young Inc. KPMG Inc.Registered Auditor Registered AuditorPer Gail Moshoeshoe Per Tracy Middlemiss Chartered Accountant (SA) Chartered Accountant (SA)Registered Auditor Registered AuditorDirector Director23 June 2021 23 June 2021
03 Annual financial statements Investec Limitedgroup and company annual financial statements 2021
INDEPENDENT AUDITORS' REPORT TO THE SHAREHOLDERS OF INVESTEC LIMITEDCONTINUED
28

Group Company
For the year to 31 MarchR’million Notes 2021 2020 2021 2020
Interest income 2 26 400 35 679 295 117 Interest income calculated using the effective interest method 23 978 32 413 295 117 Other interest income 2 422 3 266 — —
Interest expense 2 (18 362) (27 394) (477) (202) Net interest income 8 038 8 285 (182) (85) Fee and commission income 3 6 127 6 730 — — Fee and commission expense 3 (603) (645) — — Investment income 4 284 512 1 006 3 152 Share of post-taxation (loss)/profit of associates and joint venture holdings (145) 311 — — Trading income/(loss) arising from– customer flow 959 197 (4) — – balance sheet management and other trading income (621) 544 19 (19) Other operating income 5 149 5 — — Total operating income before expected credit loss impairment charges 14 188 15 939 839 3 048 Expected credit loss impairment charges 6 (621) (1 109) — — Operating income 13 567 14 830 839 3 048 Operating costs 7 (8 457) (8 307) (11) (18) Operating profit before goodwill and acquired intangibles 5 110 6 523 828 3 030 Impairment of goodwill 35 (7) (3) — — Amortisation of acquired intangibles 36 (51) (51) — — Impairment of associates and joint venture holdings 30 (348) (937) — — Operating profit 4 704 5 532 828 3 030 Implementation costs on partial disposal of subsidiary — — — (405) Profit before taxation from continuing operations 4 704 5 532 828 2 625 Taxation on operating profit before acquired intangibles 10 (1 050) (1 042) (42) 60 Taxation on acquired intangibles and financial impact on group structures 10 14 14 — — Profit after taxation from continuing operations 3 668 4 504 786 2 685 Profit after taxation from discontinued operations — 6 674 — — Profit after taxation 3 668 11 178 786 2 685 Loss/(profit) attributable to other non-controlling interests 49 2 (1 258) — — Profit attributable to non-controlling interests of discontinued operations 37 — (210) — — Loss attributable to other non-controlling interests relating to impairments in associates 49 189 — — — Earnings attributable to shareholders 3 859 9 710 786 2 685
^ Restated as detailed in note 58.
03 Annual financial statements Investec Limitedgroup and company annual financial statements 2021
INCOME STATEMENTS
29

Group Company
R’millionYear to
31 March 2021Year to
31 March 2020Year to
31 March 2021Year to
31 March 2020
Continuing operations
Profit after taxation from continuing operations 3 668 4 504 786 2 685 Other comprehensive income from continuing operations:Items that may be reclassified to the income statement:Fair value movements on cash flow hedges taken directly to other comprehensive income 11 (619) — — Fair value movements on debt instruments at FVOCI taken directly to other comprehensive income 2 051 (1 888) — — Gain on realisation of debt instruments at FVOCI recycled to the income statement (33) (79) — — Foreign currency adjustments on translating foreign operations (1 278) 1 366 — — Items that will never be reclassified to the income statement:Fair value movements on equity instruments at FVOCI taken directly to other comprehensive income 885 138 56 (159) Net (loss)/gain attributable to own credit risk (14) 1 — — Total comprehensive income from continuing operations 5 290 3 423 842 2 526 Total comprehensive income attributable to ordinary shareholders from continuing operations 5 065 1 663 546 2 167 Total comprehensive (loss)/income attributable to non-controlling interests (191) 1 258 — — Total comprehensive income attributable to perpetual preferred securities and other Additional Tier 1 securities 416 502 296 359 Total comprehensive income from continuing operations 5 290 3 423 842 2 526 Discontinued operationsProfit after taxation from discontinued operations — 6 674 — — Other comprehensive income from discontinued operations:Item that may be reclassified to the income statement:Foreign currency adjustments on translating foreign operations — 4 — — Total comprehensive income from discontinued operations — 6 678 — — Total comprehensive income attributable to ordinary shareholders — 6 468 — — Total comprehensive income attributable to non-controlling interests — 210 — — Total comprehensive income from discontinued operations — 6 678 — — Total groupProfit after taxation from the total group 3 668 11 178 786 2 685 Other comprehensive income from the total group:Items that may be reclassified to the income statement:Fair value movements on cash flow hedges taken directly to other comprehensive income 11 (619) — — Fair value movements on debt instruments at FVOCI taken directly to other comprehensive income 2 051 (1 888) — — Gain on realisation of debt instruments at FVOCI recycled to the income statement (33) (79) — — Foreign currency adjustments on translating foreign operations (1 278) 1 370 — — Items that will never be reclassified to the income statement:Fair value movements on equity instruments at FVOCI taken directly to other comprehensive income 885 138 56 (159) Net (loss)/gain attributable to own credit risk (14) 1 — — Total comprehensive income from the total group 5 290 10 101 842 2 526 Total comprehensive income attributable to ordinary shareholders 5 065 8 131 546 2 167 Total comprehensive (loss)/income attributable to non-controlling interests (191) 1 468 — — Total comprehensive income attributable to perpetual preferred securities and other Additional Tier 1 securities 416 502 296 359 Total comprehensive income from the total group 5 290 10 101 842 2 526
03 Annual financial statements Investec Limitedgroup and company annual financial statements 2021
STATEMENTS OF TOTAL COMPREHENSIVE INCOME
30

Group Company
At R’million Notes 31 March 2021 31 March 2020^ 31 March 2021 31 March 2020^AssetsCash and balances at central banks 19 9 653 36 656 — — Loans and advances to banks 20 26 983 19 536 20 20 Non-sovereign and non-bank cash placements 8 956 14 014 — — Reverse repurchase agreements and cash collateral on securities borrowed 21 30 756 29 626 — — Sovereign debt securities 22 53 009 64 358 — — Bank debt securities 23 21 862 12 265 2 709 350 Other debt securities 24 14 148 17 337 — — Derivative financial instruments 25 19 186 17 431 — — Securities arising from trading activities 26 15 202 10 366 — — Investment portfolio 27 15 131 16 564 190 147 Loans and advances to customers 28 279 131 281 686 — — Own originated loans and advances to customers securitised 29 8 184 7 192 — — Other loans and advances 28 181 242 — — Other securitised assets 29 578 497 — — Interests in associated undertakings and joint venture holdings 30 5 215 6 924 — — Current taxation assets 44 45 — — Deferred taxation assets 31 2 767 2 996 25 106 Other assets 32 16 324 12 800 35 25 Property and equipment 33 2 942 3 093 — — Investment properties 34 16 942 19 137 — — Goodwill 35 212 219 — — Software 36 95 149 — Other acquired intangible assets 36 118 169 — — Investment in subsidiaries 38 — — 18 755 19 603 Non-current assets classified as held for sale 1 054 1 305 — —
548 673 574 607 21 734 20 251 Other financial instruments at fair value through profit or loss in respect of liabilities to customers 39 1 067 780 — —
549 740 575 387 21 734 20 251 LiabilitiesDeposits by banks 22 052 46 833 — — Derivative financial instruments 25 26 154 22 469 — — Other trading liabilities 40 5 643 8 660 — — Repurchase agreements and cash collateral on securities lent 21 17 598 26 626 — — Customer accounts (deposits) 374 228 375 456 — — Debt securities in issue 41 6 493 7 634 319 319 Liabilities arising on securitisation of own originated loans and advances 29 3 271 1 699 — — Current taxation liabilities 854 541 11 53 Deferred taxation liabilities 31 743 517 — — Other liabilities 42 16 564 13 114 1 837 1 531
473 600 503 549 2 167 1 903 Liabilities to customers under investment contracts 39 1 014 727 — Insurance liabilities, including unit-linked liabilities 39 53 53 — —
474 667 504 329 2 167 1 903 Subordinated liabilities 43 14 445 14 383 3 145 2 346
489 112 518 712 5 312 4 249 EquityOrdinary share capital 44 1 1 1 1 Ordinary share premium 45 6 112 6 112 5 693 5 693 Treasury shares 46 (3 020) (2 992) — — Other reserves 2 543 903 (51) (107) Retained income 38 656 35 878 6 117 6 331 Ordinary shareholders’ equity 44 292 39 902 11 760 11 918 Perpetual preference shares in issue 47 3 039 3 184 3 039 3 184 Shareholders’ equity excluding non-controlling interests 47 331 43 086 14 799 15 102 Other Additional Tier 1 securities in issue 48 1 733 1 010 1 623 900 Non-controlling interests 49 11 564 12 579 — — – Perpetual preferred securities issued by subsidiaries 1 481 1 534 — — – Non-controlling interests in partially held subsidiaries 10 083 11 045 — — Total equity 60 628 56 675 16 422 16 002 Total liabilities and equity 549 740 575 387 21 734 20 251
^ Restated as detailed in note 58.
03 Annual financial statements Investec Limitedgroup and company annual financial statements 2021
BALANCE SHEETS
31

R’million
Ordinaryshare
capitalShare
premium^Treasury
shares
Group
At 1 April 2019 1 10 392 (1 881) Movement in reserves 1 April 2019 – 31 March 2020Profit after taxation — — — Fair value movements on cash flow hedges taken directly to other comprehensive income — — — Fair value movements on debt instruments at FVOCI taken directly to other comprehensive income — — — Gain on realisation of debt instruments at FVOCI recycled through the income statement — — —
Fair value movements on equity instruments at FVOCI taken directly to other comprehensive income — — — Foreign currency adjustments on translating foreign operations — — — Net gain attributable to own credit risk — — — Total comprehensive income for the year — — — Net equity movements in interests in associated undertakings — — — Movement of treasury shares — — (1 460) Share-based payments adjustments — — — Employee benefit liability recognised — — — Transfer from share-based payments reserve to treasury shares — — 349 Transfer from regulatory general risk reserves — — — Disposal of group operations — — — Movement in non-controlling interests due to share issues in subsidiary — — — Dividends declared to other equity holders including other Additional Tier 1 securities — — — Dividends paid to perpetual preference shareholders included in non-controlling interests and other Additional Tier 1 securities — — — Dividends paid to ordinary shareholders — — — Dividends paid to non-controlling interests — — — Distribution on demerger — (4 280) — At 31 March 2020 1 6 112 (2 992) Movement in reserves 1 April 2020 – 31 March 2021Profit after taxation — — — Fair value movements on cash flow hedges taken directly to other comprehensive income — — — Fair value movements on debt instruments at FVOCI taken directly to other comprehensive income — — — Gain on realisation of debt instruments at FVOCI recycled through the income statement — — —
Fair value movements on equity instruments at FVOCI taken directly to other comprehensive income — — — Foreign currency adjustments on translating foreign operations — — — Net gain attributable to own credit risk — — — Total comprehensive income for the year — — — Issue of other Additional Tier 1 security instruments — — — Net equity movements in interests in associated undertakings — — — Movement of treasury shares — — (50) Share-based payments adjustments — — — Transfer from share-based payments reserve to treasury shares — — 22 Transfer from regulatory general risk reserves — — — Net equity impact of non-controlling interests movements — — — Redemption of perpetual preference shares — — — Dividends declared to other equity holders including other Additional Tier 1 securities — — —
Dividends paid to perpetual preference shareholders included in non-controlling interests and other Additional Tier 1 securities — — — Dividends paid to ordinary shareholders — — — Dividends paid to non-controlling interests — — — At 31 March 2021 1 6 112 (3 020)
^ Restated as detailed in note 58.
03 Annual financial statements Investec Limitedgroup and company annual financial statements 2021
STATEMENTS OF CHANGES IN EQUITY
32

Other reserves
Capitalreserveaccount
Fairvalue
reserve
Regulatorygeneral
riskreserve
Cashflow
hedge reserve
Owncredit
riskreserve
Foreigncurrency
reserveRetained
income
Ordinaryshareholders’
equity^
Perpetualpreference
shares inissue^
Shareholders’equity
excludingnon-controlling
interests
OtherAdditional
Tier 1securities
in issue
Non-controlling
interestsTotal
equity
61 90 765 (931) 25 2 045 29 398 39 965 3 184 43 149 1 010 11 456 55 615
— — — — — — 9 710 9 710 — 9 710 — 1 468 11 178 — — — (619) — — — (619) — (619) — — (619) — (1 888) — — — — — (1 888) — (1 888) — — (1 888) — (79) — — — — — (79) — (79) — — (79)
— 138 — — — — — 138 — 138 — — 138 — — — — — 1 370 — 1 370 — 1 370 — — 1 370 — — — — 1 — — 1 1 — — 1 — (1 829) — (619) 1 1 370 9 710 8 633 — 8 633 — 1 468 10 101 — — — — — — (44) (44) — (44) — — (44) — — — — — — — (1 460) — (1 460) — — (1 460) — — — — — — 592 592 — 592 — — 592 — — — — — — (156) (156) — (156) — — (156) — — — — — — (349) — — — — — — — — (75) — — — 75 — — — — — — — — — — — — — — — — — (221) (221) — — — — — — (91) (91) — (91) — 960 869 — — — — — — (502) (502) 254 (248) 117 131 — — — — — — — — — (254) (254) (117) (131) (502)
— — — — — — (2 755) (2 755) — (2 755) — — (2 755) — — — — — — — — — — — (1 084) (1 084) — — — — — — — (4 280) — (4 280) — — (4 280) 61 (1 739) 690 (1 550) 26 3 415 35 878 39 902 3 184 43 086 1 010 12 579 56 675
— — — — — — 3 859 3 859 — 3 859 — (191) 3 668 — — — 11 — — — 11 — 11 — — 11 — 2 051 — — — — — 2 051 — 2 051 — — 2 051 — (33) — — — — — (33) — (33) — — (33)
— 885 — — — — — 885 — 885 — — 885 — — — — — (1 278) — (1 278) — (1 278) — — (1 278) — — — — (14) — — (14) — (14) — — (14) — 2 903 — 11 (14) (1 278) 3 859 5 481 — 5 481 — (191) 5 290 — — — — — — — — — — 723 — 723 — — — — — — (406) (406) — (406) — — (406) — — — — — — — (50) — (50) — — (50) — — — — — — 436 436 — 436 — — 436 — — — — — — (22) — — — — — — — — 18 — — — (18) — — — — — — — — — — — — — — — — — (80) (80) — — — — — — 71 71 (145) (74) — (53) (127) — — — — — — (416) (416) 212 (204) 94 110 —
— — — — — — — — (212) (212) (94) (110) (416) — — — — — — (726) (726) — (726) — — (726) — — — — — — — — — — — (691) (691) 61 1 164 708 (1 539) 12 2 137 38 656 44 292 3 039 47 331 1 733 11 564 60 628
03 Annual financial statements Investec Limitedgroup and company annual financial statements 2021
STATEMENTS OF CHANGES IN EQUITYCONTINUED
33

R’million
Ordinaryshare
capitalShare
premium
Capitalreserveaccount
Fairvalue
reserveRetained
income
Ordinary share-
holders equity
Perpetual preference
shares in issue
Shareholders' equity
excluding non-
controlling interests
Other Additional
Tier 1 securities
in issueTotal
Equity
CompanyAt 1 April 2019 1 10 443 62 (10) (4) 10 492 3 184 13 676 900 14 576 Movement in reserves 1 April 2019 – 31 March 2020Profit after taxation — — — — 2 685 2 685 — 2 685 — 2 685 Fair value movements on equity instruments at FVOCI taken directly to other comprehensive income — — — (159) — (159) — (159) — (159)
Total comprehensive income for the year — — — (159) 2 685 2 526 — 2 526 — 2 526 Capital contribution to parent — — — — 7 090 7 090 — 7 090 — 7 090 Employee benefit liability recognised — — — — (8) (8) — (8) — (8) Share-based payments adjustments — — — — (288) (288) — (288) — (288) Dividends paid to ordinary shareholders — — — — (2 785) (2 785) — (2 785) — (2 785) Dividends declared to perpetual preference shareholders including other Additional Tier 1 security holders — — — — (359) (359) 255 (104) 104 — Dividends paid to other Additional Tier 1 security holders — — — — — — (255) (255) (104) (359) Distribution on demerger — (4 750) — — — (4 750) — (4 750) — (4 750) At 31 March 2020 1 5 693 62 (169) 6 331 11 918 3 184 15 102 900 16 002 Movement in reserves 1 April 2020 –31 March 2021Profit after taxation — — — — 786 786 — 786 — 786 Fair value movements on equity instruments at FVOCI taken directly to other comprehensive income — — — 56 — 56 — 56 — 56
Total comprehensive income for the year — — — 56 786 842 — 842 — 842 Issue of other Additional Tier 1 securities in issue — — — — — — — — 723 723 Redemption of perpetual preference shares — — — — 54 54 (145) (91) — (91) Capital contribution to group companies — — — — 4 4 — 4 — 4 Share-based payments adjustments — — — — (15) (15) — (15) — (15) Dividends paid to ordinary shareholders — — — — (747) (747) — (747) — (747) Dividends declared to perpetual preference shareholders including other Additional Tier 1 security holders — — — — (296) (296) 211 (85) 85 — Dividends paid to Other Additional Tier 1 security holders — — — — — — (211) (211) (85) (296) At 31 March 2021 1 5 693 62 (113) 6 117 11 760 3 039 14 799 1 623 16 422
03 Annual financial statements Investec Limitedgroup and company annual financial statements 2021
STATEMENTS OF CHANGES IN EQUITYCONTINUED
34
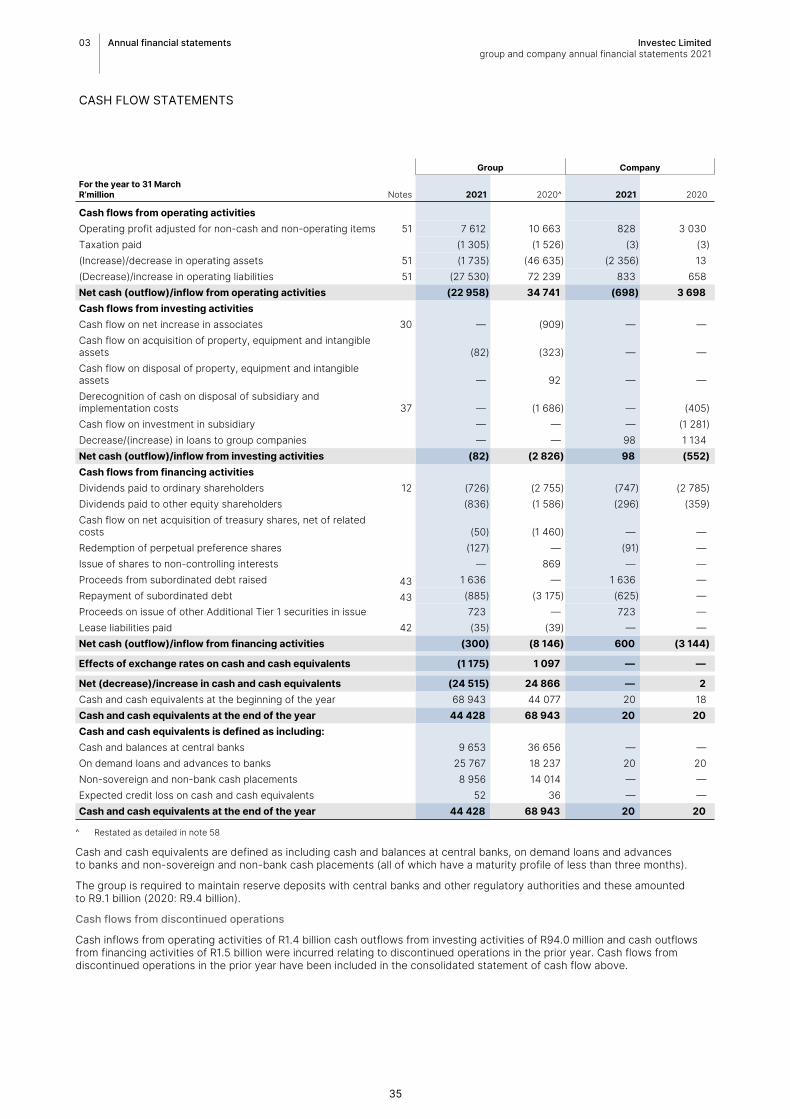
Group Company
For the year to 31 MarchR’million Notes 2021 2020^ 2021 2020
Cash flows from operating activities Operating profit adjusted for non-cash and non-operating items 51 7 612 10 663 828 3 030 Taxation paid (1 305) (1 526) (3) (3) (Increase)/decrease in operating assets 51 (1 735) (46 635) (2 356) 13 (Decrease)/increase in operating liabilities 51 (27 530) 72 239 833 658 Net cash (outflow)/inflow from operating activities (22 958) 34 741 (698) 3 698 Cash flows from investing activitiesCash flow on net increase in associates 30 — (909) — — Cash flow on acquisition of property, equipment and intangible assets (82) (323) — — Cash flow on disposal of property, equipment and intangible assets — 92 — — Derecognition of cash on disposal of subsidiary and implementation costs 37 — (1 686) — (405) Cash flow on investment in subsidiary — — — (1 281) Decrease/(increase) in loans to group companies — — 98 1 134 Net cash (outflow)/inflow from investing activities (82) (2 826) 98 (552) Cash flows from financing activitiesDividends paid to ordinary shareholders 12 (726) (2 755) (747) (2 785) Dividends paid to other equity shareholders (836) (1 586) (296) (359) Cash flow on net acquisition of treasury shares, net of related costs (50) (1 460) — — Redemption of perpetual preference shares (127) — (91) — Issue of shares to non-controlling interests — 869 — — Proceeds from subordinated debt raised 43 1 636 — 1 636 — Repayment of subordinated debt 43 (885) (3 175) (625) — Proceeds on issue of other Additional Tier 1 securities in issue 723 — 723 — Lease liabilities paid 42 (35) (39) — — Net cash (outflow)/inflow from financing activities (300) (8 146) 600 (3 144)
Effects of exchange rates on cash and cash equivalents (1 175) 1 097 — —
Net (decrease)/increase in cash and cash equivalents (24 515) 24 866 — 2 Cash and cash equivalents at the beginning of the year 68 943 44 077 20 18 Cash and cash equivalents at the end of the year 44 428 68 943 20 20 Cash and cash equivalents is defined as including:Cash and balances at central banks 9 653 36 656 — — On demand loans and advances to banks 25 767 18 237 20 20 Non-sovereign and non-bank cash placements 8 956 14 014 — — Expected credit loss on cash and cash equivalents 52 36 — — Cash and cash equivalents at the end of the year 44 428 68 943 20 20
^ Restated as detailed in note 58
Cash and cash equivalents are defined as including cash and balances at central banks, on demand loans and advances to banks and non-sovereign and non-bank cash placements (all of which have a maturity profile of less than three months).
The group is required to maintain reserve deposits with central banks and other regulatory authorities and these amounted to R9.1 billion (2020: R9.4 billion).
Cash flows from discontinued operations
Cash inflows from operating activities of R1.4 billion cash outflows from investing activities of R94.0 million and cash outflows from financing activities of R1.5 billion were incurred relating to discontinued operations in the prior year. Cash flows from discontinued operations in the prior year have been included in the consolidated statement of cash flow above.
03 Annual financial statements Investec Limitedgroup and company annual financial statements 2021
CASH FLOW STATEMENTS
35

Basis of presentationUnder the contractual arrangements implementing the dual listed companies (DLC) structure, Investec Limited and Investec plc, the latter a company incorporated in the United Kingdom, effectively form a single economic enterprise in which the economic and voting rights of shareholders are equalised. In accordance with this structure the appropriate presentation under International Financial Reporting Standards (IFRS) is achieved by combining the results and the financial position of both companies using merger accounting principles. Those combined consolidated financial statements have been separately prepared and issued on 22 June 2021.
The Companies Act of South Africa does not specifically envisage a reporting structure such as the DLC structure. The combined consolidated financial statements of Investec Limited and Investec plc are considered the statutory financial statements of Investec Limited and Investec plc. The attached group financial statements of Investec Limited are prepared to present the financial position, results and cash flows of Investec Limited and its directly owned subsidiaries in the absence of a DLC structure, and are prepared in accordance with International Financial Reporting Standards as if Investec Limited were a standalone component of the DLC structure, but with earnings per share disclosed in the DLC combined consolidated financial statements by virtue of the sharing arrangement and prepared for the purpose of providing financial information to the shareholders. The company financial statements have been prepared in accordance with IFRS and the Companies Act of South Africa. For an understanding of the financial position, results and cash flows of the Investec DLC structure, the user is referred to the combined consolidated financial statements of Investec Limited and Investec plc.
As stated on page 19, the directors consider that it is appropriate to continue to adopt the going concern basis in preparing the financial statements.
The group and company financial statements have been prepared on a historical cost basis, except as otherwise stated.
‘Group’ refers to group and company in the accounting policies that follow unless specifically stated otherwise.
The accounting policies adopted by the group are consistent with the prior year except as noted below.
There is a global initiative to replace or reform inter-bank offered rates (IBORs) that are used to determine interest cash flows on financial instruments such as loans to customers, debt securities and derivatives.
Consequently, financial contracts referencing these benchmarks with a maturity beyond 2021 may need to be amended to reference the alternative risk-free rates (RFR) in the applicable currency. There remain many uncertainties associated with the IBOR transition, including the prospective assessment of hedge accounting effectiveness.
The group has early adopted the requirements of ‘Interest Rate Benchmark Reform – Phase 2 Amendments to IFRS 9, IAS 39, IFRS 7, IFRS 4 and IFRS 16’ (IBOR reform Phase 2) which is effective for annual periods beginning on or after 1 January 2021 with earlier adoption permitted.
IBOR reform Phase 2 includes a number of reliefs and additional disclosures. The reliefs apply upon the transition of a financial instrument from an IBOR to a RFR.
Changes to the basis for determining contractual cash flows as a result of interest rate benchmark reform are required as a practical expedient to be treated as changes to a floating interest rate, provided that, for the financial instrument, the transition from the IBOR benchmark rate to RFR takes place on an economically equivalent basis.
As indicated in the hedge accounting policy, the group elected, as a policy choice permitted under IFRS 9, to continue to apply hedge accounting in accordance with IAS 39.
IBOR reform Phase 2 provides temporary reliefs that allow the group’s hedging relationships to continue upon the replacement of an existing interest rate benchmark with an RFR. The reliefs require the group to amend hedge designations and hedge documentation. This includes redefining the hedged risk to reference an RFR, redefining the description of the hedging instrument and/or the hedged item to reference the RFR and amending the method for assessing hedge effectiveness. Updates to the hedging documentation must be made by the end of the reporting period in which a replacement takes place. For the retrospective assessment of hedge effectiveness, the group may elect on a hedge by hedge basis to reset the cumulative fair value change to zero. The group may designate an interest rate as a non-contractually specified, hedged risk component of changes in the fair value or cash flows of a hedged item, provided the interest rate risk component is separately identifiable, e.g., it is an established benchmark that is widely used in the market to price loans and derivatives. For new RFRs that are not yet an established benchmark, relief is provided from this requirement provided the group reasonably expects the RFR to become separately identifiable within 24 months.
The group has not early adopted any standards, interpretations or amendments that have been issued but are not yet effective other than IBOR reform Phase 2.
Basis of consolidationAll subsidiaries or structured entities are consolidated when the group controls an investee. The group controls an investee if it is exposed to, or has rights to variable returns from its involvement with the investee and has the ability to affect those returns through its power over the investee. The financial results of subsidiaries are included in the consolidated annual financial statements of the group from the date on which control is obtained until the date the group can no longer demonstrate control.
The group performs a reassessment of control whenever there is a change in the substance of the relationship between the group and an investee. A change in the ownership interest of a subsidiary, without a loss of control, is accounted for as an equity transaction.
If the group loses control over a subsidiary, it derecognises the related assets (including goodwill), liabilities, non-controlling interest and other components of equity, while any resultant gain or loss is recognised in profit or loss. Any investment retained is recognised at fair value.
03 Annual financial statements Investec Limitedgroup and company annual financial statements 2021
ACCOUNTING POLICIES
36

The group also holds investments in private equity investments, which give rise to significant, but not majority, voting rights. Assessing these voting rights and whether the group controls these entities requires judgement that affects the date at which subsidiaries are consolidated or deconsolidated.
Entities, other than subsidiary undertakings, in which the group exercises significant influence over operating and financial policies, are treated as interests in associated undertakings and joint venture holdings. Interests in associated undertakings and joint venture holdings are accounted for using the equity method from the date that significant influence commences until the date that significant influence ceases. In circumstances where interests in associated undertakings and joint venture holdings arise in which the group has no strategic intention, these investments are classified as ‘venture capital’ holdings and are designated as held at fair value through profit or loss.
For equity accounted associates and joint venture holdings, the combined consolidated annual financial statements include the attributable share of the results and reserves of associated undertakings and joint venture holdings. The group’s interests in associated undertakings and joint venture holdings are included in the consolidated balance sheet at cost plus the post-acquisition changes in the group’s share of the net assets of the associated undertakings and joint venture holdings.
After application of the equity method, management evaluates if there is objective evidence that its net investment in the associate or joint venture is impaired.
Because goodwill forms part of the carrying amount of the net investments in an associate or a joint venture and is not separately recognised, it is not tested for impairment separately by applying the requirements for impairment testing goodwill in IAS 36 Impairment of Assets. Instead, the entire carrying amount of the investment is tested for impairment in accordance with IAS 36 as a single asset, by comparing its recoverable amount (higher of value-in-use and fair value less costs of disposal) with its carrying amount whenever there is objective evidence that the net investment may be impaired.
The consolidated balance sheet reflects the associated undertakings and joint venture holdings net of accumulated impairment losses.
Investments in subsidiaries (including loan advances to subsidiaries) are accounted for at cost less impairment losses in the company financial statements Impairment on subsidiaries is accounted for in investment income on the income statement.
All intergroup balances, transactions and unrealised gains or losses within the group that do not reflect an impairment to the asset are eliminated in full regarding subsidiaries and to the extent of the interest in associated undertakings and joint venture holdings.
Segmental reportingAn operating segment is a component of the group that engages in business activities from which it may earn revenues and incur expenses, including revenues and expenses that relate to transactions with any of the group’s other components, where operating results are reviewed regularly by chief operating decision-makers who are considered to be executive members of the board and for which discrete financial information is available.
The group’s segmental reporting is presented in the form of a business analysis. The business analysis is presented in terms of the group’s four principal business divisions namely, Wealth & Investment, Private Banking, Corporate and Investment Banking and Other and Group Investments. Group costs that are disclosed separately largely relate to group brand and marketing costs and a portion of executive and support functions which are associated with group-level activities. These costs are not incurred by the operating divisions and are necessary to support the operational functioning of the group.
For further detail on the group’s segmental reporting basis refer to pages 4 and 5.
Business combinations and goodwillBusiness combinations are accounted for using the acquisition method. The cost of an acquisition is measured as the aggregate of the consideration transferred, measured at the acquisition date fair value and the amount of any prior non-controlling interest in the acquiree. For each business combination, the group measures the non-controlling interest in the acquiree either at fair value or at the proportionate share of the acquiree’s identifiable net assets. Acquisition costs incurred are expensed immediately in the income statement.
When the group acquires a business, it assesses the financial assets and liabilities assumed for appropriate classification and the designation in accordance with the contractual terms, economic circumstances and pertinent conditions at the acquisition date. This includes the separation of embedded derivatives in host contracts by the acquiree.
If the business combination is achieved in stages, the acquisition date fair value of the group’s previously held equity interest in the acquiree is remeasured to fair value at each acquisition date through the income statement.
Any contingent consideration to be transferred by the group will be recognised at fair value at the acquisition date. Subsequent changes to the fair value of the contingent consideration, which is deemed to be an asset or liability, will be recognised in accordance with IFRS 9 either in the income statement or as a change to other comprehensive income. If the contingent consideration is classified as equity, it will not be remeasured until it is finally settled within equity.
Goodwill is initially measured at cost, being the excess of the aggregate of the consideration transferred and the amount recognised for non-controlling interest over the net identifiable assets acquired and liabilities assumed. If this consideration and amount recognised for non-controlling interest is less than the fair values of the identifiable net assets acquired, the discount on acquisition is recognised directly in the income statement as a gain in the year of acquisition.
After initial recognition, goodwill is measured at cost less any accumulated impairment losses. The group tests goodwill acquired in a business combination for impairment annually, irrespective of whether an indication of impairment exists and in accordance with IAS 36.
03 Annual financial statements Investec Limitedgroup and company annual financial statements 2021
ACCOUNTING POLICIESCONTINUED
37

For the purpose of impairment testing, goodwill acquired in a business combination is, from the acquisition date, allocated to each of the group’s cash-generating units that are expected to benefit from the combination.
Where goodwill forms part of a cash-generating unit and part of the operation within that unit is disposed of, the goodwill associated with the operation disposed of is included in the carrying amount of the operation when determining the gain or loss on disposal of the operation.
Goodwill disposed of in these circumstances is measured based on the relative values of the operation disposed of and the portion of the cash-generating units retained.
Discontinued operationsA disposal group qualifies as a discontinued operation if it is a component of an entity that has either been disposed of or is classified as held for sale and represents a separate major line of business or geographical area of operations.
Discontinued operations are excluded from the results of continuing operations and are presented as a single amount as profit or loss after tax from discontinued operations in the income statement.
Additional disclosures are provided in note 37. All other notes to the financial statements include amounts for continuing operations, unless indicated otherwise.
Share-based payments to employeesThe group engages in equity-settled share-based payments in respect of services received from employees. The fair value of the services received in respect of equity-settled share-based payments is determined by reference to the fair value of the shares or share options on the date of grant to the employee. The cost of the share-based payment, together with a corresponding increase in equity, is recognised in the income statement over the period the service conditions of the grant are met, with the amount changing according to the number of awards expected to vest. The cumulative expense recognised for equity-settled transactions at each reporting date until the vesting date reflects the extent to which the vesting period has expired and the group’s best estimate of the number of equity instruments that will ultimately vest.
Fair value measurements are based on option pricing models, taking into account the risk-free interest rate, volatility of the underlying equity instrument, expected dividends and current share prices.
Where the terms of an equity-settled award are modified, the minimum expense recognised in staff costs is the expense as if the terms had not been modified. An additional expense is recognised for any modification which increases the total fair value of the share-based payment arrangement, or is otherwise beneficial to the employee as measured at the date of modification.
The loss of control of an employing subsidiary of the group gives rise to an acceleration of the equity-settled share-based payments charge for the related employees and on loss of control, the group recognises the amount that would have been recognised for the award if it remained in place on its original terms.
All entities of the group account for any share-based payment recharge costs allocated to equity in the period during which it is levied in their separate financial statements. Any excess over and above the recognised share-based payment expense is accounted for as an expense in the income statement. This cost is presented with the share-based payment expense.
Employee benefitsThe group operates various defined contribution schemes.
In respect of the defined contribution scheme, all employer contributions are charged to the income statement as incurred, in accordance with the rules of the scheme, and included under staff costs.
Short-term employee benefits are expensed as the related service is provided. A liability is recognised for the amount expected to be paid if the group has a present legal or constructive obligation to pay this amount as a result of past service provided by the employee and the obligation can be estimated reliably.
The long-term employment benefits liability relates to the obligation of the Investec group to deliver ordinary shares of Ninety One plc and Ninety One Limited to employees over a predetermined vesting period. The fair value of this liability is calculated by applying the Black-Scholes option pricing model at each reporting date. The changes in fair value will be recognised as an employee benefit expense. The liability is included in other liabilities on the balance sheet.
Foreign currency transactions and foreign operationsThe presentation currency of the group is South African Rand, being the functional currency of the company, and the currency in which its subsidiaries mainly operate, except Mauritius which is in US Dollars.
Foreign operations are subsidiaries, interests in associated undertakings and joint venture holdings or branches of the group, the activities of which are based in a functional currency other than that of the reporting entity. The functional currency of group entities is determined based on the primary economic environment in which the entity operates.
Foreign currency transactions are translated into the functional currency of the entity in which the transactions arise, based on rates of exchange ruling at the date of the transactions.
At each balance sheet date foreign currency items are translated as follows:
• Monetary items (other than monetary items that form part of the net investment in a foreign operation) are translated using closing rates, with gains or losses recognised in the income statement
• Exchange differences arising on monetary items that form part of the net investment in a foreign operation are determined using closing rates and recognised as a separate component of equity (foreign currency translation reserve) upon consolidation and is reclassified to the income statement upon disposal of the net investment
• Non-monetary items that are measured at historical costs are translated using the exchange rates ruling at the date of the transaction. Non-monetary items that are measured at fair value are translated using the exchange rate at the date of the valuation, with movements due to changes in foreign currency being presented in terms of the accounting policy for changes in the fair value movement of the respective item.
03 Annual financial statements Investec Limitedgroup and company annual financial statements 2021
ACCOUNTING POLICIESCONTINUED
38

On consolidation, the results and financial position of foreign operations are translated into the presentation currency of the group, as follows:
▪ Assets and liabilities for each balance sheet presented are translated at the closing rate at the date of the balance sheet
▪ Income and expense items are translated at exchange rates ruling at the date of the transaction
▪ All resulting exchange differences are recognised in other comprehensive income (foreign currency translation reserve), which is recognised in the income statement on disposal of the foreign operation
▪ Cash flow items are translated at the exchange rates ruling at the date of the transactions.
On loss of control or disposal of a foreign operation, the cumulative amount of the exchange differences relating to that foreign operation recognised in other comprehensive income is reclassified from equity to profit or loss and included in the profit on loss of control.
Revenue recognitionRevenue consists of interest income, fee and commission income, investment income, trading income arising from customer flow, trading income arising from balance sheet management, share of post-taxation profit of associates and joint venture holdings and other trading activities and other operating income.
Interest income on debt instruments at amortised cost and FVOCI is recognised in the income statement using the effective interest method. Calculation of the effective interest rate takes into account fees payable or receivable that are an integral part of the instruments yield, premiums or discounts on acquisition or issue, early redemption fees and transaction costs.
The effective interest method is based on the estimated life of the underlying instrument and where this estimate is not readily available, the contractual life. Interest on instruments at fair value through profit or loss is recognised based on the contractual rates.
Fee and commission income includes revenue from contracts with customers earned from providing advisory services as well as portfolio management and includes rental income from investment properties.
Revenue from contracts with customers is recognised in accordance with five steps to: identify the contract; identify the performance obligations; determine the transaction price; allocate the transaction price to the performance obligations; and recognise revenue when the performance obligations are satisfied.
Investment advisory and management fees are earned over the period in which the services are provided. Performance fees can be variable and recognition is constrained until such time as it is highly probable that a significant reversal in the amount of cumulative revenue recognised will not occur and the services related to the transactions have been completed under the terms of the contract.
Investment income includes income, other than margin from securities held for the purpose of generating interest yield, dividends and capital appreciation.
Customer flow trading income includes income from trading activities arising from making and facilitating client activities.
Trading income arising from balance sheet management and other trading activities consists of proprietary trading income and other gains or losses arising from balance sheet management.
Trading profit includes the unrealised profit on trading portfolios, which are marked-to-market daily. Equity investments received in lieu of corporate finance fees are included in investment portfolio and valued accordingly.
Dividend income is recognised when the group’s right to receive payment is established.
Included in other operating income is incidental rental income, gains on realisation of properties (other than investment properties which is included in investment income), operating lease income and income from assurance activities. Operating costs associated with these investments are included in operating costs in the income statement.
Rewards programmeThe group has a Rewards programme whereby account cardholders are awarded Rewards points in proportion to eligible transactions. Rewards points may be redeemed at a later stage for goods or services at a variety of lifestyle, shopping, travel and financial partners. Rewards points earned are valid for three years from allocation date. Client rewards are considered to be a cost of the interchange service fee revenue stream, where the cardholder is not considered to be the customer but rather that the associated rewards are incentives paid to cardholders in respect of this stream. As a result, the costs to provide cardholders with these rewards are considered to be expenses and recognised in fee and commission expenses as the related income is earned, with the obligation to settle these points reflected in other liabilities until such time as they are redeemed.
Fair value measurementFair value is the price that would be received to sell an asset or paid to transfer a liability in an orderly transaction between market participants at the measurement date in the principal or, in its absence, the most advantageous market to which the group has access at that date. The fair value of an asset or a liability reflects its non-performance risk.
When available, the group measures the fair value of an instrument using the quoted price in an active market for that instrument.
A market is regarded as active if transactions for the asset or liability take place with sufficient frequency and volume to provide pricing information on an ongoing basis.
If there is no quoted price in an active market, then the group uses valuation techniques that maximise the use of relevant observable inputs and minimise the use of unobservable inputs. The chosen valuation technique incorporates all of the factors that market participants would take into account in pricing a transaction.
If an asset or a liability measured at fair value has a bid price and an ask price, then the group measures assets and long positions at a bid price and liabilities and short positions at an ask price.
The group classifies disclosed fair values according to a hierarchy that reflects the significance of observable market inputs.
A transfer is made between the hierarchy levels when the inputs have changed or there has been a change in the valuation method. Transfers are deemed to occur at the end of each semi-annual reporting period.
03 Annual financial statements Investec Limitedgroup and company annual financial statements 2021
ACCOUNTING POLICIESCONTINUED
39

Financial instrumentsFinancial instruments are initially recognised at their fair value. For financial assets or financial liabilities not held at fair value through profit or loss, transaction costs that are directly attributable to the acquisition or issue of the financial assets or financial liabilities are included in the initial measurement. All other transaction costs are recorded in the income statement immediately. Regular way purchase and sales transactions in respect of financial assets that require delivery of a financial instrument within the timeframe established by market convention are recorded at trade date.
Business model assessmentFor financial assets, IFRS 9 requires that a business model assessment is carried out which reflects how the group manages the assets in order to generate cash flows. The assessment is at a portfolio level, being the level at which the portfolio is managed. Factors considered by the group in determining the business model for a group of assets include past experience on how the cash flows for these assets were collected, how the assets’ performance is evaluated and reported and how risks are assessed and managed.
The standard sets out different types of business model:
▪ Hold to collect: it is intended to hold the asset to maturity to earn interest, collecting repayments of principal and interest from the customer. These assets are accounted for at amortised cost
▪ Hold to collect and sell: this model is similar to the hold to collect model, except that the entity may elect to sell some or all of the assets before maturity to achieve the objectives of the business model. These assets are accounted for at FVOCI
▪ Hold to sell/managed on a fair value basis: the entity originates or purchases an asset with the intention of disposing of it in the short or medium term to benefit from capital appreciation or the portfolio is managed on a fair value basis. These assets are accounted for at FVPL.
However, the group may make the following irrevocable election/designation at initial recognition of a financial asset on an asset-by-asset basis:
▪ Elect to present subsequent changes in fair value of an equity investment that is neither held-for-trading nor contingent consideration recognised by an acquirer in a business combination to which IFRS 3 applies, in OCI;
▪ A debt instrument that meets the amortised cost or FVOCI criteria as measured at FVPL if doing so eliminates or significantly reduces an accounting mismatch (referred to as the fair value option).
The classification into one of these categories is based on the group’s business model for managing the assets and the contractual cash flow characteristics of the assets.
Solely payment of principal and interest (SPPI)Where the business model is to hold assets to collect contractual cash flows or to collect contractual cash flows and sell, the group assesses whether the assets’ cash flows represent solely payments of principal and interest (the SPPI test). In making this assessment, the group considers whether the contractual cash flows are consistent with a basic lending arrangement (i.e. interest includes only consideration for the time value of money, credit risk, other basic lending risks and a profit margin that is consistent with a basic lending arrangement). Where the contractual terms introduce exposure to risk or volatility that are inconsistent with a basic lending arrangement, the related asset is classified and measured at FVPL.
Financial assets with embedded derivatives are considered in their entirety when determining whether their cash flows are solely payments of principal and interest.
Financial assets measured at amortised costFinancial assets that are held to collect the contractual cash flows and that contain contractual terms that give rise to cash flows that are solely payments of principal and interest, such as most loans and advances to banks and customers and some debt securities, are measured at amortised cost. In addition, most financial liabilities are measured at amortised cost.
The group may commit to provide a loan which has not yet been drawn. When the loan that arises from the lending commitment is expected to meet the criteria to be measured at amortised cost the undrawn commitment is also considered to be and is included in the impairment calculation.
The carrying value of these financial assets at initial recognition includes any directly attributable transaction costs. If the initial fair value is lower than the cash amount advanced, such as in the case of some leveraged finance and syndicated lending activities, the difference is deferred and recognised over the life of the loan through the recognition of interest income, unless the loan is credit impaired.
Financial assets measured at fair value through other comprehensive income (FVOCI)Financial assets held for a business model that is achieved by both collecting contractual cash flows and selling and that contain contractual terms that give rise on specified dates to cash flows that are solely payments of principal and interest are measured at FVOCI. They are recognised on the trade date when the group enters into contractual arrangements to purchase and are normally derecognised when they are either sold or redeemed.
They are subsequently remeasured at fair value and changes therein (except for those relating to impairment, interest income and foreign currency exchange gains and losses) are recognised in other comprehensive income until the assets are sold. Upon disposal, the cumulative gains or losses in other comprehensive income are recognised in the income statement as ‘Gains less losses arising from derecognition of debt instruments measured at fair value through other comprehensive income’.
Financial assets measured at FVOCI are included in the impairment calculations set out below and impairment is recognised in profit or loss.
03 Annual financial statements Investec Limitedgroup and company annual financial statements 2021
ACCOUNTING POLICIESCONTINUED
40

Impairment of financial assets held at amortised cost or FVOCIAt each balance sheet date, each financial asset or portfolio of advances categorised at amortised cost or at fair value through other comprehensive income, issued financial guarantee and loan commitment is measured for ECL impairment.
The costs of loss allowances on assets held at amortised cost and at FVOCI are presented as impairments in the income statement. Allowances in respect of financial guarantees and loan commitments are presented as other liabilities and charges recorded within income statement impairments. Financial assets held at amortised cost are presented net of allowances except where the asset has been wholly or partially written off.
Stage 1Financial assets that are considered performing and have not had a significant increase in credit risk are reported as Stage 1 assets. Stage 1 financial assets have loss allowances measured at an amount equal to 12-month ECL.
In line with regulatory and accounting bodies guidance, exposures that have been granted COVID-19 relief measures such as payment holidays are not automatically considered to have been subject to a significant increase in credit risk and therefore do not alone result in a transfer across stages. Where relief measures are granted, there is no change in expectation of the total amount due. Should the expected recoverability of the loan remain the same, these exposures will remain reported in Stage 1 for the foreseeable future, and will not be required to hold a lifetime ECL.
Stage 2Financial assets are considered to be in Stage 2 when their credit risk has increased significantly since initial recognition. A loss allowance equivalent to a lifetime ECL is required to be held.
The group’s primary indicator for Stage 2 assets are distressed loans, potential problem loans and exposures in arrears that require additional attention and supervision from watchlist committees and are under management review.
Assets in forbearance are considered to be, at a minimum, Stage 2. Forbearance measures refer to concessions such as modification of the terms and conditions or refinancing that has been granted to a debtor in financial difficulty. These exposures are assessed on a case-by-case basis to determine whether the proposed modifications will be considered as forbearance. Where the credit committee considers it likely that the client will be able to return to perform against the original contractual obligations within a reasonable timeframe these assets will be considered performing and in Stage 2. Forbearance is distinguished from commercial renegotiations which take place as part of normal business activity and standard banking practice.
In addition to loans under management review, an asset may also move from Stage 1 to Stage 2 if the model calculated probability of default (PD) has significantly increased since origination. This is tested on both a relative and absolute basis to assess whether a significant deterioration in lifetime risk of default has occurred. In South Africa, the change in the lifetime PD from deal origination to the reporting date is monitored monthly. The absolute and relative changes in lifetime PDs are tested against predefined trigger levels. When the change in lifetime PDs exceeds the trigger levels, it is considered a significant increase in credit risk and the exposure is migrated to Stage 2. The trigger levels have been defined for each asset class and are a function of the internal credit rating and the remaining maturity of the exposure.
The group adopts the view that all financial assets that are more than 30 days past due have experienced a significant increase in credit risk.
Exposures move back to Stage 1 once they no longer meet the criteria above for a significant increase in credit risk and as cure periods (specifically relating to forborne exposures) are met.
Stage 3Financial assets are included in Stage 3 when there is objective evidence of credit impairment. The group assesses a loan as Stage 3 when contractual payments of either principal or interest are past due for more than 90 days, the debtor is assessed as unlikely to pay and credit impaired, or the loan is otherwise considered to be in default, for example, due to the appointment of an administrator or the client is in receivership. Forborne loans that are considered non-performing, for example, if a loan is not expected to meet the original contractual obligations in a reasonable timeframe, the loan will be classified as Stage 3. Loans which are 90 days or more past due are considered to be in default.
The group calculates the credit adjusted effective interest rate on Stage 3 assets, which is calculated based on the amortised cost of the financial asset (i.e. gross carrying amount less ECL allowance) instead of its gross carrying amount and incorporates the impact of the ECLs in estimated future cash flows.
Definition of defaultThe group has aligned the IFRS 9 and regulatory definitions of default, credit impaired and non-performing exposure. Assets that are more than 90 days past due, or considered by management as unlikely to pay their obligations in full without realisation of collateral are considered as exposures in default.
ECLThe assessment of credit risk and the estimation of ECL are required to be unbiased, probability-weighted and should incorporate all available information relevant to the assessment, including information about past events, current conditions and reasonable and supportable forecasts of economic conditions at the reporting date. In addition, the estimation of ECL should take into account the time value of money. As a result, the recognition and measurement of impairment is intended to be forward‑looking and therefore, potentially volatile.
Write-offsA loan or advance is normally written off in full against the related ECL impairment allowance when the proceeds from realising any available security have been received or there is a reasonable amount of certainty that the exposure will not be recovered. This is assessed on a case-by-case basis with considerations to indicators such as whether the exposure has been restructured or the given financial position of the borrower and guarantors. Any recoveries of amounts previously written off decrease the amount of impairment losses.
03 Annual financial statements Investec Limitedgroup and company annual financial statements 2021
ACCOUNTING POLICIESCONTINUED
41

Process to determine ECLECLs are calculated using three main components:
• A probability of default (PD);• A loss given default (LGD); and• The exposure at default (EAD).The 12-month and lifetime PDs represent the probability of a default occurring over the next 12 months or the lifetime of the financial exposures, respectively, based on conditions existing at the balance sheet date and future forecast macro-economic conditions that affect credit risk.
The LGD represents losses expected on default, taking into account the mitigating effect of collateral, its expected value when realised and the time value of money.
The EAD represents the expected balance at default, taking into account any expected drawdown on a committed facility.
The calculation of the 12-month ECL is based on the 12-month PD and LGD along with the EAD and EIR for the asset. Lifetime ECL is calculated using the lifetime PD curve, and the appropriate LGDs and EADs and discount rates derived from the EIR based on the remaining life of the financial asset.
Expert judgement models are also utilised for certain portfolios where the ECL is found to be minimal, either due to the portfolio’s small relative size or the low default nature of these portfolios, such as cash and balances held at central banks.
Management adjustments are made to modelled output to account for situations where additional information and known or expected risk factors have not been captured in the modelling process.
Financial assets and liabilities held at fair value through profit or lossFinancial instruments held at fair value through profit or loss include all instruments classified as held-for-trading, those instruments designated as held at fair value through profit or loss and those financial assets which do not meet the criteria for amortised cost or FVOCI.
Financial instruments classified as FVPL are initially recorded at fair value on the balance sheet with changes in fair value subsequently recognised in the income statement. Financial instruments are classified as held-for-trading when they are held with the intention of short-term disposal, held with the intention of generating short-term profit, or are derivatives which are not designated as part of effective hedges. Financial instruments designated as held at fair value through profit or loss are designated as such on initial recognition of the instrument and remain in this classification until derecognition.
Financial assets and liabilities are designated as held at fair value through profit or loss only if:
• They eliminate or significantly reduce a measurement or recognition inconsistency that would otherwise arise from measuring assets or liabilities or recognising the gains and losses on them on different bases; or
• A group of financial liabilities or both financial assets and financial liabilities is managed and its performances evaluated on a fair value basis in accordance with a documented risk management or investment strategy and information about the group is provided internally on that basis to the group’s key management personnel; or
• A financial liability contract contains one or more embedded derivatives (which significantly modifies the cash flows that would be required by the contract and is not clearly prohibited from separation from the host contract) and the group has designated the entire hybrid contract as a financial instrument at fair value through profit or loss.
Changes in fair value of financial liabilities designated at fair value that is attributable to changes in own credit is recognised in other comprehensive income. Any other changes in fair value are recognised in the income statement.
Equity instruments measured at FVOCIThe group measures equity instruments at FVOCI when it considers the investments to be strategic or held for long-term dividend yield. The equity instruments are not held-for-trading. Gains or losses on the derecognition of these equity securities are not transferred to profit or loss.
Otherwise, equity instruments are measured at fair value through profit or loss (except for dividend income, which is recognised in profit or loss).
Securitisation/credit investment and trading activities exposuresThe group makes use of securitisation vehicles as a source of finance, as a means of risk transfer and to leverage returns through the retention of equity tranches in low default rate portfolios. The group predominantly focuses on the securitisation of residential and commercial mortgages and lease receivables. The group also trades in structured credit investments.
The structured entities are consolidated under IFRS 10 Consolidated Financial Statements when the group has exposure to or rights to variable returns from its involvement with the investee and has the ability to affect those returns through its power over the investee.
Loans and advances that are originated are transferred to structured entities, and the structured entities issue debt securities to external investors to fund the purchase of the securitised assets. When the group consolidates the structured entity, the group recognises the assets and liabilities on a gross basis. When the group does not consolidate the structured entity, the securitised assets are derecognised and only any position still held by the group in the structured entity is reflected.
03 Annual financial statements Investec Limitedgroup and company annual financial statements 2021
ACCOUNTING POLICIESCONTINUED
42

Day-one profit or lossWhen the transaction price differs from the fair value of other observable current market transactions in the same instrument or based on the valuation technique whose variables include only data from observable markets, the difference between the transaction price and fair value is recognised immediately in the income statement. In cases where fair value is determined using data which is not observable, the difference between the transaction price and model value is only recognised in the income statement when the inputs become observable, when the instrument is derecognised or over the life of the transaction.
Derecognition of financial assets and liabilitiesA financial asset, or a portion thereof, is derecognised when the group’s rights to cash flows have expired or when the group has transferred its rights to cash flows relating to the financial assets and either (a) the group has transferred substantially all the risks and rewards associated with the financial assets or (b) the group has neither transferred nor retained substantially all the risks and rewards associated with the financial assets but has transferred control of the assets.
The treatment of a renegotiation or modification of the contractual cash flows of a financial asset depends upon whether the modification is done for commercial reasons, in which case if they are significant the old asset is derecognised and a new asset recognised, or because of financial difficulties of the borrower. Where such modifications are solely due to IBOR reform and result in an interest rate which is economically equivalent, they are treated as a change to the floating rate of interest and so do not result in any adjustment to the carrying value of the asset.
A financial liability is derecognised when it is extinguished, that is when the obligation is discharged, cancelled or expired. When an existing financial liability is replaced or modified with substantially different terms, such a replacement or modification is treated as a derecognition of the original liability and the recognition of a new liability. The difference in the respective carrying amounts is recognised in the income statement.
Reclassification of financial instrumentsFinancial assets are only reclassified where there has been a change in business model. Financial liabilities cannot be reclassified.
Derivative instrumentsAll derivative instruments of the group are recorded on the balance sheet at fair value. Positive and negative fair values are reported as assets and liabilities, respectively.
Derivative positions are entered into either for trading purposes or as part of the group’s asset and liability management activities to manage exposures to interest rate and foreign currency risks. Both realised and unrealised profit or losses arising on derivatives are recognised in the income statement as part of trading income (other than circumstances in which cash flow hedging is applied as detailed in the hedge accounting section below).
Derivative instruments entered into as economic hedges which do not qualify for hedge accounting and derivatives that are entered into for trading purposes are treated in the same way as instruments that are held-for-trading.
Credit derivatives are entered into for trading purposes. Credit derivatives are initially recognised at their fair values, being the transaction price of the derivative. Subsequently the derivatives are carried at fair value, with movements in fair value through the income statement, based on the current market price or remeasured price. The counterparty risk from derivative transactions is taken into account when reporting the fair value of derivative positions. The adjustment to the fair value is known as the credit value adjustment (CVA).
Hedge accountingWhen the group first implemented IFRS 9, it made an election to continue to apply the hedge accounting requirements of IAS 39 as an accounting policy.
The group applies either fair value or cash flow hedge or hedge of net investments in foreign operations accounting when the transactions meet the specified hedge accounting criteria.
To qualify for hedge accounting treatment, the group ensures that all of the following conditions are met:
• At inception of the hedge, the group formally documents the relationship between the hedging instrument(s) and hedged item(s) including the risk management objectives and the strategy in undertaking the hedge transaction. Also at the inception of the hedge relationship, a formal assessment is undertaken to ensure the hedging instrument is expected to be highly effective in offsetting the designated risk in the hedged item. A hedge is expected to be highly effective if the changes in fair value or cash flows attributable to the hedged risk during the period for which the hedge is designated are expected to offset in a range of 80% to 125%
• For cash flow hedges, a forecasted transaction that is the subject of the hedge must be highly probable and must present an exposure to variations in cash flows that could ultimately affect the income statement
• The effectiveness of the hedge can be reliably measured, i.e. the fair value or cash flows of the hedged item that are attributable to the hedged risk and the fair value of the hedging instrument can be reliably measured
• The hedge effectiveness is assessed on an ongoing basis and determined actually to have been highly effective throughout the financial reporting periods for which the hedge was designated.
For qualifying fair value hedges, the change in fair value of the hedging instrument is recognised in the income statement. Changes in fair value of the hedged item that is attributable to the hedged risk are also recognised in the income statement.
For qualifying cash flow hedges in respect of non-financial assets and liabilities, the change in fair value of the hedging instrument relating to the effective portion is initially recognised directly in other comprehensive income in the cash flow hedge reserve and is included in the initial cost of any asset/liability recognised or in all other cases released to the income statement when the hedged firm commitment or forecasted transaction affects net profit. If the forecast transaction or firm commitment is no longer expected to occur, the balance included in other comprehensive income is reclassified to the income statement immediately and recognised in trading income from balance sheet management and other trading activities.
03 Annual financial statements Investec Limitedgroup and company annual financial statements 2021
ACCOUNTING POLICIESCONTINUED
43

For qualifying cash flow hedges in respect of financial assets and liabilities, the change in fair value of the hedging instrument, which represents an effective hedge, is initially recognised in other comprehensive income and is reclassified to the income statement in the same period during which the relevant financial asset or liability affects the income statement. Any ineffective portion of the hedge is immediately recognised in the income statement.
For qualifying hedges of a net investment in a foreign operation including a hedge of a monetary item that is accounted for as part of the net investment are accounted for in a way similar to cash flow hedges. Changes in the fair value of the hedging instrument relating to the effective portion of the hedge are recognised in other comprehensive income while any gains or losses relating to the ineffective portion are recognised in the income statement. On disposal of the foreign operation, the cumulative value of any such gain or loss recorded in other comprehensive income is reclassified to the income statement.
Hedge accounting is discontinued when it is determined that the instrument ceases to be highly effective as a hedge; when the derivative expires, or is sold, terminated or exercised; when the hedged item matures or is sold or repaid; when a forecasted transaction is no longer deemed highly probable or when the designation as a hedge is revoked.
Sources of hedge ineffectiveness may arise from basis risk, including but not limited to the discount rates used for calculating the fair value of derivatives, hedges using instruments with a non-fair value, and notional and timing differences between the zero hedged items and hedging instruments.
The group applied the IBOR reform Phase 1 reliefs to hedging relationships directly affected by IBOR reform during the period before the replacement of an existing interest rate benchmark with an alternative RFR. A hedging relationship is affected if IBOR reform gives rise to uncertainties about the timing and/or amount of benchmark-based cash flows of the hedged item or the hedging instrument. The reliefs require that for the purpose of determining whether a forecast transaction is highly probable, it is assumed that the IBOR on which the hedged cash flows are based is not altered as a result of IBOR reform.
IBOR reform Phase 1 requires that for hedging relationships affected by IBOR reform, the group must assume that for the purpose of assessing expected future hedge effectiveness, the interest rate is not altered as a result of IBOR reform. Also, the group is not required to discontinue the hedging relationship if the results of the assessment of retrospective hedge effectiveness fall outside the range of 80% to 125%, although any hedge ineffectiveness must be recognised in profit or loss, as normal.
The reliefs cease to apply once certain conditions are met. These include when the uncertainty arising from IBOR reform is no longer present with respect to the timing and amount of the benchmark-based cash flows of the hedged item, if the hedging relationship is discontinued or once amounts in the cash flow hedge reserve have been released.
The group has adopted early IBOR reform Phase 2 for this year. IBOR reform Phase 2 provides temporary reliefs that allow the group’s hedging relationships to continue upon the replacement of an existing interest rate benchmark with an RFR. The reliefs require the group to amend the hedge designations and hedge documentation and are set out above.
Refer to page 137 for more detail on the impact of IBOR reform.
Offsetting of financial assets and liabilitiesFinancial assets and liabilities are offset when there is both an intention to settle on a net basis (or simultaneously) and a currently enforceable legal right to offset exists.
Issued debt and equity financial instrumentsFinancial instruments issued by the group are classified as liabilities if they contain a contractual obligation to deliver cash or another financial asset.
Financial instruments issued by the group are classified as equity where they confer on the holder a residual interest in the group, and the group has no obligation to deliver either cash or another financial asset to the holder. The components of compound issued financial instruments are accounted for separately with the liability component separated first and any residual amount being allocated to the equity component.
Equity instruments issued by subsidiaries of Investec plc or Investec Limited are recorded as non-controlling interests on the balance sheet.
Equity instruments are initially measured net of directly attributable issue costs.
Treasury shares represent issued equity repurchased by the group which have not been cancelled. Treasury shares are deducted from shareholders’ equity and represent the purchase consideration, including directly attributable costs. Where treasury shares are subsequently sold or reissued, net proceeds received are included in shareholders’ equity.
Dividends on ordinary shares are recognised as a deduction from equity at the earlier of payment date or the date that it is approved by Investec plc (in relation to dividends declared by Investec plc) and Investec Limited (in relation to dividends declared by Investec Limited) shareholders.
Sale and repurchase agreements (including securities borrowing and lending)Securities sold subject to a commitment to repurchase, at a fixed price or a selling price plus a lender’s return, remain on-balance sheet. Proceeds received are recorded as a liability on the balance sheet under ‘repurchase agreements and cash collateral on securities lent’. Securities that are purchased under a commitment to resell the securities at a future date are not recognised on the balance sheet. The consideration paid is recognised as an asset under ‘reverse repurchase agreements and cash collateral on securities borrowed’.
Where sovereign debt securities have been purchased at the same time as derivatives with the same counterparty, such that the combined position has the economic substance similar to secured lending an asset is recognised under ‘reverse repurchase agreements and cash collateral on securities borrowed’
The difference between the sale and repurchase prices is treated as interest expense and is accrued over the life of the agreement using the effective interest method.
Securities borrowing transactions that are not cash collateralised are not included on the balance sheet. Securities lending and borrowing transactions which are cash collateralised are accounted for in the same manner as securities sold or purchased subject to repurchase commitments.
The cash collateral from agency-based scrip lending transactions are disclosed on a net basis, in accordance with master netting agreements and the intention to settle net.
03 Annual financial statements Investec Limitedgroup and company annual financial statements 2021
ACCOUNTING POLICIESCONTINUED
44

Financial guaranteesFinancial guarantee contracts issued by the group are those contracts that require a payment to be made to reimburse the holder for a loss it incurs because the specified debtor fails to make a payment when due, in accordance with the terms of a debt instrument. Financial guarantees are initially recognised at fair value, adjusted for the transaction costs that are directly attributable to the issuance of the guarantee.
Subsequent to initial recognition, the liability under each guarantee is measured at the higher of the amount recognised less cumulative amortisation and the expected credit loss. Subsequent to initial measurement, all changes in the balance sheet carrying value are recognised in the income statement.
Property and equipmentProperty and equipment are recorded at cost less accumulated depreciation and impairments.
Cost is the cash equivalent paid or the fair value of the consideration given to acquire an asset and includes other expenditures that are directly attributable to the acquisition of the asset.
Depreciation is provided on the depreciable amount of each component on a straight-line basis over the expected useful life of the asset.
The depreciable amount related to each asset is determined as the difference between the cost and the residual value of the asset. The residual value is the estimated amount, net of disposal costs that the group would currently obtain from the disposal of an asset in similar age and condition as expected at the end of its useful life.
The current and comparative annual depreciation rates for each class of property and equipment are as follows:
• Equipment 10% – 33%• Furniture and vehicles 10% – 25%• Freehold buildings 2% – 4%• Leasehold property and improvements*• Right of use assets** Leasehold improvements depreciation rates are determined by
reference to the appropriate useful life of its separate components, limited to the period of the lease. Leasehold property and right of use asset depreciation rates are determined by reference to the period of the lease.
No depreciation is provided on freehold land. However, similar to other property-related assets, it is subject to impairment testing when an indication of impairment exists.
Routine maintenance and service costs for group assets are expensed as incurred. Subsequent expenditure is only capitalised if it is probable that future economic benefits associated with the item will flow to the group.
Investment propertiesProperties held for capital appreciation or rental yield are classified as investment properties. Investment properties are initially measured at cost plus transaction costs and subsequently carried at fair value, with fair value gains or losses recognised in the income statement in investment income.
Fair value of investment property is calculated by taking into account the expected rental stream associated with the property, and are supported by market evidence.
LeasesAt inception of a contract the group assesses whether a contract is, or contains, a lease. A contract is, or contains, a lease if the contract conveys the right to control the use of an identified asset for a period of time in exchange for consideration. To assess whether a contract conveys the right to control the use of an identified asset, the group assesses whether:
• The group has the right to obtain substantially all of the economic benefits from use of the asset throughout the period of use, and
• The group has the right to direct the use of the asset.
As a lessee, the group recognises a right of use (ROU) asset and a lease liability at the lease commencement date.
The lease liability is initially measured at the present value of the lease payments that are not paid at the commencement date, discounted at the rate implicit in the lease, or, where that is not available, at the group’s incremental borrowing rate.
The lease liability will increase for the accrual of interest, and will result in a constant rate of return throughout the life of the lease, and reduce when payments are made.
The ROU asset is initially measured at cost, which comprises the initial amount of the lease liability adjusted for any lease payments made at or before the commencement date, plus any indirect costs incurred and an estimate of costs to dismantle and remove the underlying asset or to restore the underlying asset or the site on which it is located, less any lease incentives received.
The ROU asset is subsequently depreciated using the straight-line method from the commencement date to the end of the lease term. In addition, the ROU asset is periodically reduced by impairment losses, if any, and adjusted for certain re-measurements of the lease liability.
The lease liability is subsequently remeasured when there is a change in future lease payments arising from a change in index or rate, if there is a change in the group’s estimate of the amount expected to be payable under a residual value guarantee, or if the group changes its assessment of whether it will exercise a purchase, extension or termination option.
Where the lease liability is remeasured, a corresponding adjustment is made to the carrying amount of the ROU asset, or is recorded in the income statement if the carrying amount of the ROU asset has been reduced to zero.
03 Annual financial statements Investec Limitedgroup and company annual financial statements 2021
ACCOUNTING POLICIESCONTINUED
45

The group has elected not to recognise ROU assets and lease liabilities for short-term leases that have a lease term of 12 months or less. The group recognises the lease payments associated with these leases as an expense on a straight-line basis over the lease term.
When the group is the lessor, the lease must be classified as either a finance lease or an operating lease. A finance lease is a lease which confers substantially all the risks and rewards of the leased assets on the lessee. An operating lease is a lease where substantially all of the risks and rewards of the leased asset remain with the lessor.
When the lease is deemed a finance lease, the leased asset is not held on the balance sheet; instead a finance lease receivable is recognised representing the minimum lease payments receivable under the terms of the lease, discounted at the rate of interest implicit in the lease.
When the lease is deemed an operating lease, the lease income is recognised on a straight-line basis over the period of the lease unless another systematic basis is more appropriate.
For the balance sheet, the ROU assets are included within property and equipment, finance lease receivables are included within loans and advances to customers and the lease liabilities are included within other liabilities.
Where the group has a head lease and sublease arrangement with external partners, the finance lease receivable is recognised in other assets on the balance sheet.
Trading propertiesTrading properties are carried at the lower of cost and net realisable value.
Intangible assetsSoftware and intangible assets are recorded at cost less accumulated amortisation and impairments. Software and intangible assets with finite lives, are amortised over the useful economic life (currently three to 20 years) on a straight-line basis. The depreciable amount related to each asset is determined as the difference between the cost and the residual value of the asset.
Impairment of non-financial assetsAt each balance sheet date, the group reviews the carrying value of non-financial assets, other than investment property, for indication of impairment. The recoverable amount, being the higher of fair value less cost of disposal and value-in-use, is determined for any assets for which an indication of impairment is identified. If the recoverable amount of an asset is less than its carrying value, the carrying value of the asset is reduced to its recoverable amount.
Impairment losses are recognised as an expense in the income statement in the period in which they are identified. Reversals of impairment losses are recognised in income in the period in which the reversals are identified, to the extent that the carrying value of the asset does not exceed the amount that would have been calculated without impairment.
Non-current assets held for saleThe group classifies non-current assets and disposal groups as held for sale if their carrying amounts will be recovered principally through a sale transaction rather than through continuing use.
Assets in the measurement scope of IFRS 5 are carried at the lower of their carrying amount and fair value less costs to sell.
Trust and fiduciary activitiesThe group acts as a trustee or in other fiduciary capacities that result in the holding, placing or managing of assets for the account of and at the risk of clients. As these are not assets of the group, they are not recognised on the balance sheet but are included at market value as part of third party assets under management.
Taxation and deferred taxationCurrent taxation payable is provided for based on the amount expected to be payable on taxable profit at rates that are enacted or substantively enacted and applicable to the relevant period.
Deferred taxation is provided on temporary differences between the carrying amount of an asset or liability in the balance sheet and its tax base, except where such temporary differences arise from:
• The initial recognition of goodwill• The initial recognition of an asset or liability in a transaction
which is not a business combination and at the time of the transaction has no effect on the income statement or taxable profit
• Temporary differences associated with the investments in subsidiaries and interests in associated undertakings and joint venture holdings, where the timing of the reversal of the temporary differences can be controlled and it is probable that the temporary differences will not reverse in the foreseeable future.
Deferred taxation assets or liabilities are measured using the taxation rates that have been enacted or substantively enacted at the balance sheet date.
Deferred taxation assets are recognised to the extent that it is probable that future taxable profit will be available against which the deferred taxation asset can be utilised. Items recognised directly in other comprehensive income are net of related current and deferred taxation.
03 Annual financial statements Investec Limitedgroup and company annual financial statements 2021
ACCOUNTING POLICIESCONTINUED
46

Insurance contractsInsurance contracts are those contracts in which the group assumes significant insurance risk. The deposit components of insurance contracts are unbundled and accounted for separately.
Insurance premiums are recognised in the period in which the group is entitled to the premium. Insurance claims are recognised in the income statement in the period in which a contractual obligation arises for the group to make payment under an insurance contract.
Reinsurance assets and liabilities and associated premiums/ claims are not offset in the income statement or balance sheet. Insurance liabilities are measured at their actuarial values, and are tested for adequacy on an annual basis. Any deficiency identified is recognised in the income statement.
Insurance income is included in other operating income.
Borrowing costsBorrowing costs that are directly attributable to property developments which take a substantial period of time to develop are capitalised.
Provisions, contingent liabilities and contingent assetsProvisions are recognised when the group has a present obligation (legal or constructive) as a result of a past event; it is probable that an outflow of resources embodying economic benefits will be required to settle the obligation and a reliable estimate can be made of the amount of the obligation. The expense relating to a provision is presented in the income statement net of any reimbursement. Contingent assets and contingent liabilities are not recognised on the balance sheet.
Standards and interpretations issued but not yet effectiveThe following significant standards and interpretations, which have been issued but are not yet effective, are applicable to the group. These standards and interpretations have not been applied in these annual financial statements. The group intends to comply with these standards from the effective dates.
IFRS 17 Insurance contractsIFRS 17 Insurance Contracts was issued in May 2017 and sets out the requirements that an entity should apply in accounting for insurance contracts it issues and reinsurance contracts it holds. It applies to all types of insurance contracts, regardless of the type of entities that issue them, as well as to certain guarantees and financial instruments with discretionary participation features. A few scope exceptions will apply.
IFRS 17 is effective from 1 January 2023 and the group is considering its impact.
All other standards and interpretations issued but not yet effective are not expected to have a material impact on the group.
Key management assumptionsIn preparation of the annual financial statements, the group makes estimations and applies judgement that could affect the reported amount of assets and liabilities within the next financial year. Key areas in which judgement is applied include:
• The impact of COVID-19 required management to apply significant judgements and estimates to quantify the impact on the annual financial statements. The assumptions can specifically be viewed on pages 132 and 133 in note 61.
• In accordance with IFRS 13 Fair Value Measurement, the group categorises financial instruments carried on the balance sheet at fair value using a three level hierarchy. Financial instruments categorised as level 1 are valued using quoted market prices and therefore there is minimal judgement applied in determining fair value. However, the fair value of financial instruments categorised as level 2 and, in particular, level 3 is determined using valuation techniques including discounted cash flow analysis and valuation models. The valuation techniques for level 3 financial instruments involve management judgement and estimates the extent of which depends on the complexity of the instrument and the availability of market observable information. In particular, significant uncertainty exists in the valuation of unlisted investments and fair value loans in the private equity and direct investments portfolios. Key valuation inputs are based on the most relevant observable market information and can include expected cash flows, discount rates, earnings multiples and the underlying assets within a business, adjusted where necessary for factors that specifically apply to the individual investments and recognising market volatility. Further details of the group’s level 3 financial instruments and the sensitivity of the valuation including the effect of applying reasonably possible alternative assumptions in determining their fair value are also set out in note 16.
Details of unlisted investments can be found in note 27 with further analysis contained on page 139 in note 61.
• Valuation of investment properties is performed twice annually by qualified internal valuers and at least half of the portfolio is valued by independent external valuers annually. The valuation is performed by capitalising the budget net income of the property at the market-related yield applicable at the time. Properties in Investec Property Fund are valued according to the JSE Listings Requirements.
03 Annual financial statements Investec Limitedgroup and company annual financial statements 2021
ACCOUNTING POLICIESCONTINUED
47

Refer to note 34 for the carrying value of investment property with further analysis on page 139 in note 61.
• The measurement of ECL has reliance on expert credit judgement. Key judgemental areas are highlighted below and are subject to robust governance processes. Key drivers of measurement uncertainty include:
– The assessment of a significant increase in credit risk;– A range of forward-looking probability weighted macro-
economic scenarios; and– Estimations of probabilities of default, loss given default
and exposures at default using models.
In addition to these drivers, some initial judgements and assumptions were required in the design and build of the group’s ECL methodology, which are not considered to have a material impact. These include the use of income recognition effective interest rates (EIRs), in accordance with accounting standards, as the discount factor in the ECL calculation as well as the use of contractual maturity to assess behavioural lives. In addition, where we have experienced limitations on the availability of probability of default origination data for the historic book, a portfolio average has been used in some instances.
Following a detailed review of the outcome of the ECL models, management raised an additional overlay provision in SA.
• The group’s income tax charge and balance sheet provision are judgemental in nature. This arises from certain transactions for which the ultimate tax treatment can only be determined by final resolution with the relevant local tax authorities. The group has recognised in its current tax provision certain amounts in respect of taxation that involve a degree of estimation and uncertainty where the tax treatment cannot finally be determined until a resolution has been reached by the relevant tax authority and whether the proposed tax treatment will be accepted by the authorities. The carrying amount of this provision is sensitive to the resolution of issues, which is often dependent on the timetable and progress of discussion and negotiations with the relevant tax authorities, arbitration process and legal proceedings in the relevant tax jurisdictions in which the group operates. Issues can take many years to resolve and assumptions on the likely outcome would therefore have to be made by the group in order to determine if an exposure should be measured based on the most likely amount or expected value.
In making any estimates, management’s judgement has been based on various factors, including:
– The current status of tax audits and enquiries;– The current status of discussions and negotiations with
the relevant tax authorities;– The results of any previous claims; and– Any changes to the relevant tax environments.
• Management assesses the degree of control or influence the group has over certain investments in terms of IFRS 10 Consolidated Financial Statements and IAS 28 Investments in Associates and Joint Ventures. In the case of the IEP Group, this is considered to be an area of significant judgement. We have concluded that we do not control IEP based on the decision-making structure within the entity, our percentage holding, the number and involved nature of other shareholders and our historic experience of our power over the relevant activities. It was concluded that there is significant influence over IEP and it is accounted for as an associate.
• Management critically evaluated the equity accounted value of the group's investment in IEP and consequently recognised an impairment of R98 million in the current year (2020: R937 million). The recoverable amount of the investment in IEP was determined to be the value-in-use. This was calculated by determining Investec's stake of the sum of the fair values of the underlying investments held by IEP. This was done by determining the best estimates of the cash flows to be generated from the ultimate realisation of the underlying investments considering management's strategy with the investments, returns generated by the underlying investments, the nature of the assets and market considerations.
• The group operates in a legal and regulatory environment that exposes it to litigation risks. As a result, the group is involved in disputes and legal proceedings which arise in the ordinary course of business. The group evaluates all facts, the probability of the outcome of legal proceedings and advice from internal and external legal counsel when considering the accounting implications.
03 Annual financial statements Investec Limitedgroup and company annual financial statements 2021
ACCOUNTING POLICIESCONTINUED
48

1. Segmental analysisGroup
Specialist Banking^
Private Client
For the year to 31 March 2021 Wealth &Investment
Private Banking
Corporate, investment
banking and Other
Group investments
Groupcosts
TotalgroupR’million
Net interest income/(expense) 72 4 651 4 237 (922) — 8 038 Net fee and commission income 1 671 960 1 926 967 — 5 524 Investment income/(loss) 31 19 (208) 442 — 284 Share of post-taxation loss of associates and joint venture holdings — (8) (23) (114) — (145) Trading income/(loss) arising from– customer flow — (1) 778 182 — 959 – balance sheet management and other trading
income 1 1 (151) (472) — (621) Other operating income — — 149 — — 149 Total operating income before expected credit loss impairment charges 1 775 5 622 6 708 83 — 14 188 Expected credit loss impairment charges — (34) (535) (52) — (621) Operating income 1 775 5 588 6 173 31 — 13 567 Operating costs (1 221) (2 981) (3 888) (43) (324) (8 457) Operating profit before goodwill, acquired intangibles and non-controlling interests 554 2 607 2 285 (12) (324) 5 110 Loss/(profit) attributable to non-controlling interests — — 6 (4) — 2
Profit/(loss)before goodwill, acquired intangibles, taxation after non-controlling interests 554 2 607 2 291 (16) (324) 5 112 Cost to income ratio 68.8% 53.0% 57.9% n/a n/a 59.6% Total assets (R’million) 6 359 210 421 298 586 34 374 n/a 549 740
^ In terms of IFRS 8 Operating Segments, the above operating segments were changed after management concluded that key operating decision makers of the Investec group reviewed the operating results of the following operating segments:• Investec Private Banking• Investec Corporate, Investment Banking and Other• Investec Wealth & Investment• Group Investments• Group costs.
Accordingly, the results of Investec Private Banking and Investec Corporate, Investment Banking and Other have been disclosed as a separate segments for the first time in the 31 March 2021 results. Investec Private Banking and Investec Corporate, Investment Banking and Other were previously presented as components of the Investec Specialist Bank. Comparatives have been restated.
03 Annual financial statements Investec Limitedgroup and company annual financial statements 2021
NOTES TO THE FINANCIAL STATEMENTS
49

1. Segmental analysis (continued)Specialist Banking^
Private Client
For the year to 31 March 2020 Wealth &Investment
Private Banking
Corporate, investment
banking and Other
Group investments
Groupcosts
TotalgroupR’million
Net interest income/(expense) 72 4 894 4 384 (1 065) — 8 285 Net fee and commission income 1 582 1 046 2 092 1 365 — 6 085 Investment (loss)/income (3) 263 (422) 674 — 512 Share of post-taxation (loss)/profit of associates and joint venture holdings — (23) (1) 335 — 311 Trading (loss)/income arising from– customer flow (3) 1 526 (327) — 197 – balance sheet management and other trading
income (1) 8 (69) 606 — 544 Other operating income — 1 4 — — 5 Total operating income before expected credit loss impairment charges 1 647 6 190 6 514 1 588 — 15 939 Expected credit loss impairment charges — (378) (569) (162) — (1 109) Operating income 1 647 5 812 5 945 1 426 — 14 830 Operating costs (1 146) (3 226) (3 575) (25) (335) (8 307) Operating profit before goodwill, acquired intangibles and non-controlling interests 501 2 586 2 370 1 401 (335) 6 523 Profit attributable to non-controlling interests — — — (1 258) — (1 258) Adjusted operating profit from continuing operations 501 2 586 2 370 143 (335) 5 265 Operating profit from discontinued operations 1 270 Profit before goodwill, acquired intangibles, taxation after non-controlling interests 501 2 586 2 370 143 (335) 6 535 Cost to income ratio 69.6% 52.1% 54.9% n/a n/a 56.6% Total assets (R’million) 7 347 205 809 322 027 40 204 n/a 575 387
^ In terms of IFRS 8 Operating segments, the above operating segments were changed after management concluded that key operating decision makers of the Investec group reviewed the operating results of the following operating segments:• Investec Private Banking• Investec Corporate, Investment Banking and Other• Investec Wealth & Investment• Group Investments• Group costs.
Accordingly, the results of Investec Private Banking and Investec Corporate, Investment Banking and Other have been disclosed as a separate segments for the first time in the 31 March 2021 results. Investec Private Banking and Investec Corporate, Investment Banking and Other were previously presented as components of the Investec Specialist Bank. Comparatives have been restated.
The company’s activities mainly comprise central funding activities within the Specialist Banking segment.
Net assets by class of business is not disclosed as the directors do not view it to be meaningful to provide the information by class of business since the economic capital of certain significant businesses of the group is not held in, or allocated to, these businesses, but is centrally held. No geographical analysis has been presented as the group only operates in one geographical segment, namely Southern Africa.
03 Annual financial statements Investec Limitedgroup and company annual financial statements 2021
NOTES TO THE FINANCIAL STATEMENTSCONTINUED
50

2. Net interest incomeGroup
2021 2020^
For the year to 31 March Averagebalance
sheet valueInterestincome
Averageyield
Averagebalance
sheet valueInterestincome
AverageyieldR’million Notes
Cash, near cash and bank debt and sovereign debt securities 1 166 343 5 460 3.28% 138 735 7 961 5.74% Net core loans and advances 2 286 005 19 815 6.93% 275 163 26 375 9.59%
Private client 206 600 13 591 6.58% 196 445 18 538 9.44% Corporate, institutional and other clients 79 405 6 224 7.84% 78 718 7 837 9.96%
Other debt securities and other loans and advances 16 212 899 5.55% 15 037 812 5.40% Other 3 309 226 n/a 335 531 n/a
468 869 26 400 429 270 35 679
2021 2020
For the year to 31 March Averagebalance
sheet valueInterest
expenseAverage
yield
Averagebalance
sheet valueInterest
expenseAverage
yieldR’million Notes
Deposits by banks and other debt-related securities 4 70 930 (2 068) 2.92% 59 220 (2 511) 4.24% Customer accounts (deposits) 368 848 (14 963) 4.06% 347 935 (23 337) 6.71% Subordinated liabilities 5 13 986 (953) 6.81% 15 084 (1 171) 7.76% Other 2 742 (378) n/a 1 973 (375) n/a
456 506 (18 362) 424 212 (27 394) Net interest income 8 038 8 285 Net interest margin* 1.71% 1.93%
^ Restated as detailed in note 58
We have changed our methodology for calculating net interest margin whereby this is now calculated using a straight-line 13 point (full year) average rather than a straight-line two point average previously. Under the previous methodology the net interest margin for the year to 31 March 2021 would have been: 1.72% (2020^: 1.82%).1. Comprises (as per the balance sheet) cash and balances at central banks; loans and advances to banks and non-sovereign and non-bank cash
placements; reverse repurchase agreements and cash collateral on securities borrowed; sovereign debt securities; bank debt securities.2. Comprises (as per the balance sheet) loans and advances to customers; own originated loans and advances to customers securitised.3. Comprises other securitised assets (as per the balance sheet), as well as interest income from derivative financial instruments where there is no
associated balance sheet value.4. Comprises (as per the balance sheet) deposits by banks; debt securities in issue; repurchase agreements and cash collateral on securities lent.5. Comprises (as per the balance sheet) liabilities arising on securitisation of own originated loans and advances.* Impacted by debt funding issued by the Investec Property Fund in which the group has a 24.3% (2020: 24.3%) interest. Excluding the debt funding cost,
the net interest margin amounted to 1.84% (2020: 2.06%).
03 Annual financial statements Investec Limitedgroup and company annual financial statements 2021
NOTES TO THE FINANCIAL STATEMENTSCONTINUED
51

2. Net interest income (continued)Company
2021 2020
For the year to 31 March Averagebalance
sheet valueInterestincome
Averageyield
Averagebalance
sheet valueInterestincome
AverageyieldR’million Notes
Cash, near cash and bank debt and sovereign debt securities 1 658 37 5.62% 369 45 12.20% Other 2 258 n/a 72 n/a
658 295 369 117
2021 2020
For the year to 31 MarchAveragebalance
sheet valueInterest
expenseAverage
yield
Averagebalance
sheet valueInterest
expenseAverage
yieldR’million Notes
Deposits by banks and other debt-related securities 3 319 (22) 6.89% 319 (15) 4.70% Subordinated liabilities 2 195 (150) 6.83% 2 024 (136) 6.72% Other 4 (305) n/a (51) n/a
2 514 (477) 2 343 (202) Net interest expense (182) (85) Net interest margin* 20.38% (6.97%)
We have changed our methodology for calculating net interest margin whereby this is now calculated using a straight-line 13 (full year) or seven point (half year) average rather than a straight-line two point average previously. Under the previous methodology the net interest margin for the year to 31 March 2021 would have been: 1.72% (2020^: 1.82%).1. Comprises (as per the balance sheet) cash and balances at central banks; loans and advances to banks; non-sovereign and non-bank cash placements;
reverse repurchase agreements and cash collateral on securities borrowed; sovereign debt securities; bank debt securities.2. Comprises loans to group companies, as well as interest income from derivative financial instruments where there is no associated balance sheet value. 3. Comprises (as per the balance sheet) deposits by banks; debt securities in issue; repurchase agreements and cash collateral on securities lent.4. Interest expense from loans from group companies which is included ‘other liabilities’ on the balance sheet.
3. Net fee and commission incomeGroup
For the year to 31 MarchR’million 2021 2020^
Wealth & Investment net fee and commission income 1 671 1 582 Fund management fees/fees for funds under management 935 845 Private client transactional fees 774 773 Fee and commission expense (38) (36) Specialist Banking net fee and commission income 2 886 3 138 Specialist Banking fee and commission income* 3 368 3 747 Specialist Banking fee and commission expense (482) (609) Group Investments net fee and commission income 967 1 365 Group Investments fee and commission income 1 050 1 449 Group Investments fee and commission expense (83) (84) Net fee and commission income 5 524 6 085
Annuity fees (net of fees payable) 4 490 4 930 Deal fees 1 034 1 155
^ Restated as detailed in note 58.* Included in Specialist Banking fee and commission income is fee income of R1.4 billion (2020: R1.7 billion) for operating lease income which is out of scope
of IFRS 15 Revenue from Contracts with Customers.
Trust and fiduciary fees amounted to R7.9 million (2020: R4.4 million) and is included in private client transactional fees in the group.
03 Annual financial statements Investec Limitedgroup and company annual financial statements 2021
NOTES TO THE FINANCIAL STATEMENTSCONTINUED
52

4. Investment income
For the year to 31 March Listed
equitiesUnlistedequities
Fair valueloan
investments
Warrantsand profit
sharesInvestment
portfolio
Debtsecurities
(sovereign,bank and
other)
Investmentand
tradingproperties
Otherasset
categories TotalR’million
The following table analyses investment income generated by the asset portfolio shown on the balance sheet:Group2021Realised 302 (44) — 51 309 63 26 342 740 Unrealised^ 116 (140) 381 — 357 (19) (990) (173) (825) Dividend income 197 97 — — 294 — — 1 295 Funding and other net related (costs)/income — (24) — — (24) — 98 — 74
615 (111) 381 51 936 44 (866) 170 284 2020Realised 27 112 — 162 301 110 (6) — 405 Unrealised^ (128) (205) 1 127 1 795 111 (879) (240) (213) Dividend income 186 232 — — 418 — — — 418 Funding and other net related (costs) — (36) — — (36) — (62) — (98)
85 103 1 127 163 1 478 221 (947) (240) 512 Company2021Realised 16 — — — 16 — — — 16 Unrealised^ (12) — — — (12) — — — (12) Dividend income* 22 — — — 22 — — 980 1 002
26 — — — 26 — — 980 1 006 2020Unrealised^ (4) — — — (4) — — — (4) Dividend income* 29 — — — 29 — — 3 127 3 156
25 — — — 25 — — 3 127 3 152
^ In a year of realisation, any prior period mark-to-market gains/(losses) recognised are reversed in the unrealised item.* In the company, dividend income from investments in subsidiaries is presented in “other asset categories”.
03 Annual financial statements Investec Limitedgroup and company annual financial statements 2021
NOTES TO THE FINANCIAL STATEMENTSCONTINUED
53

5. Other operating incomeGroup
For the year to 31 MarchR’million 2021 2020
Unrealised gains on other investments 149 5 149 5
6. Expected credit loss impairment chargesGroup
For the year to 31 March
2021 2020R’million
Expected credit loss impairment charges/(releases) is recognised on the following assets: Loans and advances to customers 510 1 015 Expected credit loss impairment charges (refer to note 28) 935 1 219 Post write-off recoveries (425) (204) Own originated securitised assets 9 6 Core loans 519 1 021 Other balance sheet assets 91 64 Off-balance sheet commitments and guarantees 11 24 Total expected credit loss impairment charges 621 1 109
03 Annual financial statements Investec Limitedgroup and company annual financial statements 2021
NOTES TO THE FINANCIAL STATEMENTSCONTINUED
54

7. Operating costsGroup Company
For the year to 31 March2021 2020 2021 2020R’million
Staff compensation costs 6 199 5 736 5 16 Salaries and wages (including directors’ remuneration*) 5 393 4 805 5 16 Share-based payments expense 436 555 — — Other 35 47 — — Pensions and provident fund contributions 335 329 — —
Training and other costs 150 234 — — Staff costs 6 349 5 970 5 16 Premises expenses 257 296 — — Premises expenses (excluding depreciation) 133 174 — — Premises depreciation 124 122# — Equipment expenses (excluding depreciation) 578 467 — — Business expenses** 770 940 6 2 Marketing expenses 317 423 — — Depreciation, amortisation and impairment on property, equipment, software and intangibles 186 211# — —
8 457 8 307 11 18 The following amounts were paid by the group to the auditors in respect of the audit of the financial statements and for other services provided to the group:Ernst & Young Inc. feesTotal fees paid to the audit firm by virtue of being the group's auditor 61 61 35 37
Audit of the group's accounts 41 42 35 36 Audit of the group's subsidiaries pursuant to legislation 18 17 — — Audit related assurance services 2 2 — 1
Total fees paid to the audit firm not in the capacity of being the group's auditor — 2 — — Audit related assurance services — 2 — — KPMG Inc. feesTotal fees paid to the audit firm by virtue of being the group's auditor 53 51 3 2
Audit of the group's accounts 45 40 3 2 Audit of the group's subsidiaries pursuant to legislation 8 6 — — Audit related to assurance services — 5 — —
Total fees paid to the audit firm not in the capacity of being the group's auditor 2 — — —
Audit related assurance services 1 — — — Tax compliance services 1 — — — Tax advisory services ^ — — —
Total 116 114 38 39
* Details of the directors’ emoluments, pensions and their interests are disclosed in the remuneration report in volume one of Investec group’s 2020 integrated.
** Business expenses mainly comprise insurance costs, consulting and professional fees, travel expenses and subscriptions.# Premises depreciation of R87 million was reclassified from depreciation, amortisation and impairment on property, equipment, software and intangibles to
premises depreciation.^ Less than R1 million
03 Annual financial statements Investec Limitedgroup and company annual financial statements 2021
NOTES TO THE FINANCIAL STATEMENTSCONTINUED
55

8. Share-based paymentsThe group operates share option and long-term share incentive plans for employees which are on an equity-settled basis.
The purpose of the staff share schemes is to promote an esprit de corps within the organisation, create an awareness of the Investec group's performance and provide an incentive to maximise individual and group performance by allowing all staff to share in the risks and rewards of the group.
Further information on the awards granted to directors, refer to volume one of the Investec group's 2021 integrated annual report.
Group
For the year to 31 March2021 2020
Details of awards outstanding during the yearOutstanding at the beginning of the year 19 835 140 22 701 506 Demerger — (594 600) Granted during the year 9 566 636 5 801 274 Exercised during the year^ (4 551 536) (7 170 887) Expired during the year (643 444) (902 153) Outstanding at the end of the year 24 206 796 19 835 140 Vested and exercisable at the end of the year 373 239 545 533
^ The weighted average share price during the year was R36.18 (2020: R56.00) and the weighted average exercise price during the year was Rnil (2020: Rnil).
As part of the demerger that took place in the prior year, employees of Investec Asset management left the employment of Investec on mutual agreement. This resulted in the acceleration of the share-based payment charge of R20.0 million on the date of the demerger in the prior year.
Group
For the year to 31 March 2021 2020
The exercise price range and weighted average remaining contractual life for the awards during the year were as follows:Long-term incentive options with no strike priceWeighted average remaining contractual life of outstanding awards 2.13 years 2.10 yearsWeighted average fair values of awards granted during the year R34.08 R88.00The fair value of share awards were calculated at market price. For awards during the year, the inputs were as follows:
Share price at date of grant R32.36 – R38.68 R88.00Exercise price Rnil Rnil
Option life 3.73 – 4.76 years 3.75 – 4.75 years
03 Annual financial statements Investec Limitedgroup and company annual financial statements 2021
NOTES TO THE FINANCIAL STATEMENTSCONTINUED
56

9. Long-term employee benefitsIn March 2020, as part of the IAM demerger, each participant of the Investec share option and long-term share incentive plans for employees, received the right to one Ninety One share award for every two Investec share awards they had. The Ninety One share awards were granted on the same terms and vesting period as the Investec awards they related to.
Investec has an obligation to deliver Ninety One shares to the holders of Investec share awards, accordingly this obligation was classified and measured as another long-term liability in terms of IAS 19 Employee Benefits (IAS 19). The initial liability of R156.2 million was calculated at the date of demerger for the portion of the awards already vested. The total value of the liability represented was accounted for in retained income. The liability was subsequently measured through profit or loss.
The IAS 19 long-term employment benefit liability movement recognised in the income statement for the year ended 31 March 2021 was a loss of R185.5 million (2020: gain of R5.8 million).
Group
For the year to 31 March 2021 2020
Details of awards outstanding during the yearOutstanding at the beginning of the year 9 923 339 — IAM Demerger – Ninety One Share awards issued 16 March 2020 — 10 212 742 Exercised during the year (2 233 363) (271 698) Lapsed during the year (244 395) (17 705) Outstanding at the end of the year 7 445 581 9 923 339 Exercisable at the end of the year 221 101 277 931
Group
For the year to 31 March 2021 2020
The exercise price range and weighted average remaining contractual life for options and shares outstanding were as follows:Long-term incentive options and long-term shares with no strike priceExercise price Rnil RnilWeighted average remaining contractual life 1.48 years 2.10 yearsThe fair value of the liability was calculated by using the Black-Scholes option pricing model.For the liability calculated the inputs into the model were as follows:Share price at 31 March R48.00 R30.55Exercise price Rnil RnilExpected volatility 35.35% 56.82% Option life 0 – 3.16 years 0.14 – 4.19
yearsExpected dividend yields 0% – 4.51% 0% – 6.28%Risk-free rate 3.32% – 5.97% 5.73% – 7.71%
The liability has been calculated at 31 March 2021 by using the listed market price as at 31 March 2021.
Management concluded that the share price used to calculate the liability as at the date of the demerger (13 March 2020) approximated the fair value of the share priced to be used to calculate the liability as at 31 March 2020. Management performed procedures to support this assumption.
03 Annual financial statements Investec Limitedgroup and company annual financial statements 2021
NOTES TO THE FINANCIAL STATEMENTSCONTINUED
57

10. TaxationGroup Company
For the year to 31 March
2021 2020 2021 2020R’million
Income statement tax chargeTaxation on incomeSouth Africa – Current taxation 1 420 1 228 (39) 46
in respect of the current year 1 420 1 384 (39) 46 in respect of prior year adjustments — (156) — –
– Deferred taxation (407) (233) 81 (106) Foreign taxation – Mauritius 23 33 — — Total taxation charge/(release) as per income statement 1 036 1 028 42 (60) Total taxation charge/(release) for the year comprises:Taxation on operating profit before acquired intangibles 1 050 1 042 42 (60) Taxation on acquired intangibles (14) (14) — —
1 036 1 028 42 (60) Tax rate reconciliation:Profit before taxation as per income statement 4 704 5 532 828 2 625 Total taxation charge as per income statement 1 036 1 028 42 (60) Effective rate of taxation 22.0% 18.6% 5.1% (2.3) %The standard rate of South African normal taxation has been affected by:Dividend income 6.8% 5.8% 32.6% 33.4% Qualifying distribution (3.1) % 7.1% — — Other Additional Tier 1 securities interest 0.3% 0.3% — — Foreign earnings* 1.9% 1.9% — — Prior year tax adjustments 0.9% 2.8% — — Release of provisions 4.8% — (5.1) % — Tax rate differential of profits of a capital nature 0.3% — — — Assessed losses (1.8) % (1.8) % — — Tax impact of equity accounted earnings of associate 0.5% 1.7% — — Impairment of associate (2.2) % (4.6) % — — Group restructures — (0.2) % — — Other non-taxable/non-deductible differences (2.4) % (3.6) % (4.6) % (3.1) %
28.0% 28.0% 28.0% 28.0%
* Includes the effect of cumulative tax losses and other permanent differences relating to foreign subsidiaries.
Group Company
For the year to 31 March2021 2020 2021 2020R’million
The deferred taxation charge/(credit) in the income statement arises from:
Income and expenditure accruals (358) (5) 60 (60) Expected credit loss impairment charges 25 (43) — — Unrealised fair value adjustments on financial instruments (29) (15) 21 (46) Losses carried forward (90) (86) — — Deferred taxation on acquired intangibles (15) (14) — — Revaluation of investment property 20 (38) — — Finance lease accounting 40 (32) — —
(407) (233) 81 (106)
03 Annual financial statements Investec Limitedgroup and company annual financial statements 2021
NOTES TO THE FINANCIAL STATEMENTSCONTINUED
58

10. Taxation (continued)Group Company
For the year to 31 March2021 2020 2021 2020R’million
Other comprehensive income taxation effectsFair value movements on cash flow hedges taken directly to other comprehensive income 11 (619) — — – Pre-taxation 41 (1 019) — — – Deferred taxation 151 137 — — – Current taxation (181) 263 — —
Fair value movements on debt instruments at FVOCI taken directly to other comprehensive income 2 051 (1 888) — — – Pre-taxation 2 843 (2 685) — — – Income taxation (792) 797 — —
Gain on realisation of debt instruments at FVOCI recycled through the income statement (33) (79) — — – Pre-taxation (46) (101) — — – Deferred taxation 13 22 — —
Fair value movements on equity instruments at FVOCI taken directly to other comprehensive income 885 138 56 (159) – Pre-taxation 1 141 201 72 (205) – Deferred taxation (256) (63) (16) 46
Net (losses)/gain attributable to own credit risk (14) 1 — — – Pre-taxation (18) 1 — — – Deferred taxation 4 — — —
03 Annual financial statements Investec Limitedgroup and company annual financial statements 2021
NOTES TO THE FINANCIAL STATEMENTSCONTINUED
59

11. Headline earningsGroup
R’millionYear to
31 March 2021Year to
31 March 2020
Continuing operationsContinuing earnings attributable to shareholders 3 859 3 246 Dividends paid to perpetual preference shareholders and other Additional Tier 1 security holders (416) (502) Gain on redemption of perpetual preference shares 71 — Continuing earnings attributable to ordinary shareholders 3 514 2 744 Headline adjustments 692 1 190 Revaluation of investment properties* 305 243 Headline adjustments of equity accounted associates 196 7 Impairment of goodwill 7 3 Impairment of associates and joint venture holdings 348 937 Loss attributable to other non-controlling interests relating to impairments in associates (189) — Other headline adjustments^ 25 — Continuing headline earnings attributable to ordinary shareholders 4 206 3 934
Discontinued operationsDiscontinued earnings attributable to ordinary shareholders — 6 464 Gain on partial disposal of subsidiary* — (6 089) Discontinued headline earnings attributable to ordinary shareholders — 375 Total groupEarnings attributable to shareholders 3 859 9 710 Dividends paid to perpetual preference shareholders and other Additional Tier 1 security holders (416) (502) Gain on redemption of perpetual preference shares 71 — Earnings attributable to ordinary shareholders 3 514 9 208 Headline adjustments 692 (4 899) Revaluation of investment properties* 305 243 Headline adjustments of equity accounted associates 196 7 Gain on partial disposal of subsidiary* — (6 089) Impairment of goodwill 7 3 Impairment of associates and joint venture holdings 348 937 Loss attributable to other non-controlling interests relating to impairments in associates (189) — Other headline adjustments^ 25 — Headline earnings attributable to ordinary shareholders 4 206 4 309
* These amounts are net of taxation of R89.6 million (2020: R52.6 million); with a (R775.7 million) [2020: (R339.8million)] impact on earnings attributable to non-controlling interests.
^ Predominantly relates to disposal of associate.
03 Annual financial statements Investec Limitedgroup and company annual financial statements 2021
NOTES TO THE FINANCIAL STATEMENTSCONTINUED
60

12. DividendsGroup Company
For the year to 31 March
2021 2020 2021 2020R'million
Ordinary dividendFinal dividend in prior year* — 1 323 — 1 333 Interim dividend for current year* 726 1 432 747 1 452 Total dividend attributable to ordinary shareholders recognised in current financial year 726 2 755 747 2 785
The directors have proposed a final ordinary dividend of 150 cents, resulting in a full year dividend of 262 cents per ordinary share (2020: 211 cents per ordinary share).
In light of regulatory guidance provided to banks in South Africa, the board had decided not to declare a final ordinary dividend for the year ended 31 March 2020. In the prior year, the group also successfully completed the demerger of its asset management business and distributed 55% of its shareholding in Ninety One to the value of R4.3 billion. This resulted in a distribution per ordinary share of 1 488 cents for the year ended 31 March 2020.Perpetual preference dividendFinal dividend in prior year 186 192 123 127 Interim dividend for current year 136 193 88 128 Total dividend attributable to perpetual preference shareholders recognised in current financial year 322 385 211 255
The directors have declared a final preference dividend in respect of the financial year ended 31 March 2021 of 271.44926 cents (2020:382.31605) per Investec Limited perpetual preference share and 290.85595 cents (2020: 409.64891 cents) per Investec Bank Limited perpetual preference share. The final preference dividend will be payable to shareholders on the register at the close of business on 11 June 2021.
Dividends attributable to other Additional Tier 1 securities in issue 94 117 85 104
The dividends paid on other Additional Tier 1 floating ratenotes pay dividends on a quarterly basis. Refer to note 48 for detail on rates.Total dividends declared to other equity holders including other Additional Tier 1 securities 416 502 296 359
* This includes the dividend paid by Investec Limited on DAS share equivalent for South African resident shareholders of Investec plc.
13. Operating lease disclosureGroup
For the year to 31 MarchR’million 2021 2020
Operating lease income recognised in income:Minimum lease payments 1 523 1 725
Group
For the year to 31 MarchR’million 2021 2020
Operating lease receivableFuture minimum lease payments under non-cancellable operating leases:Less than one year 1 455 1 420 One to five years 3 285 3 048 Later than five years 2 204 1 018
6 944 5 486
03 Annual financial statements Investec Limitedgroup and company annual financial statements 2021
NOTES TO THE FINANCIAL STATEMENTSCONTINUED
61

14. Analysis of income and impairments by category of financial instrument
At fair value through profit or loss
IFRS 9 mandatory
For the year to 31 MarchR’million Trading^ Non-trading^
Designated at inception
Group2021Interest income 345 857 1 204 Interest expense (199) — (738) Fee and commission income 243 1 — Fee and commission expense (15) — — Investment income 16 1 131 93 Share of post-taxation loss of associates and joint venture holdings — — — Trading income arising from– customer flow 820 (158) 36 – balance sheet management and other trading activities (397) 19 301 Other operating income — 140 — Total operating income before expected credit loss impairment charges 813 1 990 896 Expected credit loss impairments charges* — — (48) Operating income 813 1 990 848
2020**
Interest income 374 1 665 1 219 Interest expense (147) — (1 034) Fee and commission income 20 — — Fee and commission expense (1) — — Investment income — 1 336 263 Share of post-taxation profit of associates and joint venture holdings — — — Trading income arising from– customer flow 583 (15) — – balance sheet management and other trading activities 561 (18) (386) Other operating income — — — Total operating income before expected credit loss impairment charges 1 390 2 968 62 Expected credit loss impairments charges* — — (45) Operating income 1 390 2 968 17
* Includes off-balance sheet items.^ Fair value through profit and loss income statement items have been split as trading and non-trading, as defined by regulatory rules for the trading book
and banking book requirements respectively. Trading consists of positions held for trading intent or hedge elements of the trading book.
** Restated as detailed in note 58.
03 Annual financial statements Investec Limitedgroup and company annual financial statements 2021
NOTES TO THE FINANCIAL STATEMENTSCONTINUED
62

At fair value through comprehensive income
Debt instrumentswith a dual
businessmodel
Equity instruments
Amortisedcost
Non-financial instruments
Other fee income* Total
3 818 — 20 160 8 8 26 400 — — (17 438) 13 — (18 362) — — 2 060 1 427 2 396 6 127 (3) — (402) (84) (99) (603) 13 98 (191) (876) — 284 — — — (145) — (145)
— — 261 — — 959 — — (563) 19 — (621) — — 2 6 1 149 3 828 98 3 889 368 2 306 14 188 (24) — (538) — (11) (621) 3 804 98 3 351 368 2 295 13 567
4 621 — 27 792 1 7 35 679 — — (26 197) (16) — (27 394) — — 3 797 1 872 1 041 6 730 (4) — (487) (141) (12) (645) 103 5 (212) (950) (33) 512 — — — 311 — 311
— — (371) — — 197 — — 404 (17) — 544 — — — 5 — 5 4 720 5 4 726 1 065 1 003 15 939 (22) — (1 018) — (24) (1 109) 4 698 5 3 708 1 065 979 14 830
03 Annual financial statements Investec Limitedgroup and company annual financial statements 2021
NOTES TO THE FINANCIAL STATEMENTSCONTINUED
63

14. Analysis of income and impairments by category of financial instrument (continued)
At fair value through profit or loss
IFRS 9 mandatory
For the year to 31 MarchR’million Trading^ Non-trading^
Designated at inception
Company2021Interest income — — — Interest expense — — — Investment income — — 3 Trading income arising from– customer flow — — — – balance sheet management and other trading activities — — — Operating income/(expense) — — 3
2020Interest income — — — Interest expense — — — Investment income — — (3) Trading income arising from– balance sheet management and other trading activities — — — Operating income/(expense) — — (3)
* Includes off-balance sheet items.^ Fair value through profit and loss income statement items have been split as trading and non-trading, as defined by regulatory rules for the trading book
and banking book requirements respectively. Trading consists of positions held for trading intent or hedge elements of the trading book.
03 Annual financial statements Investec Limitedgroup and company annual financial statements 2021
NOTES TO THE FINANCIAL STATEMENTSCONTINUED
64

At fair value through
comprehensive income
Equity instruments
Amortisedcost
Non-financial instruments
Other fee income* Total
— 295 — — 295 — (477) — — (477) 23 — 980 — 1 006
— — — (4) (4) — — 19 — 19 23 (182) 999 (4) 839
— 117 — — 117 — (202) — — (202) 28 — 3 127 — 3 152
— — (19) — (19) 28 (85) 3 108 — 3 048
03 Annual financial statements Investec Limitedgroup and company annual financial statements 2021
NOTES TO THE FINANCIAL STATEMENTSCONTINUED
65
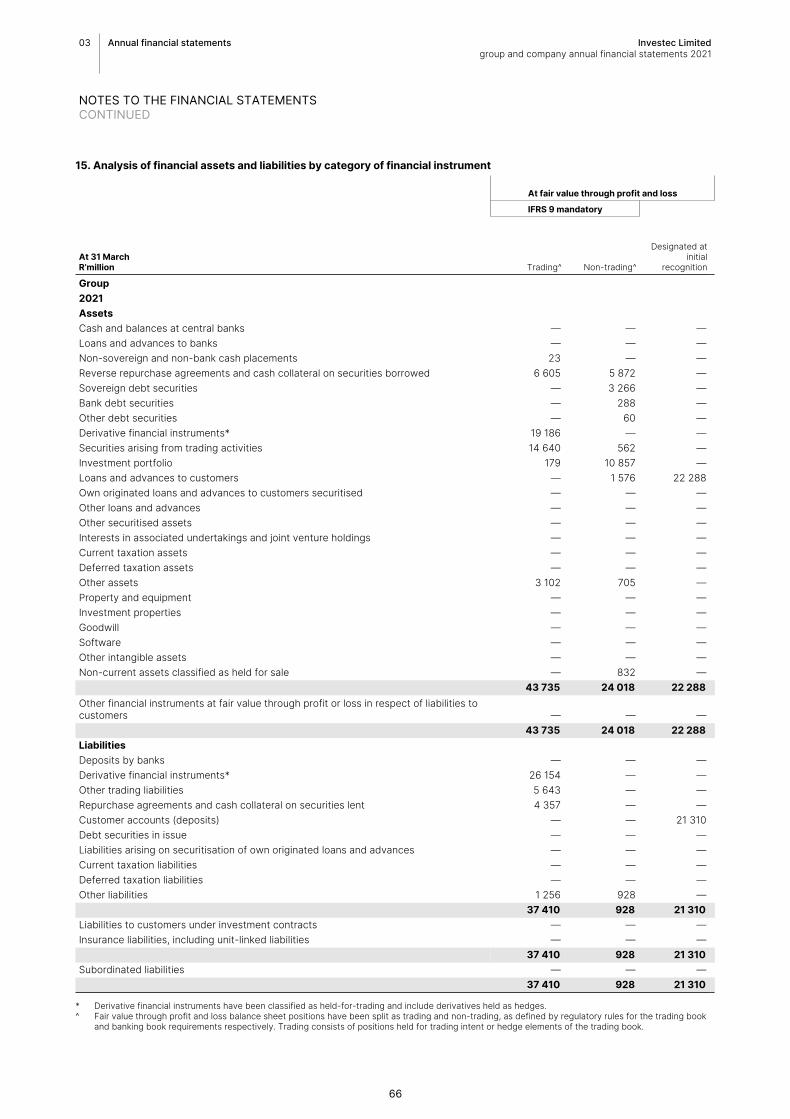
15. Analysis of financial assets and liabilities by category of financial instrument
At fair value through profit and loss
IFRS 9 mandatory
At 31 MarchR’million Trading^ Non-trading^
Designated at initial
recognition
Group2021AssetsCash and balances at central banks — — — Loans and advances to banks — — — Non-sovereign and non-bank cash placements 23 — — Reverse repurchase agreements and cash collateral on securities borrowed 6 605 5 872 — Sovereign debt securities — 3 266 — Bank debt securities — 288 — Other debt securities — 60 — Derivative financial instruments* 19 186 — — Securities arising from trading activities 14 640 562 — Investment portfolio 179 10 857 — Loans and advances to customers — 1 576 22 288 Own originated loans and advances to customers securitised — — — Other loans and advances — — — Other securitised assets — — — Interests in associated undertakings and joint venture holdings — — — Current taxation assets — — — Deferred taxation assets — — — Other assets 3 102 705 — Property and equipment — — — Investment properties — — — Goodwill — — — Software — — — Other intangible assets — — — Non-current assets classified as held for sale — 832 —
43 735 24 018 22 288 Other financial instruments at fair value through profit or loss in respect of liabilities to customers — — —
43 735 24 018 22 288 LiabilitiesDeposits by banks — — — Derivative financial instruments* 26 154 — — Other trading liabilities 5 643 — — Repurchase agreements and cash collateral on securities lent 4 357 — — Customer accounts (deposits) — — 21 310 Debt securities in issue — — — Liabilities arising on securitisation of own originated loans and advances — — — Current taxation liabilities — — — Deferred taxation liabilities — — — Other liabilities 1 256 928 —
37 410 928 21 310 Liabilities to customers under investment contracts — — — Insurance liabilities, including unit-linked liabilities — — —
37 410 928 21 310 Subordinated liabilities — — —
37 410 928 21 310
* Derivative financial instruments have been classified as held-for-trading and include derivatives held as hedges.^ Fair value through profit and loss balance sheet positions have been split as trading and non-trading, as defined by regulatory rules for the trading book
and banking book requirements respectively. Trading consists of positions held for trading intent or hedge elements of the trading book.
03 Annual financial statements Investec Limitedgroup and company annual financial statements 2021
NOTES TO THE FINANCIAL STATEMENTSCONTINUED
66

At fair value through other comprehensive income
Debt instruments with a dual business
modelEquity
instruments
Financial assets linked to
investment contract liabilities
Total instruments at
fair valueAmortised
cost
Non-financial instruments or
scoped out of IFRS 9 Total
— — — — 9 653 — 9 653 — — — — 26 983 — 26 983 — — — 23 8 933 — 8 956 — — — 12 477 18 279 — 30 756 40 612 — — 43 878 9 131 — 53 009 16 582 — — 16 870 4 992 — 21 862 8 633 — — 8 693 5 455 — 14 148 — — — 19 186 — — 19 186 — — — 15 202 — — 15 202 — 4 095 — 15 131 — — 15 131 — — — 23 864 255 267 — 279 131 — — — — 8 184 — 8 184 — — — — 181 — 181 — — — — 578 — 578 — — — — — 5 215 5 215 — — — — — 44 44 — — — — — 2 767 2 767 — — — 3 807 8 686 3 831 16 324 — — — — — 2 942 2 942 — — — — — 16 942 16 942 — — — — — 212 212 — — — — — 95 95 — — — — — 118 118 — — — 832 — 222 1 054 65 827 4 095 — 159 963 356 322 32 388 548 673
— — 1 067 1 067 — — 1 067 65 827 4 095 1 067 161 030 356 322 32 388 549 740
— — — — 22 052 — 22 052 — — — 26 154 — — 26 154 — — — 5 643 — — 5 643 — — — 4 357 13 241 — 17 598 — — — 21 310 352 918 — 374 228 — — — — 6 493 — 6 493 — — — — 3 271 — 3 271 — — — — — 854 854 — — — — — 743 743 — — — 2 184 9 195 5 185 16 564 — — — 59 648 407 170 6 782 473 600 — — 1 014 1 014 — — 1 014 — — 53 53 — — 53 — — 1 067 60 715 407 170 6 782 474 667 — — — — 14 445 — 14 445 — — 1 067 60 715 421 615 6 782 489 112
03 Annual financial statements Investec Limitedgroup and company annual financial statements 2021
NOTES TO THE FINANCIAL STATEMENTSCONTINUED
67

15. Analysis of financial assets and liabilities by category of financial instrument (continued)
At fair value through profit and loss
IFRS 9 mandatory
At 31 MarchR’million Trading^ Non-trading^
Designated at initial
recognition
Group2020**AssetsCash and balances at central banks — — — Loans and advances to banks — — — Non-sovereign and non-bank cash placements — 545 — Reverse repurchase agreements and cash collateral on securities borrowed 3 731 14 518 — Sovereign debt securities — 6 883 — Bank debt securities — 289 — Other debt securities — 3 736 — Derivative financial instruments* 17 431 — — Securities arising from trading activities 10 065 301 — Investment portfolio 141 13 464 — Loans and advances to customers — 2 384 20 702 Own originated loans and advances to customers securitised — — — Other loans and advances — — — Other securitised assets — — — Interests in associated undertakings and joint venture holdings — — — Current taxation assets — — — Deferred taxation assets — — — Other assets 2 039 17 — Property and equipment — — — Investment properties — — — Goodwill — — — Software — — Other intangible assets — — — Non-current assets classified as held for sale — — —
33 407 42 137 20 702 Other financial instruments at fair value through profit or loss in respect of liabilities to customers — — —
33 407 42 137 20 702 LiabilitiesDeposits by banks — — — Derivative financial instruments* 22 469 — — Other trading liabilities 8 660 — — Repurchase agreements and cash collateral on securities lent 3 175 — — Customer accounts (deposits) — — 44 601 Debt securities in issue — — — Liabilities arising on securitisation of own originated loans and advances — — — Current taxation liabilities — — — Deferred taxation liabilities — — — Other liabilities 924 13 —
35 228 13 44 601 Liabilities to customers under investment contracts — — — Insurance liabilities, including unit-linked liabilities — — —
35 228 13 44 601 Subordinated liabilities — — —
35 228 13 44 601
* Derivative financial instruments have been classified as held-for-trading and include derivatives held as hedges.^ Fair value through profit and loss balance sheet positions have been split as trading and non-trading, as defined by regulatory rules for the trading book
and banking book requirements respectively. Trading consists of positions held for trading intent or hedge elements of the trading book.** Restated as detailed in note 58.
03 Annual financial statements Investec Limitedgroup and company annual financial statements 2021
NOTES TO THE FINANCIAL STATEMENTSCONTINUED
68
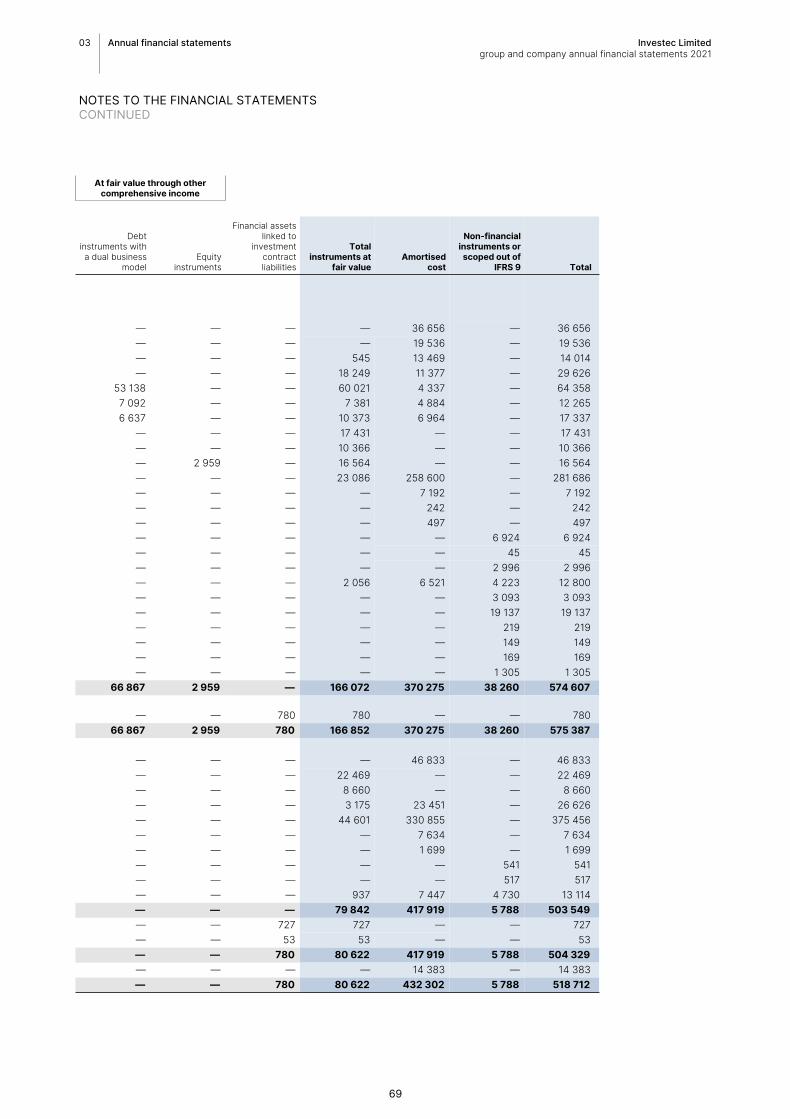
At fair value through other comprehensive income
Debt instruments with a dual business
modelEquity
instruments
Financial assets linked to
investment contract liabilities
Total instruments at
fair valueAmortised
cost
Non-financial instruments or
scoped out of IFRS 9 Total
— — — — 36 656 — 36 656 — — — — 19 536 — 19 536 — — — 545 13 469 — 14 014 — — — 18 249 11 377 — 29 626 53 138 — — 60 021 4 337 — 64 358 7 092 — — 7 381 4 884 — 12 265 6 637 — — 10 373 6 964 — 17 337 — — — 17 431 — — 17 431 — — — 10 366 — — 10 366 — 2 959 — 16 564 — — 16 564 — — — 23 086 258 600 — 281 686 — — — — 7 192 — 7 192 — — — — 242 — 242 — — — — 497 — 497 — — — — — 6 924 6 924 — — — — — 45 45 — — — — — 2 996 2 996 — — — 2 056 6 521 4 223 12 800 — — — — — 3 093 3 093 — — — — — 19 137 19 137 — — — — — 219 219 — — — — — 149 149 — — — — — 169 169 — — — — — 1 305 1 305 66 867 2 959 — 166 072 370 275 38 260 574 607
— — 780 780 — — 780 66 867 2 959 780 166 852 370 275 38 260 575 387
— — — — 46 833 — 46 833 — — — 22 469 — — 22 469 — — — 8 660 — — 8 660 — — — 3 175 23 451 — 26 626 — — — 44 601 330 855 — 375 456 — — — — 7 634 — 7 634 — — — — 1 699 — 1 699 — — — — — 541 541 — — — — — 517 517 — — — 937 7 447 4 730 13 114 — — — 79 842 417 919 5 788 503 549 — — 727 727 — — 727 — — 53 53 — — 53 — — 780 80 622 417 919 5 788 504 329 — — — — 14 383 — 14 383 — — 780 80 622 432 302 5 788 518 712
03 Annual financial statements Investec Limitedgroup and company annual financial statements 2021
NOTES TO THE FINANCIAL STATEMENTSCONTINUED
69

15. Analysis of financial assets and liabilities by category of financial instrument (continued)
At fair value through profit
and loss At fair value through other
comprehensive income
IFRS 9 mandatory
At 31 MarchR’million Non-trading^
Equity instruments
Total instruments at
fair valueAmortised
cost
Non-financial instruments or
scoped out of IFRS 9 Total
Company2021AssetsLoans and advances to banks — — — 20 — 20 Bank debt securities — — — 2 709 — 2 709 Investment portfolio — 190 190 — — 190 Deferred taxation assets — — — — 25 25 Other assets — — — 9 26 35 Investment in subsidiaries — — — 186 18 569 18 755
— 190 190 2 924 18 620 21 734 LiabilitiesDebt securities in issue — — — 319 — 319 Current taxation liabilities — — — — 11 11 Other liabilities — — — 1 325 512 1 837
— — — 1 644 523 2 167 Subordinated liabilities — — — 3 145 — 3 145
— — — 4 789 523 5 312 2020AssetsLoans and advances to banks — — — 20 — 20 Bank debt securities — — — 350 — 350 Investment portfolio 12 135 147 — — 147 Deferred taxation assets — — — — 106 106 Other assets — — — — 25 25 Investment in subsidiaries — — — 283 19 320 19 603
12 135 147 653 19 451 20 251 LiabilitiesDebt securities in issue — — — 319 — 319 Current taxation liabilities — — — — 53 53 Other liabilities — — — 1 023 508 1 531
— — — 1 342 561 1 903 Subordinated liabilities — — — 2 346 — 2 346
— — — 3 688 561 4 249
^ Fair value through profit and loss balance sheet positions have been split as trading and non-trading, as defined by regulatory rules for the trading book and banking book requirements respectively. Trading consists of positions held for trading intent or hedge elements of the trading book.
03 Annual financial statements Investec Limitedgroup and company annual financial statements 2021
NOTES TO THE FINANCIAL STATEMENTSCONTINUED
70

16. Financial instruments at fair valueThe table below analyses recurring fair value measurements for financial assets and financial liabilities. These fair value measurements are categorised into different levels in the fair value hierarchy based on the inputs to the valuation technique used.
The different levels are identified as follows:
Level 1 – quoted (unadjusted) prices in active markets for identical assets or liabilities.
Level 2 – inputs other than quoted prices included within level 1 that are observable for the asset or liability, either directly (i.e. as prices) or indirectly (i.e. derived from prices).
Level 3 – inputs for the asset or liability that are not based on observable market data (unobservable inputs).
Fair value category
At 31 MarchTotal
instrumentsat fair value Level 1 Level 2 Level 3R’million
Group2021AssetsNon-sovereign and non-bank cash placements 23 — 23 — Reverse repurchase agreements and cash collateral on securities borrowed 12 477 — 12 477 — Sovereign debt securities 43 878 43 878 — — Bank debt securities 16 870 8 197 8 673 — Other debt securities 8 693 1 393 7 300 — Derivative financial instruments 19 186 6 19 180 — Securities arising from trading activities 15 202 15 020 182 — Investment portfolio 15 131 4 501 31 10 599 Loans and advances to customers 23 864 — 23 829 35 Other assets 3 807 3 807 — — Non-current assets classified as held for sale 832 — — 832 Other financial instruments at fair value through profit or loss in respect of liabilities to customers 1 067 1 067 — —
161 030 77 869 71 695 11 466 LiabilitiesDerivative financial instruments 26 154 934 25 220 — Other trading liabilities 5 643 2 302 3 341 — Repurchase agreements and cash collateral on securities lent 4 357 — 4 357 — Customer accounts (deposits) 21 310 — 21 310 — Other liabilities 2 184 — 1 256 928 Liabilities to customers under investment contracts 1 014 — 1 014 — Insurance liabilities, including unit-linked liabilities 53 — 53 —
60 715 3 236 56 551 928 Net financial assets at fair value 100 315 74 633 15 144 10 538
03 Annual financial statements Investec Limitedgroup and company annual financial statements 2021
NOTES TO THE FINANCIAL STATEMENTSCONTINUED
71

16. Financial instruments at fair value (continued)Fair value category
At 31 March Totalinstrumentsat fair value Level 1 Level 2 Level 3R’million
Group2020AssetsNon-sovereign and non-bank cash placements 545 — 545 — Reverse repurchase agreements and cash collateral on securities borrowed 18 249 — 18 249 — Sovereign debt securities 60 021 60 021 – — Bank debt securities 7 381 5 543 1 838 — Other debt securities 10 373 5 869 4 504 — Derivative financial instruments 17 431 80 17 351 — Securities arising from trading activities 10 366 10 299 67 — Investment portfolio 16 564 5 309 87 11 168 Loans and advances to customers 23 086 — 22 326 760 Other assets 2 056 2 056 — — Other financial instruments at fair value through profit or loss in respect of liabilities to customers 780 780 — —
166 852 89 957 64 967 11 928 LiabilitiesDerivative financial instruments 22 469 — 22 469 — Other trading liabilities 8 660 4 189 4 471 — Repurchase agreements and cash collateral on securities lent 3 175 — 3 175 — Customer accounts (deposits) 44 601 — 44 601 — Other liabilities 937 — 924 13 Liabilities to customers under investment contracts 727 — 727 — Insurance liabilities, including unit-linked liabilities 53 — 53 —
80 622 4 189 76 420 13 Net financial assets/(liabilities) at fair value 86 230 85 768 (11 453) 11 915
Company2021AssetsInvestment portfolio 190 190 — —
190 190 — —
2020AssetsInvestment portfolio 147 147 — —
147 147 — —
Transfers between level 1 and level 2There were no significant transfers between level 1 and level 2 in the current and prior year.
03 Annual financial statements Investec Limitedgroup and company annual financial statements 2021
NOTES TO THE FINANCIAL STATEMENTSCONTINUED
72

16. Financial instruments at fair value (continued)Measurement of financial assets and liabilities at level 2 The table below sets out information about the valuation techniques used at the end of the reporting period when measuring financial instruments categorised as level 2 in the fair value hierarchy:
Valuation basis/techniques Main inputs
Assets
Non-sovereign and non-bank cash placements Discounted cash flow model Yield curve
Reverse repurchase agreements and cash collateral on securities borrowed
Discounted cash flow model Yield curve
Bank debt securities Discounted cash flow model Yield curve
Other debt securities Discounted cash flow model Yield curve
Derivative financial instruments Discounted cash flow model Black-Scholes
Yield curve Volatilities
Securities arising from trading activities Discounted cash flow model Yield curve
Investment portfolio Adjusted quoted price Liquidity adjustment
Loans and advances to customers Discounted cash flow model Yield curve
Liabilities
Derivative financial instruments Discounted cash flow model Black-Scholes
Yield curve Volatilities
Other trading liabilities Discounted cash flow model Yield curve
Repurchase agreements and cash collateral on securities lent Discounted cash flow model Yield curve
Customer accounts (deposits) Discounted cash flow model Yield curve
Other liabilities Discounted cash flow model Yield curve
Liabilities to customers under investment contracts Current price of underlying unitised assets
Listed prices
Insurance liabilities, including unit-linked liabilities Current price of underlying unitised assets
Listed prices
03 Annual financial statements Investec Limitedgroup and company annual financial statements 2021
NOTES TO THE FINANCIAL STATEMENTSCONTINUED
73

16. Financial instruments at fair value (continued)Level 3 instrumentsThe following tables show a reconciliation of the opening balances to the closing balances for level 3 financial instruments. All instruments are at fair value through profit or loss.
Group
R’millionInvestment
portfolio
Loans andadvances to
customersOther level 3
assets Total
AssetsBalance at 1 April 2019 6 702 760 115 7 577 Net gains/(losses) included in the income statement 270 (4) — 266 Purchases 6 097 6 — 6 103 Sales (2 741) — — (2 741) Settlements (389) (2) (115) (506) Transfers into level 3 246 — — 246 Foreign exchange adjustments 983 — — 983 Balance at 31 March 2020 11 168 760 — 11 928 Net losses included in the income statement (450) (17) — (467) Purchases 2 141 1 — 2 142 Sales (482) (11) — (493) Settlements (135) (698) — (833) Transfers to non-current assets classified as held for sale ^ (832) — 832 — Foreign exchange adjustments (811) — — (811) Balance at 31 March 2021 10 599 35 832 11 466
^ For the year to 31 March 2021, certain equity investments to the value of R832.4 million were transferred out of investment portfolio to non-current assets held for sale in anticipation of the sale to occur in the short term. These equity investments form part of the Group Investments and Corporate, Investment Banking and Other segments.
For the year ended 31 March 2021, there were no transfers into and out of level 3.
For the year ended 31 March 2020, R246.2 million of instruments transferred from level 2 into level 3 due to delisting.
R’million Other liabilities Total
LiabilitiesBalance at 1 April 2019 68 68 Purchases 11 11 Settlements (70) (70) Foreign exchange adjustments 4 4 Balance at 31 March 2020 13 13 Total losses included in the income statement 61 61 Issues 854 854 Balance at 31 March 2021 928 928
The group transfers between levels within the fair value hierarchy when the significance of the unobservable inputs change or if the valuation methods change.
03 Annual financial statements Investec Limitedgroup and company annual financial statements 2021
NOTES TO THE FINANCIAL STATEMENTSCONTINUED
74
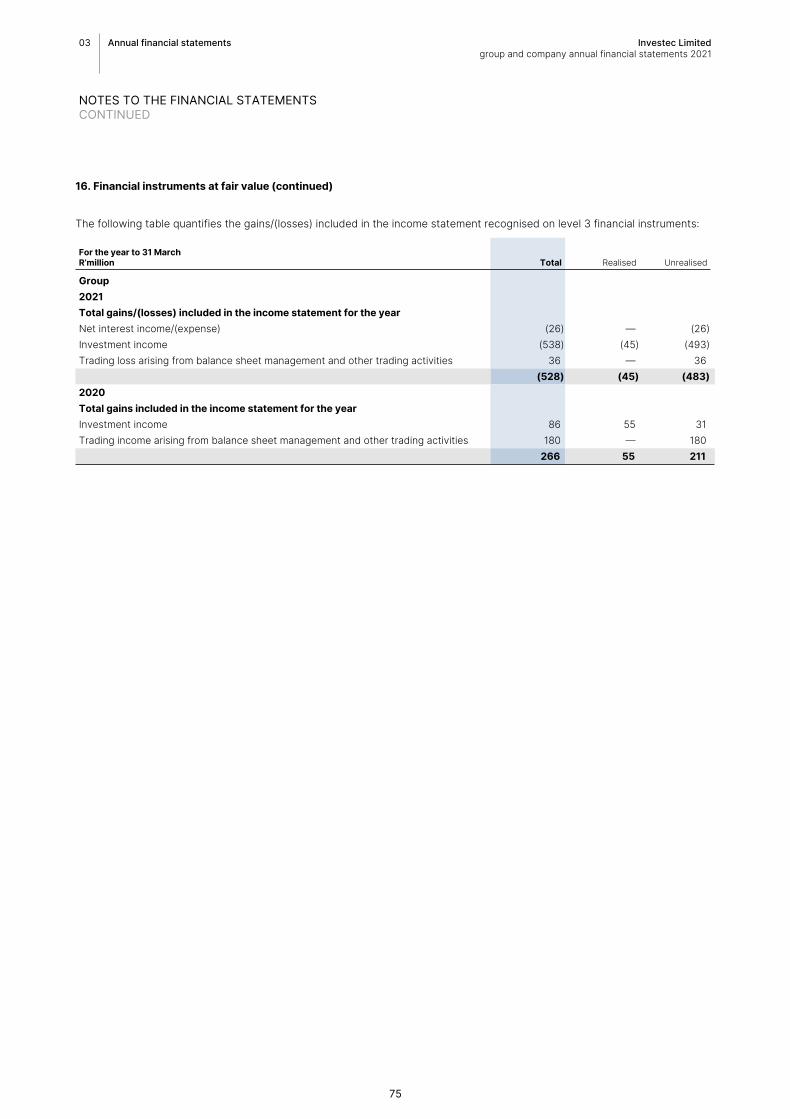
16. Financial instruments at fair value (continued)
The following table quantifies the gains/(losses) included in the income statement recognised on level 3 financial instruments:
For the year to 31 MarchR’million Total Realised Unrealised
Group2021Total gains/(losses) included in the income statement for the yearNet interest income/(expense) (26) — (26) Investment income (538) (45) (493) Trading loss arising from balance sheet management and other trading activities 36 — 36
(528) (45) (483) 2020Total gains included in the income statement for the yearInvestment income 86 55 31 Trading income arising from balance sheet management and other trading activities 180 — 180
266 55 211
03 Annual financial statements Investec Limitedgroup and company annual financial statements 2021
NOTES TO THE FINANCIAL STATEMENTSCONTINUED
75

16. Financial instruments at fair value (continued)Sensitivity of fair values to reasonably possible alternative assumptions by level 3 instrument type The fair value of financial instruments in level 3 are measured using valuation techniques that incorporate assumptions that are not evidenced by prices from observable market data. The following table shows the sensitivity of these fair values to reasonably possible alternative assumptions, determined at a transactional level:
Group
Potential impact on the income statement
At 31 March 2021
Level 3balance
sheet valueR’million
Valuation method
Significant unobservable
input changed
Range of unobservable
input used
FavourablechangesR’million
UnfavourablechangesR’million
Assets
Investment portfolio 10 599 1 393 (1 306) Price earnings
EBITDA * 616 (482)
Discounted cash flow
Discount rate 13% – 17% 7 (4)
Discounted cash flow
Cash flows ** 38 (28)
Net asset value
Underlying asset value
^ 42 (75)
Discounted cash flow
Precious and industrial metal prices
(5%) – 5%
27 (27) Discounted cash flow
Property prices
(10%) – 10% 655 (655)
Other Various ** 8 (35) Loans and advances to customers 35 Net asset
valueUnderlying asset value
^ 4 (4)
Non-current assets held for sale 832 49 (52) Discounted cash flow
Discount rate 13% – 15% 13 (16)
Discounted cash flow
Property prices
(10%) – 10% 36 (36)
Total level 3 assets 11 466 1 446 (1 362) LiabilitiesOther liabilities 928 Discounted
cash flow Property prices
(10%) – 10% 93 (93)
Total level 3 liabilities 928 93 (93) Net level 3 assets 10 538 1 539 (1 455)
* The EBITDA and cash flows have been stressed on an investment-by-investment basis in order to obtain favourable and unfavourable valuations.** The valuation sensitivity for the certain equity investments has been assessed by adjusting various inputs such as expected cash flows, discount rates
and earnings multiples rather than a single input. It is deemed appropriate to reflect the outcome on a portfolio basis for the purposes of this analysis as the sensitivity of the investments cannot be determined through the adjustment of a single input.
^ Underlying asset values are calculated by reference to a tangible asset.
03 Annual financial statements Investec Limitedgroup and company annual financial statements 2021
NOTES TO THE FINANCIAL STATEMENTSCONTINUED
76
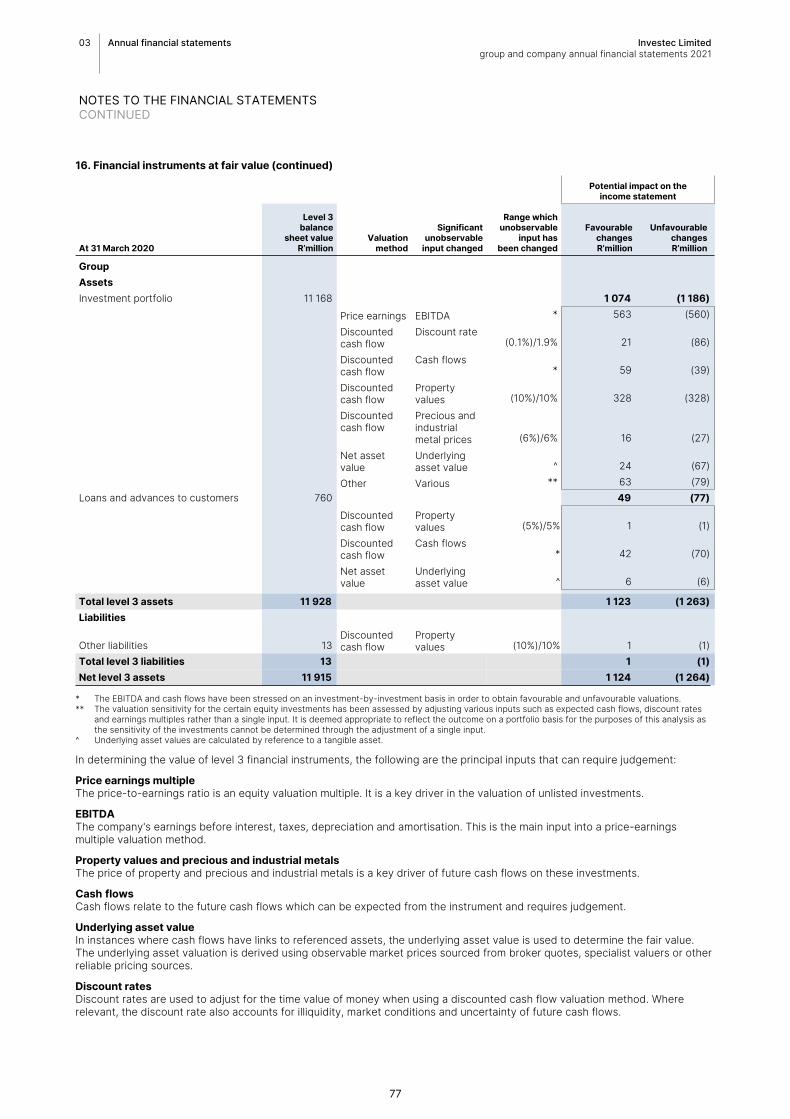
16. Financial instruments at fair value (continued)
Potential impact on the income statement
At 31 March 2020
Level 3balance
sheet valueR’million
Valuation method
Significant unobservable
input changed
Range whichunobservable
input hasbeen changed
FavourablechangesR’million
UnfavourablechangesR’million
GroupAssetsInvestment portfolio 11 168 1 074 (1 186)
Price earnings EBITDA * 563 (560) Discounted cash flow
Discount rate(0.1%)/1.9% 21 (86)
Discounted cash flow
Cash flows* 59 (39)
Discounted cash flow
Property values (10%)/10% 328 (328)
Discounted cash flow
Precious and industrial metal prices (6%)/6% 16 (27)
Net asset value
Underlying asset value ^ 24 (67)
Other Various ** 63 (79) Loans and advances to customers 760 49 (77)
Discounted cash flow
Property values (5%)/5% 1 (1)
Discounted cash flow
Cash flows* 42 (70)
Net asset value
Underlying asset value ^ 6 (6)
Total level 3 assets 11 928 1 123 (1 263) Liabilities
Other liabilities 13 Discounted cash flow
Property values (10%)/10% 1 (1)
Total level 3 liabilities 13 1 (1) Net level 3 assets 11 915 1 124 (1 264)
* The EBITDA and cash flows have been stressed on an investment-by-investment basis in order to obtain favourable and unfavourable valuations.** The valuation sensitivity for the certain equity investments has been assessed by adjusting various inputs such as expected cash flows, discount rates
and earnings multiples rather than a single input. It is deemed appropriate to reflect the outcome on a portfolio basis for the purposes of this analysis as the sensitivity of the investments cannot be determined through the adjustment of a single input.
^ Underlying asset values are calculated by reference to a tangible asset.
In determining the value of level 3 financial instruments, the following are the principal inputs that can require judgement:
Price earnings multipleThe price-to-earnings ratio is an equity valuation multiple. It is a key driver in the valuation of unlisted investments.
EBITDAThe company's earnings before interest, taxes, depreciation and amortisation. This is the main input into a price-earnings multiple valuation method.
Property values and precious and industrial metalsThe price of property and precious and industrial metals is a key driver of future cash flows on these investments.
Cash flowsCash flows relate to the future cash flows which can be expected from the instrument and requires judgement.
Underlying asset valueIn instances where cash flows have links to referenced assets, the underlying asset value is used to determine the fair value. The underlying asset valuation is derived using observable market prices sourced from broker quotes, specialist valuers or other reliable pricing sources.
Discount ratesDiscount rates are used to adjust for the time value of money when using a discounted cash flow valuation method. Where relevant, the discount rate also accounts for illiquidity, market conditions and uncertainty of future cash flows.
03 Annual financial statements Investec Limitedgroup and company annual financial statements 2021
NOTES TO THE FINANCIAL STATEMENTSCONTINUED
77

17. Fair value of financial instruments at amortised cost
At 31 MarchR’million
Carrying amount
Fair value approximates
carrying amount
Balances where fair
values do not approximate
carrying amounts
Fair value of balances
that does not approximate
carrying amounts Level 1 Level 2 Level 3
Group2021AssetsCash and balances at central banks 9 653 9 653 — — — — — Loans and advances to banks 26 983 26 983 — — — — — Non-sovereign and non-bank cash placements 8 933 8 933 — — — — — Reverse repurchase agreements and cash collateral on securities borrowed 18 279 1 641 16 638 16 635 — 16 635 — Sovereign debt securities 9 131 — 9 131 9 299 9 299 — — Bank debt securities 4 992 1 713 3 279 3 469 3 469 — — Other debt securities 5 455 4 511 944 987 987 — — Loans and advances to customers 255 267 242 224 13 043 13 101 — — 13 101 Own originated loans and advances to customers securitised 8 184 8 184 — — — — — Other loans and advances 181 181 — — — — — Other securitised assets 578 578 — — — — — Other assets 8 686 8 686 — — — — —
356 322 313 287 43 035 43 491 13 755 16 635 13 101
LiabilitiesDeposits by banks 22 052 5 210 16 842 17 053 — 17 053 — Repurchase agreements and cash collateral on securities lent 13 241 1 006 12 235 12 281 — 12 281 — Customer accounts (deposits) 352 918 233 198 119 720 120 098 — 120 098 — Debt securities in issue 6 493 5 146 1 347 1 366 — 1 366 — Liabilities arising on securitisation of own originated loans and advances 3 271 3 271 — — — — — Other liabilities 9 195 9 195 — — — — — Subordinated liabilities 14 445 3 145 11 300 13 291 13 291 — —
421 615 260 171 161 444 164 089 13 291 150 798 —
03 Annual financial statements Investec Limitedgroup and company annual financial statements 2021
NOTES TO THE FINANCIAL STATEMENTSCONTINUED
78

17. Fair value of financial instruments at amortised cost (continued)
At 31 MarchR’million
Carrying amount
Fair value approximates
carrying amount
Balances where fair
values do not approximate
carrying amounts
Fair value of balances
that does not approximate
carrying amounts Level 1 Level 2 Level 3
2020AssetsCash and balances at central banks 36 656 36 656 — — — — — Loans and advances to banks 19 536 19 536 — — — — — Non-sovereign and non-bank cash placements 13 469 13 469 — — — — — Reverse repurchase agreements and cash collateral on securities borrowed 11 377 4 539 6 838 6 836 — 6 836 — Sovereign debt securities 4 337 — 4 337 5 077 5 077 — — Bank debt securities 4 884 2 070 2 814 2 713 2 713 — — Other debt securities 6 964 4 280 2 684 1 984 1 984 — — Loans and advances to customers 258 600 242 828 15 772 15 804 — — 15 804 Own originated loans and advances to customers securitised 7 192 7 192 — — — — — Other loans and advances 242 242 — — — — — Other securitised assets 497 497 — — — — — Other assets 6 521 6 521 — — — — —
370 275 337 830 32 445 32 414 9 774 6 836 15 804
LiabilitiesDeposits by banks 46 833 9 954 36 879 37 370 — 37 370 — Repurchase agreements and cash collateral on securities lent 23 451 — 23 451 23 281 — 23 281 — Customer accounts (deposits) 330 855 148 835 182 020 182 600 — 182 600 —
Debt securities in issue 7 634 5 748 1 886 1 921 — 1 921 — Liabilities arising on securitisation of own originated loans and advances 1 699 1 699 — — — — — Other liabilities 7 447 7 447 — — — — — Subordinated liabilities 14 383 2 346 12 037 13 455 13 455 — —
432 302 176 029 256 273 258 627 13 455 245 172 —
03 Annual financial statements Investec Limitedgroup and company annual financial statements 2021
NOTES TO THE FINANCIAL STATEMENTSCONTINUED
79

17. Fair value of financial instruments at amortised cost (continued)
At 31 MarchR’million
Carrying amount
Fair value approximates
carrying amount
Balances where fair
values do not approximate
carrying amounts
Fair value of balances
that does not approximate
carrying amounts Level 1 Level 2 Level 3
Company2021AssetsLoans and advances to banks 20 20 — — — — — Bank debt securities 2 709 2 709 — — — — — Other assets 9 9 — — — — — Investment in subsidiaries 186 186 — — — — —
2 924 2 924 — — — — — LiabilitiesDebt securities in issue 319 319 — — — — — Other liabilities 1 325 1 325 — — — — — Subordinated liabilities 3 145 3 145 — — — — —
4 789 4 789 — — — — — 2020AssetsLoans and advances to banks 20 20 — — — — — Bank debt securities 350 350 — — — — — Investment in subsidiaries 283 283 — — — — —
653 653 — — — — — LiabilitiesDebt securities in issue 319 319 — — — — — Other liabilities 1 023 1 023 — — — — — Subordinated liabilities 2 346 2 346 — — — — —
3 688 3 688 — — — — —
This note has been restated to separately present those items where fair value approximates the carrying value. For items where fair values do not approximate to carrying value, fair value disclosures are presented above.
For financial assets and financial liabilities that are liquid or have a short-term maturity (less than three months) it is assumed that the carrying amounts approximate their fair value. This includes demand deposits, savings accounts without a specific maturity which are included in customer accounts (deposits) and variable rate instruments.
03 Annual financial statements Investec Limitedgroup and company annual financial statements 2021
NOTES TO THE FINANCIAL STATEMENTSCONTINUED
80

17. Fair value of financial instruments at amortised cost (continued)Financial instruments for which fair value does not approximate carrying valueDifferences in amortised cost and fair value occur in fixed rate instruments. The fair value of fixed-rate financial assets and financial liabilities carried at amortised cost are estimated by comparing spreads earned on the transactions with spreads earned on similar new transactions entered into by the group. The estimated fair value of fixed interest-bearing deposits is based on discounted cash flows, using prevailing money market interest rates for debt instruments with similar credit risk and maturity. For quoted sub-debt issued, the fair values are calculated based on quoted market prices. For those notes issued where quoted market prices are not available, a discounted cash flow model is used based on a current interest rate yield curve appropriate for the remaining term to maturity.
The table below sets out information about the valuation techniques used at the end of the reporting period in measuring level 2 and level 3 financial instruments not held at fair value:
Valuation basis/techniques Main inputs
AssetsReverse repurchase agreements and cash collateral on securities borrowed
Discounted cash flow model Yield curve
Bank debt securities Discounted cash flow model Yield curve
Other debt securities Discounted cash flow model Yield curve
Loans and advances to customers Discounted cash flow model Yield curve, credit spread
Liabilities Deposits by banks Discounted cash flow model Yield curve
Repurchase agreements and cash collateral on securities lent Discounted cash flow model Yield curve
Customer accounts (deposits) Discounted cash flow model Yield curve
Debt securities in issue Discounted cash flow model Yield curve
18. Financial instruments designated at fair value
Fair value adjustmentChange in fair value
attributable to credit risk
At 31 March R'million
Carryingvalue Current Cumulative Current Cumulative
Maximum exposure to
creditrisk
GroupAssets2021Loans and advances to customers 22 288 30 707 (47) (114) 21 581
22 288 30 707 (47) (114) 21 581 2020Loans and advances to customers 20 702 (583) 677 (40) (67) 20 024
20 702 (583) 677 (40) (67) 20 024
Fair value adjustment
At 31 March R'million
Carryingvalue
Remaining contractual
amount to be repaid at maturity Current Cumulative
GroupLiabilities2021Customer accounts (deposits) 21 310 20 412 207 231
21 310 20 412 207 231 2020Customer accounts (deposits) 44 601 43 929 130 527
44 601 43 929 130 527
Changes in fair value due to credit risk are determined as the change in the fair value of the financial instrument that is not attributable to changes in other market inputs.
Current and cumulative changes in fair value of financial liabilities attributable to credit risk were R18.7 million (2020: R1.7 million) and R16.0 million (2020: R34.7 million) respectively.
03 Annual financial statements Investec Limitedgroup and company annual financial statements 2021
NOTES TO THE FINANCIAL STATEMENTSCONTINUED
81

19. Cash and balances at central banks Group
At 31 MarchR'million 2021 2020
Gross cash and balances at central banks 9 653 36 657 Expected credit loss on amortised cost — (1) Net cash and balances at central banks 9 653 36 656
The country risk of cash and balances at central banks lies in the following geographies:South Africa 9 352 36 374 Africa (excluding RSA) 301 282
9 653 36 656
20. Loans and advances to banksGroup Company
At 31 MarchR'million 2021 2020 2021 2020
Gross loans and advances to banks 26 986 19 540 20 20 Expected credit loss on amortised cost (3) (4) — — Net loans and advances to banks 26 983 19 536 20 20 South Africa 10 801 6 242 20 20United Kingdom 1 188 5 659 — — Europe (excluding UK) 9 723 3 785 — — North America 3 039 1 046 — — Africa (excluding RSA) 1 316 2 163 — — Asia 744 551 — — Australia 172 84 — — Other — 6 — —
26 983 19 536 20 20
03 Annual financial statements Investec Limitedgroup and company annual financial statements 2021
NOTES TO THE FINANCIAL STATEMENTSCONTINUED
82

21. Reverse repurchase agreements and cash collateral on securities borrowed and repurchase agreements and cash collateral on securities lent
Group
At 31 MarchR'million 2021 2020
AssetsGross reverse repurchase agreements and cash collateral on securities borrowed 30 757 29 627 Expected credit loss on amortised cost (1) (1) Net reverse repurchase agreements and cash collateral onsecurities borrowed 30 756 29 626 Reverse repurchase agreements 27 222 24 316 Cash collateral on securities borrowed 3 534 5 310
30 756 29 626
As part of the reverse repurchase and securities borrowing agreements the group and company have received securities that they are allowed to sell or repledge. R52.2 billion (2020: R1.6 billion) has been resold or repledged to third parties in connection with financing activities or to comply with commitments under short sale transactions.LiabilitiesRepurchase agreements 16 593 26 626 Cash collateral on securities lent 1 005 —
17 598 26 626
The assets transferred and not derecognised in the above repurchase agreements are fair valued at R18.4 billion (2020: R27.9 billion). They are pledged as security for the term of the underlying repurchase agreement. Refer to note 53.
22. Sovereign debt securitiesGroup
At 31 MarchR'million 2021 2020
Gross sovereign debt securities 53 014 64 362 Expected credit loss on amortised cost (5) (4) Net sovereign debt securities 53 009 64 358 Bonds 34 411 30 596 Government securities 1 894 1 841 Treasury bills 16 704 31 921
53 009 64 358 The country risk of the sovereign debt securities lies in the following geographies:South Africa 51 995 64 154 North America 738 — Africa (excluding RSA) 276 204
53 009 64 358
03 Annual financial statements Investec Limitedgroup and company annual financial statements 2021
NOTES TO THE FINANCIAL STATEMENTSCONTINUED
83

23. Bank debt securitiesGroup Company
At 31 MarchR'million 2021 2020 2021 2020
Gross bank debt securities 21 865 12 269 2 709 350 Expected credit loss on amortised cost (3) (4) — — Net bank debt securities 21 862 12 265 2 709 350 Bonds 15 469 9 826 2 709 350 Floating rate notes 6 393 1 790 — — Asset-based securities — 649 — —
21 862 12 265 2 709 350 The country risk of the bank debt securities lies in the following geographies:South Africa 5 978 6 793 2 709 350 United Kingdom 5 607 2 156 — — Europe (excluding UK) 5 001 1 595 — — North America 1 510 350 — — Africa (excluding RSA) 280 308 — — Asia 2 420 — — — Australia 1 066 1 063 — —
21 862 12 265 2 709 350
24. Other debt securitiesGroup
At 31 MarchR'million 2021 2020
Gross other debt securities 14 156 17 348 Expected credit loss on amortised cost (8) (11) Net other debt securities 14 148 17 337 Bonds 8 283 11 596 Floating rate notes 3 360 4 002 Asset-based securities 2 505 1 739
14 148 17 337 The country risk of the other debt securities lies in the following geographies:South Africa 7 682 9 868 United Kingdom 3 846 2 716 Europe (excluding UK) 730 3 806 North America 1 890 947
14 148 17 337
03 Annual financial statements Investec Limitedgroup and company annual financial statements 2021
NOTES TO THE FINANCIAL STATEMENTSCONTINUED
84

25. Derivative financial instrumentsThe group enters into various contracts for derivatives both as principal for trading purposes and as customer for hedging foreign exchange and interest rate exposures. These include financial futures, options, swaps and forward rate agreements. The risks associated with derivative instruments are monitored in the same manner as for the underlying instruments. Risks are also measured across the product range in order to take into account possible correlations.
In the tables that follow notional principal amounts indicate the volume of business outstanding at the balance sheet date and do not represent amounts at risk. The fair value of a derivative financial instrument represents the present value of positive or negative cash flows which would have occurred had the rights and obligations arising from that instrument been closed out by the group in an orderly market transaction at balance sheet date.
2021 2020
At 31 MarchR’million
Notionalprincipalamounts
Positivefair value
Negativefair value
Notionalprincipalamounts
Positive fairvalue
Negative fairvalue
GroupForeign exchange derivativesForward foreign exchange contracts 14 068 497 281 14 635 638 1 262 Currency swaps 260 141 7 801 8 879 160 021 6 237 12 357 OTC options bought and sold 42 215 700 1 069 64 093 1 567 1 374 Other foreign exchange contracts 4 207 60 12 4 069 10 11
320 631 9 058 10 241 242 818 8 452 15 004
Interest rate derivativesCaps and floors 14 385 37 39 5 337 46 65 Swaps 1 266 025 6 633 10 333 1 278 227 6 906 8 541 Forward rate agreements 543 252 256 347 21 211 1 274 1 425 OTC options bought and sold 1 266 17 3 487 ^ 4 Other interest rate contracts 2 372 103 35 6 387 923 6 OTC derivatives 1 827 300 7 046 10 757 1 311 649 9 149 10 041 Exchange traded futures 2 663 — — 1 073 80 —
1 829 963 7 046 10 757 1 312 722 9 229 10 041
Equity and stock index derivativesOTC options bought and sold 12 117 4 284 6 107 666 1 173 3 887 Equity swaps and forwards 10 861 301 9 303 2 482 1 170 7 388 OTC derivatives 22 978 4 585 15 410 3 148 2 343 11 275 Exchange traded futures 6 127 6 — 1 481 — — Exchange traded options — — — — — — Warrants — — — — — —
29 105 4 591 15 410 4 629 2 343 11 275 Commodity derivativesOTC options bought and sold — — — — — — Commodity swaps and forwards 16 701 23 947 125 863 895
16 701 23 947 125 863 895
Credit derivatives 9 673 73 56 11 784 90 144
Other derivatives* — — 45 —
Cash collateral (1 605) (11 257) (3 591) (14 890)
Derivatives per balance sheet 19 186 26 154 17 431 22 469
* Mainly includes profit shares received as part of lending transactions. ^ Less than R1 million.
03 Annual financial statements Investec Limitedgroup and company annual financial statements 2021
NOTES TO THE FINANCIAL STATEMENTSCONTINUED
85

26. Securities arising from trading activitiesGroup
At 31 MarchR'million 2021 2020
Bonds 336 452 Floating rate notes 970 786 Listed equities 13 881 9 090 Other investments 15 38
15 202 10 366
27. Investment portfolioGroup Company
At 31 MarchR'million 2021 2020 2021 2020
Listed equities^ 4 490 5 313 190 147 Unlisted equities* 3 210 3 807 — — Fair value loan investments 7 431 7 444 — —
15 131 16 564 190 147
* Unlisted equities include loan instruments that are convertible into equity.^ Included is an investment in Ninety One shares of R3.9 billion (2020: R2.8 billion) and an investment of R224.9 million (2020: R189.8 million) in a portfolio
of perpetual preference shares issued by South African listed banks which is measured at FVOCI. Dividends recognised on Ninety One shares were R76.7 million (2020: Rnil) and on the portfolio of preference shares were R22.1 million (2020: R13.9 million).
28. Loans and advances to customers and other loans and advancesGroup
At 31 MarchR'million 2021 2020
Gross loans and advances to customers at amortised cost 257 866 261 877 Gross loans and advances to customers designated at FVPL at inception^ 22 393 20 769 Gross loans and advances to customers subject to ECL 280 259 282 646 Expected credit loss on amortised cost (2 704) (3 344) Loans and advances to customers at fair value 1 576 2 384 Net loans and advances to customers 279 131 281 686 Gross other loans and advances 206 267 Expected credit loss of other loans and advances (25) (25) Net other loans and advances 181 242
^ These are fixed rate loans which have passed the solely payments of principal and interest test (SPPI) and are held in a business model to collect contractual cash flows but have been designated at FVPL to eliminate accounting mismatches (interest rate risk is being economically hedged). The underlying loans have been fair valued and management performs an ECL calculation in order to obtain a reasonable estimate of the credit risk component. The portfolio is managed on the same basis as gross core loans and advances measured at amortised cost.
For further analysis on loans and advances refer to pages 122 to 128.
Group
At 31 MarchR'million 2021 2020
Expected credit losses on loans and advances to customers at amortised costBalance at the beginning of the year 3 344 2 691 Charge to the income statement 935 1 219 Utilised (1 548) (689) Transfers — 93 Exchange adjustment (27) 30 Balance at the end of the year 2 704 3 344 Expected credit losses on other loans and advances at amortised costBalance at the beginning of the year 25 23 Charge to the income statement — 2 Balance at the end of the year 25 25
03 Annual financial statements Investec Limitedgroup and company annual financial statements 2021
NOTES TO THE FINANCIAL STATEMENTSCONTINUED
86

29. Securitised assets and liabilities arising on securitisationGroup
At 31 MarchR'million 2021 2020
Gross own originated loans and advances to customers securitised 8 209 7 208 Expected credit loss of own originated loans and advances to customers securitised (25) (16) Net own originated loans and advances to customers securitised 8 184 7 192 Other securitised assets are made up of the following categories of assets:Cash and cash equivalents 578 497 Total other securitised assets 578 497 The associated liabilities are recorded on balance sheet in the following line items:Liabilities arising on securitisation of own originated loans and advances 3 271 1 699 Expected credit losses on own originated loans and advances to customers securitised at amortised costBalance at the beginning of the year 16 10 Charge to the income statement 9 6 Balance at the end of the year 25 16
30. Interests in associated undertakings and joint venture holdingsGroup
At 31 MarchR'million 2021 2020
Analysis of the movement in interests in associated undertakings and joint venture holdings:At the beginning of the year 6 924 6 284 Acquisitions — 909 Disposals^ (738) —
Share of post-taxation (loss)/profit of associates and joint venture holdings (excluding recycling of foreign exchange losses) (46) 311 Net equity movements of interests in associated undertakings (406) (44) Dividends declared by associate (71) — Transfers between asset classes 7 385 Impairment of associates and joint venture holdings* (348) (937) Exchange adjustments (107) 16 At the end of the year 5 215 6 924
^ The proceeds related to the sale of UK Nestor, an associate of Investec Property Fund were received post 31 March 2021.* Of the R348 million (2020: R937 million) Impairment of associates and joint venture holdings, R250 million (2020: Rnil) relates to the impairment to the
transaction price for the sale of IPF’s investment in associate, UK Nestor and R98 million (2020: R937million) impairment to equity accounted value of the group’s investment in IEP.
03 Annual financial statements Investec Limitedgroup and company annual financial statements 2021
NOTES TO THE FINANCIAL STATEMENTSCONTINUED
87

30. Interests in associated undertakings and joint venture holdings (continued)
IEP Group Proprietary Limited UK Nestor #
2021 2020 2021 2020
Details of material associated companiesSummarised financial information (R’million):For the year to 31 MarchRevenue 13 410 13 708 255 — (Loss)/profit after taxation (26) 2 584 (266) — Total comprehensive (loss)/income (8) 1 774 (266) — At 31 MarchAssetsNon-current assets 19 513 20 558 — 6 528 Current assets 6 168 5 956 — 341 LiabilitiesNon-current liabilities 8 948 9 476 — 3 763 Current liabilities 2 997 2 580 — 160 Net asset value 13 736 14 458 — 2 946 Non-controlling interest 2 792 2 473 — — Shareholders' equity 10 944 11 985 — 2 946 Effective interest in issued share capital 47.4% 47.4% — 38.0%
Net asset value^ 5 117 5 611 — 1 119 Goodwill — — — 29 Carrying value of interest – equity method 5 117 5 611 — 1 148
^ The group's share of the net asset value of IEP is R5.2 billion (47.4% of R10.9 billion) [2020: R5.7 billion (47.4% R12.0 billion)] reduced by the portion of the impairment of IEP that exceeded the value of the goodwill.
# UK Nestor is an associate of Investec Property Fund that was disposed of during March 2021.
Income statement and other comprehensive income items are only shown for the period for which they are equity accounted.
Management critically evaluated the equity accounted value of the group’s investment in IEP and consequently recognised an impairment of R98 million (2020: R937 million) in total in the current year. Management of IEP identified indicators of impairment of investments in subsidiaries and recognised an impairment of R98 million. As a result of this impairment, Investec management performed an impairment test on the investment in IEP and did not recognise any additional impairment for the IEP investment. In the prior year, management of IEP identified indicators of impairment of two investments in associates and recognised an impairment of R221 million. Investec management performed an impairment test on the investment in IEP in the prior year and recognised an additional impairment of R716 million. The recoverable amount of the investment in IEP was determined to be the value-in-use of the investment. The value-in-use was determined by calculating the sum of the fair values of the underlying investments held by IEP. This was done by determining the best estimates of the cash flows to be generated from the ultimate realisation of the underlying investments taking into account management’s strategy with the investments, returns generated by the underlying investments, the nature of the assets and market considerations. This estimate was performed for each of the assets held by IEP, using valuation techniques and assumptions management believed to be most representative of the ultimate realisation of the investments.
03 Annual financial statements Investec Limitedgroup and company annual financial statements 2021
NOTES TO THE FINANCIAL STATEMENTSCONTINUED
88

31. Deferred taxationGroup Company
At 31 MarchR'million 2021 2020 2021 2020
Deferred taxation assets 2 767 2 996 25 106 Deferred taxation liabilities (743) (517) — — Net deferred taxation assets 2 024 2 479 25 106
The net deferred taxation assets arise from:Income and expenditure accruals 1 341 983 — 60 Expected credit loss on loans and advances to customers 400 425 — –Unrealised fair value adjustments on financial instruments (351) 632 25 46 Losses carried forward 427 337 — –Deferred taxation on acquired intangibles (32) (47) — –Revaluation of property (273) (253) — –Fair value movements on cash flow hedge 466 316 — –Finance lease accounting 46 86 — –Net deferred taxation assets 2 024 2 479 25 106
Reconciliation of net deferred taxation assets/(liabilities):At the beginning of the year 2 479 1 836 106 — Reversal to income statement – current year taxation 407 235 (81) 106 (Loss)/gain directly in other comprehensive income (862) 893 — — Disposals — (485) — — At the end of the year 2 024 2 479 25 106
Deferred taxation assets are recognised to the extent it is likely that profits will be available in future periods. The assessment of the likelihood of future profits is based on past performance and current projections.
32. Other assetsGroup Company
At 31 MarchR'million 2021 2020^ 2021 2020
Gross other assets 16 324 12 801 35 25 Expected credit loss on amortised cost — (1) — — Net other assets 16 324 12 800 35 25 Settlement debtors 6 439 4 368 — — Trading properties 1 101 701 — — Prepayments and accruals 736 505 — — Trading initial margin 3 065 1 786 — — Other investments 741 270 — — Commodities 581 1 782 — — Building renovations in progress** 588 204 — — Fee debtors 56 42 — — Other* 3 017 3 142 35 25
16 324 12 800 35 25
^ Restated as detailed in note 58.* Included in other is proceeds on disposal of interests in associated undertakings and joint venture holdings R713.0 million (2020 : Rnil).** Previously included in prepayments and accruals.
03 Annual financial statements Investec Limitedgroup and company annual financial statements 2021
NOTES TO THE FINANCIAL STATEMENTSCONTINUED
89

33. Property and equipment
At 31 MarchR'million
Freehold properties
Right-of-use assets*
Leasehold improvements
Furniture and vehicles Equipment Total
Group
2021CostAt the beginning of the year 2 866 184 66 224 1 018 4 358 Additions — 1 14 14 57 86 Disposals — (2) — (1) (4) (7) Write-offs^ — (3) — (36) (567) (606) At the end of the year 2 866 180 80 201 504 3 831 Accumulated depreciationAt the beginning of the year (199) (35) (59) (158) (814) (1 265) Disposals — 2 — 3 1 6
Depreciation charge for year (81) (39) (4) (9) (103) (236)
Write-offs^ — 3 — 36 567 606 At the end of the year (280) (69) (63) (128) (349) (889) Net carrying value 2 586 111 17 73 155 2 942 2020CostAt the beginning of the year 2 861 — 65 247 1 022 4 195 Additions 5 232 1 14 183 435 Disposals — — — (7) (20) (27) Demerger of asset management — (48) — (30) (167) (245) At the end of the year 2 866 184 66 224 1 018 4 358 Accumulated depreciationAt the beginning of the year (118) — (53) (158) (823) (1 152) Disposals — — — 4 14 18 Demerger of asset management — 11 — 14 121 146 Depreciation charge for year – continuing operations (81) (35) (6) (14) (102) (238) Depreciation charge for year – discontinued operations — (11) — (4) (24) (39) At the end of the year (199) (35) (59) (158) (814) (1 265) Net carrying value 2 667 149 7 66 204 3 093
* Right-of-use assets primarily comprises property leases under IFRS 16.^ Fully depreciated assets with a net book value of zero were written off during the year.
34. Investment propertiesGroup
At 31 MarchR'million 2021 2020
At the beginning of the year 19 137 18 425 Additions 161 1 711 Disposals (1 513) (239) Fair value movement (990) (628) Reclassifications* 147 (132) At the end of the year 16 942 19 137
* Reclassifications of R230.9 million from non-current assets classified as held for sale (2020: R1.3 billion to non-current assets classified as held for sale) and a reclassification of R84.4 million to trading properties (2020: R1.2 billion from trading properties) as there was a change in use of the property.
For total gains and losses on investment properties recognised in the income statement, refer to note 4.
Non-current assets held for sale comprises of R222.0 million (2020: R1.3 billion) of investment properties. These are excluded from the measurement scope of IFRS 5 – Non-Current Assets Held for Sale and Discontinued Operations and continue to be measured according to the fair value model. The majority of these properties are in the Group Investments business segment.
All investment properties are classified as level 3 in the fair value hierarchy.
03 Annual financial statements Investec Limitedgroup and company annual financial statements 2021
NOTES TO THE FINANCIAL STATEMENTSCONTINUED
90

34. Investment properties (continued)For all investment property that is measured at fair value, the current use of the property is considered the highest and best use. Properties are valued under the income capitalisation method and discounted cash flow method (DCF).
Under the income capitalisation method a property’s fair value is estimated based on the normalised net operating income generated by the property, which is divided by the capitalisation rate.
Under the DCF method a property’s fair value is estimated using explicit assumptions about the benefits and liabilities of ownership over the asset’s life including an exit or terminal value. This involves the projection of a series of cash flows and, to this, an appropriate market-derived discount rate is applied to establish the present value of the income stream.
Valuation techniques used to derive level 3 fair valuesThe significant unobservable inputs used to derive the fair value measurements are those relating to the valuation of underlying investment properties. The table below includes the following definitions and relationship between the unobservable inputs and fair value measurement:
Significant unobservable inputs DefinitionsExpected Rental Value (ERV) The rent at which space could be let in the market conditions prevailing at the date of valuation.
Capitalisation rate (cap rate) The rate of return that is expected to be generated on the real estate investment property.
Long-term vacancy rate The ERV of the expected long-term average structural vacant space divided by the ERV of the whole property. Long-term vacancy rate can also be determined based on the percentage of estimated vacant space divided by the total lettable area.
Level 3 valuations
At 31 March 2021Description
Average expected rental
value per R/m2Equivalent
yield range
Weighted average cap rate
Long-term vacancy
rates
Change in fair value from a
0.25bp increase/decrease
in cap rate R’million
Change in fair value from a
5% increase/decrease in
expected rental value
R’million
Across South African sectors 99.2 6.9% – 14.2% 8.9% 1.5% 428.1 751.0 SA Retail 119.0 7.3% – 11.6% 8.4% 1.4% 174.6 299.6 SA Industrial 54.8 6.9% – 14.2% 9.7% 1.3% 85.9 166.9 SA Office 157.7 7.1% – 14.1% 9.0% 1.9% 169.0 284.5
At 31 March 2020Description
Average expected rental value per R/m2
Equivalent yield range
Weighted average cap rate
Long-term vacancy
rates
Change in fair value from a
0.25bp increase/decrease
Change in fair value from a 5% increase/decrease in
expected rental value
R’million
Across South African sectors 105.1 6.7% – 14.1% 9.0% 1.1% 437.1 780.9 SA Retail 122.5 7.2% – 11.8% 8.4% 0.8% 166.6 296.8 SA Industrial 53.6 8.0% – 12.4% 9.5% 0.8% 94.9 173.6 SA Office 180.9 7.5% – 12.0% 9.4% 1.7 % 175.6 310.5
03 Annual financial statements Investec Limitedgroup and company annual financial statements 2021
NOTES TO THE FINANCIAL STATEMENTSCONTINUED
91
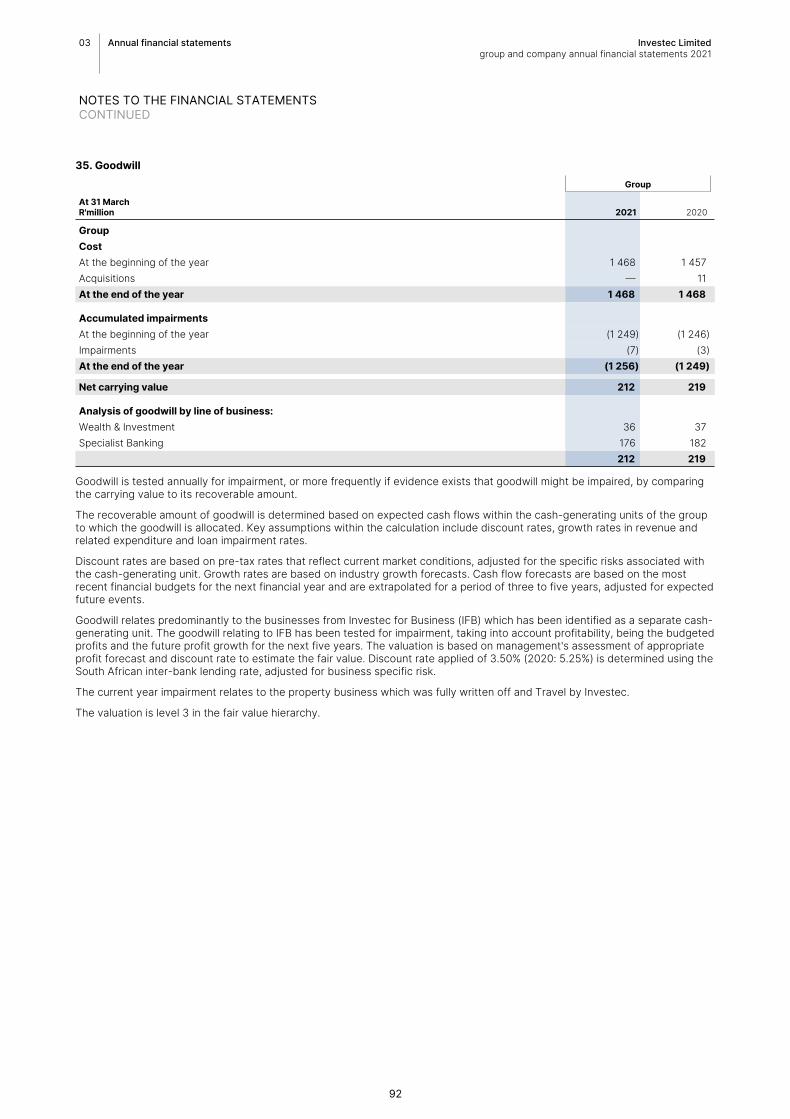
35. GoodwillGroup
At 31 MarchR'million 2021 2020
GroupCostAt the beginning of the year 1 468 1 457 Acquisitions — 11 At the end of the year 1 468 1 468
Accumulated impairmentsAt the beginning of the year (1 249) (1 246) Impairments (7) (3) At the end of the year (1 256) (1 249)
Net carrying value 212 219
Analysis of goodwill by line of business:Wealth & Investment 36 37 Specialist Banking 176 182
212 219
Goodwill is tested annually for impairment, or more frequently if evidence exists that goodwill might be impaired, by comparing the carrying value to its recoverable amount.
The recoverable amount of goodwill is determined based on expected cash flows within the cash-generating units of the group to which the goodwill is allocated. Key assumptions within the calculation include discount rates, growth rates in revenue and related expenditure and loan impairment rates.
Discount rates are based on pre-tax rates that reflect current market conditions, adjusted for the specific risks associated with the cash-generating unit. Growth rates are based on industry growth forecasts. Cash flow forecasts are based on the most recent financial budgets for the next financial year and are extrapolated for a period of three to five years, adjusted for expected future events.
Goodwill relates predominantly to the businesses from Investec for Business (IFB) which has been identified as a separate cash-generating unit. The goodwill relating to IFB has been tested for impairment, taking into account profitability, being the budgeted profits and the future profit growth for the next five years. The valuation is based on management's assessment of appropriate profit forecast and discount rate to estimate the fair value. Discount rate applied of 3.50% (2020: 5.25%) is determined using the South African inter-bank lending rate, adjusted for business specific risk.
The current year impairment relates to the property business which was fully written off and Travel by Investec.
The valuation is level 3 in the fair value hierarchy.
03 Annual financial statements Investec Limitedgroup and company annual financial statements 2021
NOTES TO THE FINANCIAL STATEMENTSCONTINUED
92

36. Software and other acquired intangible assetsSoftware Other acquired intangible assets
At 31 MarchR'million
Acquired software
Internally generated
software TotalClient
relationships Total Total
Group2021CostAt the beginning of the year 889 — 889 412 412 1 301 Additions 20 — 20 — — 20 Write-offs** (513) — (513) — — (513) At the end of the year 396 — 396 412 412 808 Accumulated amortisation and impairmentsAt the beginning of the year (740) — (740) (243) (243) (983) Amortisation (74) — (74) (51) * (51) (125) Write-offs** 513 — 513 — — 513 At the end of the year (301) — (301) (294) (294) (595) Net carrying value 95 — 95 118 118 213 2020^CostAt the beginning of the year 882 37 919 412 412 1 331 Additions 85 — 85 — — 85 Disposals (78) (37) (115) — — (115) At the end of the year 889 — 889 412 412 1 301 Accumulated amortisation and impairmentsAt the beginning of the year (698) (23) (721) (192) (192) (913) Disposals 53 23 76 — — 76 Amortisation (95) — (95) (51) * (51) (146) At the end of the year (740) — (740) (243) (243) (983) Net carrying value 149 — 149 169 169 318
^ Restated as detailed in note 58.* Amortisation of acquired intangibles is disclosed in the income statement.** Fully depreciated assets with a net book value of zero were written off during the year.
03 Annual financial statements Investec Limitedgroup and company annual financial statements 2021
NOTES TO THE FINANCIAL STATEMENTSCONTINUED
93

37. Discontinued operations and disposal groups held for sale
During the prior financial year on 13 March 2020, the group successfully completed the demerger of Ninety One (formerly known as Investec Asset Management), which became separately listed on 16 March 2020. The loss of control of Investec Asset Management was effected through the distribution of Ninety One shares to shareholders.
Group
Gain on loss of control of Ninety One R'million
The gains is calculated as follows:Fair value of the distributions 4 281 Investment in associate measured at fair value (including holdings by Investec staff share schemes) 2 872 Net asset value of Asset Management derecognised previously consolidated at 13 March 2020 (including Goodwill) (985) Non-controlling interest derecognised previously included in the consolidation of Asset Management at 13 March 2020 221 Foreign currency translation reserve recycled to the income statement at 13 March 2020 (3) Gain on the distribution of Ninety One shares (before tax) 6 386 Implementation costs (486) Gain on distribution of Ninety One shares (before tax) 5 900 Taxation on gain (297) Gain on distribution of Ninety One shares net of taxation and Implementation costs 5 603
Major classes of assets and liabilitiesInsurance related assets 161 113 Loans and advances to banks 1 200 Remaining assets (including goodwill) 1 115 Remaining liabilities (162 443)
985
Company
Gain on loss of control of Ninety One R'million
The gains is calculated as follows:Fair value of the distributions 4 750 Net asset value of Asset Management derecognised previously consolidated at 13 March 2020 (including Goodwill) (64) Investment in Ninety One in Investec Investments Proprietary Limited 2 404 Capital contribution to parent 7 090 Implementation costs (405) Capital contribution to parent after implementation costs 6 685
The table below present the income statement from discontinued operations (former Investec Asset Management business) for the year ended 31 March 2020.
R’millionYear to
31 March 2020
Net interest income 74 Fee and commission income 3 631 Fee and commission expense (95) Trading income arising from– balance sheet management and other trading liabilities (2) Other operating income 14 Operating income 3 622 Operating costs (2 143) Operating profit before goodwill, acquired intangibles, strategic actions and non-controlling interests 1 479 Profit attributable to non-controlling interests from discontinued operations (210) Operating profit 1 269 Gain on partial disposal of subsidiary and implementation costs 5 900 Profit before taxation 7 169 Taxation on operating profit before goodwill, acquired intangibles and strategic actions and acquired intangibles (395) Taxation on acquired intangibles and partial disposal of subsidiary (310) Earnings attributable to shareholders from discontinued operations 6 464
03 Annual financial statements Investec Limitedgroup and company annual financial statements 2021
NOTES TO THE FINANCIAL STATEMENTSCONTINUED
94

38. Investment in subsidiariesShares at book value Loan advances to subsidiaries
R'million R'million
At 31 March Principal activity Holding % 2021 2020 2021 2020
CompanyMaterial direct subsidiaries of Investec LimitedInvestec Bank Limited# Banking
institution 100 14 500 14 500 — — Investec Employee Benefits Holdings Proprietary Limited^#
Investment holding 100 626 669 — —
Investec International Holdings (Gibraltar) Limited§
Investment holding 100 218 218 — —
Investec Securities Proprietary Limited# Stockbroking 100 157 157 — — Fedsure International Limited# Investment
holding 100 316 316 — — Investec Property Group Holdings Proprietary Limited#
Investment holding 100 * * — —
Investec Markets Proprietary Limited#** Stockbroking 100 250 1 000 — — Investec Investments Proprietary Limited# Investment
holding 100 2 460 2 460 — — Other subsidiaries^ 42 — 186 283
18 569 19 320 186 283
* Less than R1 million.** A decision was taken to reduce the capital in Investec Markets Proprietary Limited during the year and as a result there was a share buyback of R750.0
million accounted for in loans to group companies.^ Impairments related to Investec Employee Benefits Holdings Proprietary Limited was allocated to the investment in the current year, this was previously
included in other subsidiaries.# South Africa.§ Gibraltar.
Investec Specialist Investments (RF) Limited is a direct subsidiary of Investec Limited and is in included in other subsidiaries.
Loans to/(from) subsidiaries are unsecured, interest bearing, with no fixed terms of repayment.
Indirect material subsidiaries of Investec Limited Principal activity Holding %
Investec Bank (Mauritius) Limited^ Banking institution 100.0
Investec Property Proprietary Limited# Property trading 100.0
Reichmans Holdings Proprietary Limited and Investec Import Solutions Proprietary Limited#
Trade and asset financing and import logistics
100.0
Investec Life Limited# Long-term Insurance 100.0
Investec Property Fund Limited# Engage in long-term immovable property investment 24.3
# South Africa^ Mauritius
Details of subsidiaries which are not material to the financial position of the group are not stated above.
The group considers that it has control over Investec Property Fund Limited as a result of the common directors with the holding company and the impact this has on the beneficial returns. Management considers this holding to currently be sufficient to meet the definition of control.
Investec Employee Benefit Holdings Proprietary Limited, including Investec Life Limited, and its subsidiaries are not consolidated for regulatory purposes:
There are no subsidiaries which are consolidated for regulatory, but not for accounting purposes.
Consolidated structured entitiesInvestec Limited has residual economic interests in the following structured entities which are consolidated. Typically a structured entity is an entity in which voting or similar rights are not the dominant factor in deciding control. The judgements to assess whether the group has control over these structures include assessing the purpose and design of the entity, considering whether the group or another involved party with power over the relevant activities is acting as a principal in its own right or as an agent on behalf of others.
03 Annual financial statements Investec Limitedgroup and company annual financial statements 2021
NOTES TO THE FINANCIAL STATEMENTSCONTINUED
95

38. Investment in subsidiaries (continued)
Name of principal structured entity Type of structured entity
Fox Street 1 (RF) Limited Securitised residential mortgages
Fox Street 2 (RF) Limited Securitised residential mortgages
Fox Street 3 (RF) Limited Securitised residential mortgages
Fox Street 4 (RF) Limited Securitised residential mortgages
Fox Street 5 (RF) Limited Securitised residential mortgages
Fox Street 6 (RF) Limited Securitised residential mortgages
Fox Street 7 (RF) Limited Securitised residential mortgages
Integer Home Loans Proprietary Limited Securitised third party originated residential mortgages
Grayston Drive Autos (RF) Limited Securitised vehicle instalment sale agreements
For additional detail on the assets and liabilities arising on securitisation refer to note 29. Further details of the risks to which the group is exposed through its all of its securitisations are included on page 140.
The key assumptions for the main types of structured entities which the group consolidates are summarised below:
Securitised residential mortgagesThe group has securitised residential mortgages in order to provide investors with exposure to residential mortgage risk and to raise funding. These structured entities are consolidated due to the group’s holdings of subordinated notes. The group is not required to fund any losses above those incurred on the notes it has retained, such losses are reflected in any impairment of securitised mortgages as those assets have not been derecognised.
Securitised third-party originated residential mortgagesThe group has a senior and subordinated investment in a third-party originated structured entity. This structured entity is consolidated due to the group’s exposure to residual economic benefits. The group is not required to fund any losses above those incurred on the investments made.
Securitised vehicle instalment sale agreementsThe group has securitised vehicle instalment sale agreements in order to provide investors with a return on investment on funding provided to Investec Bank Limited secured by, and exposed to, South African vehicle instalment sales agreements. The structured entity is consolidated due to the group's holdings of subordinated notes. The group is not required to fund any losses above those incurred on the notes it has retained, such losses are reflected in any impairment of instalment sale agreements as those assets have not been derecognised.
Interest in Wealth & Investment Funds Management has concluded that the investment funds in the Wealth & Investment business do not meet the definition of structured entities as the group does not hold material interests in these funds and currently does not provide financial support or other support. Support transactions with these funds are conventional customer-supply relationships.
39. Long-term assurance business attributable to policyholdersGroup
At 31 MarchR'million 2021 2020
Liabilities to customers under investment contractsInvestec Life Limited 1 014 727 Insurance liabilities, including unit-linked liabilities – Investec Life Limited 53 53
1 067 780 The assets of the long-term assurance fund attributable to policyholders are detailed below:Investments 1 067 780
1 067 780
Investments shown above comprise:Interest-bearing securities 235 241 Stocks, shares and unit trusts 811 539 Deposits 21 —
1 067 780
Assets related to the long-term assurance business attributable to policyholders are at fair value through profit and loss and are classified as level 1 in the fair value hierarchy.
03 Annual financial statements Investec Limitedgroup and company annual financial statements 2021
NOTES TO THE FINANCIAL STATEMENTSCONTINUED
96
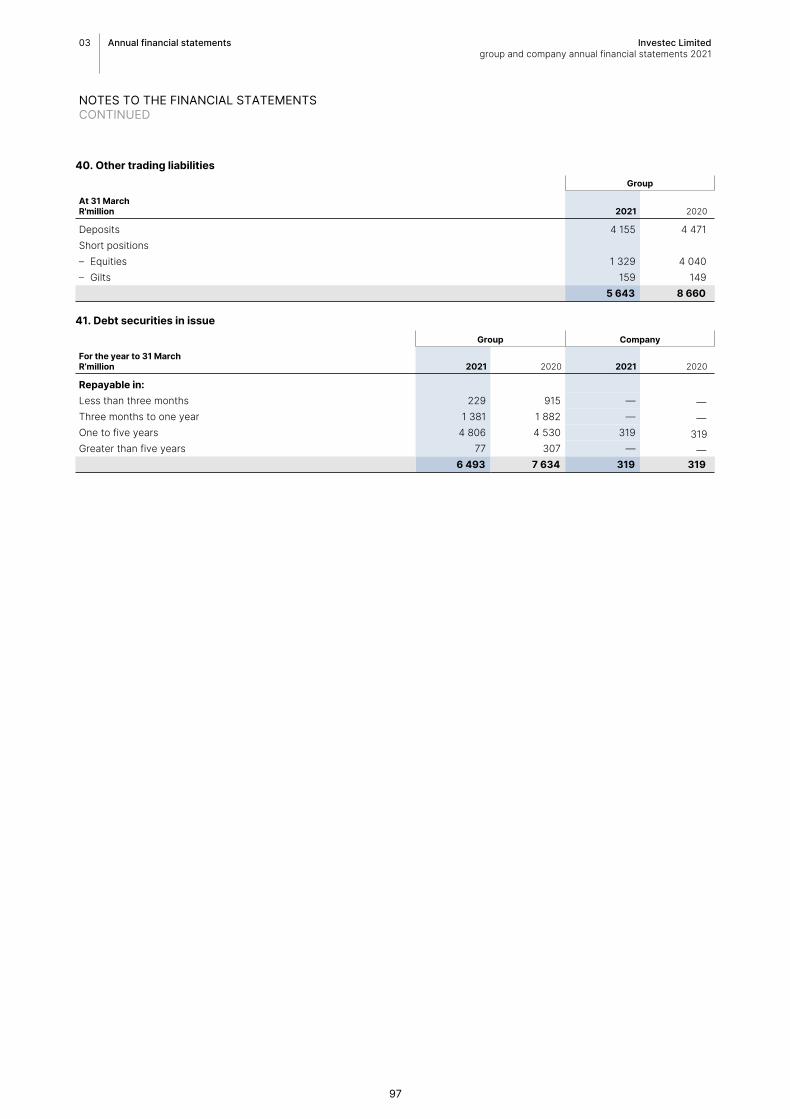
40. Other trading liabilitiesGroup
At 31 MarchR'million 2021 2020
Deposits 4 155 4 471 Short positions– Equities 1 329 4 040 – Gilts 159 149
5 643 8 660
41. Debt securities in issueGroup Company
For the year to 31 MarchR’million 2021 2020 2021 2020
Repayable in:Less than three months 229 915 — — Three months to one year 1 381 1 882 — — One to five years 4 806 4 530 319 319Greater than five years 77 307 — —
6 493 7 634 319 319
03 Annual financial statements Investec Limitedgroup and company annual financial statements 2021
NOTES TO THE FINANCIAL STATEMENTSCONTINUED
97

42. Other liabilitiesGroup Company
At 31 March
2021 2020 2021 2020R’million
Settlement liabilities 8 453 5 468 — 7 Other creditors and accruals 6 301 5 467 503 619 Other non-interest bearing liabilities 651 1 093 10 9 Loans from group companies^ — — 1 316 888 Rewards Programme liability 674 644 — — Lease liabilities 183 228 — — Long service employee benefits liability 228 150 8 8 Expected credit loss on off-balance sheet commitments and guarantees 74 64 — —
16 564 13 114 1 837 1 531
^ Previously included in 'other creditors and accruals'.
Reconciliation of lease liabilities
2021 2020
Balance at the beginning of the year 228 — Adoption of IFRS 16 — 239 Interest 16 19 Additional leases 1 82 Repayment of lease liabilities (51) (57) Modifications (2) (39) Exchange rate adjustment (9) (16) Balance at the end of the year 183 228
Group
Lease liabilities included in other liabilities due in:Group
Undiscountedpayments
Undiscounted payments Present value Present value
2021 2020 2021 2020
Less than one year 60 60 57 58 One to five years 124 170 104 142 Later than five years 37 47 22 28
221 277 183 228
03 Annual financial statements Investec Limitedgroup and company annual financial statements 2021
NOTES TO THE FINANCIAL STATEMENTSCONTINUED
98

43. Subordinated liabilitiesGroup Company
At 31 MarchR’million 2021 2020 2021 2020
Issued by Investec Bank LimitedIV019 indexed rate subordinated unsecured callable bonds 199 179 — — IV019A indexed rate subordinated unsecured callable bonds 377 374 — — IV033 variable rate subordinated unsecured callable bonds — 159 — — IV034 fixed rate subordinated unsecured callable bonds — 101 — — IV035 variable rate subordinated unsecured callable bonds 1 468 1 468 — — IV036 variable rate subordinated unsecured callable bonds 32 32 — — IV037 variable rate subordinated unsecured callable bonds 1 775 2 015 — — IV038 variable rate subordinated unsecured callable bonds 350 350 — — IV039 indexed rate subordinated unsecured callable bonds 196 187 — — IV040 variable rate subordinated unsecured callable bonds 589 589 — — IV041 fixed rate subordinated unsecured callable bonds 190 190 — — IV042 variable rate subordinated unsecured callable bonds 50 50 — — IV043 fixed rate subordinated unsecured callable bonds 150 150 — — IV044 variable rate subordinated unsecured callable bonds 240 240 — — IV045 indexed rate subordinated unsecured callable bonds 1 914 1 822 — — IV046 variable rate subordinated unsecured callable bonds 1 200 1 200 — — IV047 variable rate subordinated unsecured callable bonds 1 593 1 818 — — IV049 variable rate subordinated unsecured callable bonds 977 1 113 — — Issued by Investec LimitedINLV02 variable rate subordinated unsecured callable bonds — 276 — 276 INLV03 variable rate subordinated unsecured callable bonds — 94 — 94 INLV04 variable rate subordinated unsecured callable bonds — 255 — 255 INLV07 variable rate subordinated unsecured callable bonds 1 636 — 1 636 — INB001 variable rate subordinated unsecured callable bonds 1 509 1 721 1 509 1 721
14 445 14 383 3 145 2 346 Remaining maturity*:In one year or less, or on demand 5 486 260 — — In more than one year, but not more than two years 6 747 6 251 1 509 625 In more than two years, but not more than five years 2 212 7 872 1 636 1 721 In more than five years — — — —
14 445 14 383 3 145 2 346 Reconciliation from opening balance to closing balance:Opening balance 14 383 15 857 2 346 1 939 Issue of subordinated liabilities 1 636 — 1 636 — Interest accrued on subordinated liabilities 953 1 171 150 151
Interest and effective interest rate adjustments capitalised to subordinated liabilities (423) (371) (96) (81) Repayment of interest (553) (784) (49) (70) Transfer of interest accrued to other liabilities at the end of the year 96 85 7 12
Transfer of interest accrued to other liabilities from the beginning of the year (73) (101) (12) (12) Redemption of subordinated liabilities (885) (3 175) (625) — Consumer Price Index, effective interest rate adjustments and currency adjustments on foreign denominated bonds adjustment (689) 1 701 (212) 407 Closing balance 14 445 14 383 3 145 2 346
* Maturities have been determined using the date on which the company is able to call the bonds.
The only event of default in relation to the subordinated debt is the non-payment of principal or interest. The only remedy available to the holders of the subordinated debt in the event of default is to petition for the winding up of the issuing entity. In a winding up no amount will be paid in respect of the subordinated debt until all other creditors have been paid in full.
03 Annual financial statements Investec Limitedgroup and company annual financial statements 2021
NOTES TO THE FINANCIAL STATEMENTSCONTINUED
99

43. Subordinated liabilities (continued)IV019 indexed rate subordinated unsecured callable bondsR199 million (2020: R179 million) Investec Bank Limited IV019 locally registered subordinated unsecured callable bonds are due in March 2028. Interest on these inflation-linked bonds is payable semi-annually on 31 March and 30 September at a rate of 2.60%. The IV019 is a replica of the R210 South African government bond. The maturity date is 31 March 2028, but the company has the option to call the bonds upon regulatory capital disqualification or from 3 April 2023.
IV019A indexed rate subordinated unsecured callable bondsR377 million (2020: R374 million) Investec Bank Limited IV019A locally registered subordinated unsecured callable bonds are due in March 2028. Interest on these inflation-linked bonds is payable semi-annually on 31 March and 30 September at a rate of 2.60%. The IV019A is a replica of the R210 South African government bond. The maturity date is 31 March 2028, but the company has the option to call the bonds upon regulatory capital disqualification or from 3 April 2023.
IV033 variable rate subordinated unsecured callable bondsR159 million Investec Bank Limited IV033 locally registered subordinated unsecured callable bonds are due in February 2026. Interest is payable quarterly on 11 May, 11 August, 11 November and 11 February at a rate equal to the three-month JIBAR plus 4.25% up to and excluding 11 February 2026. The maturity date is 11 February 2026, but the company has the option to call the bonds upon regulatory capital disqualification or from 11 February 2021. These notes were repaid in the current year.
IV034 fixed rate subordinated unsecured callable bondsR101 million Investec Bank Limited IV034 locally registered subordinated unsecured callable bonds are due in February 2026. Interest is payable semi-annually on 11 February and 11 August at a rate equal to 12.47% up to and excluding 11 February 2026. The maturity date is 11 February 2026, but the company has the option to call the bonds upon regulatory capital disqualification or from 11 February 2021. These notes were repaid in the current year.
IV035 variable rate subordinated unsecured callable bondsR1 468 million Investec Bank Limited IV035 locally registered subordinated unsecured callable bonds are due in April 2027. Interest is payable quarterly on 7 April, 7 July, 7 October and 7 January at a rate equal to the three-month JIBAR plus 4.65% up to and excluding 7 April 2027. The maturity date is 7 April 2027, but the company has the option to call the bonds upon regulatory capital disqualification or from 7 April 2022.
IV036 variable rate subordinated unsecured callable bondsR32 million Investec Bank Limited IV036 locally registered subordinated unsecured callable bonds are due in April 2026. Interest is payable quarterly on 22 April, 22 July, 22 October and 22 January at a rate equal to the three-month JIBAR plus 4.25% up to and excluding 22 July 2026. The maturity date is 22 July 2026, but the company has the option to call the bonds upon regulatory capital disqualification or from 22 July 2021.
IV037 variable rate subordinated unsecured callable bonds$125 million Investec Bank Limited IV037 locally registered subordinated unsecured Tier II callable bonds are due in October 2026 and were issued at an issue price of $91 million. The notes will automatically convert from zero coupon notes to floating rate notes on the first optional redemption date, being 19 October 2021. The implied zero coupon yield is 6.29961713% nacq (ACT/360) up until; the 19 October 2021. If the issuer does not exercise the option to redeem the notes on 19 October 2021, then interest on the floating rate notes shall commence on 19 October 2021 and is payable quarterly on 19 January, 19 July, 19 April and 19 October at a rate equal to the three-month USD Libor plus 5.5% up to and excluding October 2026. The maturity date is 19 October 2026, but the company has the option to call the bonds upon regulatory capital disqualification or from 19 October 2021.
IV038 variable rate subordinated unsecured callable bondsR350 million Investec Bank Limited IV038 locally registered subordinated unsecured callable bonds are due in September 2026. Interest is payable quarterly on 23 March, 23 June, 23 September and 23 December at a rate equal to the three-month JIBAR plus 4.25% up to and excluding 23 September 2026. The maturity date is 23 September 2026, but the company has the option to call the bonds upon regulatory capital disqualification or from 23 September 2021.
IV039 indexed rate subordinated unsecured callable bondsR196 million (2020: R187 million) Investec Bank Limited IV039 locally registered subordinated unsecured callable bonds are due in January 2027. Interest is payable quarterly on 31 January, 30 April, 31 July and 31 October at a rate equal to the three-month JIBAR plus 4.25% up to and excluding 31 January 2027. The maturity date is 31 January 2027, but the company has the option to call the bonds upon regulatory capital disqualification or from 31 January 2022.
IV040 variable rate subordinated unsecured callable bondsR589 million Investec Bank Limited IV040 locally registered subordinated unsecured callable bonds are due in September 2026. Interest is payable quarterly on 29 March, 29 June, 29 September and 29 December at a rate equal to the three-month JIBAR plus 4.25% up to and excluding 29 September 2026. The maturity date is 29 September 2026, but the company has the option to call the bonds upon regulatory capital disqualification or from 29 September 2021.
IV041 fixed rate subordinated unsecured callable bondsR190 million Investec Bank Limited IV041 locally registered subordinated unsecured callable bonds are due in September 2026. Interest is payable quarterly on 29 March, 29 June, 29 September and 29 December at a rate equal to the three-month JIBAR plus 4.25% up to and excluding 29 September 2026. The maturity date is 29 September 2026, but the company has the option to call the bonds upon regulatory capital disqualification or from 29 September 2021.
IV042 variable rate subordinated unsecured callable bondsR50 million Investec Bank Limited IV042 locally registered subordinated unsecured callable bonds are due in November 2026. Interest is payable quarterly on 18 February, 18 May, 18 August and 18 November at a rate equal to the three-month JIBAR plus 4.25% up to and excluding 18 November 2026. The maturity date is 18 November 2026, but the company has the option to call the bonds upon regulatory capital disqualification or from 18 November 2021.
03 Annual financial statements Investec Limitedgroup and company annual financial statements 2021
NOTES TO THE FINANCIAL STATEMENTSCONTINUED
100

43. Subordinated liabilities (continued)IV043 fixed rate subordinated unsecured callable bondsR150 million Investec Bank Limited IV043 locally registered subordinated unsecured callable bonds are due in November 2026. Interest is payable quarterly on 21 February, 21 May, 21 August and 21 November at a rate equal to the three-month JIBAR plus 4.25% up to and excluding 18 November 2026. The maturity date is 21 November 2026, but the company has the option to call the bonds upon regulatory capital disqualification or from 18 November 2021.
IV044 variable rate subordinated unsecured callable bondsR240 million Investec Bank Limited IV044 locally registered subordinated unsecured callable bonds are due in January 2027. Interest is payable quarterly on 31 January, 30 April, 31 July and 31 October at a rate equal to the three-month JIBAR plus 4.15% up to and excluding 18 November 2026. The maturity date is 31 January 2027, but the company has the option to call the bonds upon regulatory capital disqualification or from 31 January 2022.
IV045 indexed rate subordinated unsecured callable bondsR1 914 million (2020: R1 822 million) Investec Bank Limited IV045 locally registered subordinated unsecured callable bonds are due in January 2027. Interest is payable quarterly on 31 January, 30 April, 31 July and 31 October at a rate of 2.75%. The IV045 is a replica of the R212 South African government bond. The maturity date is 31 January 2027, but the company has the option to call the bonds upon regulatory capital disqualification or from 31 January 2022.
IV046 variable rate subordinated unsecured callable bondsR1 200 million Investec Bank Limited IV046 locally registered subordinated unsecured callable bonds are due in June 2027. Interest is payable quarterly on 21 September, 21 December, 21 March and 21 June at a rate equal to the three-month JIBAR plus 3.90%. The maturity date is 21 June 2027, but the company has the option to call the bonds upon regulatory capital disqualification or from 21 June 2022.
IV047 variable rate subordinated unsecured callable bonds$116 million Investec Bank Limited IV047 locally registered subordinated unsecured Tier II callable bonds are due in June 2027 and were issued at an issue price of $86 million. The notes will automatically convert from zero coupon notes to floating rate notes on the first optional redemption date, being 30 June 2022. The implied zero coupon yield is 5.915966% nacq (ACT/360) up until; the 30 June 2022. If the issuer does not exercise the option to redeem the notes on 30 June 2022, then interest on the floating rate notes shall commence on 30 June 2022 and is payable quarterly on 30 September, 30 December, 30 June at a rate equal to the three-month USD LIBOR plus 4.5% up to and excluding 30 June 2027. The maturity date is 30 June 2027, but the company has the option to call the bonds upon regulatory capital disqualification or from 30 June 2022.
IV049 variable rate subordinated unsecured callable bondsR977 million (2020: R1 113 million) Investec Bank Limited IV049 locally registered subordinated unsecured callable bonds are due on 4 December 2028. Interest is payable quarterly in arrears on 4 March, 4 June and 4 September and 4 December at a rate equal to three-month JIBAR plus 3.413% basis points up to and excluding 4 March 2028. The maturity date is 4 March 2028, but the company has the option to call the bonds upon regulatory capital disqualification or from 4 March 2023.
INLV02 variable rate subordinated unsecured callable bondsR276 million Investec Limited INVL02 locally registered subordinated unsecured callable bonds are due in October 2025. Interest is payable quarterly on 20 January, 20 April, 20 July and 20 October at a rate equal to the three-month JIBAR plus 3.7% up to and excluding 20 October 2025. The maturity date is 20 October 2025, but the company has the option to call the bonds upon regulatory capital disqualification or from 20 October 2020. These notes were repaid in the current year.
INLV03 variable rate subordinated unsecured callable bondsR94 million INVL03 locally registered subordinated unsecured callable bonds are due in February 2026. Interest is payable quarterly on 11 May, 11 August, 11 November and 11 February at a rate equal to the three-month JIBAR plus 4.35% up to and excluding 11 February 2026. The maturity date is 11 February 2026, but the company has the option to call the bonds upon regulatory capital disqualification or from 11 February 2021. These notes were repaid in the current year.
INLV04 variable rate subordinated unsecured callable bondsR255 million Investec Limited INVL04 locally registered subordinated unsecured callable bonds are due in February 2026. Interest is payable quarterly on 11 May, 11 August, 11 November and 11 February at a rate equal to 12.77% up to and excluding 7 April 2027. The maturity date is 11 February 2026, but the company has the option to call the bonds upon regulatory capital disqualification or from 11 February 2021. These notes were repaid in the current year.
INLV07 variable rate subordinated unsecured callable bondsR1 636 million (2020: nil) Investec Limited issued R1 636 million INLV07 subordinated unsecured floating rate notes on 9 March 2021. Interest is payable quarterly on 9 March, 9 June, 9 September and 9 December at a rate equal to the three-month JIBAR plus 2.60%. The maturity date is 9 March 2031 but the issuer has the option to redeem on 9 March 2026 and on each interest payment date thereafter.
INB001 variable rate subordinated unsecured callable bonds$113 million Investec Limited INB001 locally registered subordinated unsecured Tier II callable bonds are due in December 2027 and were issued at an issue price of $84 million. The notes will automatically convert from zero coupon notes to floating rate notes on the first optional redemption date, being 28 December 2022. The implied zero coupon yield is 5.86482% nacq (ACT/360) up until the 28 December 2022. If the issuer does not exercise the option to redeem the notes on 28 December 2022, then interest on the floating rate notes shall commence on 28 December 2022 and is payable quarterly on 28 March, 28 June, 28 September, 28 December at a rate equal to the three-month USD Libor plus 4% up to and excluding 28 December 2027. The maturity date is 28 December 2027, but the company has the option to call the bonds upon regulatory capital disqualification or from 28 December 2022.
03 Annual financial statements Investec Limitedgroup and company annual financial statements 2021
NOTES TO THE FINANCIAL STATEMENTSCONTINUED
101

44. Ordinary share capitalGroup Company
At 31 MarchR’million 2021 2020 2021 2020
Authorised450 000 000 (2020: 450 000 000) ordinary share of R0.0002 eachIssued318 904 709 (2020: 318 904 709) ordinary share of R0.0002 each, fully paid 1 1 1 1
In terms of the dual listed companies structure, shareholders have common economic and voting rights as if Investec Limited and Investec plc were a single company. These include equivalent dividends on a per share basis, joint electorate and class right variations. The UK DAS share, UK DAN share and the special converting shares have been issued to achieve this.
The unissued shares are under the control of the directors until the next annual general meeting.
Details of the share capital are set out in Investec’s 2021 integrated annual report.
03 Annual financial statements Investec Limitedgroup and company annual financial statements 2021
NOTES TO THE FINANCIAL STATEMENTSCONTINUED
102

45. Share premiumGroup Company
At 31 MarchR'million 2021 2020^ 2021 2020^
Share premium on ordinary shares 6 112 6 112 5 693 5 693 6 112 6 112 5 693 5 693
^ Restated refer to note 58.
46. Treasury shares
At 31 March2021 2020
R'million R'million
Treasury shares held by subsidiaries of Investec LimitedPremium paid on options held to acquire Investec Limited shares (279) (279) Investec Limited ordinary shares 3 299 3 271
3 020 2 992 Number Number
Number of Investec Limited ordinary shares held by subsidiaries 48 832 795 51 026 675 Reconciliation of treasury shares Number NumberAt the beginning of the year 51 026 675 29 686 599 Purchase of own shares by subsidiary companies 17 035 102 38 699 807 Shares disposed of by subsidiaries (19 228 982) (17 359 731) At the end of the year 48 832 795 51 026 675
R'million R'millionMarket value of treasury shares 1 767 1 651
47. Perpetual preference shares in issueGroup Company
At 31 MarchR’million 2021 2020 2021 2020
Authorised100 000 000 (2020: 100 000 000) non-redeemable, non-cumulative, non-participating preference shares of one cent each 20 000 000 (2020: 20 000 000) non-redeemable, non-participating preference shares with a par value of one cent eachIssued30 756 461 (2020: 32 214 499) non-redeemable, non-cumulative, non-participating preference shares of one cent each, issued at various premium
3 039 3 184 3 039 3 184 – Perpetual preference share capital * * * *– Perpetual preference share premium 3 039 3 184 3 039 3 184
* Less than R1 million.
Preference shareholders will be entitled to receive dividends, if declared, at a rate limited to 77.77% of the South African prime interest rate on R100 being the deemed value of the issue price of the preference share held.
Preference shareholders receive dividends in priority to any payment of dividends to the holder of any other class of shares in the capital of the company not ranking prior or pari passu with the preference shares.
An ordinary dividend will not be declared by Investec Limited unless the preference dividend has been declared. If declared, preference dividends are payable semi-annually at least seven business days prior to the date on which Investec Limited pays its ordinary dividends, if any, but shall be payable no later than 120 business days after 31 March and 30 September respectively.
03 Annual financial statements Investec Limitedgroup and company annual financial statements 2021
NOTES TO THE FINANCIAL STATEMENTSCONTINUED
103

48. Other Additional Tier 1 securities in issueGroup Company
At 31 MarchR'million 2021 2020 2021 2020
INLVO1 variable rate subordinated unsecured callable bonds 550 550 550 550 INLVO5 variable rate subordinated unsecured callable bonds 350 350 350 350 IV050 variable rate subordinated unsecured callable bonds 110 110 — — INLV06 variable rate subordinated unsecured callable bonds 273 — 273 — IV055U variable rate subordinated unsecured callable bonds 450 — 450 —
1 733 1 010 1 623 900
INLVO1 variable rate subordinated unsecured callable bondsInvestec Limited issued R550 million other Additional Tier 1 floating rate notes on the 12 August 2014. Interest is payable quarterly on 12 August, 12 November, 12 February and 12 May at a rate equal to the ZAR-JIBAR-SAFEX. There is no maturity date but the issuer has the option to redeem on 12 August 2024 and on every interest payment date thereafter. Interest is payable at the option of the issuer.
INLVO5 variable rate subordinated unsecured callable bondsInvestec Limited issued R350 million other Additional Tier 1 floating rate notes on 15 March 2018. Interest is payable quarterly on 22 March, 22 June, 22 September, 22 December and at a rate equal to the three-month JIBAR plus 5.15%. There is no maturity date but the issuer has the option to redeem on 22 March 2023 and on every interest payment date thereafter. The interest is payable at the option of the issuer.
IV050 variable rate subordinated unsecured callable bondsInvestec Bank Limited issued R93 million and R17 million Other Additional Tier 1 floating rate notes on 26 March 2019 and 29 March 2019. Interest is payable quarterly on 26 June, 26 September, 26 December and 26 March at a rate equal to the three-month JIBAR plus 4.55%. There is no maturity date but the issuer has the option to redeem on 26 June 2024 and on any interest payment date thereafter. The interest is payable at the option of the issuer.
INLV06 variable rate subordinated unsecured callable bondsInvestec Limited issued R128 million and R45 million and R100 million Other Additional Tier 1 floating rate notes on the 22 October 2020 and 25 November 2020 and 15 December 2020. Interest is payable quarterly on the 22 January, 22 April, 22 July and 22 October at a rate equal to the three-month JIBAR plus 4.85%. There is no maturity date but the issuer has the option to redeem on 22 January 2026 or any interest payment date thereafter. The interest is payable at the option of the issuer.
IV055U variable rate subordinated unsecured callable bondsInvestec Bank Limited issued R450 million Other Additional Tier 1 floating rate notes on the 12 March 2021. Interest is payable quarterly on the 12 March, 12 June, 12 September and 12 December at a rate equal to the three-month JIBAR plus 4.80%. There is no maturity date but the issuer has the option to redeem on 12 June 2026 or any interest payment date thereafter. The interest is payable at the option of the issuer.
03 Annual financial statements Investec Limitedgroup and company annual financial statements 2021
NOTES TO THE FINANCIAL STATEMENTSCONTINUED
104

49. Non-controlling interestsGroup
At 31 MarchR’million 2021 2020
Perpetual preference shares issued by Investec Bank Limited 1 481 1 534 Non-controlling interests in partially held subsidiaries 10 083 11 045
11 564 12 579
Perpetual preference shares issued by Investec Bank LimitedAuthorised70 000 0000 (2020: 70 000 000) non-redeemable, non-cumulative, non-participating preference shares of one cent each
Issued14 917 559 (2020: 15 447 630) non-redeemable, non-cumulative, non-participating preference shares of one cent each issued at various premiums.
Preference shareholders will be entitled to receive dividends if declared, at a rate of 83.33% of prime on R100 being the deemed value of the issue price of the preference share of the preference share held. Preference shareholders receive dividends in priority to any payment of dividends to the holder of any other class of shares in the capital of the company not ranking prior or pari passu with the preference shares.
An ordinary dividend will not be declared by Investec Bank Limited unless the preference dividend has been declared. If declared, preference dividends are payable semi-annually at least seven business days prior to the date on which Investec Bank Limited pays its ordinary dividends, if any, but shall be payable no later than 120 business days after 31 March and 30 September respectively.
The following table summarises the information relating to the group’s partially held subsidiaries which have material non-controlling interests:
Group
Investec Property Fund Limited
Investec Asset Management
Holdings Group*
2021 2020 2020
Non-controlling interests (NCI) (%) 75.7% 75.7% —
Summarised financial information (R’million)Total assets 25 148 31 408 — Total liabilities 11 749 16 763 —
Revenue 1 468 1 773 3 682 (Loss)/Profit after taxation (328) 1 714 1 020
Carrying amount of NCI 10 169 11 045 — Dividends to NCI 691 779 290 Profit allocated to NCI 4 1 258 211 Loss attributable to NCI on impairment of associate (189) — —
The net cash flows in these partially held subsidiaries arising during the current and prior year relate to operating activities. Other than payments of dividends there are no material cash flows arising from financing or investing activities.
* On 13 March 2020, the group successfully completed the demerger of Ninety One (formerly known as Investec Asset Management), which became separately listed on 16 March 2020. The loss of control of Investec Asset Management was effected through the distribution of Ninety One shares to shareholders. Further details relating to the demerger are provided on note 37.
Net equity impact of non-controlling interests totalling R79.8 million in the statement of changes in equity relates to changes in holdings without a change in control of subsidiaries within the Investec Properties group.
In the prior year, the reduction in the shareholding of IPF is as a result of the group not participating in a share issue and is reflected in the statement of changes in equity as line item,”Movement in non-controlling interests due to share issues in subsidiary”.
03 Annual financial statements Investec Limitedgroup and company annual financial statements 2021
NOTES TO THE FINANCIAL STATEMENTSCONTINUED
105

50. Finance lease disclosuresGroup
2021 2020
At 31 MarchR'million
Total futureminimum
paymentsPresent
value
Total futureminimum
paymentsPresent
value
Finance lease receivables included in loans and advances tocustomersLease receivables due in:Less than one year 2 027 1 834 1 731 1 504 One to five years 1 261 1 094 1 489 1 278
3 288 2 928 3 220 2 782
Unearned finance income 360 438
At 31 March 2021 and 31 March 2020, there were no unguaranteed residual values. Finance leases mainly relate to leases on machinery and equipment.
03 Annual financial statements Investec Limitedgroup and company annual financial statements 2021
NOTES TO THE FINANCIAL STATEMENTSCONTINUED
106

51. Notes to the cash flow statementGroup Company
At 31 MarchR’million 2021 2020^ 2021 2020
Profit before taxation adjusted for non-cash items is derived as follows:Profit before taxation 4 704 12 911 828 2 625 Adjustment for non-cash items included in net income before taxation:Impairment of goodwill 7 3 — — Depreciation, amortisation and impairment of property, equipment, software and intangibles 310 333 — — Amortisation of acquired intangibles 51 51 — — Expected credit loss impairment charges 621 1 122 — — Share of post-taxation loss/(profit) of associates and joint ventures 145 (311) — — Impairment of associates and joint venture holdings 348 937 — — Share-based payment charges 436 592 — — Fair value gains on investment properties 990 628 — — Gain on partial disposal of subsidiary and implementation costs — (5 603) — 405 Profit before taxation adjusted for non-cash and non-operating items 7 612 10 663 828 3 030 Decrease/(increase) in operating assetsLoans and advances to banks (14) (659) — — Reverse repurchase agreements and cash collateral on securities borrowed (1 362) (8 034) — — Sovereign debt securities 14 146 (6 245) — — Bank debt securities (9 662) (648) (2 359) — Other debt securities 2 434 (1 979) — — Derivative financial instruments (1 756) (9 691) — — Securities arising from trading activities (4 836) 9 713 — — Investment portfolio 2 092 (3 800) 13 3 Loans and advances to customers (523) (16 192) — — Own originated loans and advances to customers securitised (992) 475 — — Other loans and advances 61 87 — — Other securitised assets (81) (203) — — Other assets (2 725) 601 (10) 10 Investment properties 1 045 (1 340) — — Assurance assets (287) (7 415) — — Non-current assets classified as held for sale 725 (1 305) — —
(1 735) (46 635) (2 356) 13 (Decrease)/increase in operating liabilitiesDeposits by banks (24 799) 15 099 — — Derivative financial instruments 3 688 11 353 — — Other trading liabilities (3 017) (2 472) — — Repurchase agreements and cash collateral on securities lent (9 028) 11 368 — — Customer accounts (deposits) 1 770 30 603 — — Debt securities in issue (1 141) (4 694) — — Liabilities arising on securitisation of own originated loans and advances 1 572 (21) — — Other liabilities 3 138 3 588 833 658 Assurance liabilities 287 7 415 — —
(27 530) 72 239 833 658
^ Restated refer to note 58.
03 Annual financial statements Investec Limitedgroup and company annual financial statements 2021
NOTES TO THE FINANCIAL STATEMENTSCONTINUED
107

52. Related-party transactions and balancesGroup
At 31 MarchR’million 2021* 2020
Transactions, balances, arrangements and agreements involving key management personnel
Particulars of transactions, balances, arrangements and agreements entered into by the group with directors and connected persons and companies controlled by them, and with officers of the company, were as follows:
Key management personnel and connected persons and companies controlled by themLoansAt the beginning of the year 172 845 Increase in loans 68 121 Decrease in loans** (58) (794) Exchange adjustments — — At the end of the year 182 172 GuaranteesAt the beginning of the year 13 257 Additional guarantees granted 31 13 Decrease in guarantees** (5) (257) Exchange adjustments 1 — At the end of the year 40 13 DepositsAt the beginning of the year (266) (677) Increase in deposits (213) (67) Decrease in deposits** 188 479 Exchange adjustments 1 (1) At the end of the year (290) (266)
* These balances do not include directors who resigned during the course of year.** Decrease includes changes in leadership during the prior year.
The above transactions were made in the ordinary course of business and on substantially the same terms, including interest rates and security, as for comparable transactions with persons of a similar standing or where applicable, with other employees. The transactions did not involve more than the normal risk of repayment. None of these loans have been impaired.
For information on overall compensation to key management personnel, refer to note 60.
03 Annual financial statements Investec Limitedgroup and company annual financial statements 2021
NOTES TO THE FINANCIAL STATEMENTSCONTINUED
108

52. Related-party transactions and balances (continued)Group
At 31 MarchR’million 2021 2020
Amounts with Investec plc and its subsidiariesAssets
Loans and advances to banks 649 777 Reverse repurchase agreements and cash collateral on securities borrowed 373 474 Loans and advances to customers 150 178 Other debt securities 592 1 664 Derivative financial instruments 180 239 Other assets 103 933
LiabilitiesDeposits from banks 230 203 Derivative financial instruments 17 80 Other liabilities 85 540
Income statementInterest income 32 56 Interest expense 2 7
The above outstanding balances arose in the ordinary course of business and are on the same terms, including interest rates and security, as for comparable transactions with third party counterparties.
Where related parties have investment products (that may not be included in funds under management) offered to clients on terms and conditions in the ordinary course of business, these have not been included above as the group does not carry any exposure relating to these transactions (they are at client risk).
In the normal course of business, services are rendered between Investec plc and Investec Limited entities. For the year to 31 March 2021, this resulted in a net payment by Investec plc group of R281.6 million (2020: 323.1 million).
Amounts relating to associates and joint venturesAmounts due from associates and its subsidiaries 10 444 12 700 Interest income from loans to associates 366 319 Interest expense from loans to associates 1 89
At 31 March 2021, the Investec Limited group has R110.3 million (March 2020: Rnil) of customer accounts (deposits) and derivative financial instruments valued at R11.7 million (2020: Rnil) from an associate in the group held on balance sheet.
The above outstanding balances arose in the ordinary course of business and are on the same terms, including interest rates and security, as for comparable transactions with third party counterparties.
For related party transactions within the company, refer to note 38.
03 Annual financial statements Investec Limitedgroup and company annual financial statements 2021
NOTES TO THE FINANCIAL STATEMENTSCONTINUED
109

53. CommitmentsGroup
At 31 MarchR'million 2021 2020
Undrawn facilities 64 358 56 024 64 358 56 024
The group has entered into forward foreign exchange contracts and loan commitments in the normal course of its banking business for which the fair value is recorded on balance sheet.
Carrying amount of pledged assets Related liability
At 31 MarchR'million 2021 2020 2021 2020
GroupPledged assetsLoans and advances to banks 295 304 287 307 Sovereign debt securities 9 340 22 670 7 958 19 499 Bank debt securities 1 498 1 031 1 468 933 Other debt securities 2 828 2 337 2 524 2 544 Securities arising from trading activities 1 102 1 542 1 102 1 679 Reverse repurchase agreements and cash collateral on securities borrowed 3 293 — 3 293 —
18 356 27 884 16 632 24 962
The assets pledged by the group are strictly for the purpose of providing collateral for the counterparty. To the extent that the counterparty is permitted to sell and/or repledge the assets, they are classified on the balance sheet as reverse repurchase agreements and cash collateral on securities borrowed.
54. Contingent liabilitiesGroup
At 31 MarchR'million 2021 2020
Guarantees and assets pledged as collateral security:Guarantees and irrevocable letters of credit 19 675 21 853
19 675 21 853
The amounts shown above are intended only to provide an indication of the volume of business outstanding at the balance sheet date.
Guarantees are issued by Investec Limited on behalf of third parties and other group companies. The guarantees are issued as part of the banking business.
Legal proceedingsThe group operates in a legal and regulatory environment that exposes it to litigation risks. As a result, the group is involved in disputes and legal proceedings which arise in the ordinary course of business. The group evaluates all facts, the probability of the outcome of legal proceedings and advice from internal and external legal counsel when considering the accounting implications.
55. HedgesThe group uses derivatives for the management of financial risks relating to its asset and liability portfolios, mainly associated with non-trading interest rate risks and exposures to foreign currency risk. Most non-trading interest rate risk is transferred from the originating business to the Central Treasury in the Specialist Bank. Once aggregated and netted Central Treasury, as the sole interface to the wholesale market for cash and derivative transactions, actively manages, the liquidity mismatch and non-trading interest rate risk from our asset and liability portfolios. In this regard, Treasury is required to exercise tight control of funding, liquidity, concentration and non-trading interest rate risk within defined parameters.
The accounting treatment of accounting hedges is dependant on the classification between fair value hedges and cash flow hedges and in particular accounting hedges require the identification of a direct relationship between a hedged item and hedging instrument. This relationship is established in limited circumstances based on the manner in which the group manages its risk exposure. Below is a description of each category of accounting hedges achieved by the group.
Fair value hedgesFair value hedges are entered into mainly to hedge the exposure of changes in fair value of fixed rate financial instruments attributable to interest rates.
03 Annual financial statements Investec Limitedgroup and company annual financial statements 2021
NOTES TO THE FINANCIAL STATEMENTSCONTINUED
110

55. Hedges (continued)
At 31 MarchR'million
Description of financial instrument designated as hedging instrument
Notional value of hedging instrument
Fair value of hedging
instrument
Cumulative fair value gains or
(losses) on hedging
instrument
Current year fair value gains
or (losses) on hedging
instrument
Cumulative fair value gains or
(losses) on hedged item*
Current year fair value
gains or (losses) on
hedged item
Group
2021
Hedged assetsInterest rate swaps 30 616 (1 382) (1 382) (360) 1 395 383
2020
Hedged assetsInterest rate swaps 28 959 (2 184) (2 184) (1 432) 2 178 1 425
* Change in fair value used as the basis for recognising hedge effectiveness for the period.
As at year-end the hedges were both retrospectively and prospectively effective.
Carrying amount of the hedged item
At 31 MarchR'million 2021 2020
AssetsSovereign debt securities 26 073 30 705 Bank debt securities 3 632 5 221 Other debt securities 1 207 3 987
Maturity analysis of hedged itemAt 31 March Up to one
monthOne month to three months
Three months to six months
Six months to one year
One to five years
Greater than five years TotalR'million
2021Assets – notionals Sovereign debt securities — — — 1 690 6 228 16 116 24 034 Bank debt securities — — — 500 3 796 — 4 296 Other debt securities — — — — 941 1 168 2 109 Liabilities – notionalsSubordinated liabilities — — — — — — — 2020Assets – notionalsSovereign debt securities — — 10 634 — 3 077 17 467 31 178 Bank debt securities — — — 109 5 413 — 5 522 Other debt securities — — 111 1 633 1 439 1 247 4 430 Liabilities – notionalsSubordinated liabilities — — — — — — —
There was no ineffective portion recognised in the income statement.
There are no accumulated fair value hedge adjustments for hedged items that have ceased to be adjusted for hedging gains and losses.
03 Annual financial statements Investec Limitedgroup and company annual financial statements 2021
NOTES TO THE FINANCIAL STATEMENTSCONTINUED
111

Cash flow hedgesThe group is exposed to variability in cash flows on future liabilities arising from changes in base interest rates and foreign exchange rates. The aggregate expected cash flows are hedged based on cash flow forecasts with reference to terms and conditions present in the affected contractual arrangements. Changes in fair value are initially recognised in other comprehensive income and reclassified to the income statement when the cash flow affects the income statement.
At 31 MarchR'million
Description of financial
instrument being hedged
Fair value of hedging
instrument
Period cash flows are
expected to occur and
affect income statement
Group2021Cross-currency swap Bonds (867) Three monthsForward exchange contracts Dividends 78 Three months2020Cross-currency swap Bonds (2 585) Three monthsForward exchange contracts Dividends 78 Three months
Cash flow hedges are held to mitigate interest rate and currency risk. A reconciliation of the cash flow hedge reserve can be found in the statement of changes in equity. There was no ineffective portion recognised in the income statement.
Realisations to the income statement for cash flow hedges of (R956 million) [2020: (R262 million)] are included in net interest income.
There are R78 million (2020: R78 million) accumulated cash flow hedge reserves for hedged items that have ceased to be adjusted for hedging gains and losses.
56. Liquidity analysis of financial liabilities based on undiscounted cash flowsThe balances in the below tables will not agree directly to the balances in the consolidated balance sheet as the table incorporates all cash flow on an undiscounted basis relating to both principal and those associated with all future coupon payments (except for trading liabilities and trading derivatives). Furthermore, loan commitments are generally not recognised on the balance sheet. Trading liabilities and trading derivatives have been included in the ‘Demand’ time bucket and not by contractual maturity because trading liabilities are typically held for short periods of time.
For an unaudited analysis based on discounted cash flows refer to page 145.
At 31 MarchR'million Demand
Up to one month
One month to three months
Three months to
six monthsSix months to one year
One year to five years
Greater than five
years Total
Group2021LiabilitiesDeposits by banks 60 2 243 62 248 3 259 16 753 294 22 919 Derivative financial instruments 24 719 (61) — — 303 303 1 158 26 422 – held for trading 24 719 — — — — — — 24 719 – held for hedging risk — (61) — — 303 303 1 158 1 703 Other trading liabilities 5 643 — — — — — — 5 643 Repurchase agreements and cash collateral on securities lent 5 362 6 183 1 681 39 2 658 802 2 075 18 800 Customer accounts (deposits) 166 874 38 482 66 253 24 837 40 214 46 270 2 724 385 654 Debt securities in issue — 19 242 536 1 078 5 053 331 7 259 Liabilities arising on securitisation of own originated loans and advances — — 97 70 99 34 3 420 3 720 Other liabilities 5 781 1 252 6 887 295 299 1 161 906 16 581 Subordinated liabilities — 37 77 135 7 022 9 675 — 16 946 Total on balance sheet liabilities 208 439 48 155 75 299 26 160 54 932 80 051 10 908 503 944 Contingent liabilities 3 691 502 548 2 463 6 188 7 301 41 20 734 Commitments 6 817 1 525 8 559 2 856 3 433 14 588 26 739 64 517 Total liabilities 218 947 50 182 84 406 31 479 64 553 101 940 37 688 589 195
03 Annual financial statements Investec Limitedgroup and company annual financial statements 2021
NOTES TO THE FINANCIAL STATEMENTSCONTINUED
112

56. Liquidity analysis of financial liabilities based on undiscounted cash flows (continued)
At 31 MarchR'million Demand
Up to one month
One month to three months
Three months to
six monthsSix months to one year
One year to five years
Greater than five
years Total
Group2020LiabilitiesDeposits by banks* 378 1 268 1 117 4 290 223 41 493 398 49 167 Derivative financial instruments 21 944 381 — — — 137 7 22 469 – held for trading 21 944 — — — — — — 21 944 – held for hedging risk — 381 — — — 137 7 525 Other trading liabilities 8 660 — — — — — — 8 660 Repurchase agreements and cash collateral on securities lent* 3 175 6 659 14 836 42 85 866 2 238 27 901 Customer accounts (deposits)* 174 288 35 790 48 237 31 170 41 920 52 596 4 765 388 766 Debt securities in issue* — 441 263 156 2 055 5 477 312 8 704 Liabilities arising on securitisation of own originated loans and advances — — 15 52 52 385 1 285 1 789 Other liabilities 2 576 3 253 3 286 3 170 230 1 417 76 14 008 Subordinated liabilities 7 60 83 194 337 15 142 — 15 823 Total on balance sheet liabilities 211 028 47 852 67 837 39 074 44 902 117 513 9 081 537 287 Contingent liabilities 4 513 2 5 227 508 479 11 481 4 371 26 581 Commitments 5 296 — 8 152 1 271 2 016 14 482 24 810 56 027 Total liabilities 220 837 47 854 81 216 40 853 47 397 143 476 38 262 619 895
At 31 MarchR'million Demand
Up to one month
One month to three months
Three months to
six monthsSix months to one year
One year to five years
Greater than five
years Total
Company2021LiabilitiesDebt securities in issue — 4 — 4 8 371 — 387 Other liabilities 1 316 — 501 5 8 8 — 1 838 Subordinated liabilities — — 26 26 51 3 553 — 3 656 Total on balance sheet liabilities 1 316 4 527 35 67 3 932 — 5 881
At 31 MarchR'million Demand
Up to one month
One month to three months
Three months to
six monthsSix months to one year
One year to five years
Greater than five
years Total
Company2020LiabilitiesDebt securities in issue* — 5 — 4 8 67 319 403 Other liabilities 901 5 566 45 7 8 — 1 532 Subordinated liabilities — 7 3 26 36 2 297 — 2 369 Total on balance sheet liabilities 901 17 569 75 51 2 372 319 4 304
* In the prior year, contractual maturities on variable rate instruments were calculated for a period of three months post balance sheet due to uncertainty. The prior year has been updated to reflect the contractual maturity by applying the variable rate as at the reporting date.
03 Annual financial statements Investec Limitedgroup and company annual financial statements 2021
NOTES TO THE FINANCIAL STATEMENTSCONTINUED
113

57. OffsettingAmounts subject to enforceable netting arrangements
Effects of offsetting on balance sheet
Related amounts not
offset
At 31 March Grossamounts
Amountsoffset
Netamounts
reported onthe balance
sheet
Financial instruments
(including non-cash collateral) Net amountR’million
Group2021AssetsCash and balances at central banks 9 653 — 9 653 — 9 653 Loans and advances to banks 38 240 (11 257) 26 983 (295) 26 688 Non-sovereign and non-bank cash placements 8 956 — 8 956 — 8 956 Reverse repurchase agreements and cash collateral on securities borrowed 31 741 (985) 30 756 (3 293) 27 463 Sovereign debt securities 53 009 — 53 009 (9 340) 43 669 Bank debt securities 21 862 — 21 862 (1 498) 20 364 Other debt securities 14 148 — 14 148 (2 828) 11 320 Derivative financial instruments 23 775 (4 589) 19 186 (10 165) 9 021 Securities arising from trading activities 24 919 (9 717) 15 202 (1 102) 14 100 Investment portfolio 15 131 — 15 131 — 15 131 Loans and advances to customers 282 163 (3 032) 279 131 — 279 131 Own originated loans and advances to customers securitised 8 184 — 8 184 — 8 184 Other loans and advances 181 — 181 — 181 Other securitised assets 578 — 578 — 578 Other assets 16 324 — 16 324 — 16 324
548 864 (29 580) 519 284 (28 521) 490 763 LiabilitiesDeposits by banks 23 657 (1 605) 22 052 — 22 052 Derivative financial instruments 40 395 (14 241) 26 154 (10 165) 15 989 Other trading liabilities 5 643 — 5 643 — 5 643 Repurchase agreements and cash collateral on securities lent 18 583 (985) 17 598 (16 632) 966 Customer accounts (deposits) 377 260 (3 032) 374 228 — 374 228 Debt securities in issue 6 493 — 6 493 — 6 493 Liabilities arising on securitisation of own originated loans and advances 3 271 — 3 271 — 3 271 Other liabilities 26 281 (9 717) 16 564 — 16 564 Subordinated liabilities 14 445 — 14 445 — 14 445
516 028 (29 580) 486 448 (26 797) 459 651
^ The group enters into derivatives and repurchase and reverse repurchase agreements with various counterparties which are governed by industry standard master netting agreements. The group holds and provides cash and securities collateral in respect of derivatives transactions covered by these agreements. The right to set off balances under these master netting agreements or to set off cash and securities collateral only arises in the event of non-payment or default and, as a result, these arrangements do not qualify for offsetting under IAS 32.
03 Annual financial statements Investec Limitedgroup and company annual financial statements 2021
NOTES TO THE FINANCIAL STATEMENTSCONTINUED
114

Offsetting (continued)Amounts subject to enforceable netting arrangements
Effects of offsetting on balance sheet
Related amounts not
offset ^
At 31 March Gross amounts
Amountsoffset
Netamounts
reported onthe balance
sheet
Financial instruments
(including non-cash collateral) Net amountR’million
Group2020AssetsCash and balances at central banks 36 656 — 36 656 — 36 656 Loans and advances to banks 34 426 (14 890) 19 536 (304) 19 232 Non-sovereign and non-bank cash placements 14 014 — 14 014 — 14 014 Reverse repurchase agreements and cash collateral on securities borrowed* 30 617 (991) 29 626 — 29 626 Sovereign debt securities 64 358 — 64 358 (22 670) 41 688 Bank debt securities 12 265 — 12 265 (1 031) 11 234 Other debt securities 17 337 — 17 337 (2 337) 15 000 Derivative financial instruments 31 711 (14 280) 17 431 (9 381) 8 050 Securities arising from trading activities 16 125 (5 759) 10 366 (1 542) 8 824 Investment portfolio 16 564 — 16 564 — 16 564 Loans and advances to customers 284 308 (2 622) 281 686 — 281 686 Own originated loans and advances to customers securitised 7 192 — 7 192 — 7 192 Other loans and advances 242 — 242 — 242 Other securitised assets 497 — 497 — 497 Other assets 12 800 — 12 800 — 12 800
579 112 (38 542) 540 570 (37 265) 503 305 LiabilitiesDeposits by banks 50 424 (3 591) 46 833 — 46 833 Derivative financial instruments 48 048 (25 579) 22 469 (9 381) 13 088 Other trading liabilities 8 660 — 8 660 — 8 660 Repurchase agreements and cash collateral on securities lent* 27 617 (991) 26 626 (24 824) 1 802 Customer accounts (deposits) 378 078 (2 622) 375 456 — 375 456 Debt securities in issue 7 634 — 7 634 — 7 634 Liabilities arising on securitisation of own originated loans and advances 1 699 — 1 699 — 1 699 Other liabilities 18 873 (5 759) 13 114 — 13 114 Subordinated liabilities 14 383 — 14 383 — 14 383
555 416 (38 542) 516 874 (34 205) 482 669
* An amount of R990.8 million was correctly offset on the balance sheet in the prior year and not disclosed. This has been correctly disclosed in the prior year.
^ The group enters into derivatives and repurchase and reverse repurchase agreements with various counterparties which are governed by industry standard master netting agreements. The group holds and provides cash and securities collateral in respect of derivatives transactions covered by these agreements. The right to set off balances under these master netting agreements or to set off cash and securities collateral only arises in the event of non-payment or default and, as a result, these arrangements do not qualify for offsetting under IAS 32.
03 Annual financial statements Investec Limitedgroup and company annual financial statements 2021
NOTES TO THE FINANCIAL STATEMENTSCONTINUED
115

58. RestatementsIncome statement restatementsInterest income and fee and commission income restatementDuring the year to 31 March 2021, management identified that revenue relating to services rendered to customers (for the facilitation of import and export transactions) was previously reported within interest income rather than within fee and commission income.
As a result, interest income and fee and commission income for the prior year have been restated. The restatement has no impact on total operating income in the income statement, earnings per share (basic and diluted), headline earnings, the statement of cash flows and the balance sheet.
The impact of this change on the 31 March 2020 income statement is:
Year to 31 March 2020
as previously reported Restatement
Year to 31 March 2020
restatedR'million
Interest income 35 949 (270) 35 679 Fee and commission income 6 460 270 6 730
Balance sheet restatementsCurrent taxation assets and other assetsCurrent taxation assets of R43 million (31 March 2020: R45 million), which were previously reported within other assets, are now reported as a separate line item in accordance with IAS 1 Presentation of Financial Statements. The prior year has been re-presented to reflect the same basis.
Software and Other acquired intangible assetsSoftware of R95 million (2020: R149 million), which was previously reported within intangible assets, is now reported as a separate line item. The prior year has been re-presented to reflect the same basis.
Perpetual preference share capital and premiumPerpetual preference share premium of R3 039 million (2020: R3 184 million), which was previously reported within share premium, is now reported within Perpetual preference share capital and premium. The prior year has been re-presented to reflect the same basis.
The re-presentation of software and the perpetual preference share premium was done to provide users enhanced clarity on the values used to calculate net asset values and the various ROE ratios.
Cash flow statement restatementsAs at 31 March 2021, amounts previously reported within loans and advances to banks have been correctly presented as cash and cash equivalents. This change has been made to include items previously reported as loans and advances to banks identified as short term in nature, with a maturity date of less than three months, which therefore meet the definition of cash and cash equivalents. The prior year has been restated as follows:
Year to 31
March 2020as previously
reported Restatement
Year to 31 March 2020
restatedR’million
Cash inflow from operations 9 137 — 9 137 Increase in operating assets (44 072) (2 563) (46 635) Increase in operating liabilities 72 239 — 72 239 Net cash inflow/(outflow) from operating activities 37 304 (2 563) 34 741 Net cash outflow from investing activities (2 826) — (2 826) Net cash outflow from financing activities (8 146) — (8 146) Effects of exchange rate changes on cash and cash equivalents 1 097 — 1 097 Net increase/(decrease) in cash and cash equivalents 27 429 (2 563) 24 866 Cash and cash equivalents at the beginning of the year 32 958 11 119 44 077 Cash and cash equivalents at the end of the year 60 387 8 556 68 943
03 Annual financial statements Investec Limitedgroup and company annual financial statements 2021
NOTES TO THE FINANCIAL STATEMENTSCONTINUED
116

59. Events after the reporting periodThe group owns a 47.4% stake in IEP and accounts for the investment as an interest in associated undertaking by using the equity accounted method. During the year, the group’s share of profit attributable to ordinary shareholders and movements in other comprehensive income was equity accounted for at the 47.4% stake owned by the group. The IEP annual financial statements were completed and signed on 2 June 2021 and in the statement of changes in equity, a direct reduction of ordinary equity was identified of R864 million. The reduction mainly relates to the accounting for disposals and acquisitions of certain subsidiary entities’ equity shares to and from non-controlling shareholders at agreed values. As a result, the excess purchase consideration above consolidated net asset values of the related subsidiaries is recognised as a direct debit against equity (which will be recycled to profit and loss on realisation of the subsidiary). As a result of these transactions, the Investec group had to account for its share in the reduction in equity by reducing the carrying value of IEP investment and by reducing equity by R409 million.
Investec Limited received a dividend of R1.5 billion, from its subsidiary, Investec Bank Limited on 22 June 2021.
The group has also considered the impact of subsequent events that would be considered non-adjusting, such as changes in the key management assumptions detailed in the accounting policies. Despite the uncertainty caused by the COVID-19 pandemic, management is satisfied that there were no such items identified of sufficient significance to warrant additional disclosure. Other than this, management is not aware of any other events after the reporting date as defined by IAS 10 Events after the Reporting Period, that would require the financial statements to be adjusted or which would require additional disclosures.
03 Annual financial statements Investec Limitedgroup and company annual financial statements 2021
NOTES TO THE FINANCIAL STATEMENTSCONTINUED
117

60. Directors' remunerationThe following disclosures are those required by the Companies Act, in respect of remuneration of directors and prescribed officers.
Executive and non-executive directors donated a portion of their remuneration/fees via salary sacrifice during the year to COVID-19 causes including the Solidarity Fund in South Africa.
Single total figure of remuneration
ExecutiveDirectors Year
Fixedremuneration
cash R’000
Taxablebenefits
R’000
Retirementbenefits
R’000
Fixedremuneration
shares R’000
Total fixedremuneration
R’000
Short-termincentive
R’000
Long-termincentive
vested R’000
Value oflong-termincentive
vested due to share price
appreciationR’000
Totalvariable
remunerationR’000
Totalremuneration
R’000
Fani Titi1
2021 19 841 256 704 — 20 801 19 308 — — — 40 109 2020 11 495 225 789 12 509 25 018 — — — — 25 018
NishlanSamujh1
2021 8 768 192 1 301 — 10 261 9 643 — — — 19 904 2020 5 109 207 939 6 255 12 510 — — — — 12 510
David van der Walt2,3
2021 1 835 64 171 2 027 4 097 — — — — 4 097 2020 — — — — — — — — — —
RichardWainwright2,3
2021 10 390 235 683 — 11 308 15 105 — — — 26 413 2020 — — — — — — — — — —
CiaranWhelan2
2021 14 465 491 1 344 — 16 300 15 105 — — — 31 405 2020 — — — — — — — — — —
Remuneration figures for the above table were converted to Rand using the average exchange rate of R21.33 for 2021 and R18.78 for 2020. The above table also includes the remuneration earned in respect of services rendered for the Investec group as a whole.
1. Short-term incentive awards for 2020 for Fani Titi and Nishlan Samujh were rescinded at the recipients’ request to align with their colleagues and the Group’s shareholder’s experience.
2. 2020 remuneration not disclosed for David van der Walt, Richard Wainwright and Ciaran Whelan as they were not executive directors in 2020.3. Pro rata 2021 remuneration disclosed for David van der Walt and Richard Wainwright to reflect the period of the year they were executive directors.
Non-executive directors’ single total remuneration figureThe table below provides a single total remuneration figure for each non-executive director over the financial period.
Name
Total remuneration
2021R’000
Total remuneration
2020R’000
Date of appointmentto the board as
non-executive director
Perry Crosthwaite (chairman) 8 024 8 452 18 June 2010Henrietta Baldock 2 043 1 095 9 August 2019Zarina Bassa1 7 102 5 374 1 November 2014David Friedland1 4 131 4 024 1 March 2013Philip Hourquebie1 4 980 3 854 14 August 2017Charles Jacobs 1 858 1 520 8 August 2014Ian Kantor 558 1 518 26 June 20023
Stephen Koseff2 943 18 144 17 September 2020Lord Malloch-Brown KCMG 2 352 2 216 8 August 2014Khumo Shuenyane 4 437 4 751 8 August 2014Philisiwe Sibiya 2 320 1 398 9 August 2019Total in Pounds Sterling 38 748 52 346
Remuneration figures for the above table were converted to Rand using the average exchange rate of R21.33 for 2021 and R18.78 for 2020. The above table also includes the remuneration earned in respect of services rendered for the Investec group as a whole.
1. Zarina Bassa, David Friedland and Philip Hourquebie - Includes fees received during the financial period for committee work performed from January 2019 to June 2020.
2. Stephen Koseff was appointed as non-independent non-executive director on 17th September 2020, he was an executive director until 8 August 2019 and the 2020 total remuneration figures include all elements of remuneration for him as an executive director.
3. Ian Kantor was a non-independent non-executive director and stood down on 6th August 2020.
Non-executive directors do not receive any additional taxable benefits. On the recommendation of the Nominations and Directors’ Affairs Committee (Nomdac), independent non-executive directors will be appointed for an expected term of nine years (three times three year terms) from the date of their first appointment to the board.
03 Annual financial statements Investec Limitedgroup and company annual financial statements 2021
NOTES TO THE FINANCIAL STATEMENTSCONTINUED
118

60. Directors' remuneration (continued)Statement of directors’ shareholding and share interests Executive directors
Beneficial andnon-beneficial
interestInvestec plc
% of sharesin issue
Investec plc
Beneficial andnon-beneficial
interestInvestec Limited
% of sharesin issue
InvestecLimited
Share-holdings
requirementsmet?1
Name 31 March 2021 1 April 2020 31 March 2021 31 March 2021 1 April 2020 31 March 2021
Fani Titi2 541 970 145 481 0.08% — — 0.00% No2
Nishlan Samujh3 181 844 625 0.03% 230 451 201 080 0.07% No3
David van der Walt 566 907 566 907 0.08% 90 140 90 140 0.03% n/aRichard Wainwright — — 0.00% 830 316 738 650 0.26% YesCiaran Whelan 689 134 512 690 0.10% 437 076 437 076 0.14% YesTotal 1 979 855 1 225 703 0.29 % 1 587 983 1 466 946 0.50 %Non-executive directorsPerry Crosthwaite (Chairman) 115 738 115 738 0.02% — — 0.00% n/a
Henrietta Baldock — — 0.00% — — 0.00% n/aZarina Bassa — — 0.00% — — 0.00% n/aDavid Friedland — — 0.00% — — 0.00% n/aPhilip Hourquebie — — 0.00% — — 0.00% n/aCharles Jacobs — — 0.00% — — 0.00% n/aIan Kantor 9 045 9 045 0.00% 325 325 0.00% n/aStephen Koseff4 3 270 323 6 327 759 0.47% 221 215 537 416 0.07% YesLord Malloch-Brown KCMG — — 0.00% — — 0.00% n/aKhumo Shuenyane 19 900 19 900 0.00% — — 0.00% n/aPhilisiwe Sibiya — — 0.00% — — 0.00% n/aTotal 3 415 006 6 472 442 0.49 % 221 540 537 741 0.07 %
Total 5 394 861 7 698 145 0.78 % 1 809 523 2 004 687 0.57 %
1. The executive directors have a shareholding requirement of 200% of fixed remuneration during employment. Post termination shareholding requirements are also the lower of 200% of fixed remuneration, or the holding on termination for two years post termination. Calculation based on fully vested shares that are detailed within the table above and all other share awards that are no longer subject to performance conditions, as at 31 March 2021.
2. Fani Titi was appointed as an executive director on 1 April 2018 and will be able to build up his shareholdings over a reasonable period of time, particularly taking into account the vesting schedule of shares awarded through the short-term incentive and long-term incentive.
3. Nishlan Samujh was appointed as an executive director on 1 April 2019 and will be able to build up his shareholdings over a reasonable period of time, particularly taking into account the vesting schedule of shares awarded through the short-term incentive and long-term incentive.
4. Stephen Koseff was appointed as non-executive director on 17th September 2020.
Key Management PersonnelIAS 24 “Related party disclosures” requires the following additional information for key management personnel compensation:
Compensation of key management personnel2021
R’0002020R’000
Short-term employee benefits 260 452 242 520 Other long-term employee benefits 96 216 125 717 Share-based payments 62 404 125 789 Total 419 072 494 026
Shareholdings, options and other securities of key management personnel
2021’000
2020’000
Number of options held over Investec plc or Investec Limited ordinary shares under employee share schemes 2 395 4 914
2021’000
2020’000
Number of Investec plc or Investec LimitedOrdinary shares held beneficially and non-beneficially 5 150 4 659
We have defined key management personnel as the executive directors of Investec DLC plus those classified as persons discharging managerial responsibility. In addition to the directors listed in the report, those are Henry Blumenthal, Mark Currie, Marc Kahn, Ruth Leas, Stuart Spencer and Lyndon Subroyen.
03 Annual financial statements Investec Limitedgroup and company annual financial statements 2021
NOTES TO THE FINANCIAL STATEMENTSCONTINUED
119

61. Risk ManagementCredit and counterparty risk managementCredit and counterparty risk description Credit and counterparty risk is defined as the risk arising from an obligor’s (typically a client or counterparty) failure to meet the terms of any agreement. Credit and counterparty risk arises when funds are extended, committed, invested, or otherwise exposed through contractual agreements, whether reflected on- or off-balance sheet.
Credit and counterparty risk arises primarily from three types of transactions:
• Lending transactions, through loans and advances to clients and counterparties, creating the risk that an obligor will be unable or unwilling to repay capital and/or interest on loans and advances granted to them. This category includes bank placements, where we have placed funds with other financial institutions
• Financial instrument transactions, producing issuer risk where payments due from the issuer of a financial instrument may not be received
• Trading transactions, giving rise to settlement and replacement risk (collectively counterparty risk):– Settlement risk is the risk that the settlement of a
transaction does not take place as expected, with one party making required settlements as they fall due but not receiving the performance to which they are entitled
– Replacement risk is the risk following default by the original counterparty resulting in the contract holder having to enter into a replacement contract with a second counterparty in order to fulfil the transaction.
The relevant credit committees will also consider wrong-way risk at the time of granting credit limits to each counterparty. In the banking book environment, wrong-way risk occurs where the value of collateral to secure a transaction, or guarantor, is positively correlated with the probability of default of the borrower or counterparty. For counterparty credit risk resulting from transactions in traded products (such as OTC derivatives), wrong-way risk is defined as exposure to a counterparty that is adversely correlated with the credit quality of that counterparty. It arises when default risk and credit exposure increase together.
Credit and counterparty risk may also arise in other ways and it is the role of the risk management functions and the various independent credit committees to identify risks falling outside these definitions.
Credit and counterparty risk governance structureTo manage, measure, monitor and mitigate credit and counterparty risk, independent credit committees exist in South Africa as well as other relevant jurisdictions such as Mauritius. These committees also have oversight of regions where we assume credit risk and operate under board-approved delegated limits, policies and procedures. There is a level of executive involvement and oversight in the credit decision-making forums depending on the size and complexity of the deal. It is our policy that all credit committees comprise voting members who are independent of the originating business unit. All decisions to enter into a transaction are based on unanimous consent.
In addition to the credit committees, the following processes assist in managing, measuring and monitoring credit and counterparty risk:
• Day-to-day arrears management and regular arrears reporting ensure that individual positions and any potential trends are dealt with in a timely manner
• Watchlist Forums and the Arrears, Default and Recovery (ADR) Forums review the management of distressed loans, potential problem loans and exposures in arrears that require additional attention and supervision. These committees review ECL impairments and staging at an asset level as well as potential fair value adjustments to loans and advances to customers. They provide recommendations for the appropriate staging and level of ECL impairment where appropriate
• Impairment Decision Committee (IDC) reviews recommendations from underlying Watchlist Forums and ADR Forums respectively and consider and approve the appropriate level of ECL impairments and staging
• The Model Review Forum provides an internal screening and validation process for credit models. We have established independent model validation teams who review the models and provide feedback on the accuracy and operation of the models and note items for further development through the forum.
Credit committees and the processes above have incorporated considerations and decisions with respect to the COVID-19 pandemic and resulting relief measures, staging and ECL in line with the group's existing governance.
Management and measurement of credit and counterparty riskFundamental principles employed in the management of credit and counterparty risk include:
• A clear definition of our target market• A quantitative and qualitative assessment of the
creditworthiness of our counterparties• Analysis of risks, including concentration risk (concentration
risk considerations include asset class, industry, counterparty and geographical concentration)
• Decisions being made with reference to risk appetite limits• Prudential limits• Regular monitoring and review of existing and potential
exposures once facilities have been approved• A high level of executive involvement in decision-making
with non-executive review and oversight through DLC BRCC and Large Exposure Committee.
• Portfolio reviews and stress testing.
Within the credit approval process, internal and external ratings are included in the assessment of client quality.
A large proportion of the group’s portfolio is not rated by external rating agencies. We place reliance upon internal consideration of counterparties and borrowers and use ratings prepared externally where available to support our decision-making process.
Regular reporting of credit and counterparty risk exposures within our operating units are made to management, the executives and the board through DLC BRCC. The board reviews and approves the appetite for credit and counterparty risk, which is documented in risk appetite statements and policy documents. This is implemented and reviewed by the credit risk management teams.
Portfolio reviews and stress testing are undertaken on all material businesses, where the exposures are analysed to assess any migration in portfolio quality, highlight any vulnerabilities, identify portfolio concentrations and make appropriate recommendations, such as a reduction in risk appetite limits or specific exposures.
03 Annual financial statements Investec Limitedgroup and company annual financial statements 2021
NOTES TO THE FINANCIAL STATEMENTSCONTINUED
120

61. Risk Management (continued)Credit risk mitigationCredit risk mitigation techniques can be defined as all methods by which the group seeks to decrease the credit risk associated with an exposure. The group considers credit risk mitigation techniques as part of the credit assessment of a potential client or business proposal and not as a separate consideration of mitigation of risk. Credit risk mitigants can include any collateral item over which the group has a charge over assets, netting and margining agreements, covenants, or terms and conditions imposed on a borrower with the aim of reducing the credit risk inherent to that transaction.
As the group has limited appetite for unsecured debt, the credit risk mitigation technique most commonly used is the taking of collateral, with a strong preference for tangible assets. Collateral is assessed with reference to the sustainability of value and the likelihood of realisation.
Acceptable collateral generally exhibits characteristics that allow for it to be easily identified and appropriately valued and assists the bank to recover outstanding exposures.
Where a transaction is supported by a mortgage or charge over property, the primary credit risk is still taken on the borrower. In addition, the relevant credit committee normally requires a suretyship or guarantee in support of a transaction in our private client business.
For property-backed lending we also consider the client's overall balance sheet. The following characteristics of the property are also considered: the type of property; its location; and the ease with which the property could be relet and/or resold. Where the property is secured by lease agreements, the credit committee prefers not to lend for a term beyond the maximum term of the lease. Commercial real estate generally takes the form of good quality property often underpinned by strong third party leases. Residential property is also generally of a high quality and based in desirable locations. Residential and commercial property valuations will continue to form part of our ongoing focus on collateral assessment. It is our policy to obtain a formal valuation of every commercial property offered as collateral for a lending facility before advancing funds. Residential properties are valued by desktop valuation and/or approved valuers, where appropriate.
Other common forms of collateral in the retail asset class are motor vehicles, cash and share portfolios. Primary collateral in private client lending transactions can also include a high net worth individual’s share/investment portfolio. This is typically in the form of a diversified pool of equity, fixed income, managed funds and cash. Often these portfolios are managed by Investec Wealth & Investment. Lending against investment portfolios is typically geared at conservative loan-to-value (LTV) ratios, after considering the quality, diversification, risk profile and liquidity of the portfolio..
Our corporate, government and institutional clients provide a range of collateral including cash, corporate assets, debtors (accounts receivable), trading stock, debt securities (bonds), listed and unlisted shares and guarantees.
The majority of credit mitigation techniques linked to trading activity is in the form of netting agreements and daily margining. Primarily, the market standard legal documents that govern this include the International Swaps and Derivatives Association (ISDA) Master Agreements, Global Master Securities Lending Agreement (GMSLA) and Global Master Repurchase Agreement (GMRA). In addition to having ISDA documentation in place with market and trading counterparties in over-the-counter (OTC) derivatives, the credit committee may require a Credit Support Annex (CSA) to ensure that mark-to-market credit exposure is mitigated daily through the calculation and placement/receiving of cash collateral. Where netting agreements have been signed, the enforceability is supported by an external legal opinion within the legal jurisdiction of the agreement.
Set-off is applied between assets, subject to credit risk and related liabilities in the annual financial statements, where:
• A legally enforceable right to set-off exists• There is the intention to settle the asset and liability on a net
basis, or to realise the asset and settle the liability simultaneously.
In addition to the above accounting set-off criteria, banking regulators impose the following additional criteria:
• Debit and credit balances relate to the same obligor/counterparty
• Debit and credit balances are denominated in the same currency and have identical maturities
• Exposures subject to set-off are risk-managed on a net basis
• Market practice considerations.For this reason, there will be instances where credit and counterparty exposures are displayed on a net basis in these annual financial statements but reported on a gross basis to regulators.
Further information on credit derivatives is provided on page 136.
The group implements robust processes to minimise the possibility of legal and/or operational risk through good quality tangible collateral. The legal risk function ensures the enforceability of credit risk mitigants within the laws applicable to the jurisdictions in which the group operates. When assessing the potential concentration risk in its credit portfolio, consideration is given to the types of collateral and credit protection that form part of the portfolio.
03 Annual financial statements Investec Limitedgroup and company annual financial statements 2021
NOTES TO THE FINANCIAL STATEMENTSCONTINUED
121

61. Risk Management (continued)An analysis of gross core loans, asset quality and ECLThe tables that follow provide information with respect to the asset quality of our gross core loans.
Asset quality metrics reflect the solid performance of core loans for the year ended 31 March 2021. The group reported a credit loss ratio of at 0.18% at 31 March 2021 from the 0.36% reported at 31 March 2020 as the portfolio benefited from better than expected recoveries.
Gross core loans decreased by 0.8% due to lower originations during the year under review coupled with repayments, mainly in the corporate portfolio. Stage 2 exposures remain relatively flat at 5.2% of gross core loans subject to ECL at 31 March 2021 (31 March 2020: 5.3%), albeit reduced from 6.4% at 30 September 2020.The Stage 3 increase to 2.6% of gross core loans subject to ECL is attributable to a few single name exposures that are adequately provided for.
Overall coverage for Stage 1 and Stage 2 remains flat year on year at 0.5% for 31 March 2021. Stage 3 coverage decreased to 17.9% (31 March 2020: 42.2%) due to the write-off of certain exposures.
R’million 31 March 2021 31 March 2020
Loans and to customers per the balance sheet 279 131 281 686 Add: Own originated loans and advances to customers per the balance sheet 8 184 7 192 Net core loans 287 315 288 878
of which subject to ECL* 285 739 286 494 Net core loans at amortised cost 263 451 265 792 Net fixed rate loans designated at FVPL (on which ECL is calculated for management purposes)* 22 288 20 702 of which FVPL (excluding fixed rate loans above) 1 576 2 384 Add: ECL 2 729 3 360
Gross core loans 290 044 292 238 of which subject to ECL* 288 468 289 854 of which FVPL (excluding fixed rate loans above) 1 576 2 384
R’million 31 March 2021 31 March 2020
Gross core loans subject to ECL 288 468 289 854 Stage 1 266 061 270 105 Stage 2 14 969 15 289
of which past due greater than 30 days 272 1 297 Stage 3 7 438 4 460ECL (2 729) (3 360) Stage 1 (985) (1 057)Stage 2 (416) (423)Stage 3 (1 328) (1 880)Coverage ratioStage 1 0.37% 0.39% Stage 2 2.8% 2.8% Stage 3 17.9% 42.2% Credit loss ratio 0.18% 0.36% ECL impairment charges on core loans (520) (1 021)Average gross core loans subject to ECL 289 161 280 856An analysis of Stage 3 gross core loans subject to ECLStage 3 net of ECL 6 110 2 580Aggregate collateral and other credit enhancements on Stage 3 8 253 2 696Stage 3 as a % of gross core loans subject to ECL 2.6% 1.5% Total ECL as a % of Stage 3 exposure 36.7% 75.3% Stage 3 net of ECL as a % of net core loans subject to ECL 2.1% 0.9%
* Includes portfolios for which ECL is not required for IFRS purposes, but for which management evaluates on this basis. These are fixed rate loans which have passed the SPPI and are held in a business model to collect contractual cash flows but have been designated at FVPL to eliminate accounting mismatches (interest rate risk is being economically hedged). The underlying loans have been fair valued and management performs an ECL calculation in order to obtain a reasonable estimate of the credit risk component. The portfolio is managed on the same basis as gross core loans measured at amortised cost. The drawn (R22 billion) exposure falls predominantly into Stage 1 (consistent throughout the period) (31 March 2020: R21 billion). The ECL on the portfolio is R105 million (31 March 2020: R67 million).
03 Annual financial statements Investec Limitedgroup and company annual financial statements 2021
NOTES TO THE FINANCIAL STATEMENTSCONTINUED
122

61. Risk Management (continued)An analysis of staging and ECL movements for core loans subject to ECLThe table below indicates underlying movements in gross core loans subject to ECL from 31 March 2020 to 31 March 2021.
Stage 1 Stage 2 Stage 3 Total
R’millionGross
exposure ECLGross
exposure ECLGross
exposure ECLGross
exposure ECL
At 31 March 2019 257 297 (538) 10 768 (441) 3 794 (1 722) 271 859 (2 701) Transfer from Stage 1 (10 059) 19 8 156 (15) 1 903 (4) — — Transfer from Stage 2 4 386 (59) (4 878) 69 492 (10) — — Transfer from Stage 3 384 (35) 60 (9) (444) 44 — — ECL remeasurement arising from transfer of stage — 80 — 59 — (879) — (740) New lending net of repayments (includes assets written off) 17 241 (34) 1 145 (1) (1 292) 757 17 094 722 Changes to risk parameters and models — (488) — (85) — (57) — (630) Foreign exchange and other 856 (2) 38 — 7 (9) 901 (11)
At 31 March 2020 270 105 (1 057) 15 289 (423) 4 460 (1 880) 289 854 (3 360) Transfer from Stage 1 (9 235) 36 7 801 (28) 1 434 (8) — — Transfer from Stage 2 4 883 (83) (7 550) 227 2 667 (144) — — Transfer from Stage 3 256 (29) 56 (13) (312) 42 — — ECL remeasurement arising from transfer of stage — 88 — (103) — (289) — (304) New lending net of repayments (includes assets written off) 2 662 45 (479) 44 (786) 1 015 1 397 1 104 Changes to risk parameters and models — — — (120) — (74) — (194) Foreign exchange and other (2 610) 15 (148) — (25) 10 (2 783) 25
At 31 March 2021 266 061 (985) 14 969 (416) 7 438 (1 328) 288 468 (2 729)
03 Annual financial statements Investec Limitedgroup and company annual financial statements 2021
NOTES TO THE FINANCIAL STATEMENTSCONTINUED
123

61. Risk Management (continued)An analysis of credit quality by internal rating gradeThe group uses a 25-grade internal rating scale which measures the risk of default to an exposure without taking into account any credit mitigation, such as collateral. This internal rating scale allows the group to measure credit risk consistently across portfolios. The internal rating scale is derived from a mapping to PDs and can also be mapped to external rating agency scales.
PD range Investec internal rating scale Indicative external rating scale
less than 0.538% IB01 – IB12 AAA to BBB- 0.538% – 6.089% IB13 – IB19 BB+ to B-
greater than 6.089% IB20 – IB25 B- and belowStage 3 D
The internal credit rating distribution below is based on the 12-month PD at 31 March 2021 for gross core loans subject to ECL by stage. The staging classifications are not only driven by the absolute PD, but on factors that determine a significant increase in credit risk, including relative movement in PD since origination. There is therefore no direct correlation between the credit quality of an exposure and its stage classification as shown in the table below:
At 31 March 2021R’million IB01 – IB12 IB13 – IB19 IB20 – IB25 Stage 3 Total
Gross core loans subject to ECL 113 764 152 999 14 267 7 438 288 468 Stage 1 113 140 141 319 11 602 — 266 061 Stage 2 624 11 680 2 665 — 14 969 Stage 3 — — — 7 438 7 438 ECL (155) (856) (390) (1 328) (2 729) Stage 1 (92) (647) (246) — (985) Stage 2 (63) (209) (144) — (416) Stage 3 — — — (1 328) (1 328) Coverage ratio 0.1% 0.6% 2.7% 17.9% 0.9%
At 31 March 2020R’million IB01 – IB12 IB13 – IB19 IB20 – IB25 Stage 3 Total
Gross core loans subject to ECL 115 198 152 306 17 890 4 460 289 854 Stage 1 113 767 142 636 13 702 — 270 105 Stage 2 1 431 9 670 4 188 — 15 289 Stage 3 — — — 4 460 4 460 ECL (380) (664) (436) (1 880) (3 360) Stage 1 (322) (525) (210) — (1 057) Stage 2 (58) (139) (226) — (423) Stage 3 — — — (1 880) (1 880) Coverage ratio 0.3% 0.4% 2.4% 42.2% 1.2%
In the prior year, the disclosure of the exposure by stage and rating bucket was done by using the one-year point-in-time PDs and converted to ratings by mapping from a PD master scale. This application resulted in the following disclosure at 31 March 2020:
At 31 March 2020R’million IB01-IB12 IB13-IB19 IB20-IB25 Stage 3 Total
Gross core loans subject to ECL 128 099 145 509 11 786 4 460 289 854 Stage 1 121 712 137 446 10 947 — 270 105 Stage 2 6 387 8 063 839 — 15 289 Stage 3 — — — 4 460 4 460 ECL (237) (967) (276) (1 880) (3 360) Stage 1 (98) (793) (166) — (1 057) Stage 2 (139) (174) (110) — (423) Stage 3 — — — (1 880) (1 880) Coverage ratio 0.2% 0.7% 2.3% 42.2% 1.2%
03 Annual financial statements Investec Limitedgroup and company annual financial statements 2021
NOTES TO THE FINANCIAL STATEMENTSCONTINUED
124

61. Risk Management (continued)An analysis of core loans by risk category – Lending collateralised by propertyClient quality and expertise are at the core of our credit philosophy. We provide senior debt and other funding for property transactions, with a strong preference for income producing assets supported by an experienced sponsor providing a material level of cash equity investment into the asset. Our exposure to the property market is well diversified with strong bias towards prime locations for residential exposure and focus on tenant quality and income diversity for commercial assets. Debt service cover ratios are a key consideration in the lending process supported by reasonable loan-to-security value ratios.
Gross core loans at amortised cost and FVPL (subject to ECL)
Gross core loans
at FVPL (not
subject to ECL)
Gross core loans
Stage 1 Stage 2 Stage 3 Total
R’millionGross
exposure ECLGross
exposure ECLGross
exposure ECLGross
exposure ECL
At 31 March 2021Commercial real estate 46 387 (227) 2 816 (78) 2 197 (262) 51 400 (567) — 51 400 Commercial real estate – investment 42 281 (202) 2 704 (77) 2 182 (256) 47 167 (535) — 47 167 Commercial real estate – development 3 404 (22) 49 (1) — — 3 453 (23) — 3 453 Commercial vacant land and planning 702 (3) 63 — 15 (6) 780 (9) — 780 Residential real estate 7 706 (29) 229 (6) 105 (22) 8 040 (57) — 8 040 Residential real estate – investment 3 792 (11) — — 96 (19) 3 888 (30) — 3 888 Residential real estate – development 3 189 (15) 226 (6) — — 3 415 (21) — 3 415 Residential vacant land and planning 725 (3) 3 — 9 (3) 737 (6) — 737 Total lending collateralised by property 54 093 (256) 3 045 (84) 2 302 (284) 59 440 (624) — 59 440 Coverage ratio 0.47% 2.8% 12.3% 1.0% At 31 March 2020^Commercial real estate 49 619 (336) 1 315 (4) 543 (100) 51 477 (440) — 51 477 Commercial real estate – investment 44 404 (311) 1 305 (4) 542 (99) 46 251 (414) — 46 251 Commercial real estate – development 4 369 (21) — — — — 4 369 (21) — 4 369 Commercial vacant land and planning 846 (4) 10 — 1 (1) 857 (5) — 857 Residential real estate 7 076 (59) 51 (2) 20 (10) 7 147 (71) — 7 147 Residential real estate – investment 3 102 (26) 3 102 (26) — 3 102 Residential real estate – development 3 353 (24) 31 — — — 3 384 (24) — 3 384 Residential vacant land and planning 621 (9) 20 (2) 20 (10) 661 (21) — 661 Total lending collateralised by property 56 695 (395) 1 366 (6) 563 (110) 58 624 (511) — 58 624 Coverage ratio 0.70% 0.4% 19.5% 0.9%
^ During the current financial year, the risk appetite classifications were reviewed and, where necessary, amended to ensure that the classifications align with how the underlying portfolios and associated credit risk is managed and that they are consistent with the risk appetite framework and the internal risk management approach of the bank.
03 Annual financial statements Investec Limitedgroup and company annual financial statements 2021
NOTES TO THE FINANCIAL STATEMENTSCONTINUED
125

61. Risk Management (continued)An analysis of core loans by risk category – High net worth and other private client lendingOur private banking activities target high net worth individuals, active wealthy entrepreneurs, high-income professionals, newly qualified professionals with high-income earning potential, self-employed entrepreneurs, owner managers in small to mid-cap corporates and sophisticated investors.
Lending products are tailored to meet the requirements of our clients and deliver solutions to enable target clients to create and manage their wealth. Central to our credit philosophy is ensuring the sustainability of cash flow and income throughout the cycle. As such, the client base has been defined to include high net worth clients (who, through diversification of income streams, should reduce income volatility) and individuals in defined professions which have historically supported a sustainable income base, irrespective of the stage in the economic cycle.
Credit risk arises from the following activities:
• Mortgages: provides residential mortgage loan facilities to high-income professionals and high net worth individuals.• High net worth and specialised lending: provides credit facilities to high net worth individuals and their controlled entities as
well as portfolio loans to high net worth clients against their investment portfolios typically managed by Investec Wealth & Investment.
Gross core loans at amortised cost and FVPL (subject to ECL)
Gross core
loans at FVPL (not
subject to ECL)
Gross core loans
Stage 1 Stage 2 Stage 3 Total
R’millionGross
exposure ECLGross
exposure ECLGross
exposure ECLGross
exposure ECL
At 31 March 2021Mortgages 76 604 (133) 3 632 (134) 1 391 (318) 81 627 (585) — 81 627 High net worth and specialised lending 65 295 (261) 1 063 (20) 1 471 (324) 67 829 (605) — 67 829 Total high net worth and other private client lending 141 899 (394) 4 695 (154) 2 862 (642) 149 456 (1 190) — 149 456 Coverage ratio 0.28% 3.3% 22.4% 0.8% At 31 March 2020^Mortgages 74 040 (68) 2 454 (56) 1 204 (290) 77 698 (414) — 77 698 High net worth and specialised lending 65 682 (261) 2 061 (126) 499 (421) 68 242 (808) — 68 242 Total high net worth and other private client lending 139 722 (329) 4 515 (182) 1 703 (711) 145 940 (1 222) — 145 940 Coverage ratio 0.24% 4.0% 41.7% 0.8%
^ During the current financial year, the risk appetite classifications were reviewed and, where necessary, amended to ensure that the classifications align with how the underlying portfolios and associated credit risk is managed and that they are consistent with the risk appetite framework and the internal risk management approach of the bank.
03 Annual financial statements Investec Limitedgroup and company annual financial statements 2021
NOTES TO THE FINANCIAL STATEMENTSCONTINUED
126

61. Risk Management (continued)An analysis of core loans by risk category – Corporate and other lendingWe focus on traditional client-driven corporate lending activities. The credit risk management functions approve specific credit and counterparty limits that govern the maximum credit exposure to each individual counterparty. In addition, further risk management limits exist through industry and country limits to manage concentration risk. The credit appetite for each counterparty is based on the financial strength of the principal borrower, its business model and market positioning, the underlying cash flow to the transaction, the substance and track record of management, and the security package. Political risk insurance, and other insurance is taken where deemed appropriate.The group has limited appetite for unsecured credit risk and facilities are typically secured on the assets of the underlying borrower as well as shares in the borrower.
A summary of the nature of the lending and/or credit risk assumed within some of the key areas within our corporate lending business is provided below:
• Corporate and acquisition finance: provides senior secured loans to proven management teams and sponsors. Credit risk is assessed against debt serviceability based upon robust cash generation of the business demonstrated by both historical and forecast information. We typically act as transaction lead arranger or on a club or bilateral basis, and have a close relationship with management and sponsors
• Fund finance: provides debt facilities to asset managers and fund vehicles, principally in private equity. The geographical focus is mainly UK, USA, Europe and Africa where the group can support experienced asset managers and their funds which show strong, long-term value creation and good custodianship of investors’ money. Debt facilities are typically to a fund entity and secured against undrawn limited partner commitments and/or the underlying assets
• Financial institutions and governments: provides senior secured loans to financial institutions or government backed entities where credit risk is assessed against debt serviceability or mitigated by government guarantees
• Small ticket asset finance: provides funding to small- and medium-sized corporates to support asset purchases and other business requirements. The portfolio is highly diversified by industry and number of clients and is secured against the asset being financed
• Large ticket asset finance: provides the finance and structuring expertise for aircraft and larger lease assets, the majority of which are senior secured loans with a combination of corporate, cash flow and asset-backed collateral against the exposure
• Power and infrastructure finance: arranges and provides typically long-term financing for power and infrastructure assets, in particular renewable and traditional power projects as well as transportation assets, typically against contracted future cash flows of the project(s) from well-established and financially sound off-take counterparties. There is a requirement for a strong upfront equity contribution from an experienced sponsor.
03 Annual financial statements Investec Limitedgroup and company annual financial statements 2021
NOTES TO THE FINANCIAL STATEMENTSCONTINUED
127

61. Risk Management (continued)
Gross core loans at amortised costand FVPL (subject to ECL)
Gross core
loans atFVPL (not
subjectto ECL)
Grosscoreloans
Stage 1 Stage 2 Stage 3 Total
R’millionGross
exposure ECLGross
exposure ECLGross
exposure ECLGross
exposure ECL
At 31 March 2021Corporate and acquisition finance 46 429 (217) 6 425 (160) 1 717 (339) 54 571 (716) 1 576 56 147 Fund finance 7 624 (29) — — — — 7 624 (29) — 7 624 Other corporate and financial institutions and governments 3 355 (4) 156 (4) 3 — 3 514 (8) — 3 514 Asset finance 6 396 (71) 219 (11) 554 (63) 7 169 (145) — 7 169 Small ticket asset finance 4 127 (48) 219 (11) 506 (40) 4 852 (99) — 4 852 Large ticket asset finance 2 269 (23) — — 48 (23) 2 317 (46) — 2 317 Power and infrastructure finance 6 265 (14) 429 (3) — — 6 694 (17) — 6 694 Resource finance — — — — — — — — — — Total corporate and other lending 70 069 (335) 7 229 (178) 2 274 (402) 79 572 (915) 1 576 81 148 Coverage ratio 0.48% 2.5% 17.7% 1.1% At 31 March 2020^Corporate and acquisition finance 45 713 (252) 7 391 (220) 1 838 (535) 54 942 (1 007) 1 780 56 722 Fund finance 8 408 (26) — — — — 8 408 (26) — 8 408 Other corporate and financial institutions and governments 6 068 (6) 234 (1) — — 6 302 (7) — 6 302 Asset finance 8 030 (35) 203 (3) 356 (524) 8 589 (562) 604 9 193 Small ticket asset finance 4 850 (25) 203 (3) 356 (524) 5 409 (552) 604 6 013 Large ticket asset finance 3 180 (10) — — — — 3 180 (10) — 3 180 Power and infrastructure finance 5 430 (14) 1 481 (11) — — 6 911 (25) — 6 911 Resource finance 39 — 99 — — — 138 — — 138 Total corporate and other lending 73 688 (333) 9 408 (235) 2 194 (1 059) 85 290 (1 627) 2 384 87 674 Coverage ratio 0.45% 2.5% 48.3% 1.9%
^ During the current financial year, the risk appetite classifications were reviewed and, where necessary, amended to ensure that the classifications align with how the underlying portfolios and associated credit risk is managed and that they are consistent with the risk appetite framework and the internal risk management approach of the bank.
03 Annual financial statements Investec Limitedgroup and company annual financial statements 2021
NOTES TO THE FINANCIAL STATEMENTSCONTINUED
128

61. Risk Management (continued)The tables that follow provide an analysis of the bank’s gross credit and counterparty exposures.
An analysis of gross credit and counterparty exposuresR'million 31 March 2021 31 March 2020
Cash and balances at central banks 9 275 36 390 Loans and advances to banks 26 986 19 540 Non-sovereign and non-bank cash placements 9 005 14 045 Reverse repurchase agreements and cash collateral on securities borrowed 30 757 29 627 Sovereign debt securities 53 014 64 362 Bank debt securities 21 865 12 270 Other debt securities 14 155 17 348 Derivative financial instruments 15 477 16 256 Securities arising from trading activities 2 828 1 484 Loans and advances to customers 281 835 285 030 Own originated loans and advances to customers securitised 8 209 7 208 Other loans and advances 205 267 Other assets — 1 773 Total on-balance sheet exposures 473 611 505 600 Guarantees 14 903 17 313 Committed facilities related to loans and advances to customers 64 358 56 024 Contingent liabilities, letters of credit and other 7 525 9 380 Total off-balance sheet exposures 86 786 82 717 Total gross credit and counterparty exposures 560 397 588 317
03 Annual financial statements Investec Limitedgroup and company annual financial statements 2021
NOTES TO THE FINANCIAL STATEMENTSCONTINUED
129

61. Risk Management (continued)A further analysis of our gross credit and counterparty exposuresThe table below indicates in which class of asset (on the face of the consolidated balance sheet) credit and counterparty exposures are reflected. Not all assets included in the balance sheet bear credit and counterparty risk.
At 31 March 2021
Total grosscredit and
counterpartyexposure
of whichFVPL
of whichamortised
cost andFVOCI ECL^
Assets thatwe deem
to have nolegal credit
exposureTotal
assetsR’million
Cash and balances at central banks 9 275 — 9 275 — 378 9 653 Loans and advances to banks 26 986 — 26 986 (3) — 26 983 Non-sovereign and non-bank cash placements 9 005 23 8 982 (49) — 8 956 Reverse repurchase agreements and cash collateral on securities borrowed 30 757 12 477 18 280 (1) — 30 756 Sovereign debt securities 53 014 3 266 49 748 (55) — 52 959 Bank debt securities 21 865 288 21 577 (9) — 21 856 Other debt securities 14 155 60 14 095 (23) — 14 132 Derivative financial instruments 15 477 15 477 — — 3 709 19 186 Securities arising from trading activities 2 828 2 828 — — 12 374 15 202 Investment portfolio — — — — 15 131* 15 131 Loans and advances to customers 281 835 23 969 257 866 (2 704) — 279 131 Own originated loans and advances to customers securitised 8 209 — 8 209 (25) — 8 184 Other loans and advances 205 — 205 (24) — 181 Other securitised assets — — — — 578^^ 578 Interest in associated undertakings — — — — 5 215 5 215 Deferred taxation assets — — — — 2 767 2 767 Other assets — — — — 16 368** 16 368 Property and equipment — — — — 2 942 2 942 Investment properties — — — — 16 942 16 942 Goodwill — — — — 212 212 Other acquired intangible assets — — — — 116 116 Software — — — — 97 97 Other financial instruments at FVPL in respect of liabilities to customers — — — — 1 067 1 067 Non-current assets classified as held for resale — — — — 1 054 1 054 Total on-balance sheet exposures 473 611 58 388 415 223 (2 893) 78 950 549 668 Guarantees 14 903 — 14 903 (5) 1 024 15 922 Committed facilities related to loans and advances to customers 64 358 — 64 358 (69) — 64 289 Contingent liabilities, letters of credit and other 7 525 3 521 4 004 — 22 887 30 412 Total off-balance sheet exposures 86 786 3 521 83 265 (74) 23 911 110 623 Total exposures 560 397 61 909 498 488 (2 967) 102 861 660 291
^ Includes R72 million ECL held against financial assets held at FVOCI, which is reported on the balance sheet within the fair value reserve. This will result in minor differences between certain balance sheet lines reported above (largely sovereign debt securities) and the statutory balance sheet.
* Largely relates to exposures that are classified as investment risk in the banking book.^^ Largely cash in securitised vehicles.** Other assets include settlement debtors which we deem to have no credit risk exposure as they are settled on a delivery against payment basis.
03 Annual financial statements Investec Limitedgroup and company annual financial statements 2021
NOTES TO THE FINANCIAL STATEMENTSCONTINUED
130

61. Risk Management (continued)A further analysis of our gross credit and counterparty exposures (continued)
At 31 March 2020
Total gross credit and
counterparty exposure
of whichFVPL
of which amortised
cost and FVOCI ECL^
Assets that we deem
to have no legal credit
exposureTotal
assetsR’million
Cash and balances at central banks 36 390 — 36 390 (1) 267 36 656 Loans and advances to banks 19 540 — 19 540 (4) — 19 536 Non-sovereign and non-bank cash placements 14 045 545 13 500 (31) — 14 014 Reverse repurchase agreements and cash collateral on securities borrowed 29 627 18 249 11 378 (1) — 29 626 Sovereign debt securities 64 362 6 883 57 479 (39) — 64 323 Bank debt securities 12 270 289 11 981 (11) — 12 259 Other debt securities 17 348 3 736 13 612 (18) — 17 330 Derivative financial instruments 16 256 16 256 — — 1 175 17 431 Securities arising from trading activities 1 484 1 484 — — 8 882 10 366 Investment portfolio — — — — 16 564 16 564 Loans and advances to customers 285 030 23 153 261 877 (3 344) — 281 686 Own originated loans and advances to customers securitised 7 208 — 7 208 (16) — 7 192 Other loans and advances 267 — 267 (25) — 242 Other securitised assets — — — — 497 497 Interest in associated undertakings — — — — 6 924 6 924 Deferred taxation assets — — — — 2 996 2 996 Other assets 1 773 — 1 773 (1) 11 073 12 845 Property and equipment — — — — 3 093 3 093 Investment properties — — — — 19 137 19 137 Goodwill — — — — 219 219 Intangible assets — — — — 318 318 Other financial instruments at FVPL in respect of liabilities to customers — — — 780 780 Non-current assets classified as held for resale — — — 1 305 1 305 Total on-balance sheet exposures 505 600 70 595 435 005 (3 491) 73 230 575 339 Guarantees 17 313 — 17 313 (16) 978 18 275 Committed facilities related to loans and advances to customers 56 024 — 56 024 (48) — 55 976 Contingent liabilities, letters of credit and other 9 380 4 642 4 738 — 14 993 24 373 Total off-balance sheet exposures 82 717 4 642 78 075 (64) 15 971 98 624 Total exposures 588 317 75 237 513 080 (3 555) 89 201 673 963
^ Includes R48 million ECL held against financial assets held at FVOCI, which is reported on the balance sheet within the fair value reserve. This will result in minor differences between certain balance sheet lines reported above (largely sovereign debt securities) and the statutory balance sheet.
* Largely relates to exposures that are classified as investment risk in the banking book.^^ Largely cash in securitised vehicles.** Other assets include settlement debtors which we deem to have no credit risk exposure as they are settled on a delivery against payment basis.
03 Annual financial statements Investec Limitedgroup and company annual financial statements 2021
NOTES TO THE FINANCIAL STATEMENTSCONTINUED
131

61. Risk Management (continued)Key judgements at 31 March 2021The expected impact from COVID-19, as well as the offsetting effect of government relief measures, has required significant judgement. Regulatory bodies provided guidance on expectations around provisioning and staging treatment of exposures. The forward-looking macro-economic scenarios used in the measurement of ECL were updated to capture the impacts of the sovereign downgrade by Moody’s to sub-investment grade as well as the impact of COVID-19. Management performed extensive benchmarking of credit loss ratios, macro-economic scenarios applied and the coverage ratios against South African banks. It was concluded that the ECL position appeared reasonable in comparison to industry peers.
A management ECL overlay of R290 million (31 March 2020: R190 million) was raised for the Private Bank portfolio to account for the unique nature of the COVID-19 pandemic and the impact on the South African economy. Specifically, the management ECL overlay accounts for emerging risks identified for certain categories of borrowers within the commercial real estate and mortgage portfolios. Management believes that these risks are not adequately represented by the historic data used to populate the ECL models. The management ECL overlay was calculated with reference to published market data that best represents the possible exposure to these emerging risks. The management ECL overlay was estimated after stressing the PD and loss given default (LGD) of the relevant credit exposures. In line with our previous approach Stage 3 ECLs continued to be assessed using expert credit judgement.
Given the fast-changing nature of the COVID-19 pandemic and the government measures announced, we will continue to review and refine our approach to calculate the overlay given the evolving situation and significant uncertainty faced with respect to the economic outlook.
Forward-looking macro-economic scenariosThe measurement of ECL also requires the use of multiple economic scenarios to calculate a probability weighted forward-looking estimate. These scenarios are updated at least twice a year, or more frequently if there is a macro-economic shock or significant shift in expectations. The weighting of these scenarios for IFRS 9 as well as the scenarios themselves are discussed and presented at the relevant BRCCs as well as the relevant capital committees, which form part of the principal governance framework for macro-economic scenarios.A number of forecast economic scenarios are considered for capital planning, stress testing (including Investec-specific stress scenarios) and IFRS 9.
For Investec Limited, five macro-economic scenarios were used in the measurement of ECL. These scenarios incorporate a base case, two upside cases and two downside cases. The aim of this economic scenario generation process was to provide a view of the current and projected state of the South African economy and the different economic scenarios that could occur in various stressed or improved environments over the next five years for a number of identified variables/risk drivers.
As at 31 March 2021 all five scenarios were updated to incorporate the latest available data, although it should be noted that the impact of the COVID-19 pandemic has been severe and unprecedented and South Africa’s economy has still not recovered to its production levels pre-pandemic. The deep scarring is likely to be persistent until 2024 in real terms.
The base case is characterised by the view that South Africa's economic recovery continues out to 2024 (in real terms) in order to reach pre-pandemic levels of production, as COVID-19 is overcome at a modest pace. Underpinning this view is that the global economic recovery continues over the period, supported by sufficient monetary and other policy supports in key advanced economies and market risk sentiment is neutral to somewhat risk on. However, the sharp deterioration last year in South Africa’s government finances has resulted in further credit rating downgrades, although a degree of fiscal consolidation is expected over the medium term. As a consequence, the base case sees South Africa retain a country rating from Moody’s that is one of the three grades in the BB (Ba) category – currently Moody's rates South Africa Ba2 (BB-). Expropriation of private sector property without compensation is expected to be limited and not have a negative impact on the economy or on market sentiment. As at 31 March 2020, the weighting of the base case was 43%, but at 31 March 2021 the scenario weighting of the base case was revised up to 48% due to the improved outlook caused by the strength of economic recoveries under way globally and domestically.
The lite down case has the same expected international environment (including risk sentiment) as the base case, but the domestic environment differs. Under this scenario South Africa fails to stabilise its debt and falls into the single B credit ratings bracket from all three agencies while the effects from COVID-19 are slow to overcome. Expropriation of some private sector property without compensation occurs, with a moderate, negative impact on the economy. Business confidence is depressed with weak investment growth, while significant load shedding occurs, and the country falls into recession. A substantial degree of fiscal consolidation ultimately occurs, preventing South Africa’s credit ratings from falling through the C credit rating grades. As at 31 March 2020 the weighting of the lite down case was 42%, but by 31 March 2021 it was revised to 44% due to marked deterioration in South Africa’s government finances.
The severe down case is characterised by a lengthy global recession and/or global financial crisis (which could be caused or exacerbated by the failure to overcome the COVID-19 pandemic but is not limited to this), with insufficient monetary and other policy supports. A depression occurs in the South African economy, with extreme Rand weakness. South Africa’s credit ratings from all three key agencies drop below the single B categories, then fall through the C grade categories eventually to D grade (default) as government borrows from increasingly wider sources and sinks deeper into a debt trap, and then defaults. Eventually widespread load shedding and civil unrest occur. Nationalisation of private sector property under expropriation without compensation occurs with severe negative impacts for the economy. At 31 March 2020 the scenario weighting of the severe down case was 10%, while at 31 March 2021 the weighting was 5% as the global economy has seen strong progress in recovery, while there is now evidence that government is working towards fiscal consolidation.
The up case is depicted by a relatively quick rebound from the COVID-19 pandemic globally and domestically, with rising confidence and investment levels. The South African economy’s structural problems are worked down quickly and no further credit rating downgrades occur. The rating outlooks eventually become positive, as strong fiscal consolidation sees government debt projections stabilise then fall in the near term. Global risk-on and strong global growth occurs in this scenario. There are no negative impacts from expropriation without compensation on the economy. As at 31 March 2020 the scenario weighting was 4%, but on 31 March 2021 was
03 Annual financial statements Investec Limitedgroup and company annual financial statements 2021
NOTES TO THE FINANCIAL STATEMENTSCONTINUED
132

61. Risk Management (continued)revised down to 2% as the economy saw a much weaker performance than was initially envisioned over 2020 causing its recovery to come off a much lower base and so is expected to take longer to occur, while economic reforms to quicken growth are still outstanding.
The extreme up case is a scenario which is an acceleration of the up case, where the COVID-19 pandemic is resolved very rapidly globally and domestically. Very strong global growth and a commodity boom occur while domestically, good governance and substantial growth-creating reforms see very strong, sustained economic growth. Very strong fiscal consolidation also occurs and sees government debt drop to low ratios of the 2000s. A high level of business confidence and fixed investment growth ensues, with substantial foreign direct investment inflows as property rights are strengthened and no nationalisation occurs. Domestic economic growth of 3 – 5%, then 5 – 7%, is achieved under this scenario and credit rating upgrades occur. This scenario retains a weighting of 1% as the exact domestic characterisations currently retain a very low probability.
The graph below depicts the forecast South African GDP growth under the macro-economic scenarios applied at 31 March 2021.
R’billion
South African GDP forecast
Extreme up case Up caseBase case Lite down caseSevere down case
2021 2022 2023 2024 2025 20262 500
3 000
3 500
4 000
The table below shows the key factors that form part of the macro-economic scenarios and the relative applied weightings of these scenarios.
Macro-economic scenarios
At 31 March 2021 average 2021 – 2026
At 31 March 2020average 2020 – 2025
Extremeup case
Upcase
Basecase
Litedowncase
Severedowncase
Extremeup case
Upcase
Basecase
Litedowncase
Severedowncase
% % % % % % % % % %
GDP growth 5.5 4.4 2.7 1.8 (0.5) 3.7 2.6 0.8 0.2 (0.5) Repo rate 3.5 3.8 4.7 5.0 5.6 4.8 5.1 5.8 6.0 7.6 Bond yield 9.2 9.5 10.4 11.1 11.9 9.1 9.4 9.9 10.5 11.8 Residential property price growth 7.1 6.3 5.3 4.1 2.6 7.4 4.1 2.6 1.9 0.2 Commercial property price growth 3.6 2.1 0.6 (1.0) (2.7) 4.1 2.0 0.1 (1.8) (4.3) Exchange rate(South African Rand:US Dollar) 12.0 13.6 15.8 17.7 18.4 9.7 11.7 14.8 16.9 18.2 Scenario weightings 1 2 48 44 5 1 4 43 42 10
The following table shows annual averages of economic factors for the base case over a five-year period based on the economic forecasts in place as at 31 March 2021.
Base case %
Financial years
2021/2022 2022/2023 2023/2024 2024/2025 2025/2026
GDP growth 4.5 1.1 2.4 2.4 2.9 Repo rate 3.6 4.5 5.0 5.1 5.4 Bond yield 10.3 10.3 10.3 10.7 10.7 Residential property price growth 4.6 5.1 5.3 5.5 5.9 Commercial property price growth (1.4) 0.5 0.9 1.3 1.7 Exchange rate (South African Rand:US Dollar) 15.4 15.7 15.8 16.1 16.3
03 Annual financial statements Investec Limitedgroup and company annual financial statements 2021
NOTES TO THE FINANCIAL STATEMENTSCONTINUED
133

61. Risk Management (continued)Market risk in the trading bookTraded market risk descriptionTraded market risk is the risk of potential changes in the value of the trading book as a result of changes in market risk factors such as interest rates, equity prices, exchange rates, commodity prices, credit spreads and their underlying volatilities where derivatives are traded. The trading book is defined as positions in financial instruments and commodities, including derivative products and other off-balance sheet instruments that are held within the trading businesses.
Traded market risk profile The focus of our trading activities is primarily on supporting our clients. Our strategic intent is that proprietary trading should be limited and that trading should be conducted largely to facilitate client flow. Within our trading activities, we act as principal with clients or the market. Market risk exists where we have taken on principal positions resulting from market making, underwriting and facilitation of client business in the foreign exchange, interest rate, equity, credit and commodity markets.
Traded market risk governance structure Traded market risk is governed by policies that cover the management, identification, measurement and monitoring of market risk. We have an independent market risk team to identify, measure, monitor and manage market risk. This team reports into risk management where limits are approved, managed and monitored.
The market risk team has reporting lines that are separate from the trading function, thereby ensuring independent oversight.
The Market Risk Forum, mandated by the IBL BRCC, manages market risk in accordance with approved principles, policies and risk appetite. Trading desk risk limits are reviewed by the Market Risk Forum and approved by IBL Review ERRF or IBL ERC in accordance with the risk appetite defined by the IBL board. Any significant changes in risk limits would then be taken to Group ERC for review and approval. The appropriateness of limits is continually re-assessed, with limits reviewed at least annually, or in the event of a significant market event or at the discretion of senior management.
Measurement of traded market riskA number of quantitative measures are used to monitor and limit exposure to traded market risk. These measures include:
• Value at Risk (VaR) and Expected Shortfall (ES) as portfolio measures of market risk exposure
• Scenario analysis, stress tests and tools based on extreme value theory (EVT) that measure the potential impact on portfolio values of extreme moves in markets
• Sensitivity analysis that measures the impact of individual market risk factor movements on specific instruments or portfolios, including interest rates, foreign exchange rates, equity prices, credit spreads and commodity prices. We use sensitivity measures to monitor and limit exposure across portfolios, products and risk types.
Stress and scenario analyses are used to add insight into the possible outcomes under severe market disruptions. The stress‑testing methodology assumes that all market factors move adversely at the same time and that no actions are taken during the stress events to mitigate risk. Stress scenarios based on historical experience as well as hypothetical scenarios are considered and are reviewed regularly for relevance in ever-changing market environments. Stress scenarios are run daily with analysis presented to IBL Review ERRF weekly and IBL BRCC when the committees meet or more often should market conditions require this.
Value at RiskVaR is a technique that estimates the potential losses as a result of movements in market rates and prices over a specified time horizon at a given level of confidence. The VaR model derives future scenarios from past time series of market rates and prices, taking into account inter-relationships between the different markets such as interest rates and foreign exchange rates. The VaR model used is based on full revaluation historical simulation and incorporates the following features:
• Two-year historical period based on an unweighted time series
• Daily movements in each risk factor e.g. foreign exchange rates, interest rates, equity prices, credit spreads and associated volatilities are simulated with reference to historical market rates and prices, with proxies only used when no or limited historical market data is available and the resultant one-day VaR is scaled up using the square root of time for regulatory purposes
• Risk factor movements are based on both absolute and relative returns as appropriate for the different types of risk factors.
VaR numbers using a one-day holding period are monitored daily at the 95% and 99% confidence intervals, with limits set at the 95% confidence interval. Expected shortfalls are also monitored daily at the 95% and 99% levels as it is the worst case loss in the VaR distribution.
03 Annual financial statements Investec Limitedgroup and company annual financial statements 2021
NOTES TO THE FINANCIAL STATEMENTSCONTINUED
134

61. Risk Management (continued)The table below contains the 95% one-day VaR figures for the trading businesses.
31 March 2021 31 March 2020
95% one-day VaR R’million Year end Average High Low Year end Average High Low
Commodities 0.4 0.2 0.7 — 0.1 0.1 0.3 — Equities 5.1 5.9 10.2 3.4 5.8 4.2 8.1 3.0 Foreign exchange 0.3 0.8 8.4 0.1 1.3 2.2 6.5 0.7 Interest rates 1.8 3.9 7.7 1.8 2.9 2.3 5.4 0.8 Consolidated* 5.5 7.6 12.8 4.9 6.9 5.3 10.0 3.4
* The consolidated VaR for each entity is lower than the sum of the individual VaRs. This arises from the correlation offset between various asset classes (diversification).
Expected shortfallThe ES measure overcomes some of VaR’s shortcomings. ES seeks to quantify losses encountered in the tail beyond the VaR level. The 95% one-day ES is the average loss given that the 95% one-day VaR level has been exceeded. The table below contains the 95% one-day ES figures.
95% one-day ES R’million
31 March 2021 Year end
31 March 2020 Year end
Commodities 0.9 0.1 Equities 8.3 8.4 Foreign exchange 0.5 1.6 Interest rates 4.4 5.9 Consolidated* 9.7 10.8
* The consolidated ES for each entity is lower than the sum of the individual ESs. This arises from the correlation offset between various asset classes.
Stressed VaRStressed VaR (sVaR) is calculated using the VaR model but based on a one-year period through which the relevant market factors experienced stress. The information in the table below contains the 99% one-day sVaR.
R’million31 March 2021
Year end31 March 2020
Year end
99% one-day sVaR 12.5 24.9
BacktestingThe performance of the VaR model is regularly monitored through backtesting. This is done by comparing daily clean profit and loss against one-day VaR based on a 99% confidence level. Clean profit and loss excludes items such as intra-day transactions, valuation adjustments, provisions, recoveries, commission, fees and hedge costs included in the new trade revenue. If a loss exceeds the one-day VaR, a backtesting exception is considered to have occurred. Over time we expect the average rate of observed backtesting exceptions to be consistent with the percentile of the VaR statistic being tested. This is conducted at an aggregate and desk level on a daily basis.
The graph that follows shows the result of backtesting the total daily 99% one-day VaR against the clean profit and loss data for our trading activities over the reporting period. Based on these graphs, we can gauge the accuracy of the VaR figures i.e. 99% of the time, losses are not expected to exceed the 99% one-day VaR.
The average VaR for the year ended 31 March 2021 in the trading book was higher than for the year ended 31 March 2020 due to increased market volatility throughout the year. Using clean profit and loss data for backtesting resulted in no exceptions over the year (as shown in the graph below), which is below the expected number of exceptions of two to three exceptions per annum that a 99% VaR model implies.
03 Annual financial statements Investec Limitedgroup and company annual financial statements 2021
NOTES TO THE FINANCIAL STATEMENTSCONTINUED
135

61. Risk Management (continued)99% one-day VaR backtestingRand
Clean P/L 99% one-day VaR
April2020
May2020
June2020
July2020
August2020
September2020
October2020
November2020
December2020
January2021
February2021
March2021
(60 000 000)
(50 000 000)
(40 000 000)
(30 000 000)
(20 000 000)
(10 000 000)
0
10 000 000
20 000 000
30 000 000
Stress testingThe table below indicates the potential losses that could arise in the trading book portfolio per EVT at the 99% confidence level. EVT is a methodology widely used to estimate tail-event losses beyond the 95% one-day VaR. These numbers do not assume normality but rather rely on fitting a distribution to the tails of the VaR distribution.
31 March 2021 31 March 2020
99% EVTR'million Year end Average High Low Year end Average High Low
Commodities 5.0 2.3 8.3 0.2 0.6 0.5 1.8 0.1 Equities 26.4 44.5 86.2 15.1 31.7 18.9 69.9 7.0 Foreign exchange 2.0 3.5 11.7 1.0 3.4 6.3 15.5 2.1 Interest rates 22.8 26.1 84.9 6.4 25.8 8.3 32.7 2.1 Consolidated# 27.6 49.9 86.8 17.2 40.6 20.7 82.4 8.6
# The consolidated stress testing for each entity is lower than the sum of the individual stress test numbers. This arises from the correlation offset between various asset classes..
CapitalWe have internal model approval from the South African PA for general market risk for the majority of the trading desks and accordingly trading capital is calculated as a function of the 99% 10-day VaR as well as the 99% 10-day sVaR together with standardised specific risk capital for issuer risk.
Market risk – derivativesThe bank enters into various derivatives contracts, largely on the back of customer flow for hedging foreign exchange, commodity, equity and interest rate exposures and to a small extent as principal for trading purposes. These include financial futures, options, swaps and forward rate agreements.
Information showing our derivative trading portfolio over the reporting period on the basis of the notional principal and the fair value of all derivatives can be found on page 85.
The notional principal indicates our activity in the derivatives market and represents the aggregate size of total outstanding contracts at year end. The fair value of a derivative financial instrument represents the present value of the positive or negative cash flows which would have occurred had we closed out the rights and obligations arising from that instrument in an orderly market transaction at year end. Both these amounts reflect only derivatives exposure and exclude the value of the physical financial instruments used to hedge these positions.
03 Annual financial statements Investec Limitedgroup and company annual financial statements 2021
NOTES TO THE FINANCIAL STATEMENTSCONTINUED
136

61. Risk Management (continued)Interest rate risk - IBOR reformFollowing the decision by global regulators to phase out IBORs and replace them with alternative reference rates, the group has established a project team to manage the transition of all contracts that could be affected. The project is being led by senior representatives from functions across the group including the client facing teams, Treasury, legal, finance, operations, risk and technology. The project team provides regular progress updates to the board and DLC BRCC. The group has in place detailed plans, processes and procedures to support the transition in line with both the milestones set by the IBOR working groups in each jurisdiction and the timelines set out in the pre-cessation announcement of the IBOR benchmarks by the FCA in March 2021.
During the financial year, the group has already successfully transitioned a portion of new business away from referencing IBOR to referencing alternative rates. Following the progress made to date, the group is confident that it has the operational capability to complete the transition to risk – free or other alternative rates. For other benchmark interest rates such as EURIBOR that have been reformed and can therefore continue,
financial instruments referencing those rates will not need to transition.
IBOR reform exposes the group to various risks, which the project is managing and monitoring closely.
These risks include but are not limited to the following:
• Conduct risk arising from discussions with clients and market counterparties due to the amendments required to existing contracts necessary to effect IBOR reform
• Business risk to the group and its clients that markets are disrupted due to IBOR reform giving rise to financial losses
• Pricing risk from the potential lack of market information if liquidity in IBORs reduces and risk-free rates are illiquid and unobservable
• Operational risk arising from changes to the group’s IT systems and processes, also the risk of payments being disrupted if an IBOR ceases to be available
• Accounting risk if the group’s hedging relationships fail and from unrepresentative income statement volatility as financial instruments transition to risk-free rates.
The tables that follow summarise the significant exposures impacted by interest rate benchmark reform as at 31 March 2021.
GBPIBOR - no. of trades
GBP - Notional value (R’million)
OtherIBOR - no. of trades
Other - Notional value (R’million)
Pre-2022 dated instrumentsDerivatives 26 8 158 109 31 291 Other debt securities — — 1 111 Reverse repurchase agreements and cash collateral on securities borrowed — — 18 2 637 Loans and advances to banks — — 2 519 Loans and advances to customers 33 1 556 118 9 570
Of which undrawn 4 177 12 1 388 Customers accounts (deposits) 427 1 269 2 451 12 898 Post-2022 dated instrumentsDerivatives 45 8 030 399 64 910 Bank debt securities — — 17 496 Other debt securities 2 931 4 2 256 Reverse repurchase agreements and cash collateral on securities borrowed — — 11 2 266 Loans and advances to customers 154 7 396 162 11 728
Of which undrawn 7 1 608 13 1 784 Customers accounts (deposits) 6 30 89 15 812
In March 2021, the ICE Benchmark Administration (the administrator of LIBOR), in conjunction with the UK’s Financial Conduct Authority (FCA) announced that it will stop publishing the following LIBOR settings based on submissions from panel banks, after 31 December 2021: all GBP, EUR, CHF and JPY LIBOR settings and the one-week and two-month USD LIBOR settings. All remaining USD LIBOR settings (i.e., the overnight and the one-, three-, six- and 12-month settings) will cease to be published based on panel bank submissions after 30 June 2023.
03 Annual financial statements Investec Limitedgroup and company annual financial statements 2021
NOTES TO THE FINANCIAL STATEMENTSCONTINUED
137

61. Risk Management (continued)Investment riskInvestment risk in the banking book comprises 4.1% of total assets at 31 March 2021 We have refocused our principal investment activities on clients where we have and can build a broader relationship through other areas of activity in the group.
We partner with management and other co-investors by bringing capital raising expertise, working capital management, merger and acquisition and investment experience into client-driven private equity transactions as well as leveraging third party capital into funds that are relevant to the group’s client base. Investments are selected based on:
– The track record of management– Attractiveness of the industry and the positioning therein– Valuation/pricing fundamentals– Environmental and sustainability analyses– Exit possibilities and timing thereof– The ability to build value by implementing an agreed
strategy.
Investments in listed shares may arise on an IPO, or sale of an investment to a listed company. There is limited appetite for listed investments
IBL holds a 47.4% stake in the IEP Group alongside third party investors and senior management of the business who collectively hold the remaining 52.6%. The investment in the IEP Group is reflected as an investment in an associate.
Additionally, from time to time, the manner in which certain lending transactions are structured results in equity, warrants or profit shares being held, predominantly in unlisted companies. We also source development, investment and trading opportunities to create value within agreed risk parameters.
Investec has a 8.7% shareholding in Ninety One (previously known as Investec Asset Management).
Management of investment riskAs investment risk arises from a variety of activities conducted by the group, the monitoring and measurement thereof varies across transactions and/or type of activity.
Nature of investment risk Management of risk
Principal Investments Investment committees, IBL BRCC and DLC BRCC
Listed equities Investment committees, market risk management, IBL BRCC and DLC BRCC
Profit shares and investments arising from lending transactions
Credit risk management committees, IBL BRCC and DLC BRCC
Investment and trading properties
Investment committees, Investec Property Group Investment Committee, IBL BRCC and DLC BRCC
IEP Group A number of our executives are on the board of the IEP Group, IBL BRCC and DLC BRCC
Risk appetite limits and targets are set to manage our exposure to equity and investment risk. An assessment of exposures against limits and targets as well as stress testing scenario analysis are performed and reported to IBL BRCC. The portfolios are mainly made up of South African assets and industry, concentration risk is well spread.
03 Annual financial statements Investec Limitedgroup and company annual financial statements 2021
ADDITIONAL RISK INFORMATION
138

61. Risk Management (continued)Summary of investments held and stress testing analysesThe balance sheet value of investments is indicated in the table below.
R’million
On-balancesheet value of
investments31 March 2021
Valuationchange
stress test31 March 2021*
On-balancesheet value of
investments31 March 2020
Valuationchange
stress test31 March
2020*
Unlisted investments**^ 5 681 852 6 421 963 Listed equities 619 155 2 544 636 Investment and trading properties 7 002 810 7 390 809 The IEP Group 5 117 768 5 611 842 Ninety One 3 870 n/a 2 769 n/aTotal 22 289 2 585 24 735 3 250
** Includes the fair value loans investments of R2.5 billion (31 March 2020: R2.6 billion).^ For the purposes of the above analysis, the exposures arising from the consolidation of the Investec Property Fund have been reflected at the level of our
economic ownership, being 24.3% (31 March 2020: 24.3%).# Investec Limited has an 8.7% shareholding in Ninety One (previously known as Investec Asset Management).* In order to assess our earnings sensitivity to a movement in the valuation of these investments, the stress testing parameters detailed below are applied:
Stress test values applied
Unlisted investments and the IEP Group 15%
Listed equities 25%
Trading properties 20%
Investment properties 10%
Ninety One n/a
Stress testing summaryBased on the information at 31 March 2021, as reflected above, we could have a R2.6 billion reversal in revenue (which assumes a year in which there is a ‘severe stress scenario’ simultaneously across all asset classes). This would not necessarily cause the group to report a loss, but could have a significantly negative impact on earnings for that period. The probability of all these asset classes being negatively impacted at the same time is low, although the probability of listed equities being negatively impacted at the same time is high. Stress testing is not considered to be relevant for the group's holding in Ninety One. This investment is accounted for at fair value through other comprehensive income and any share price movement is likely to have a limited impact on the group’s capital given the regulatory capital treatment which already includes a haircut of R990mn.
Capital requirementsIn terms of Basel III capital requirements for the group, unlisted and listed equities within the banking book are represented under the category of equity risk and investment properties, and profit shares and embedded derivatives are considered in the calculation of capital required for credit risk.
Refer to the Pillar III annual disclosure report on our website.
An analysis of the investment portfolio and the IEP Group by industry of exposure (excluding investment and trading properties and Ninety One)31 March 2021R11 417 million
n Manufacturing and Commerce 37.9%
n Finance and Insurance 18.3%
n Real estate 16.3%
n Mining and resources 9.8%
n Other 9.3%
n Communication 6.9%
n Electricity, gas and water (utility services) 1.5%
03 Annual financial statements Investec Limitedgroup and company annual financial statements 2021
ADDITIONAL RISK INFORMATIONCONTINUED
139

61. Risk Management (continued)Securitisation/structured credit activities exposures OverviewThe group’s definition of securitisation/structured credit activities is wider than the definition applied for regulatory capital purposes. The regulatory capital definition focuses largely on positions we hold in an investor capacity and includes securitisation positions we have retained in transactions in which the group has achieved significant risk transfer. We believe, however, that the information provided below is meaningful in that it groups all these related activities in order for a reviewer to obtain a full picture of the activities that we have conducted in this space. Some of the information provided below overlaps with the group's credit and counterparty exposure information.
Refer to page 130 for the balance sheet and credit risk classification
In line with the regulations, the group applies a combination of the advanced and standardised approach in the assessment of regulatory capital for securitisation.
We engage in transactions that involve the use of both special purpose entities and asset securitisation structures. Securitisation represents a small proportion of our current funding profile, but provides additional flexibility and a source of liquidity. We do not depend on special purpose vehicles for funding in the normal course of business. These entities form part of the consolidated group balance sheet as reported.
We have securitised assets originated by our Private Client business in South Africa. The primary motivations for the securitisation of these assets are to:
• Provide an alternative source of funding• Act as a mechanism to transfer risk• Leverage returns through the retention of equity tranches
in low default rate portfolios• Continue to create marketable instruments through self
securitisation.
Total assets that have been originated and securitised by the Private Client division amount to R8.2 billion at 31 March 2021 (31 March 2020: R7.2 billion) and consist mainly of residential mortgages.
Further details of our various securitisation vehicles are highlighted below:
• Fox Street 1: R0.2 billion notes of the original R1.5 billion are still in issue. All notes are held internally
• Fox Street 2: R0.3 billion notes of the original R1.5 billion are still in issue. All notes are held internally
• Fox Street 3: R0.6 billion notes of the original R2.0 billion are still in issue. All notes are held internally
• Fox Street 4: R1.1 billion notes of the original R3.7 billion are still in issue. All notes are held internally
• Fox Street 5: R1.4 billion notes of the original R2.9 billion are still in issue. All notes are held internally
• Fox Street 6: R0.9 billion notes of the original R1.3 billion are still in issue. R342 million of the notes are held internally
• Fox Street 7: R0.9 billion notes of the original R1.1 billion are still in issue. R7 million of the notes are held internally
• Grayston Drive Autos: R2.4 billion notes of the original R2.4 billion are still in issue. R325 million of the notes are held internally.
There is a clean-up call option that can be exercised at 10% of original notes issued. The margin on the notes increases at pre-specified intervals and coincides with the originator call option dates.
We have also sought out select opportunities in the credit/debt markets and traded in and purchased structured credit. These have largely been rated US corporate loans totalling R0.8 billion at 31 March 2021 (31 March 2020: R1.0 billion), rated UK residential mortgage-backed securities (RMBS) totalling R0.4 billion at 31 March 2021 (31 March 2020: R0.8 billion), unrated South African RMBS totalling R1.2 billion at 31 March 2021 (31 March 2020: R1.6 billion) and unrated South African auto-loans totalling R75 million at 31 March 2021 (31 March 2020: R241 million).
Risk managementAll existing or proposed exposures to a securitisation are analysed on a case-by-case basis, with approval required from credit. The analysis looks through to the historical and expected future performance of the underlying assets, the position of the relevant tranche in the capital structure as well as analysis of the cash flow waterfall under a variety of stress scenarios. External ratings and risk-weightings are presented, but only for information purposes since the group principally relies on its own internal risk assessment. Overarching these transaction level principles is the board-approved risk appetite policy, which details the group’s appetite for such exposures, and each exposure is considered relative to the group’s overall risk appetite. We can use explicit credit risk mitigation techniques where required; however, the group prefers to address and manage these risks by only approving exposures to which the group has explicit appetite through the constant and consistent application of the risk appetite policy.
03 Annual financial statements Investec Limitedgroup and company annual financial statements 2021
ADDITIONAL RISK INFORMATIONCONTINUED
140

61. Risk Management (continued)Credit analysisIn terms of our analysis of our credit and counterparty risk, exposures arising from securitisation/structured credit activities reflect only those exposures to which we consider ourselves to be at risk. Assets that have been securitised by our Private Client division are reflected as part of our core lending exposures and not our securitisation/structured credit exposures as we believe this reflects the true nature and intent of these exposures and activities. These assets are reflected on the balance sheet line item ‘own originated loans and advances to customers’ totalling R8.2 billion at 31 March 2021 (31 March 2020: R7.2 billion).
Securitisation and structured credit activities exposures
Nature of exposure/activity
Exposure 31 March 2021
R’million
Exposure 31 March 2020
R’millionBalance sheet and credit risk classification
Asset quality – relevant comments
Structured credit (gross exposure) 2 505 3 413 Other debt securities
<40% RWA 2 430 3 172
>40% RWA 75 241
Loans and advances to customers and third party intermediary originating platforms (mortgage loans) (net exposure)
139 175 Other loans and advances
Private Client division assets which have been securitised (net exposure)
8 183 7 192 Own originated loans and advances to customers
Analysed as part of the group’s overall asset quality on core loans
Analysis of gross structured credit exposure
R’million AAA AA A BBB BBB andbelow
Totalrated
Totalunrated Total
US Corporate loans — 812 — — — — 812 — 812 UK RMBS — 434 — — — — 434 — 434 South African RMBS — — — — — — — 1 184 1 184 South African auto-loans — — — — — — — 75 75 Total at 31 March 2021 — 1 246 — — — — 1 246 1 259 2 505
<40% RWA — 1 246 — — — — 1 246 1 184 2 430 >40% RWA — — — — — — — 75 75
Total at 31 March 2020 — 1 754 — — — — 1 754 1 659 3 413
03 Annual financial statements Investec Limitedgroup and company annual financial statements 2021
ADDITIONAL RISK INFORMATIONCONTINUED
141
61. Risk Management (continued)Balance sheet risk managementBalance sheet risk encompasses the financial risks relating to our asset and liability portfolios, comprising liquidity, funding, concentration, encumbrance and non-trading interest rate risk.
Liquidity riskLiquidity risk refers to the possibility that, despite being solvent, we have insufficient capacity to fund increases in assets, or are unable to meet our payment obligations as they fall due in normal and stressed conditions. This includes repaying depositors or maturing wholesale debt. This risk arises from mismatches in the timing of cash-flows, and is inherent in all banking operations and can be impacted by a range of institution-specific and market-wide events.
Liquidity risk is further broken down into:
• Funding liquidity: this relates to the risk that the group will be unable to meet current and/or future cash flows or collateral requirements in the normal course of business, without adversely affecting its solvency, financial position or its reputation
• Market liquidity: this relates to the risk that the bank may be unable to trade in specific markets or that it may only be able to do so with difficulty due to market disruptions or a lack of market liquidity.
Management and measurement of liquidity riskCohesive liquidity management is vital for protecting our depositors, preserving market confidence, safeguarding our reputation and ensuring sustainable growth with established funding sources. Through active liquidity management, we seek to preserve stable, reliable and cost-effective sources of funding. As such, the group considers ongoing access to appropriate liquidity for all its operations to be of paramount importance, and our core liquidity philosophy is reflected in day-to-day practices which encompass the following robust and comprehensive set of policies and procedures for assessing, measuring and controlling liquidity risk:
• Our liquidity management processes encompass requirements set out within Basel Committee on Banking Supervision (BCBS) guidelines and by the regulatory authorities in each jurisdiction, namely the South African PA and Bank of Mauritius (BOM)
• The risk appetite is clearly defined by the board and each geographic entity must have its own board-approved policies with respect to liquidity risk management
• We maintain a liquidity buffer in the form of unencumbered cash, government or rated securities (typically eligible for repurchase with the central bank), and near cash well in excess of the regulatory requirements as protection against unexpected disruptions in cash flows
• Funding is diversified with respect to currency, term, product, client type and counterparty to ensure a varied overall funding mix
• We monitor and evaluate each banking entity’s maturity ladder and funding gap (cash flow maturity mismatch) on a ‘liquidation’, ‘going concern’ and ‘stress’ basis
• The balance sheet risk management team independently monitors key daily funding metrics and liquidity ratios to assess potential risks to the liquidity position, which further act as early warning indicators of potential market disruptions
• The maintenance of sustainable prudent liquidity resources takes precedence over profitability
• The group maintains contingency funding plans designed to protect depositors, creditors and shareholders and maintain market confidence during adverse liquidity conditions.
We measure liquidity risk by quantifying and calculating various liquidity risk metrics and ratios to assess potential risks to the liquidity position. These include:
• Internal ‘survival horizon’ metric which models how many days it takes before the group's cash position is depleted under an internally defined worst-case liquidity stress
• Regulatory metrics for liquidity measurement:– Liquidity Coverage Ratio (LCR)– Net Stable Funding Ratio (NSFR)
• Modelling a ‘business as usual’ environment where we apply rollover and reinvestment assumptions under benign market conditions
• An array of further liquidity stress tests, based on a range of scenarios and using historical analysis, documented experience and prudent judgement to model the impact on the group’s balance sheet
• Contractual run-off based actual cash flows with no modelling adjustments
• Additional internally defined funding and balance sheet ratios
• Any other local regulatory requirements.
This suite of metrics ensures the smooth management of the day-to-day liquidity position within conservative parameters and further validates that we are able to generate sufficient liquidity to withstand a range of liquidity stresses or market disruptions.
The parameters used in stress scenarios are reviewed at least annually, taking into account changes in the business environment and input from business units. The objective is to analyse the possible impact of an economic event on the group’s balance sheet, so as to maintain sufficient liquidity and to continue to operate for a minimum period as detailed in the board-approved risk appetite.
We further carry out reverse stress tests to identify business model vulnerabilities which tests ‘tail risks’ that can be missed in normal stress tests. The group has calculated the severity of stress required to breach the liquidity requirements. This scenario is considered highly unlikely given the group’s strong liquidity position, as it requires an extreme withdrawal of deposits combined with the inability to take any management actions to breach liquidity minima that threaten the group's liquidity position.
The group operates an industry-recognised third party risk modelling system in addition to custom-built management information systems designed to measure and monitor liquidity risk on both a current and forward-looking basis.
Funding strategyWe maintain a funding structure of stable customer deposits and long-term wholesale funding well in excess of funded assets. We target a diversified funding base, avoiding undue concentrations by investor type, maturity, market source, instrument and currency. As a result, we are able to generate funding from a broad range of sources in each geographic location, which ensures a varied overall funding mix to support loan growth.
We acknowledge the importance of our retail deposit client base as the principal source of stable and well diversified funding. We continue to develop products to attract and service the investment needs of our client base in line with our risk appetite.
03 Annual financial statements Investec Limitedgroup and company annual financial statements 2021
ADDITIONAL RISK INFORMATIONCONTINUED
142

61. Risk Management (continued)Entities within the group actively participate in global financial markets and our relationship is continuously enhanced through regular investor presentations internationally. Entities are only allowed to have funding exposure to wholesale markets where they can demonstrate that the market is sufficiently deep and liquid, and then only relative to the size and complexity of their business as part of a diversified funding mix.
The group’s ability to access funding at cost-effective levels is influenced by maintaining or improving the entity’s credit rating. A reduction in these ratings could have an adverse effect on the group’s funding costs, and access to wholesale term funding. Credit ratings are dependent on multiple factors, including operating environment, business model, strategy, capital adequacy levels, quality of earnings, risk appetite and exposure, and control framework.
We remain confident in our ability to raise funding appropriate to our needs.
Liquidity BufferTo protect against potential shocks, we hold a liquidity buffer in the form of cash, unencumbered high quality liquid assets (typically in the form of government or rated securities eligible for repurchase with the central bank), and near cash, well in excess of the regulatory requirements as protection against disruptions in cash flows. These portfolios are managed within board-approved targets, and as well as providing a buffer under going concern conditions, also form an integral part of the broader liquidity generation strategy.. Investec remains a net liquidity provider to the interbank market, placing significantly more funds with other banks than our short-term interbank borrowings. We do not rely on overnight interbank deposits to fund term lending.
Contingency planningThe group maintains contingency funding plans which detail the course of actions that can be taken in the event of a liquidity stress. The plans help to ensure that cash flow estimates and commitments can be met in the event of general market disruption or adverse bank-specific events, while minimising detrimental long-term implications for the business. The plans include:
• Details on the required daily monitoring of the liquidity position
• Description of the early warning indicators to be monitored, and process of escalation if required
• Liquidity stress scenarios to be modelled for Contingency Funding Plan (CFP) purposes (over and above daily stress testing scenarios)
• Funding and management actions available for use in a stress situation
• Roles and responsibilities• Details of specific escalation bodies and key contacts • Internal and external communication plans.The plans have been tested within our core jurisdictions via externally facilitated liquidity crisis simulation exercises which assess the group’s sustainability and ability to adequately contain a liquidity stress.
03 Annual financial statements Investec Limitedgroup and company annual financial statements 2021
ADDITIONAL RISK INFORMATIONCONTINUED
143

61. Risk Management (continued)Cash and near cash trendR’billion
Near cash (central bank guaranteed liquidity) Cash Near cash (other 'monetisable' assets)
Apr2020
May2020
Jun2020
Jul2020
Aug2020
Sep2020
Oct2020
Nov2020
Dec2020
Jan2021
Feb2021
Mar2021
0
20
40
60
80
100
120
140
160
An analysis of cash and near cash at 31 March 2021
Bank and non-bank depositor concentration by type at 31 March 2021
R129.8 billion R396.3 billion
n Central Bank cash placements and guaranteed liquidity
52.7% n Non-bank financials 46.3% n Individuals 21.2% n Non-financial corporates 15.6%
n Cash 31.1% n Banks 5.6% n Near cash (other ‘monetisable’ assets) 16.2% n Small business 5.2%
n Public sector 6.1%
03 Annual financial statements Investec Limitedgroup and company annual financial statements 2021
ADDITIONAL RISK INFORMATIONCONTINUED
144

61. Risk Management (continued)Liquidity mismatchThe tables that follow show the liquidity mismatch across our business.
The table will not agree directly to the balances disclosed in the balance sheet due to the inclusion of loans to group companies in the other asset line.
With respect to the contractual liquidity table below, we record all assets and liabilities with the underlying contractual maturity as determined by the cash flow profile for each deal.
With respect to the behavioural liquidity gap, we adjust the contractual profile of certain assets and liabilities:
• Liquidity buffer: the actual contractual profile of the assets in the liquidity buffer is of little consequence, as practically the bank would meet any unexpected net cash outflows by repo’ing or selling these highly liquid securities. Consequently, for the liquidity buffer:– The time horizon to monetise our regulatory liquid assets
which are guaranteed by the central bank has been adjusted to ‘on demand’
– The time horizon for the cash and near cash portfolio of discretionary treasury assets has been set to one month where there are deep secondary markets for this elective asset class
• Customer deposits: the contractual repayments of many deposits are on demand, or at notice, but behaviourally, withdrawals vary significantly from this. Historical observations of the products are used to model the behavioural lives, and this analysis has identified significant additional sources of structural liquidity in the form of core deposits that exhibit stable behaviour.
Contractual liquidity at 31 March 2021
R’million DemandUp to one
month
One tothree
monthsThree to
six months
Sixmonths to
one year
Oneto fiveyears
> Fiveyears Total
Cash and short-term funds – banks 31 298 3 100 1 480 — — — — 35 878 Cash and short-term funds – non-banks 7 151 2 — — 184 1 103 516 8 956 Investment/trading assets and statutory liquids 33 741 48 768 11 020 6 794 6 482 45 914 38 732 191 451 Securitised assets 578 — — — — 4 092 4 092 8 762 Advances 4 563 7 005 8 295 11 094 21 014 114 008 114 091 280 070 Other assets 2 422 6 789 9 419 12 615 (216) 3 401 (10 874) 23 556 Assets 79 753 65 664 30 214 30 503 27 464 168 518 146 557 548 673 Deposits – banks (624) 9 740 (54) (191) (3 149) (27 774) — (22 052) Deposits – non-banks (167 552) (21 856) (79 585) (25 340) (36 707) (40 334) (2 854) (374 228) Negotiable paper — (281) (6) (682) (928) (4 167) (429) (6 493) Securitised liabilities — — — — — (1 830) (1 441) (3 271) Investment/trading liabilities (2 178) (16 538) (5 887) (4 474) (6 012) (12 386) (1 920) (49 395) Subordinated liabilities — (6) — (1 161) (4 330) (8 948) — (14 445) Other liabilities (2 889) (5 009) (1 498) (554) (385) (493) (7 333) (18 161) Liabilities (173 243) (33 950) (87 030) (32 402) (51 511) (95 932) (13 977) (488 045) Total equity — — — — — — (60 628) (60 628) Contractual liquidity gap (93 490) 31 714 (56 816) (1 899) (24 047) 72 586 71 952 — Cumulative liquidity gap (93 490) (61 776) (118 592) (120 491) (144 538) (71 952) — —
Behavioural liquidity as at 31 March 2021 as discussed above.
R’million DemandUp to one
month
One tothree
months
Threeto six
months
Sixmonths to
one year
Oneto fiveyears
> Five years Total
Behavioural liquidity gap 51 810 19 412 663 13 957 (7 611) (163 832) 85 601 —
Cumulative 51 810 71 222 71 885 85 842 78 231 (85 601) —
03 Annual financial statements Investec Limitedgroup and company annual financial statements 2021
ADDITIONAL RISK INFORMATIONCONTINUED
145

61. Risk Management (continued)Non-trading interest rate risk descriptionNon-trading interest rate risk, otherwise known as interest rate risk in the banking book, arises from the impact of adverse movements in interest rates on both net interest earnings and economic value of equity.
Sources of interest rate risk in the banking book include:
• Repricing risk: arises from the timing differences in the fixed rate maturity and floating rate repricing of group assets, liabilities and off-balance sheet derivative positions. This affects the interest rate margin realised between lending income and borrowing costs when applied to our rate sensitive portfolios
• Yield curve risk: repricing mismatches also expose the group to changes in the slope and shape of the yield curve
• Basis risk: arises from imperfect correlation in the adjustments of the rates earned and paid on different instruments with otherwise similar repricing characteristics
• Embedded option risk: arises from optional elements embedded in items where the group or its customers can alter the level and timing of their cash flows
• Endowment risk: refers to the interest rate risk exposure arising from the net differential between interest rate insensitive assets, interest rate insensitive liabilities and capital.
The above sources of interest rate risk affect the interest rate margin realised between lending income and borrowing costs when applied to our rate sensitive asset and liability portfolios, which has a direct effect on future net interest earnings and the economic value of equity.
Measurement and management of non-trading interest rate riskNon-trading interest rate risk is an inherent consequence of conducting banking activities, and arises from the provision of non-trading banking products and services. The group considers the management of banking margin of vital importance, and our non-trading interest rate risk philosophy is reflected in our day-to-day practices.
The aim of non-trading interest rate risk management is to protect and enhance net interest income and economic value of equity in accordance with the board-approved risk appetite, and to ensure a high degree of stability of the net interest margin over an interest rate cycle. Non-trading interest rate risk is measured and analysed by utilising standard tools of traditional interest rate repricing mismatch and net present value (NPV) sensitivity to changes in interest rate risk factors:
• Income metrics capture the change in accruals expected over a specified time horizon in response to a change in interest rates
• Economic value metrics capture all future cash flows in order to calculate the group’s net worth and therefore can highlight risks beyond the short-term earnings time horizon.
These metrics are used to assess and to communicate to senior management the financial impact of possible future interest rate scenarios, covering:
• Interest rate expectations and perceived risks to the central view
• Standard shocks to levels and shapes of interest rates and yield curves
• Historically-based yield curve changes.
The repricing gap provides a simple representation of the balance sheet, with the sensitivity of fair values and earnings to changes to interest rates calculated off the repricing gap. This also allows for the detection of interest rate risk concentration in specific repricing buckets. Net interest income sensitivity measures the change in accruals expected over the specified horizon in response to a shift in the yield curve, while economic value sensitivity and stress testing to macro-economic movement or changes to the yield curve measures the interest risk implicit change in net worth as a result of a change in interest rates on the current values of financial assets and liabilities. Economic value measures have the advantage that all future cash flows are considered and therefore assess the risk beyond the earnings horizon.
Each banking entity has its own board-approved non-trading interest rate risk appetite, which is clearly defined in relation to both income risk and economic value risk. The bank has limited appetite for non-trading interest rate risk.
Operationally, daily management of interest rate risk is centralised within the Treasury of each banking entity and is subject to local independent risk and ALCO review. Treasury mitigates any residual undesirable risk where possible, by changing the duration of the banking book’s discretionary liquid asset portfolio, or through derivative transactions. The Treasury mandate allows for a tactical response to market volatility which may arise during changing interest rate cycles, in order to hedge residual exposures. Any resultant interest rate position is managed under the market risk limits. Balance sheet risk management independently monitors a broad range of interest rate risk metrics to changes in interest rate risk factors, detailing the sources of interest rate exposure.
Automatic optionality arising from variable rate products with an embedded minimum lending rate serves as an income protection mechanism for the group against falling interest rates, while behavioural optionality risk from customers of fixed rate products is mitigated by early repayment charges.
Internal capital is allocated for non-trading interest rate risk.
The bank complies with the BCBS108 framework which is currently in force for assessing banking book (non-trading) interest rate risk, and is in the process of enhancing its existing framework to adhere to the new BCBS368 principles which come into effect in 2022.
03 Annual financial statements Investec Limitedgroup and company annual financial statements 2021
ADDITIONAL RISK INFORMATIONCONTINUED
146

61. Risk Management (continued)Interest rate sensitivity gap at 31 March 2021The table below shows our non-trading interest rate mismatch. These exposures affect the interest rate margin realised between lending income and borrowing costs assuming no management intervention.
R’million
Not> three months
> Threemonths
but < six months
> Sixmonths
but < oneyear
> One yearbut < five
years > Five years Non-rate
Totalnon-
trading
Cash and short-term funds – banks 25 206 — — — — 8 914 34 120 Cash and short-term funds – non-banks 8 753 — 180 — — — 8 933 Investment/trading assets and statutory liquids 53 342 8 438 11 444 29 084 8 204 51 376 161 888 Securitised assets 8 762 — — — — — 8 762 Advances 252 084 2 730 2 047 19 190 502 3 467 280 020 Other assets 5 031 (1 580) (4 349) 7 207 (447) 14 435 20 297 Assets 353 178 9 588 9 322 55 481 8 259 78 192 514 020 Deposits – banks (17 144) — — (4 908) — — (22 052) Deposits – non-banks (320 022) (14 018) (15 359) (8 361) (70) (16 364) (374 194) Negotiable paper (860) (255) (924) (4 119) (257) (78) (6 493) Securitised liabilities (3 271) — — — — — (3 271) Investment/trading liabilities (2 208) — — (1 316) — (5 397) (8 921) Subordinated liabilities (8 276) (190) (1 903) (4 069) — (7) (14 445) Other liabilities (3 789) — — — — (12 518) (16 307) Liabilities (355 570) (14 463) (18 186) (22 773) (327) (34 364) (445 683) Total equity (6 300) — — — — (54 328) (60 628) Balance sheet (8 692) (4 875) (8 864) 32 708 7 932 (10 500) 7 709 Off-balance sheet 18 960 3 263 7 964 (30 072) (7 824) — (7 709) Repricing gap 10 268 (1 612) (900) 2 636 108 (10 500) — Cumulative repricing gap 10 268 8 656 7 756 10 392 10 500 —
Economic value sensitivity at 31 March 2021As outlined above, non-trading interest rate risk is measured and monitored using an economic value sensitivity approach. The table below reflects our economic value sensitivity to a 2% parallel shift in interest rates assuming no management intervention. This sensitivity effect would only have a negligible direct impact on our equity.
Sensitivity to the following interest rates (expressed in original currencies)
million ZAR GBP USD EUR AUDOther (ZAR)
All (ZAR)
200bps down (199.1) 0.7 (0.3) 0.5 — — (179.1) 200bps up 123.6 (1.8) 0.7 (1.1) (0.1) (6.5) 70.7
03 Annual financial statements Investec Limitedgroup and company annual financial statements 2021
ADDITIONAL RISK INFORMATIONCONTINUED
147
148

Investec ordinary sharesAs at 31 March 2021, Investec Limited had 318.9 million ordinary shares in issue.
Spread of ordinary shareholders as at 31 March 2021Investec Limited ordinary shares in issue
Number of shareholders Holdings
% of total shareholders
Number of shares in issue
% of issued share capital
6 470 1 - 500 58.5% 778 216 0.2% 1 318 501 - 1 000 11.9% 1 002 479 0.3% 1 910 1 001 - 5 000 17.3% 4 339 220 1.4% 382 5 001 - 10 000 3.5% 2 847 961 0.9% 557 10 001 - 50 000 5.0% 12 845 838 4.0% 155 50 001 - 100 000 1.4% 11 168 855 3.5% 266 100 001 and over 2.4% 285 922 140 89.7% 11 058 100.0% 318 904 709 100.0%
Geographical holding by beneficial ordinary shareholder as at 31 March 2021
Investec Limited
n South Africa 64.1%
n UK 4.1%
n USA and Canada 13.1%
n Rest of Europe 5.4%
n Asia 0.1%
n Other countries and unknown 13.2%
Largest ordinary shareholders as at 31 March 2021
In accordance with the terms provided for in Section 56 of the South African Companies Act, 2008, the group has conducted investigations into the registered holders of its ordinary shares (including nominee and asset management companies) and the results are as disclosed below.
Investec Limited
Shareholder analysis by manager groupNumber
of shares%
holding
1. Public Investment Corporation (ZA) 42 895 324 13.5% 2. Allan Gray (ZA) 29 164 629 9.2% 3. Investec Staff Share Scheme (ZA) 24 973 434 7.8% 4. Sanlam Group (ZA) 11 569 125 3.6% 5. BlackRock Inc (US & UK) 10 938 965 3.4% 6. The Vanguard Group, Inc (US) 8 831 140 2.8% 7. Westwood Global Investments (US) 8 219 098 2.6% 8. Prudential Portfolio Mgrs (ZA) 8 010 749 2.5% 9. Absa Group Limited (ZA) 7 106 361 2.2%
10. Old Mutual Investment Group (ZA) 7 027 649 2.2% Cumulative total 158 736 474 49.8%
The top 10 shareholders account for 49.8% of the total shareholding in Investec Limited. This information is based on a threshold of 20 000 shares. Some major fund managers hold additional shares below this, which may cause the above figures to be marginally understated.
04 Shareholder analysis Investec Limitedgroup and company annual financial statements 2021
SHAREHOLDER ANALYSIS
149

Share statistics
For the year ended 31 March 2021 31 March 2020
Price earnings ratio1 7.6 4.5 Dividend payout ratio (%) 45.0 38.1*Dividend yield (%) 5.9 5.3*Earnings yield (%)1 13.2 22.3
Investec Limited
For the year ended 31 March 2021 31 March 2020
Daily average volumes of shares traded (‘000) 2 089 1 344 Closing market price per share (Rands) 43.27 33.99 Number of ordinary shares in issue (million) 318.9 318.9 Market capitalisation (R’million)2 40 007 31 686 Market capitalisation (£’million)2 2 025 1 417
1. Calculations are based on the adjusted earnings per share from continuing operations and the closing share price.2. This calculation of market capitalisation excludes the group's treasury shares. For the market capitalisation of Investec plc, the LSE only includes the
shares in issue for Investec plc, as Investec Limited is not incorporated in the UK. For the market capitalisation of Investec Limited, the JSE has agreed to use the total number of shares in issue for the combined group, comprising Investec plc and Investec Limited.
* In light of regulatory guidance provided to banks in both South Africa and the UK, the board decided not to declare a final ordinary dividend for the 2020 financial year. The 11.0 pence in FY2020 reflects the interim dividend per share which was prior to the demerger of the asset management business (Ninety One).The dividend payout ratio and dividend yield are therefore calculated with reference to the corresponding adjusted earnings and closing share price, respectively, for the six months ended 30 September 2019.
Investec preference sharesInvestec Limited and Investec Bank Limited have issued preference shares.
Spread of preference shareholders as at 31 March 2021Investec Limited perpetual preference shareholders
Number of shareholders Holdings
% of total shareholders
Number of preference
shares in issue
% of issued preference
share capital
880 1 – 500 16.7% 250 655 0.8% 1 039 501 – 1 000 19.7% 859 409 2.8% 2 306 1 001 – 5 000 43.8% 5 595 657 18.2% 510 5 001 – 10 000 9.7% 3 697 938 12.0% 454 10 001 – 50 000 8.6% 8 713 248 28.3% 39 50 001 – 100 000 0.8% 1 310 554 4.3% 37 100 001 and over 0.7% 10 329 000 33.6% 5 265 100.0% 30 756 461 100.0%
Investec Bank Limited perpetual preference shareholders
Number of shareholders Holdings
% of total shareholders
Number of preference
shares in issue
% of issued preference
share capital
735 1 – 500 22.0% 165 503 1.1% 756 501 – 1 000 22.6% 655 633 4.4% 1 291 1 001 – 5 000 38.6% 3 164 269 21.2% 313 5 001 – 10 000 9.4% 2 310 559 15.5% 212 10 001 – 50 000 6.3% 3 946 468 26.5% 21 50 001 – 100 000 0.6% 897 998 6.0% 16 100 001 and over 0.5% 3 777 129 25.3% 3 344 100.0% 14 917 559 100.0%
Largest preference shareholders as at 31 March 2021
Shareholders holding beneficial interests in excess of 5.0% of the issued preference shares are as follows:
Investec Limited perpetual preference sharesThere were no shareholders holding beneficial interests in excess of 5.0% of the issued preference shares in Investec Limited, as at 31 March 2021.
Investec Bank Limited perpetual preference sharesThere were no shareholders holding beneficial interests in excess of 5.0% of the issued preference shares in Investec Bank Limited, as at 31 March 2021.
04 Annual financial statements Investec Limitedgroup and company annual financial statements 2021
SHAREHOLDER ANALYSISCONTINUED
150


Annexure 1: Summary employment equity progress report at 31 March 2021Every designated employer that is a public company is required in terms of section 22 of the Employment Equity Act to publish a summary report of their employment equity progress in their integrated annual report. Investec Limited’s progress in this regard is reported in the table below.
Occupational level*Male
African Coloured IndianWhite/
Foreign
Top management 3 2 10 Senior management 133 48 120 662 Professionally qualified and experienced specialist and mid-management 276 58 121 268 Skilled, academic, junior management, supervisors, foremen and superintendents 136 20 39 34 Semi-skilled and discretionary decision-making 248 27 11 10 Total 796 153 293 984
Female
African Coloured IndianWhite/
Foreign Total
Top management 1 2 18 Senior management 101 35 119 491 1 709 Professionally qualified and experienced specialist and mid management 393 150 222 482 1 970 Skilled, academic, junior management, supervisors, foremen and superintendents 141 48 52 47 517 Semi-skilled and discretionary decision-making 377 69 8 27 777 Total 1 012 302 402 1 049 4 991
* Where: Top management is Investec’s South African management forum. The remaining occupational levels are defined as per the South African Employment Equity Act.
Annexure 2: Home loan mortgage disclosure at 31 December 2020In terms of the Home Loan Mortgage Disclosure Act 63 of 2003, all financial institutions are required to disclose information regarding the provision of home loans. Investec offers home loans to individuals through its Private Banking division. The information required to be disclosed by the Act can be seen in the tables below.
Number ofapplications
Randamount
Applications received 14 827 34 290 760 387 Approved 10 762 25 519 917 479 Declined 172 361 455 683 Disbursed/paid out 5 844 14 169 636 221
Race groupsAfrican Coloured
Analysis by race groupNumber of
applicationsRand
amountNumber of
applicationsRand
amount
Applications received 3 554 6 281 186 650 751 1 526 610 986 Approved 2 458 4 382 403 290 565 1 167 576 464 Declined 82 145 612 411 5 10 459 550 Disbursed/paid out 1 330 2 292 654 382 254 482 952 081
05 Annual financial statements Investec Limitedgroup and company annual financial statements 2021
ADDITIONAL INFORMATION
152

Annexure 2: Home loan mortgage disclosure at 31 December 2020 (continued)Race groups (continued)
Indian White Other
Number ofapplications
Randamount
Number ofapplications
Randamount
Number ofapplications
Randamount
Applications received 1 226 2 756 046 057 6 768 16 886 739 029 2 528 6 840 177 664 Approved 880 2 037 689 546 4 980 12 754 843 573 1 879 5 177 404 605 Declined 12 45 158 250 55 110 525 037 18 49 700 435 Disbursed/paid out 424 968 009 446 2 503 6 035 682 573 1 333 4 390 337 739
ProvinceEastern Cape Free State
Analysis by regionNumber of
applicationsRand
amountNumber of
applicationsRand
amount
Applications received 679 1 298 442 713 202 481 624 995 Approved 500 951 766 601 146 361 300 631 Declined 9 14 635 250 — — Disbursed/paid out 301 614 536 186 70 137 898 096
Gauteng KwaZulu-Natal Limpopo
Number ofapplications
Randamount
Number ofapplications
Randamount
Number ofapplications
Randamount
Applications received 7 665 16 549 926 872 1 324 3 254 071 560 214 326 402 248 Approved 5 378 12 002 613 716 964 2 401 093 422 167 265 314 226 Declined 123 264 658 316 9 19 076 050 6 11 981 211 Disbursed/paid out 2 947 6 605 259 392 659 1 656 969 112 71 123 933 219
Mpumalanga North West
Number ofapplications
Randamount
Number ofapplications
Randamount
Applications received 297 490 266 457 200 362 057 783 Approved 216 363 514 107 137 247 025 883 Declined 2 751 455 3 4 460 751 Disbursed/paid out 107 239 175 809 68 131 954 933
Northern Cape Western Cape
Number ofapplications
Randamount
Number ofapplications
Randamount
Applications received 55 99 320 850 4 201 11 428 646 909 Approved 39 77 156 350 3 215 8 850 132 544 Declined 1 — 19 45 892 650 Disbursed/paid out 16 32 987 225 1 605 4 626 922 250
05 Annual financial statements Investec Limitedgroup and company annual financial statements 2021
ADDITIONAL INFORMATIONCONTINUED
153

The following abbreviations have been used throughout this report: ADR Forum Arrears, Recovery and Default ForumAGM Annual general meetingAI Artificial IntelligenceAIRB Advanced Internal Ratings-BasedAML Anti-money launderingAUM Assets under managementBASA Banking Association of South AfricaBCBS Basel Committee of Banking SupervisionBSE Botswana Stock ExchangeCA Chartered AccountantCAM Combined Assurance MatrixCCB Capital conservation bufferCCR Counterparty credit riskCCyB Countercyclical capital bufferCDS Credit default swapCEM Current exposure methodCE Chief executiveCET1 Common equity tier 1CFT Combating the financing of terrorismCFO Chief Financial OfficerCLR Credit Loss RatioCOO Chief Operating OfficerCOVID Corona Virus DiseaseCPD Continuous Professional DevelopmentCRISA Code for Responsible Investing in South AfricaCRO Chief Risk OfficerCVA Credit valuation adjustmentDLC Dual listed companyDLC BRCC DLC Board Risk and Capital CommitteeDLC Nomdac DLC Nominations and Directors Affairs CommitteeDLC SEC DLC Social and Ethics CommitteeD-SIB Domestic systemically important bank EBITDA Earnings before interest, taxes, depreciation and amortisationECL Expected credit lossEIR Effective interest rateEP Equator PrinciplesEQAR Engagement Quality Assessment ReviewESG Environmental, social and governanceFIRB Foundation Internal Ratings-BasedFRC Financial Regulatory CouncilFSLAB Financial Sector Laws Amendment BillFSR Act Financial Sector Regulation Act 9 of 2017 FTA Foreign Trade AgreementFUM Funds under managementFVOCI Fair value through other comprehensive incomeFVPL Fair value through profit and lossGDP Gross domestic productGDPR General Data Protection RegulationGISD UN Global Investment for Sustainable DevelopmentGRRRMF Group Risk Review and Reserves Matters ForumHLA Higher loss-absorbencyHNW High net worthHR Human resourcesIAM Investec Asset ManagementIASs International Accounting StandardsIBL Investec Bank LimitedIBL BRCC IBL Board Risk and Capital CommitteeIBL ERC IBL Executive Risk CommitteeIBL Review ERRF IBL Review Executive Risk Review ForumIBM Investec Bank of MauritiusIBP Investec Bank plc
ICAAP Internal Capital Adequacy Assessment ProcessICR Individual capital requirementIEP IEP GroupIFB Investec for BusinessIFC International Finance CorporationIFRIC International Financial Reporting Interpretations CommitteeIFRS International Financial Reporting StandardIIA Institute of Internal AuditorsILAAP Internal Liquidity Adequacy Assessment ProcessIP Investec PropertyIPF Investec Property FundIRB Internal Ratings-BasedIRBA Independent Regulatory Board for AuditorsIRRBB Interest Rate Risk in the Banking BookIW&I Investec Wealth & InvestmentJIBAR Johannesburg Interbank Average RateJSE Johannesburg Stock ExchangeLCR Liquidity coverage ratioLHS Left hand sideLSE London Stock ExchangeMAFR Mandatory Audit Firm RotationMES Macro-Economic ScenariosNSFR Net stable funding ratioNACQ Nominal annual compounded quarterly in arrearsNSX Namibian Stock ExchangeOCI Other comprehensive incomePCAF Partnership for Carbon Accounting FinancialsPRA Prudential Regulation AuthorityRHS Right hand sideROU Right of use assetRPA technologies Robotic Process Automation technologies RWA Risk-weighted assetSA South AfricaSA-CCR Standardised Approach to Counterparty Credit RiskSDGs Sustainable Development GoalsSIFI Systemically important financial institutionSME Small and Medium-sized EnterprisesSMMEs Small, Medium & Micro EnterprisesSOE State-owned EnterpriseSouth African PA South African Prudential Authority (previously known as the Banking Supervision Division of the South African Reserve Bank)SPPI Solely payments of principal and interestSREP Supervisory Review and Evaluation ProcessTCFD Task Force on Climate-related Financial DisclosuresToR Terms of ReferencetCO2e Tonnes of CO2 emissionsUKLA United Kingdom Listing AuthorityUN United NationsUN GISD United Nations Global Investment for Sustainable DevelopmentVaR Value at RiskWACC Weighted average cost of capitalYES Youth Employment Service
Investec Limitedgroup and company annual financial statements 2021
GLOSSARY
154

Secretary and registered officeNiki van Wyk100 Grayston DriveSandown Sandton 2196PO Box 785700 Sandton 2146Telephone (+27) 11 286 7000Facsimile (+27) 11 286 7966
Websitewww.investec.com
Registration numberReg. No. 1925/002833/06
AuditorsKPMG Inc.Ernst & Young Inc.
SponsorsInvestec Bank Limited100 Grayston DriveSandown Sandton 2196PO BOX 785700 Sandton 2146
Transfer secretariesComputershare Investor Services (Pty) LtdRosebank Towers 15 Biermann AvenueRosebank 2196PO Box 61051Marshalltown 2107Telephone (+27) 11 370 5000
Directorate as at 23 June 2021Executive directors
Fani Titi (Chief Executive)Nishlan Samujh (Group Finance Director) Richard Wainwright (Executive director)Ciaran Whelan (Executive director)
Non-executive directorsPerry Crosthwaite (Chair)Zarina Bassa (Senior independent director) Henrietta BaldockDavid Friedland Philip Hourquebie Charles JacobsStephen KoseffLord Malloch-Brown KCMGNicky Newton-KingJasandra NykerPhilisiwe SibiyaKhumo ShuenyaneBrian Stevenson
Contact details
Contact details for all our offices can be found on the group’s website at: www.investec.com
For queries regarding information in this document
Investor RelationsTelephone (+27) 11 286 7070 or +44 (207) 597 5546e-mail: [email protected]:www.investec.com/en_za/welcome-to-investec/about-us/investor-relations.html
Investec Limitedgroup and company annual financial statements 2021
CORPORATE INFORMATION