
Invest Malaysia 2015 - maybank.com · Invest Malaysia 2015 ... Prime savers ratio rising Potential...
40
0 www.maybank.com Invest Malaysia 2015 Humanising Financial Services Mandarin Oriental, Kuala Lumpur 23 April 2015
Transcript of Invest Malaysia 2015 - maybank.com · Invest Malaysia 2015 ... Prime savers ratio rising Potential...
0www.maybank.com
Invest Malaysia 2015
Humanising Financial Services
Mandarin Oriental, Kuala Lumpur
23 April 2015

1
Invest Malaysia 2015
Financial Performance
Regional Achievements by Business Unit
Outlook and 2015 Strategic Priorities
Shareholder Returns
Maybank’s Future in the ASEAN Economic Community

22
We are guided by our Vision, Mission and Strategic Objectives
Vision
Strategic Objectives
Mission
To be a regional financial services leader
Humanising Financial Services
Community Financial
Services
1. Undisputed No. 1 Retail Financial Services provider in
Malaysia by 2015
2. Leading ASEAN wholesale bank eventually expanding to
Middle East, China & India
3. Undisputed Insurance & Takaful Leader in Malaysia and
Emerging Regional Player
4. Truly regional organisation with approximately 40% of pre-
tax profit derived from international operations by 2015
5. Global leader in Islamic Finance
Global Banking
Insurance and Takaful
International
Islamic Banking

33
Opportunities in the ASEAN Economic Community (1/3)
Favourable Demographics
We are positive about the future of ASEAN with the advent of the ASEAN Economic Community in 2015.
629 million
population
255 m6 m
31 m
69 m
16 m91 m
101 m
7 m
53 m
● 7th largest economy in the world, projected
to be 4th largest by 2030.
● Combined GDP of USD2.3 trillion, third
largest economy straddling China and India
● Average annual GDP growth of around 6%
over the past 15 years.
● More than 600 million people, third largest
in Asia after China and India. Larger than
EU (507 million) and NAFTA (474 million).
Economy
Increased Intra-Regional and China Trade
● Intra-ASEAN trade rose to USD520 billion in
2010 from just USD90 billion in 1993.
● China is ASEAN’s No. 1 trading partner, with
its share rising to 12% in 2011 from 2% in
1993.
● China-ASEAN bilateral trade is expected to
reach US$1 trillion by 2020 from USD500
billion in 2014.
44 4
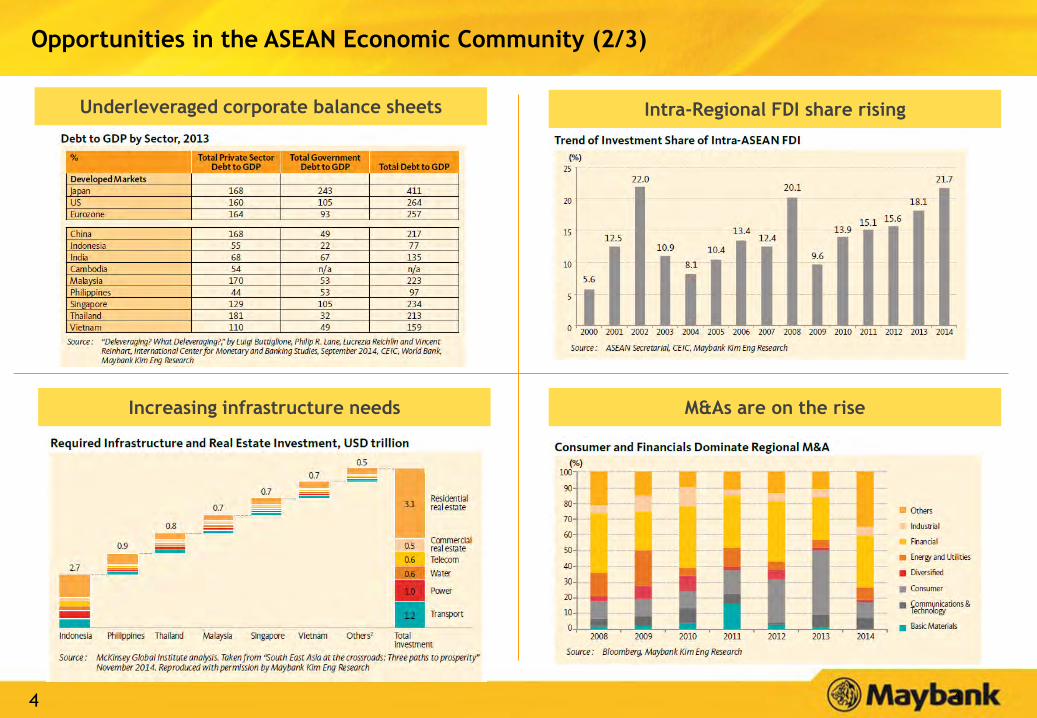
Opportunities in the ASEAN Economic Community (2/3)
Underleveraged corporate balance sheets Intra-Regional FDI share rising
M&As are on the riseIncreasing infrastructure needs

55 5
Opportunities in the ASEAN Economic Community (3/3)
5
Prime savers ratio rising Potential for higher financial inclusion
Significant upside for insurance Islamic banking set to expand
Source: Charts and data for slides 3-5 are from Big Ideas: The Charts of ASEAN,
produced by Maybank Kim Eng Research for the CAP10 ASEAN CEO Summit

6
Expanding ASEAN footprintMaybank is present in all ten ASEAN countries, making it a truly ASEAN franchise
BANK
MARKET
CAP
@
17 Apr 15
(USD Bil)
TOTAL
ASSETS
@
31 Dec 14
(USD Bil)
MALAYSIA
SIN
GAPO
RE
IND
ON
ESIA
TH
AIL
AN
D
PH
ILIP
PIN
ES
BRU
NEI
VIE
TN
AM
CAM
BO
DIA
LAO
S
MYA
NM
AR
1 DBS 39.0 333
2 OCBC 32.2 303
3 UOB 28.7 234
4 BCA 28.3 44
5 Maybank 24.3 183 *
6 Mandiri 21.8 69
7 Public 20.7 99
8 SCB 18.4 82
9 CIMB 14.1 118
10 Bangkok 11.1 84
11 BDO 9.6 42
12 Metrobank 6.9 36
Universal BankingRetail & Commercial
BankingInvestment Banking Affiliate/Representative Office * Wholesale Banking license only

7
44
65
69
82
99
118
183
232
303
333
Bank Central Asia
Bank Rakyat Indonesia
Bank Mandiri
Siam Commercial
Public Bank
CIMB
Maybank
UOB
OCBC
DBS
36.2
50.1
51.2
57.6
79.0
80.6
125.5
176.5
185.3
239.4
28.9
41.9
43.6
54.6
70.0
75.6
116.9
150.5
158.4
210.7
Bank Central Asia
Bank Rakyat Indonesia
Bank Mandiri
Siam Commercial
Public Bank
CIMB
Maybank
UOB
OCBC
DBS
Loans Deposits
950
1,381
1,390
1,642
1,676
2,045
2,053
2,565
3,034
3,194
CIMB
Public Bank
Bank Central Asia
Siam Commercial
Bank Mandiri
Bank Rakyat Indonesia
Maybank
UOB
OCBC
DBS
Strong Financial Position: Top 5 Bank in ASEANMaybank is a Top 5 ASEAN banking group in terms of assets, loans and deposits, and Net Profit
No.4 No.4
No.4
Total Assets (USD bil): 31 Dec 2014 Loans and Deposits (USD bil): 31 Dec 2014
Net Profit (USD mil): CY 31 Dec 2014 Market Capitalisation (USD bil): 17 April 2015
* Due to decline in Ringgit
*
39.0
32.2
28.7
28.3
25.0
24.3
21.8
20.7
18.4
14.1
DBS
OCBC
UOB
Bank Central Asia
Bank Rakyat Indonesia
Maybank
Bank Mandiri
Public Bank
Siam Commercial
CIMB
No.6
8 8
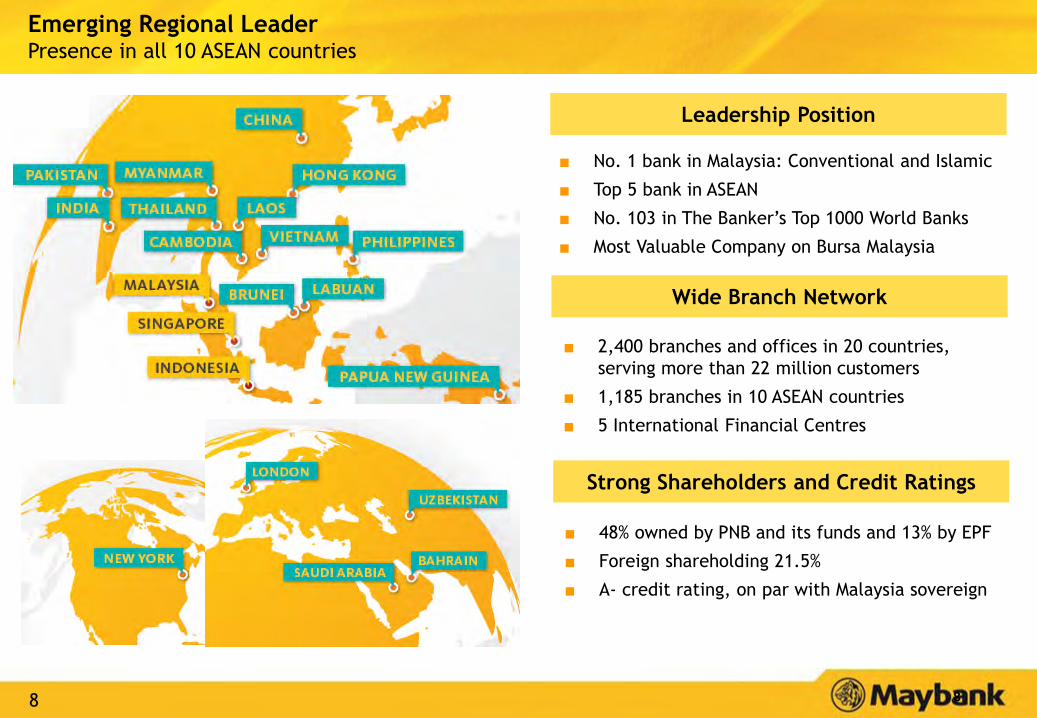
Emerging Regional LeaderPresence in all 10 ASEAN countries
■ No. 1 bank in Malaysia: Conventional and Islamic
■ Top 5 bank in ASEAN
■ No. 103 in The Banker’s Top 1000 World Banks
■ Most Valuable Company on Bursa Malaysia
■ 2,400 branches and offices in 20 countries,
serving more than 22 million customers
■ 1,185 branches in 10 ASEAN countries
■ 5 International Financial Centres
■ 48% owned by PNB and its funds and 13% by EPF
■ Foreign shareholding 21.5%
■ A- credit rating, on par with Malaysia sovereign
Wide Branch Network
Leadership Position
Strong Shareholders and Credit Ratings
99
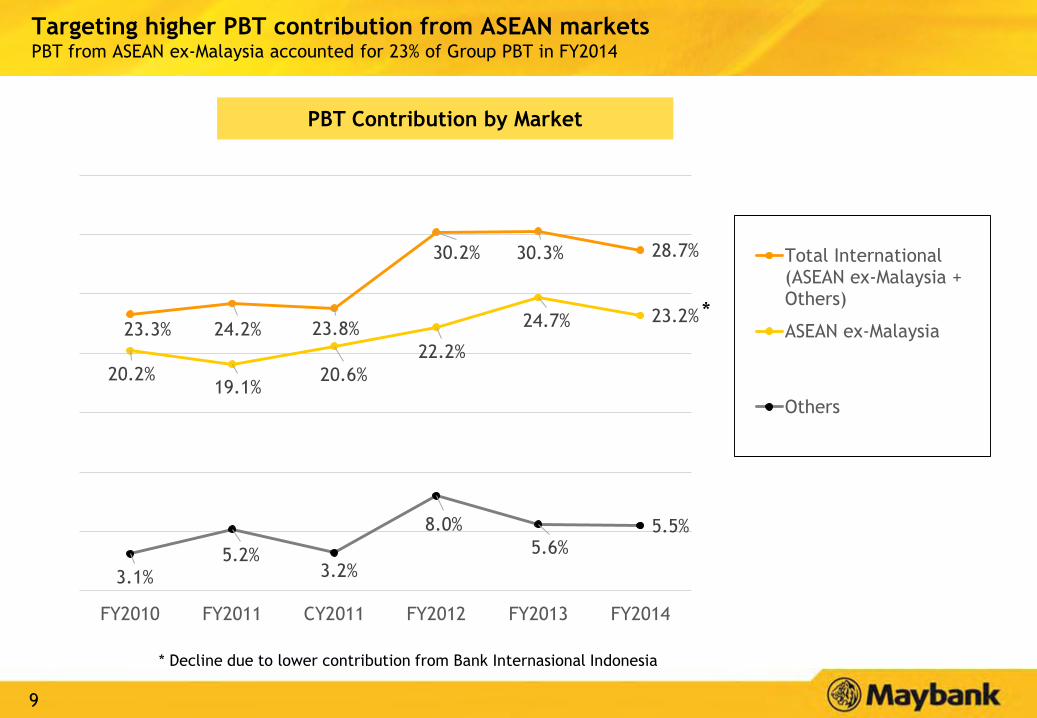
Targeting higher PBT contribution from ASEAN marketsPBT from ASEAN ex-Malaysia accounted for 23% of Group PBT in FY2014
PBT Contribution by Market
23.3% 24.2% 23.8%
30.2% 30.3% 28.7%
20.2%19.1%
20.6%
22.2%
24.7% 23.2%
3.1%
5.2%3.2%
8.0%
5.6%5.5%
FY2010 FY2011 CY2011 FY2012 FY2013 FY2014
Total International(ASEAN ex-Malaysia +Others)
ASEAN ex-Malaysia
Others
*
* Decline due to lower contribution from Bank Internasional Indonesia

10
Maybank’s Business UnitsRegionalisation is driving higher income contribution from international operations

11 11
New organisation structure from 2014
New organisation structure from 1st January 2014 resulted in greater Group synergies and better risk management.
Community Financial Services
Global Banking
Insurance & Takaful
Malaysia
Singapore
Indonesia
InternationalIslamic Banking
12
Invest Malaysia 2015
Financial Performance
Outlook and 2015 Strategic Priorities
Shareholder Returns
Maybank’s Future in the ASEAN Economic Community
Regional Achievements by Business Unit
13
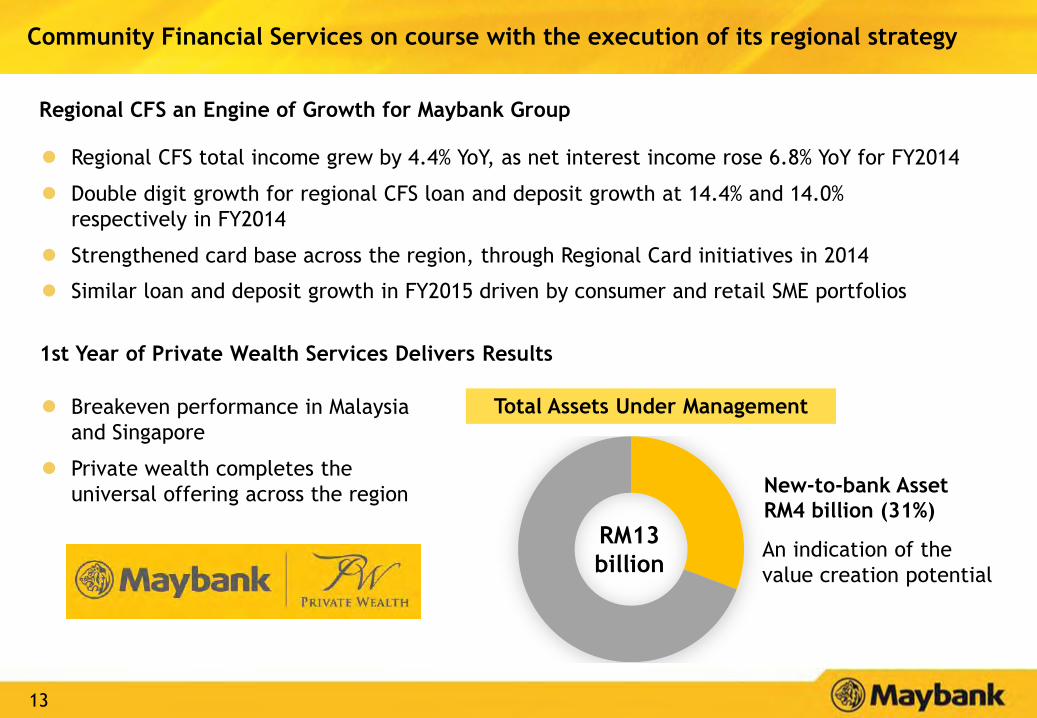
Community Financial Services on course with the execution of its regional strategy
Regional CFS total income grew by 4.4% YoY, as net interest income rose 6.8% YoY for FY2014
Double digit growth for regional CFS loan and deposit growth at 14.4% and 14.0%
respectively in FY2014
Strengthened card base across the region, through Regional Card initiatives in 2014
Similar loan and deposit growth in FY2015 driven by consumer and retail SME portfolios
Regional CFS an Engine of Growth for Maybank Group
1st Year of Private Wealth Services Delivers Results
Breakeven performance in Malaysia
and Singapore
Private wealth completes the
universal offering across the region
RM13
billion
Total Assets Under Management
New-to-bank Asset
RM4 billion (31%)
An indication of the
value creation potential

14
Global Banking strengthened its regional play through multiple product and service offerings
Global Banking key achievements in 2014
Established regional centres of excellence and operating model in
Singapore for Maybank Kim Eng, Global Markets, Transaction Banking
and Asset Management Group
Improved Coverage
Model Across the
Region
Regionalised
Business Models and
Platforms
Established Regional
Centres of
Excellence
Secured 16% more key regional deals or more than 500 new accounts
Received 55 regional awards
Maybank Kim Eng: Maintained position as ASEAN’s largest equities
franchise in 2014
Global Markets: Appointed Renminbi/Singapore dollar Market Maker and
completed first Award Winning Structured Note Issuance
Transaction Banking: Rolled out Maybank 2E Regional Cash in Cambodia,
completing footprint in ASEAN
Asset Management Group: Launched Maybank Global Sukuk fund and
received approval for distribution of two Maybank funds under the
ASEAN collective Investment Scheme

15
879
905
976
1,146
1,508
1,596
1,654
1,693
1,855
1,862
3.5%
3.6%
3.9%
4.6%
6.1%
6.4%
6.6%
6.8%
7.5%
7.5%
Bangkok Bank
HSBC
DBS
RHB Capital
BoA Merrill Lynch
UBS
JPMorgan
Credit Suisse
CIMB
Maybank
2,593
2,965
3,194
3,367
3,594
4,687
4,820
5,734
6,728
8,839
3.8%
4.3%
4.7%
4.9%
5.2%
6.8%
7.0%
8.4%
9.8%
12.9%
Krung Thai Bank
Kasikornbank
Siam Commercial Bank
RHB
AmInvestment
Standard Chartered
DBS
HSBC
Maybank
CIMB
Source: 1Dealogic, 2Bloomberg
Maybank Kim Eng (MKE) among the top investment banks in ASEAN
Equity Brokerage League Table by Country
Country Rank Market ShareTrading Value
(USD m)
Thailand 1 10.6% 67,310
Malaysia 4 9.2% 30,509
Indonesia 7 3.9% 9,782
Philippines 4 6.9% 6,743
Singapore N.A. 5.6% 22,380
Hong Kong Tier2 0.2% 10,479
Equity Capital Markets (USD mil)1
ASEAN Domestic Bonds (USD mil)2
MKE is ASEAN’s largest equity franchise with the
highest trade value in 2014
MKE secured the highest ASEAN ECM deal volume MKE’s PBT increased its contribution to Group’s
PBT from 1.5% in FY2011 to 4.3% in FY2014
MKE’s role in the largest China bond issuance by a
South East Asian issuer solidified its Top 2 position
(RM mil) 2011 2012 2013 2014
Total Income 888.1 1,279.0 1,536.3 1,515.3
Income contribution
to Maybank Group5.5% 6.8% 7.8% 7.4%
PBT 126.4 346.2 461.8 478.8
PBT contribution to
Maybank Group1.5% 3.5% 4.6% 4.3%
Note: Kim Eng was consolidated in May 2011 and PBT Contribution to Maybank Group is
calculated before elimination of Group head office cost
16
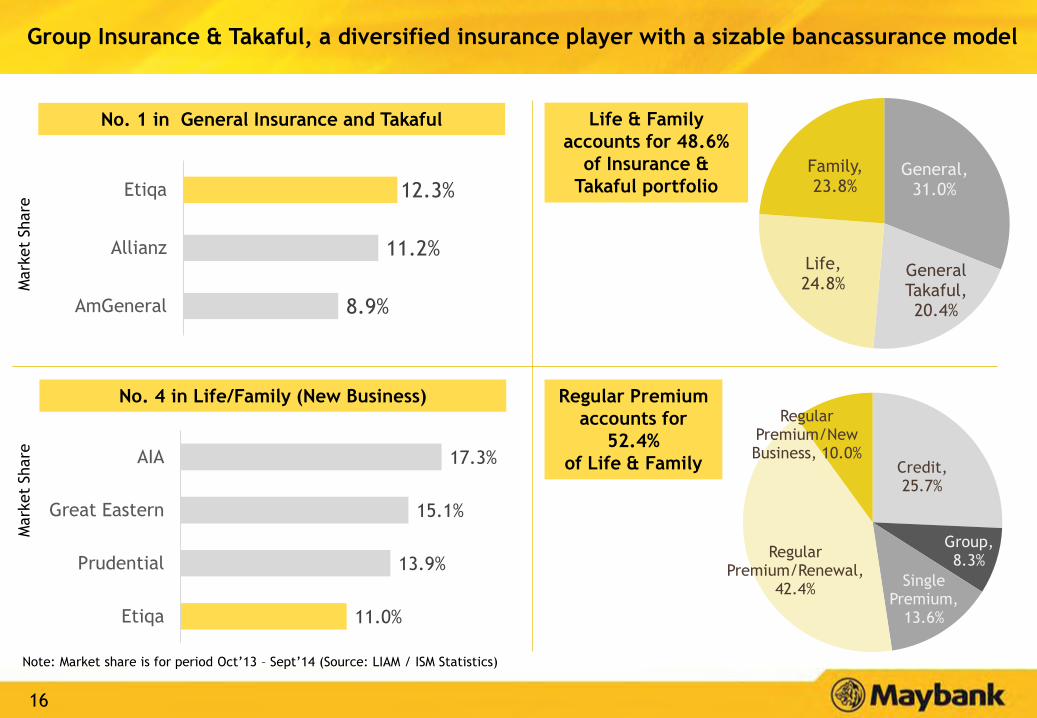
Group Insurance & Takaful, a diversified insurance player with a sizable bancassurance model
No. 1 in General Insurance and Takaful
Note: Market share is for period Oct’13 – Sept’14 (Source: LIAM / ISM Statistics)
8.9%
11.2%
12.3%
AmGeneral
Allianz
Etiqa
Mark
et
Share
Mark
et
Share
No. 4 in Life/Family (New Business)
11.0%
13.9%
15.1%
17.3%
Etiqa
Prudential
Great Eastern
AIA
Life & Family
accounts for 48.6%
of Insurance &
Takaful portfolio
Regular Premium
accounts for
52.4%
of Life & Family
General, 31.0%
General Takaful, 20.4%
Life, 24.8%
Family, 23.8%
Credit, 25.7%
Group, 8.3%
Single Premium,
13.6%
Regular Premium/Renewal,
42.4%
Regular Premium/New Business, 10.0%
17
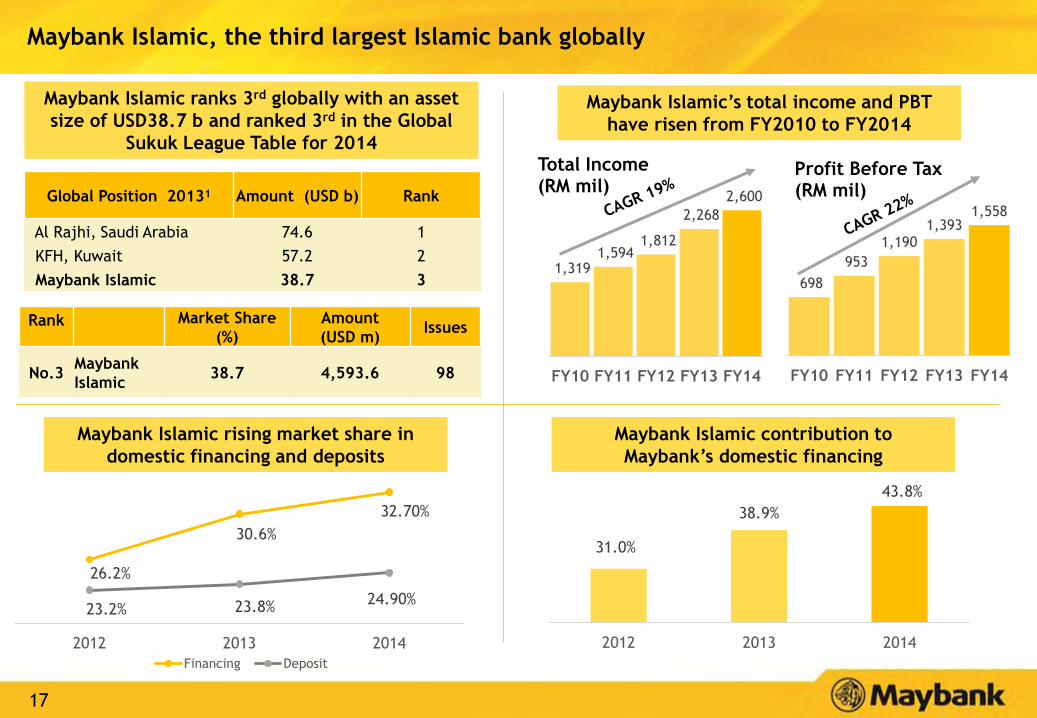
Maybank Islamic, the third largest Islamic bank globally
Source: The Banker November 2014, excludes Iran
26.2%
30.6%
32.70%
23.2% 23.8%24.90%
2012 2013 2014
Financing Deposit
31.0%
38.9%
43.8%
2012 2013 2014
Maybank Islamic ranks 3rd globally with an asset
size of USD38.7 b and ranked 3rd in the Global
Sukuk League Table for 2014
Maybank Islamic contribution to
Maybank’s domestic financing
Maybank Islamic’s total income and PBT
have risen from FY2010 to FY2014
1,319 1,594
1,812
2,268
2,600
FY10 FY11 FY12 FY13 FY14
Total Income (RM mil)
698
953
1,190 1,393
1,558
FY10 FY11 FY12 FY13 FY14
Profit Before Tax (RM mil)
Maybank Islamic rising market share in
domestic financing and deposits
Global Position 20131 Amount (USD b) Rank
Al Rajhi, Saudi Arabia 74.6 1
KFH, Kuwait 57.2 2
Maybank Islamic 38.7 3
Rank Market Share
(%)
Amount
(USD m)Issues
No.3Maybank
Islamic38.7 4,593.6 98

18
Invest Malaysia 2015
Regional Achievements by Business Unit
Outlook and 2015 Strategic Priorities
Shareholder Returns
Maybank’s Future in the ASEAN Economic Community
Financial Performance

19
FY2014 Headline Key Performance IndicatorsMaybank ROE at 13.8%, supported by a stronger performance in the second half of 2014
Notes:
1 Annualised
* Last revised ROE guidance announced on 26 November 2014
# in local currency terms.
Singapore’s industry loan growth average comprises domestic business unit (DBU) loans
FY2014
Guidance
Headline KPI
Return on Equity 13% - 14%* 13.50% 14.60% 13.8% -
Other targets
Group Loans Growth 13% 7.50% 18.70% 13.4% -
• Malaysia 9% - 10% 2.50% 15.20% 9.0% 8.7%
• Singapore # 13% 14.60% 11.20% 13.3% 5.9%
• Indonesia # 16% - 17% 9.00% 1.70% 5.4% 11.4%
• Community Financial Services 15.30% 14.80% 15.6% N.A
• Global Banking -10.60% -35.40% -22.0% N.A
Group Deposits Growth 10% - 12% 5.50% 16.30% 11.1% -
Industry
Average
Acheivement
FY2014Key Performance Indicators 1H FY2014¹ 2H FY2014¹

20 20
Summary Financial Performance for 2014
Increased fund based income through Group loans growth of
13.4% while managing margin compression of 12 bps …
… but lower fee based income due to slower capital market
activity and lower forex profit …
By kept overheads growth under controls through the
Strategic Cost Management Programme, and …
… with significantly lower impairment losses helped by higher
bad debt recovery,…
… we delivered profit to shareholders which was 2.5%
higher than the previous year.
EPS declined due to expanded capital base from DRP.
Net Fund Based Income
RM12.6b, +5.9%
Net Fee Based Income
RM5.9b, -10.7%
Net Income
RM18.5b, 0.0%
Overhead expenses
RM9.1b, +2.1%
Impairment losses
RM0.47b, -46.5%
Profit after Tax and
Minority Interest
RM6.7b, +2.5%
Earnings per Share
74.2 sen, -2.2%
… led to flat net income growth.

2121
2.80
2.70
2.72
2.80
2.56 2.53
2.48
2.43 2.31
FY07 FY08 FY09 FY10 FY11 PF11 FY12 FY13 FY14
42.8
44.4
52.2
46.5
49.2
49.7
48.6 47.8
48.9
FY07 FY08 FY09 FY10 FY11 PF11 FY12 FY13 FY14
86.1
88.0
87.6
86.9
90.2
87.8
89.8 89.9
91.8
FY07 FY08 FY09 FY10 FY11 PF11 FY12 FY13 FY14
17.6
15.2
3.1
14.5 14.5 15.2 16.0
15.1 13.8
FY07 FY08 FY09 FY10 FY11 PF11 FY12 FY13 FY14
Key Operating RatiosMaintained good performance amidst challenging environment
2015 guidance
13.0-14.0
90.0
threshold
2015 guidance
-10 bps (2.21)
2015 guidance
47-48
Return on Equity (%) Net Interest Margin (%)
Loan to Deposit Ratio (%) Cost to Income Ratio (%)

22
Asset QualitySlight uptick in Impaired Loans Ratios but still robust asset quality
82.3%86.9%
105.6% 107.5%
95.6%
3.34%
2.84%
1.78%
1.48% 1.52%
0%
1%
2%
3%
4%
5%
0%
20%
40%
60%
80%
100%
120%
FY11 PF11 FY12 FY13 FY14
Loan Loss Coverage
Group Gross Impaired Loans Ratio
3.93%3.51%
2.00% 1.69% 1.85%
FY11 PF11 FY12 FY13 FY14
0.46% 0.53% 0.42%
0.29%0.23%
FY11 PF11 FY12 FY13 FY14
4.15%
2.29% 2.18% 2.81%3.24%
FY11 PF11 FY12 FY13 FY14
Indonesia (BII Group)
Singapore
Malaysia
Gross Impaired Loans RatioGroup Gross Impaired Loans Ratio
and Loan Loss Coverage Ratio
*
* Inclusive of regulatory reserve is 100.0%
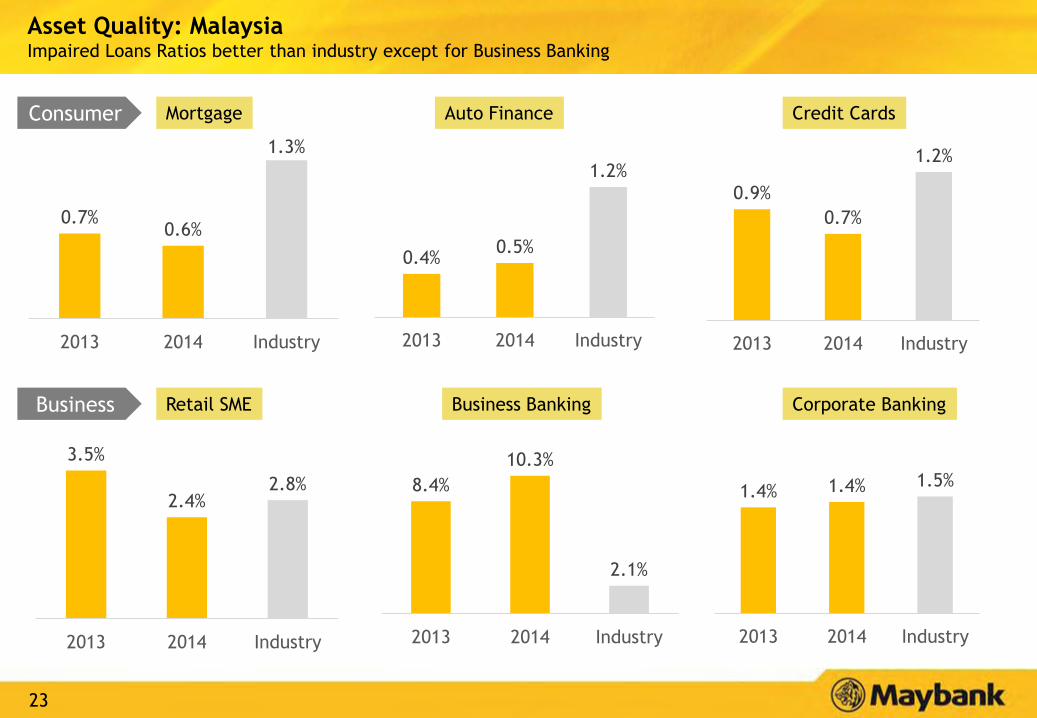
23
0.9%
0.7%
1.2%
2013 2014 Industry
Asset Quality: MalaysiaImpaired Loans Ratios better than industry except for Business Banking
0.7%0.6%
1.3%
2013 2014 Industry
Mortgage
0.4%0.5%
1.2%
2013 2014 Industry
Auto Finance Credit Cards
3.5%
2.4%2.8%
2013 2014 Industry
Retail SME Business Banking Corporate Banking
8.4%
10.3%
2.1%
2013 2014 Industry
1.4% 1.4% 1.5%
2013 2014 Industry
Consumer
Business

2424
Strong Capital Adequacy
11.57%
10.22%11.02% 11.39%
CY 2011 FY 2012 FY 2013 FY 2014
16.29% 15.85% 15.43% 15.88%
CY 2011 FY 2012 FY 2013 FY 2014
Note: The capital ratios for CY 2011 and FY2012 are adjusted for dividend payment and reinvestment made under the Dividend Reinvestment Plan
(DRP) and capital ratios for FY 2013 and FY 2014 are on the assumption of 85% reinvestment rate under the DRP
4%
BNM
Regulatory
Minimum
8%
BNM
Regulatory
Minimum
The Group is well capitalised and will continue to maintain sufficient levels of capital and an
optimum mix of different capital components to ensure sufficient support for the underlying
risks of the Group’s business, to optimise growth and to withstand capital demands under various
market conditions.
Common Equity Tier 1 (CET1) ratio Total Capital ratio

2525
Singapore
… balanced by higher deposits growth of
16.5%, also exceeding industry.
19.6%
9.2%
13.8% 13.4%
Dec 13 Dec 14
Business loans grew 12.3% to S$12.2 billion driven by syndicated, term and revolving
credit.
Consumer loans grew 15.4% to reach S$22.8 billion driven by housing and other personal
loans but car loans continued to decline due to the tighter regulatory financing limits
Expanded our Insurance and Takaful presence in Singapore through Etiqa
13.7%
7.1%8.5%
16.5%
Dec 13 Dec 14
Industry Growth Maybank Singapore Growth
Maybank Singapore loans growth of 13.4%
exceeded industry and …
Loans Growth Deposits Growth

2626
103.7
30.9 35.3 35.8
109.4
24.0
40.8 41.5
Total Global Banking Business Banking Consumer
2013 2014
Indonesia
1,545
699
2013 2014
Bank Internasional Indonesia’s net profit fell 55% to Rp 699 trillion mainly due to higher
loan loss provisions (+126%) for specific corporate accounts affected by adverse market
conditions.
To arrest asset quality deterioration, credit approval procedures were tightened resulting
in Global Banking loans declining 22% but Business Banking and Consumer loans grew
15.5% and 16.0%,
-55% -22.3% +16.0%+5.4% +15.5%
Net Profit (Rp trillion) Loans (Rp trillion)

2727
We secured a banking license in Myanmar and opened a representative
office
Myanmar will enable us to facilitate cross-border trade, not only in our
core markets but also the Greater Mekong Subregion.
International
International PBT contribution (excluding Singapore and Indonesia) increased by
32.8% YoY.
International providing cross-border solutions and capturing trade flow between the
ASEAN region and China
Provides wholesale and investment banking services to commercial
and corporate clients in Hong Kong and China.
Opened our latest China branch in Kunming, Yunnan.
Landmark achievement: Appointment of Maybank as a
Renminbi/Singapore dollar Market MakerGreater
China
Myanmar

2828
Invest Malaysia 2015
Financial Performance
Regional Achievements by Business Unit
Outlook and 2015 Strategic Priorities
Maybank’s Future in the ASEAN Economic Community
Shareholder Returns

2929
0.69
3.824.45
2.58
5.756.55 6.72
2.67#
FY 2009* FY 2010 FY 2011 6 months FP2011 ^ FY 2012 FY 2013 FY 2014
Net Profit
3.1%
14.5% 15.2%16.2% 16.0%
15.1%13.8%
ROE (%)
RM 6 billion
Rights Issue
Launched
House of
Maybank
Acquired
Kim Eng
RM 3.66 billion
Equity Private
Placement
Delivering on Shareholder Return Maybank has seen a steady rise in earnings as we stayed focused on our regional strategy and business growth
Summary of Analysts' Recommendations
as at 27 Feb 2015
Target Price RM10.15
Coverage 25 analysts
Recommendations 15 Buy, 7 Hold, 3 Sell
Analysts'
Consensus:
Net Profit
(RM mil)
FY2014 6,517
FY2015 6,916
* FY2009: Lower net profit due to impairment of investment in BII and MCB
# RM2.67 billion: FY2009 PATAMI before impairment of investment in BII and MCB
^ 6 months Financial Period ended 31 Dec 2011 due change in financial year end
FY2014 PATAMI of RM6.72
billion was 3.1% ahead of
consensus

3030
6.01
5.29 5.24
7.07
5.38
5.84
-
1
2
3
4
5
6
7
8
2009 2010 2011 2012 2013 2014
Maybank Public Bank CIMB DBS UOB OCBC Mandiri BCA Bank Rakyat Siam Comm Kasikorn Bank Bangkok Bank
Maybank provides superior dividend yield amongst most regional banks
Annual Dividend Yield 2009-2014
Source: Bloomberg
(%)

3131
High Dividend PayoutGross dividend for 2014 at 57 sen, 6.5% higher than the previous year
60.0% 61.0%
76.5% 74.9% 79.9% 74.7% 71.9%78.5%
26
11
28 3222.5 24
18
8
44
32
36
33
3133
FY08** FY09 FY10 FY11 FP11 FY12 FY13 FY14
Final
Interim
● Dividend payout ratio for 2014 at 78.5% continues to be above policy rate of 40% - 60%
* Reinvestment rate for the Dividend Reinvestment Plan
** Adjusted for 1:4 Bonus Issue in February 2008 and 9:20 Rights Issue at RM2.74 in March 2009
# The Net Dividend is 28.5 sen of which 15 sen is single-tier dividend.
85.9%*
85.7%*
88.2%* 85.9%*88.5%*
91.1%*
86.1%*
88.6%*
#
N.A.*
44.0
8.0
55.0
60.0
36.0
65.0
53.557.0
84.0%*
Dividend
Payout Ratio
Gross Dividend (sen) and Payout Ratio (%)

3232
Invest Malaysia 2015
Financial Performance
Regional Achievements by Business Unit
Shareholder Returns
Maybank’s future in the ASEAN Economic Community
Outlook and 2015 Strategic Priorities

33
Key Indicators
Malaysia
Consumer lending expected to moderate
Top line for banks to be challenging with
subdued capital markets and soft loan
demand
Competition for deposits to remain keen
amid on-going liquidity pressure
Cost and capital management will remain
key priorities
Market Outlook for 2015
GDP (f): 4.5% (2014: 6%)
System loan growth (f): 7-8%
System deposit growth: (f) 6-7%
OPR: 3.25% (2014: 3.25%)
USD/MYR (f): 3.61 (2014: 3.27)
Inflation (f): 4.0% (2014: 3.2%)
Outlook

34
Key Indicators
Singapore
Government expected to maintain
property cooling measures to prevent
speculative activity
Asset quality to remain stable
Market Outlook for 2015
GDP (f): 2.5% (2014: 2.9%)
System Loan growth (f): 8%-9%
System Deposit growth (f): 5%-6%
USD/SGD (f): 1.35 (2014: 1.28)
Inflation (f): 1.0% (2014: 1.0%)
Outlook

35
Key Indicators
Indonesia
Government infrastructure spending likely
to increase, supporting loan growth in 2H
FY2015
Funding to remain tight, leading to margin
pressure as LDR remains elevated
Weaker commodity prices could adversely
impact asset quality and domestic demand
Market Outlook for 2015
GDP (f): 5.5% (2014: 5.02%)
System Loan growth (f): 15%
System Deposit growth (f): 15%
Reference Rate (f): 8.0%
(2014: 7.75%)
USD/IDR average (f): 12514 (2014:
11885)
Inflation average (f): 7.25% (2014:
6.42%)
Outlook

3636 36
Revenue generation
Strengthen the Group’s revenue growth
Continue with international market performance
Solidify our position in ASEAN for AEC opportunities
e.g. Qualified ASEAN bank
Productivity and Efficiency
Continue focus on productivity Group-wide
Deploy capital efficient strategy
Group Strategic Priorities for 2015
3737
Focus on productivity Group-wide
Continue with Strategic Cost Management Programme to manage our
overheads growth in a comfortable range against income growth
Focus on IT expenses, marketing expenses and general and administrative
expenses.
Drive productivity improvements, measured by profitability over cost ratio
per employee.
Capital efficient strategy
Drive more productive use of capital over the medium to longer term since
additional capital buffer requirements will be introduced for domestic
systemically important banks.
Adopt right risk posture to balance our capital needs and provide an
optimum return for our shareholders.
Productivity and Efficiency
3838
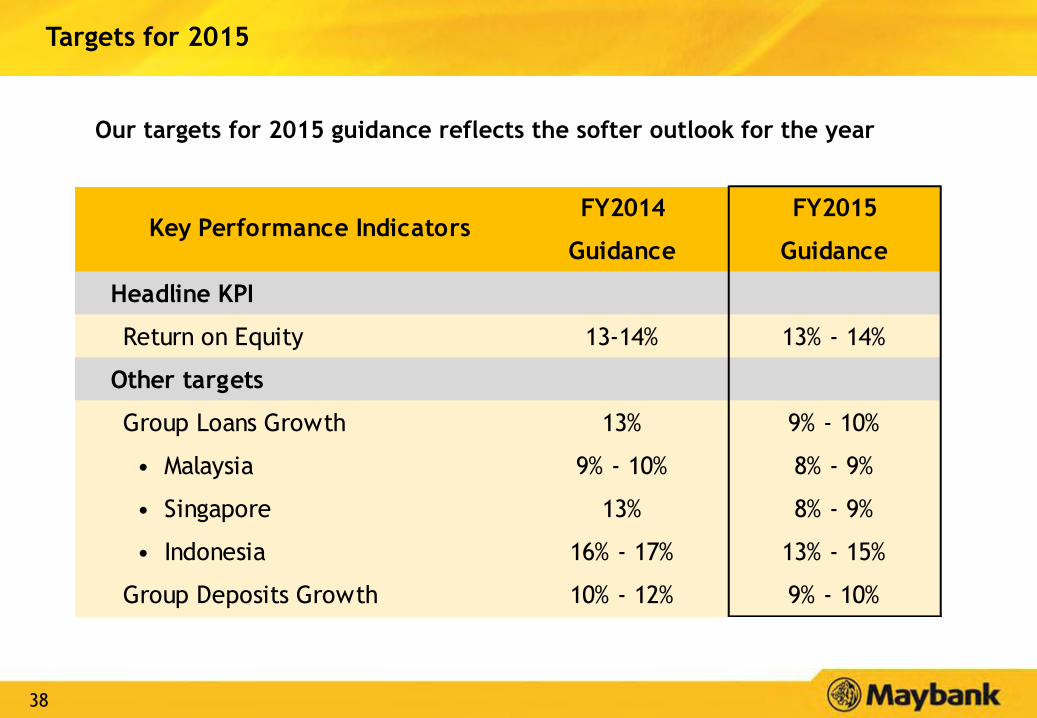
Targets for 2015
Our targets for 2015 guidance reflects the softer outlook for the year
FY2014 FY2015
Guidance Guidance
Headline KPI
Return on Equity 13-14% 13% - 14%
Other targets
Group Loans Growth 13% 9% - 10%
• Malaysia 9% - 10% 8% - 9%
• Singapore 13% 8% - 9%
• Indonesia 16% - 17% 13% - 15%
Group Deposits Growth 10% - 12% 9% - 10%
Key Performance Indicators

39
Mohamed Rafique Merican
Group Chief Financial Officer
Contact: (6)03-2074 7878
Email: [email protected]
MALAYAN BANKING BERHAD
14th Floor, Menara Maybank
100, Jalan Tun Perak
50050 Kuala Lumpur, Malaysia
Tel : (6)03-2070 8833
www.maybank.com
Narita Naziree
Head, Group Performance Reporting& Investor Relations
Contact: (6)03-2074 8017
Email: [email protected]
Disclaimer. This presentation has been prepared by Malayan Banking Berhad (the “Company”) for information purposes only and does not purport to contain all the
information that may be required to evaluate the Company or its financial position. No representation or warranty, express or implied, is given by or on behalf of the
Company as to the accuracy or completeness of the information or opinions contained in this presentation.
The presentation does not constitute or form part of an offer, solicitation or invitation of any offer, to buy or subscribe for any securities, nor should it or any part of
it form the basis of, or be relied in any connection with, any contract, investment decision or commitment whatsoever.
The Company does not accept any liability whatsoever for any loss howsoever arising from any use of this presentation or their contents or otherwise arising in
connection therewith.
Investor Relations Contact
Humanising Financial Services


