Invesco Investment Solutions brochure · Inv estme nt Insights: Capital mar ket assumptions Q2 2019...
16
Invesco Investment Solutions A world of investment complexity. A consultative, flexible partner to optimise portfolio outcomes. This marketing document is exclusively for use by Professional Clients and Financial Advisers in Continental Europe (as defined in the important information), Qualified Investors in Switzerland, Professional Clients in Dubai, Ireland, Isle of Man, Jersey, Guernsey and the UK. This document is not for consumer use, please do not redistribute.
Transcript of Invesco Investment Solutions brochure · Inv estme nt Insights: Capital mar ket assumptions Q2 2019...

Invesco Investment SolutionsA world of investment complexity.A consultative, flexible partner to optimise portfolio outcomes.
This marketing document is exclusively for use by Professional Clients and Financial Advisers in Continental Europe (as defined in the important information), Qualified Investors in Switzerland, Professional Clients in Dubai, Ireland, Isle of Man, Jersey, Guernsey and the UK. This document is not for consumer use, please do not redistribute.

Navigate markets. Drive outcomes. Enhance portfolios.Multi-dimensional thinking for all investment challenges.
Aligning your investments with your organisational needs truly takes a holistic approach. And with today's myriad of investment challenges some of the world’s most sophisticated organisations are turning to Invesco Investment Solutions (IIS). We combine a client-centric focus and multi-asset expertise with one of the broadest and deepest sets of capabilities in the industry to help achieve the results you seek.
Through advisory consultation, custom solutions and strategic partnerships, IIS harnesses the right combination of strategies across Invesco’s full spectrum of active, passive, factor, and alternative investments to solve your organisational needs. From robust research and analysis, to portfolio construction, to the creation of fully bespoke solutions, we bring transformative thinking and unique perspectives to your portfolio.
02 Invesco | Investment Solutions

03
Uniquely positioned to deliver
purposeful outcomes
Expert investment insight
We are a global team of more than 90 PhD and master's
degree holders, with decades of experience managing multi-asset portfolios.
Industry-leading analytics
We offer deep risk assessment, portfolio stress-
testing and enhanced modeling powered by the Invesco
Vision analytics platform.
Diversity of thought
Invesco's ~£1 trillion investment management
platform puts us in an excellent position to offer a vast array of investment solutions to fit
almost any investor need.

04 Invesco | Investment Solutions
Portfolio management
Research and analytics
Uses a multi-dimensional approach to portfolio construction and asset allocation
Client solutions
InvescoInvestmentSolutions Leads advisory
relationships and develops custom
solutions
Builds tailored multi-asset portfolios

A partnership built for results
Solutions at a glance1
We engage with you and your investment team to improve overall portfolio efficiency through our expertise in:
Portfolio diagnostics, creation and implementation Asset allocation, including extensive expertise in alternatives
Factor-based analysis and implementation
Asset/liability management
Economic and regulatory risk
Overlays and custom solutions
Whether you are looking for a strategic partner across your entire investment universe or for a single strategy, our dedicated client solutions strategists, portfolio managers, and analysts will help you reach your objectives with a clear understanding of your industry and the regulatory environment you face. By leveraging the firm’s extensive platform of expertise and solutions, plus dynamically pairing “building blocks” in unique and thoughtful ways, Invesco Investment Solutions can help deliver your desired outcomes.
05
1 For illustrative purposes only. Advisory services may not available in all jurisdictions.
£22bn assets under management
60+ professionals
15+ average years across team leadership
90+ PhDs/master's degrees and designations
10+ global locations across North America, EMEA and APAC
Access to the full resources of the firm, a £950bn platform

06 Invesco | Investment Solutions
Capital Markets Assumptions Seeking to turn investment research into investment opportunities
Invesco Investment Solutions develops capital markets assumptions (CMAs) that provide long-term estimates for the behaviour of major asset classes globally to help guide strategic asset allocation.
The Invesco Investment Solutions team has developed a distinct methodology and process for CMAs offering investors a new level of transparency when it comes to portfolio construction.
The team employ a fundamentally based “building block” approach to developing assumptions for expected return, volatility and correlation with other asset classes.
For illustrative purposes only.
Our building block approach to estimating returns
Equity
Fixed Income
Commodities
Yield Valuation change
Roll return
Credit adjustment
Yield Valuation change
Earnings growth
+ +
+ + –
Collateral return
Roll return
Spot return
+ +
Income Capital
07
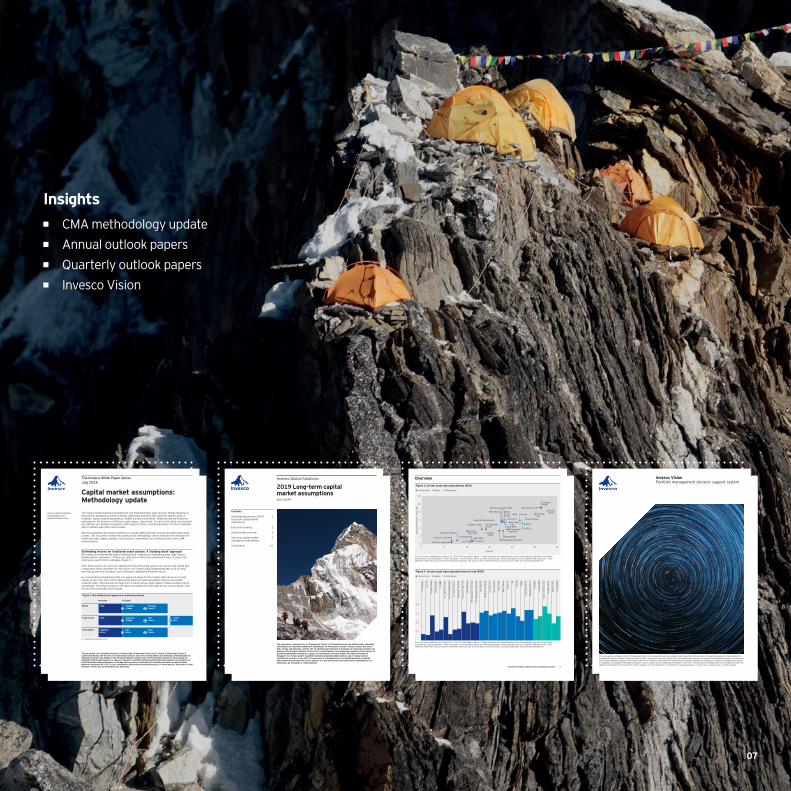
Insights
CMA methodology update
Annual outlook papers
Quarterly outlook papers
Invesco Vision
Invesco Vision Portfolio management decision support system
The document is intended only for Professional Clients in Continental Europe (as defined under Important Information); for Qualified Investors in Switzerland; for Professional Clients in Dubai, Ireland, the Isle of Man, Jersey and Guernsey, and the UK; for Institutional Investors in Australia; for wholesale investors (as defined in the Financial Markets Conduct Act) in New Zealand, for Professional Investors in Hong Kong; for Qualified Institutional Investors in Japan; for Institutional Investors in Singapore; for Qualified Institutional Investors only in Taiwan and for Institutional Investors in the USA. The document is intended only for accredited investors as defined under National Instrument 45-106 in Canada. It is not intended for and should not be distributed to, or relied upon, by the public or retail investors.
Source: Invesco, estimates as of March 31, 2019. Proxies listed in figure 7. These estimates are forward looking, are not guarantees, and they involve risks, uncertainties, and assumptions. Please see page 7 for information about our CMA methodology. Please see page 9 for the complete CMA disclosure. These estimates reflect the views of Invesco Investment Solutions, the views of other investment teams at Invesco may differ from those presented here.
Figure 1: 10-year asset class expectations (EUR)
• Fixed income • Equity • Alternatives
Figure 2: 10-year asset class expected return-to-risk (EUR)
• Fixed income • Equity • Alternatives
Source: Invesco, estimates as of March 31, 2019. Proxies listed in figure 7. These estimates are forward looking, are not guarantees, and they involve risks, uncertainties, and assumptions. Please see page 7 for information about our CMA methodology. Please see page 9 for the complete CMA disclosure. These estimates reflect the views of Invesco Investment Solutions, the views of other investment teams at Invesco may differ from those presented here.
Overview
Investment Insights: Capital market assumptions Q2 2019 3
Risk (%)
Expe
cted
arit
hmet
ic r
etur
ns (
%)
25 300
2
4
6
8
10
12
20151050
Privateequity
Emergingmarket
Asia Pacific Ex JP
US SmallCap
UK
Commodities
Canada
Japan
US REITsEM AggregateCorporate
EM Aggregate
EM Aggregate Sovereign
US LargeCap
Global REITs
Global Infrastructure
Eurozone Corporate
Eurozone Aggregate
Eurozone TreasuryEurozoneHigh Yield
US MBS
US TIPS US Treasury
US Aggregate
HedgeFunds
US Banks Loans US High-YieldCorps
MSCI Europe
World Equity
Eurozone
MSCI EAFE
WorldEx-USEquity
Japa
n
0.1
0.2
0.3
Cana
daUK
Euro
zone
MSC
I Eur
ope
MSC
I EA
FE
US
Smal
l Cap
US
Larg
e Ca
p
Wor
ld E
x-U
S Eq
uity
Wor
ld E
quity
EM A
ggre
gate
Cor
pora
te
EM A
ggre
gate
Sov
erei
gn
EM A
ggre
gate
Euro
zone
Hig
h Y
ield
Euro
zone
Cor
pora
te
Euro
zone
Tre
asur
y
Euro
zone
Agg
rega
te
US
Hig
h-Y
ield
Cor
ps
US
MBS
US
Agg
rega
te
US
Bank
Loa
ns
US
TIPS
Emer
ging
Mar
ket
US
Trea
sury
US
REI
Ts
Asi
a Pa
cific
Ex
JP
Glo
bal R
EITs
Priv
ate
Equi
ty
Glo
bal I
nfra
stru
ctur
e
Hed
ge F
unds
Com
mod
ities
0.4
Invesco Global Solutions
2019 Long-term capital market assumptions Euro (EUR)
The document is intended only for Professional Clients in Continental Europe (as defined under Important Information); for Qualified Investors in Switzerland; for Professional Clients in Dubai, Ireland, the Isle of Man, Jersey and Guernsey, and the UK; for Institutional Investors in Australia; for wholesale investors (as defined in the Financial Markets Conduct Act) in New Zealand, for Professional Investors in Hong Kong; for Qualified Institutional Investors in Japan; for Institutional Investors and/or Accredited Investors in Singapore; for certain specific Qualified Institutions/Sophisticated Investors only in Taiwan and for Institutional Investors in the USA. The document is intended only for accredited investors as definedunder National Instrument 45-106 in Canada. It is not intended for and should not be distributed to, or relied upon, by the public or retail investors.
Contents
Understanding Invesco’s 2019 long-term capital market assumptions
1
Executive summary 2
Global market overview 3
About our capital market assumption methodology
9
Contributors 10
The Invesco White Paper Series July 2018
Capital market assumptions: Methodology update
The Invesco Global Solutions Development and Implementation team (Invesco Global Solutions) is dedicated to designing outcome-oriented, multi-asset portfolios that meet the specific goals of investors. Capital market assumptions (CMAs) are key to this effort. CMAs provide the long-term estimates for the behavior of different asset classes. Specifically, for each of the asset classes which we estimate, we develop assumptions with regard to return, standard deviation of return (volatility) and correlation with other asset classes.
We have expanded the research platform to include additional time horizons and alternative asset classes. This document reviews the building block methodology which underpins the estimates for traditional asset classes (equities, fixed income, commodities) and introduces the recent CMA enhancements.
Estimating returns for traditional asset classes: A 'building block' approachWe employ a fundamentally based "building block" approach to estimating asset class returns. Building blocks represent a “bottom-up” approach in which the underlying drivers of asset class returns are used to form estimates (Figure 1).
First, these sources of return are identified by deconstructing returns into income and capital gain components. Next, estimates for each driver are formed using fundamental data such as yield, earnings growth and valuation, and combined to establish estimated returns.
By incorporating fundamental data, our approach allows for the relative attractiveness of asset classes to vary over time. Other approaches based on historical relative returns can provide relatively static risk-premiums through time in which certain asset classes contain constant return advantages. The following section will detail and present the estimates across various equity, fixed income and commodity asset classes.
Figure 1: Our building block approach to estimating returns
Yield
Yield
Collateralreturn
Valuationchange
Earningsgrowth
Valuationchange
Rollreturn
Spotreturn
Creditloss
Equity
• Income • Capital
Fixed income
Commodities Rollreturn
For illustrative purposes only.
This document is for Qualified Investors in Switzerland, Professional Clients only in Dubai, Professional Clients in Continental Europe and the UK; for Institutional Investors only in the United States and Australia; in New Zealand for wholesale investors (as defined in the Financial Markets Conduct Act); for Professional Investors in Hong Kong; for Qualified Institutional Investors in Japan; in Taiwan for Qualified Institutions/Sophisticated Investors; in Singapore for Institutional/Accredited Investors; in Canada, this document is restricted to Accredited Investors as defined under National Instrument 45-106. It is not intended for and should not be distributed to, or relied upon by, the public or retail investors. Please do not redistribute this document.
Invesco Global Solutions Development and Implementation team

08 Invesco | Investment Solutions
Your portfolio should be based on your beliefs about the world and the future. Invesco Investment Solutions’ team of global research professionals, with expertise across a variety of domains (e.g., Mathematics, Statistics, Data Science, etc.), dedicated years of research and effort to developing the Invesco Vision portfolio management decision support system. The platform was specifically designed around the idea of providing professional investors with the information they need to make better informed investing decisions. The system provides a wide variety of capabilities including:
Asset and liability modelling
Portfolio construction
Portfolio analytics
Invesco Vision was created to allow for more productive collaborations with our clients and to support investors in most effectively applying their judgement in the portfolios they manage.
Greater insights for better investment decisions.Introducing Invesco Vision

09
1
3
2
4
Develop consistent expectations for portfolio assets using Investment Solutions’ assumptions or an investor’s own expectations
Assess your current asset allocation compared to your risk/return targets
Model liabilities to optimise funding ratio risk and target sufficient short-term liquidity
Evaluate the impact of changes to the asset allocation such as adding, removing, or reweighting assets
5
7
6
8
Identify and quantify the sources of portfolio return and risk to understand what is driving investment outcomes
Gain greater clarity about return and risk trade-offs within your portfolio and identify additional opportunities for diversification
Understand the risks of portfolio assets and liabilities to more fully understand your exposures and vulnerabilities
Stress test your portfolio for performance under various “what if” scenarios

Model assets and liabilities
10 Invesco | Investment Solutions
The output of any risk management or portfolio construction exercise is a function of the inputs used.
Estimating portfolio asset return, risk, and correlation expectations is central to portfolio and risk analyses. Some of the challenges we can help investors with in these efforts include:
Developing consistent return estimates across all portfolio assets
Developing risk and correlation estimates for alternative/private market assets
Establishing asset or liability benchmarks that are aligned with client objectives
Liability Factor analysis Isolated Risk
CFs 10 10 Curve GBP Trsy GBP Real
Years Nom CFs Real CFs Years Nom Rates Real Rates Specific Risk
Total
Spec. Risk
Credit
Inflation
Rates
Isolated risk (%)0 2 4 6 8 10
0.5 12.79 12.79 0.5 0.72 -2.33 01.5 13.36 13.36 1.0 0.71 -2.33
Real CF Multiplier2.5 13.89 13.89 1.5 0.73 -2.27
0.793.5 14.37 14.37 2.0 0.74 -2.24
4.5 14.80 14.80 2.5 0.79 -2.18
5.5 15.16 15.16 3.0 0.82 -2.14
6.5 15.46 15.46 3.5 0.87 -2.1
7.5 15.69 15.69 4.0 0.91 -2.06
8.5 15.84 15.84 4.5 0.96 -2.02
Cash flow Analytics
• Nominal cash flow • Real cash flow • Real cash flow (Infl Adj) • Present value
Cas
h fl
ow
s
50 yr40 yr30 yr20 yr10 yr0 yr
10
20
30
40£ Mln Items Nominal Real
Yield (%) 1.65 -1.59OAS to treasury (bps) 0 -328Effective duration 13.56 17.23Modified duration 13.77 17.38Convexity 2.87 4.27
Type ≤ 30 year › 30 year TotalNominal 766.0 80.1 846.0PV 789.2 91.6 880.8
For illustrative purposes only.

Portfolio construction
11
Having the right tools is critical to achieving desired outcomes.
A broad set of portfolio construction approaches allows us to develop portfolios that consider investors’ preferences for a variety of return and risk tradeoffs in achieving specific investment objectives.
Absolute and relative risk optimisation
Robust optimisation
Liability matching (ALM, LDI, and CDI)
Portfolio constructions with regulatory considerations (Solvency II)
Return-agnostic optimization
Efficient frontier Factor analysis Isolated Risk
• Frontier • Frontier with alternatives Benchmark Portfolio
Isolated risk (%)
Geo
met
ric r
etur
n (%
)
0 5 10 15 20 252
4
6
8
10
Corporate bondAggregate bond
High yield RE US CORE
IFRE US RENEW
PortfolioBenchmark
US large capRE US MEZ
Emergingmarket equity
PE US SBO
Developed ex US equity
0 2 4 6 8 10
Total
Currency
Specific Risk
Hedge Fund
Private
Real Estate
Commodity
Equity
Credit
Inflation
Rates
Frontier weights Weights details
Weight (%)
Wei
ght
(%)
0 10 20 30 40 50 600
20
40
60
80
100
1050 15 20 25
Total risk (%)
Total risk (%)
IFRE US Ren
PE US SBO
RE US Core
RE US Mez
Em Mkt Eq
Dev xUS Eq
US LC Eq
High Yield
Corp Bond
Agg Bond
Selected portfolio
For illustrative purposes only.
12 Invesco | Investment Solutions
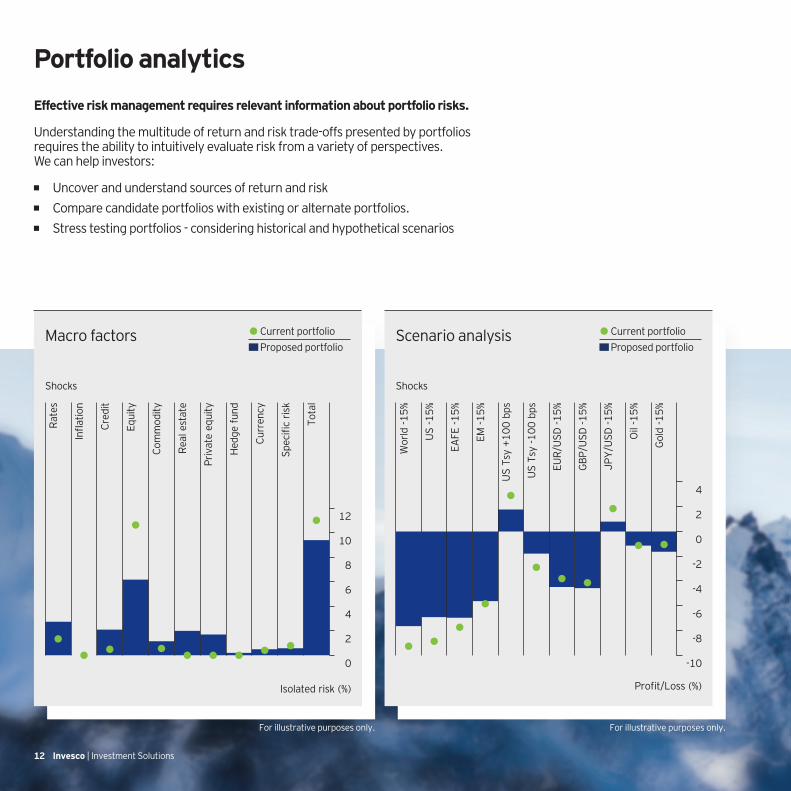
Portfolio analytics
Effective risk management requires relevant information about portfolio risks.
Understanding the multitude of return and risk trade-offs presented by portfolios requires the ability to intuitively evaluate risk from a variety of perspectives. We can help investors:
Uncover and understand sources of return and risk
Compare candidate portfolios with existing or alternate portfolios.
Stress testing portfolios - considering historical and hypothetical scenarios
Macro factors Current portfolio
Proposed portfolioScenario analysis Current portfolio
Proposed portfolio
Rat
es
Infla
tion
Cred
it
Equi
ty
Com
mod
ity
Rea
l est
ate
Priv
ate
equi
ty
Hed
ge f
und
Curr
ency
Spec
ific
risk
Tota
l
10
0
Isolated risk (%)
8
6
4
2
12 2
0
-2
-4
-8
4
-10
Profit/Loss (%)
-6
EUR
/USD
-15%
US
Tsy
-100
bps
US
Tsy
+100
bps
EM -1
5%
EAFE
-15%
US
-15%
JPY
/USD
-15%
Wor
ld -1
5%
Oil
-15%
GBP
/USD
-15%
Gol
d -1
5%
Shocks Shocks
For illustrative purposes only.For illustrative purposes only.

13
Portfolio Selection
An investor’s portfolio is the practical expression of their beliefs about the future, their investment objectives, their constraints, and their willingness to bear a variety of risks.
Portfolio selection is when the application of the many judgements made throughout the portfolio analysis process results in the identification of a portfolio that balances the achievement of specified outcomes with the understanding and acceptance of a variety of return and risk trade-offs. Successful portfolio selection requires access to the right types of analytical resources, the right types of investments, and the right investment partners.
Efficient frontier Factor analysis Isolated Risk Benchmark
0 4 8 12 16 20
Total relative risk (%)
Optimal absoluterisk portfolio
Weight (%)
Wei
ght %
0 20 40 60 800
0 42 86 1210 1614 2018
2 6 10 14 18
20
40
60
80
100
Frontier weights Weights details
G lobal AggG lobal TsryG lobal CorpUS MBSG lobal HYUS LC EqDev xUS EqWorld EquityEm Mkt EqRE Wrld CorePE US LBO
Total relative risk (%) Relative risk (%)0.0 0.2 0.4 0.6 0.8 1.0
-3
-2
-1
0
1
2
3
Geo
met
ric re
turn
(%
)
TotalCurrencySpecific riskHedge fundPrivateReal estateCommodityEquityCreditInflationRates
0.0 0.2 0.4 0.6 0.8 1.0
Minimum tracking error portfolio
Reference portfolio(benchmark) Developed ex US equity
US large cap
RE world coreG lobal high yield
US securitizedG lobal treasury
G lobal corporate
PE US LBO
Emerging market equityAbsolute risk efficient frontier
For illustrative purposes only.

14 Invesco | Investment Solutions

Contact us
Amsterdam Telephone +31 20 561 62 61 www.invesco.nl
Brussels Telephone +32 2 64 10 17 0 www.invesco.be
Dubai Telephone +971 4 425 0950 www.invesco.ae
Frankfurt Telephone +49 69 2980 7800 www.de.invesco.com
Madrid Telephone +34 91 78 13 02 0 www.invesco.es
Milan Telephone +39 02 88074 1 www.invesco.it
Paris Telephone +33 1 5662 4377 www.invesco.fr
Stockholm Telephone +46 84 63 11 09 www.invesco.eu
UK Telephone +44 1491 417000 www.invesco.co.uk
Vienna Telephone +43 1 316 200 www.invesco.at
Zurich Telephone +41 44 287 90 00 www.invesco.ch
15
Telephone calls may be recorded in the UK.

Invesco is a leading investment management firm with one singular purpose: To help investors get more out of life by delivering a superior client experience.
Invesco designs portfolios for a complex investment world.
Investment risks
The value of investments and any income will fluctuate (this may partly be the result of exchange rate fluctuations) and investors may not get back the full amount invested.
Important information
This presentation is exclusively for use by Professional Clients and Financial Advisers in Continental Europe, Qualified Investors in Switzerland, Professional Clients in Dubai, Ireland, Isle of Man, Jersey, Guernsey and the UK. This document is not for consumer use, please do not redistribute.
For the distribution of this document, Continental Europe is defined as Austria, Belgium, Finland, France, Germany, Italy, Luxembourg, Netherlands, Norway, Spain and Sweden.
This does not constitute a recommendation of any investment strategy or product for a particular investor. Investors should consult a financial professional before making any investment decisions.
This overview contains general information only and does not take into account individual objectives, taxation position or financial needs. Nor does this constitute a recommendation of the suitability of any investment strategy or product for a particular investor.
It is not an offer to buy or sell or a solicitation of an offer to buy or sell any security or instrument or to participate in any trading strategy to any person in any jurisdiction in which such an offer or solicitation is not authorised or to any person to whom it would be unlawful to market such an offer or solicitation. It does not form part of any prospectus.
Where individuals or the business have expressed opinions and forecasts, they are based on current market conditions, they may differ from those of other investment professionals at Invesco and are subject to change without notice. As with all investments, there are associated inherent risks. Please obtain and review all financial material carefully before investing.
By accepting this document, you consent to communicate with us in English, unless you inform us otherwise.
All information is sourced from Invesco, unless otherwise stated. All data as of 30 June 2019 and is GBP.
Issued in Austria by Invesco Asset Management Österreich – Zweigniederlassung der Invesco Asset Management Deutschland GmbH, Rotenturmstrasse 16-18, 1010 Wien, Austria.
Issued in Belgium, Finland, France, Italy, Luxembourg, Netherlands, Norway, Spain and Sweden by Invesco Asset Management S.A., 16-18 rue de Londres, 75009 Paris, France.
Issued in Dubai by Invesco Asset Management Limited PO Box 506599, DIFC Precinct Building No 4, Level 3, Office 305, Dubai, United Arab Emirates. Regulated by the Dubai Financial Services Authority.
Issued in Germany by Invesco Asset Management Deutschland GmbH An der Welle 5, 60322 Frankfurt am Main, Germany.
Issued in Ireland by Invesco Global Asset Management DAC Central Quay, Riverside IV, Sir John Rogerson’s Quay, Dublin 2, Ireland. Regulated in Ireland by the Central Bank of Ireland. Issued in the Isle of Man by Invesco Global Asset Management DAC Central Quay, Riverside IV, Sir John Rogerson’s Quay, Dublin 2, Ireland. Regulated in Ireland by the Central Bank of Ireland.
Issued in Jersey and Guernsey by Invesco International Limited 2nd Floor, Orviss House, 17a Queen Street, St Helier, Jersey, JE2 4WD. Regulated by the Jersey Financial Services Commission.
Issued in Switzerland by Invesco Asset Management (Schweiz) AG, Talacker 34, 8001 Zurich, Switzerland.
Issued in the UK by Invesco Asset Management Limited Perpetual Park, Perpetual Park Drive, Henley-on-Thames, Oxfordshire RG9 1HH, UK. Authorised and regulated by the Financial Conduct Authority.
EMEA6474/64785/PDF/290819

![84335 P01EDT[01] - d7z22c0gz59ng.cloudfront.net · Tamiya EXPEC GT 2.4G B/C system Tanya EXPEC GT 2.4G system Ensemble RIC Tamiya EXPEC GT 2.4G ) *Small size ESC and receiver are](https://static.fdocuments.net/doc/165x107/5d2f377688c99331798ce3f3/84335-p01edt01-tamiya-expec-gt-24g-bc-system-tanya-expec-gt-24g-system.jpg)


![Übersicht€¦ · Syntax einer SQL-Anfrage 2 SQL und PL/SQL logische Abarbeitungsreihenfolge select [distinct] 5 from ...](https://static.fdocuments.net/doc/165x107/5b52c59d7f8b9a56588dbcb8/ue-syntax-einer-sql-anfrage-2-sql-und-plsql-logische-abarbeitungsreihenfolge.jpg)