Inventory Methods for Moles and Pocket Gopher · Inventory methods for moles and pocket gopher ......
76
Inventory Methods for Moles and Pocket Gopher Standards for Components of British Columbia's Biodiversity No. 26 Prepared by Ministry of Environment, Lands & Parks Resources Inventory Branch for the Terrestrial Ecosystems Task Force Resources Inventory Committee April 10, 2001 Version 2.0
Transcript of Inventory Methods for Moles and Pocket Gopher · Inventory methods for moles and pocket gopher ......

Inventory Methods forMoles and Pocket Gopher
Standards for Components of BritishColumbia's Biodiversity No. 26
Prepared byMinistry of Environment, Lands & Parks
Resources Inventory Branchfor the Terrestrial Ecosystems Task Force
Resources Inventory Committee
April 10, 2001
Version 2.0

© The Province of British ColumbiaPublished by theResources Inventory Committee
Canadian Cataloguing in Publication DataMain entry under title:Inventory methods for moles and pocket gopher [computer file]
(Standards for components of British Columbia’s biodiversity; no. 26)
Available on the Internet.Issued also in printed format on demand.Includes bibliographical references.ISBN 0-7726-4509-4
1. Moles (Animals) - British Columbia. 2. Pocket gophers - BritishColumbia. 3. Ecological surveys - British Columbia – Handbooks, manuals,etc. I. British Columbia. Ministry of Environment, Lands and Parks.Resources Inventory Branch. II. Resources Inventory Committee (Canada).Terrestrial Ecosystems Task Force. III. Series.
QL737.I57I58 200 333.95’933511’09711 C2001-960103-2
Additional Copies of this publication can be purchased from:
Government Publications CentrePhone: (250) 387-3309 orToll free: 1-800-663-6105Fax: (250) 387-0388www.publications.gov.bc.ca
Digital Copies are available on the Internet at:http://www.for.gov.bc.ca/ric

Biodiversity Inventory Methods - Moles and Pocket Gopher
April 10, 2001 iii
PrefaceThis manual presents standard methods for the inventory of moles and pocket gophers inBritish Columbia at three levels of inventory intensity: presence/not detected (possible),relative abundance, and absolute abundance. The manual was compiled by the ElementsWorking Group of the Terrestrial Ecosystems Task Force, under the auspices of theResources Inventory Committee (RIC). The objectives of the working group are to developinventory methods that will lead to the collection of comparable, defensible, and usefulinventory and monitoring data for the species component of biodiversity.
This manual is one of the Standards for Components of British Columbia’s Biodiversity(CBCB) series, which present standard protocols designed specifically for group of specieswith similar inventory requirements. Inventory Methods for Moles and Northern PocketGopher is labeled as Version 2.0, in keeping with the rest of the series, even though Version1.0 has never been published. The CBCB series includes an introductory manual (SpeciesInventory Fundamentals No. 1) which describes the history and objectives of RIC, andoutlines the general process of conducting a wildlife inventory according to RIC standards,including selection of inventory intensity, sampling design, sampling techniques, andstatistical analysis. The Species Inventory Fundamentals manual provides importantbackground information and should be thoroughly reviewed before commencing with a RICwildlife inventory. RIC standards are also available for animal capture and handling (No. 3),and radio-telemetry (No. 5). Field personnel should be thoroughly familiar with thesestandards before engaging in inventories, which involve either of these activities.
Standard data forms are required for all RIC wildlife inventory. Survey-specific data formsaccompany most manuals while general wildlife inventory forms are available in the SpeciesInventory Fundamentals No. 1 [Forms]. This is important to ensure compatibility withprovincial data systems, as all information must eventually be included in the SpeciesInventory Datasystem (SPI). For more information about SPI and data forms, visit theSpecies Inventory Homepage at: http://www.elp.gov.bc.ca/rib/wis/spi/
It is recognized that development of standard methods is necessarily an ongoing process. TheCBCB manuals are expected to evolve and improve very quickly over their initial years ofuse. Field-testing is a vital component of this process and feedback is essential. Commentsand suggestions can be forwarded to the Elements Working Group by contacting:
Conservation Biology Section,Resource Inventory BranchMinistry of Environment, Lands & ParksP.O. Box 9344, Station Prov GovtVictoria, BC V8W [email protected]


Biodiversity Inventory Methods - Moles and Pocket Gopher
April 10, 2001 v
AcknowledgmentsFunding of the Resources Inventory Committee work, including the preparation of thisdocument, is provided by the Corporate Resource Inventory Initiative (CRII) and by ForestRenewal BC (FRBC). Preliminary work of the Resources Inventory Committee was fundedby the Canada-British Columbia Partnership Agreement of Forest Resource DevelopmentFRDA II.
The Resources Inventory Committee consists of representatives from various ministries andagencies of the Canadian and the British Columbia governments as well as from First Nationspeoples. RIC objectives are to develop a common set of standards and procedures for theprovincial resources inventories, as recommended by the Forest Resources Commission in itsreport “The Future of our Forests”.
For further information about the Resources Inventory Committee and its various TaskForces, please access the Resources Inventory Committee Website at:http://www.for.gov.bc.ca/ric.
Terrestrial Ecosystems Task Force
The current version of this manual is the result of the hard work of S. Tim Sheehan, Virgil C.Hawkes and Mark A. Fraker. The background information and protocols presented in thisdocument are based on the unpublished government report, Sampling Techniques forFossorial Mammals: Moles and Pocket Gophers, prepared by S. Tim Sheehan and CarlosGalindo-Leal. Figures 1-5, 8 and 9 are taken from the Royal B.C. Museum handbookOpossums, Shrews and Moles of British Columbia by David W. Nagorsen; and are reprintedwith permission. Figures 6, 7, 10, 12 and 13 are original artwork by S. Tim Sheehan. Alldecisions regarding protocols are the responsibility of the Resources Inventory Committee.
The Components of British Columbia’s Biodiversity series is currently edited by JamesQuayle and Leah Westereng.


Biodiversity Inventory Methods - Moles and Pocket Gopher
April 10, 2001 vii
Table of ContentsPreface ........................................................................................................................... iii
Acknowledgments ............................................................................................................v
1. INTRODUCTION ....................................................................................................1
2. INVENTORY GROUP .............................................................................................3
2.1 Shrew-mole (Neurotrichus gibbsii) M-NEGI...........................................................4
2.2 Coast Mole (Scapanus orarius) M-SCOR ...............................................................8
2.3 Townsend’s Mole (Scapanus townsendii) M-SCTO............................................... 12
2.4 Northern Pocket Gopher (Thomomys talpoides) M-THTA...................................... 16
3. PROTOCOLS......................................................................................................... 21
3.1 Sampling Standards ............................................................................................. 22
3.1.1 Preliminary Surveys ..................................................................................... 22
3.1.2 Selecting Study Areas................................................................................... 23
3.1.3 Habitat Data Standards ................................................................................. 23
3.1.4 Time of Year ............................................................................................... 24
3.1.5 Handling...................................................................................................... 25
3.1.6 Identification of Moles.................................................................................. 27
3.1.7 Sexing Moles ............................................................................................... 28
3.1.8 Ageing Moles............................................................................................... 28
3.1.9 Marking Moles............................................................................................. 29
3.1.10 Mole Trapping.......................................................................................... 30
3.2 Inventory Surveys ................................................................................................ 35
3.3 Presence/Not Detected......................................................................................... 36
3.3.1 Sign Sampling.............................................................................................. 36

Biodiversity Inventory Methods - Moles and Pocket Gopher
viii April 10, 2001
3.4 Relative Abundance............................................................................................. 41
3.4.1 Sign Sampling.............................................................................................. 41
3.4.2 Ground or Aerial Photography to Count Sign ................................................. 42
3.5 Absolute Abundance............................................................................................ 44
3.5.1 Mark-recapture Sampling.............................................................................. 44
3.5.2 Removal Trapping ........................................................................................ 53
GLOSSARY.................................................................................................................. 54
REFERENCES .............................................................................................................. 57

Biodiversity Inventory Methods - Moles and Pocket Gopher
April 10, 2001 ix
List of FiguresFigure 1. Shrew-mole (Nagorsen 1996) ..............................................................................4
Figure 2. Shrew-mole distribution in BC (Nagorsen 1996)...................................................5
Figure 3. Shrew-mole (l) and Scapanus front foot (Nagorsen 1996) .....................................6
Figure 4. Coast Mole (Nagorsen 1996) ...............................................................................8
Figure 5. Coast Mole distribution in BC (Nagorsen 1996) ...................................................9
Figure 6. Mound and tunnel measurements for Scapanus spp. ...........................................10
Figure 7. Mole and Pocket Gopher mound differences ......................................................10
Figure 8. Townsend’s Mole (Nagorsen 1996) ...................................................................12
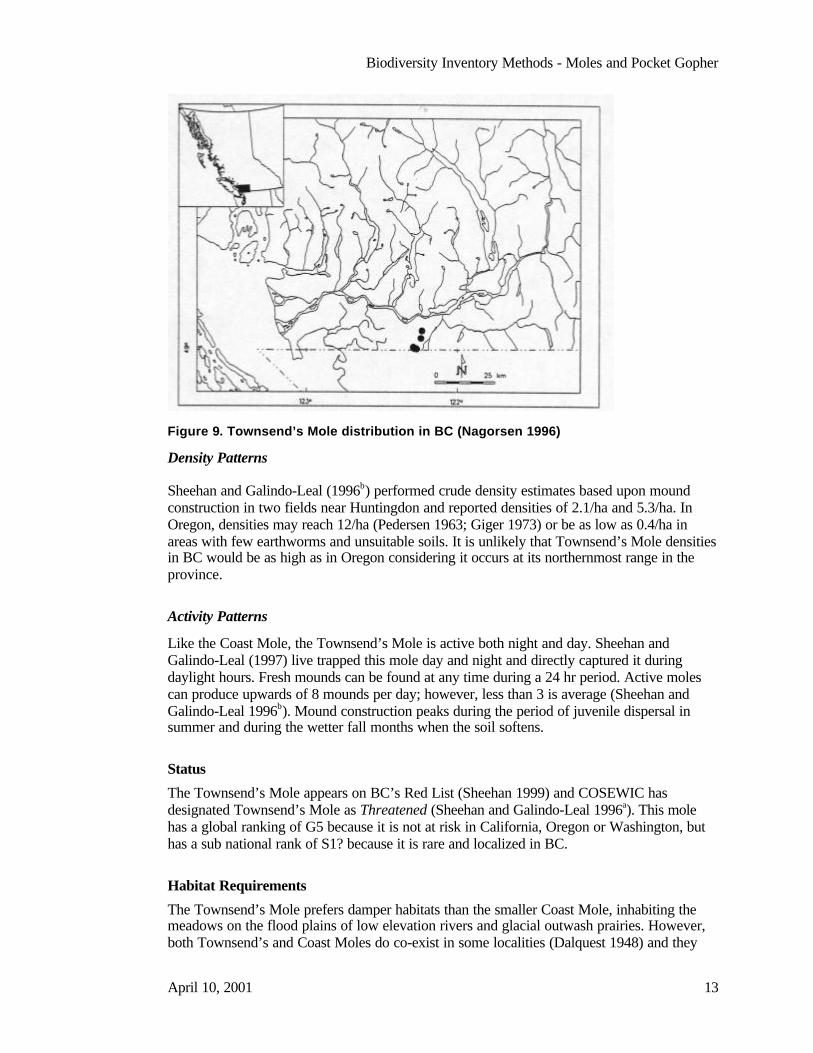
Figure 9. Townsend’s Mole distribution in BC (Nagorsen 1996) ........................................13
Figure 10. Mole holder....................................................................................................25
Figure 11. Victor-based live trap......................................................................................30
Figure 12. Pipe trap ........................................................................................................31
Figure 13. Direct capture technique..................................................................................31


Biodiversity Inventory Methods - Moles and Pocket Gopher
April 10, 2001 xi
List of TablesTable 1. Measurements of pocket gophers from different regions. Total length (TL), tail
length (T), hind foot (HF) (in mm) and weight (W) (in grams). ............................16
Table 2. Recommended methods for inventory of moles and pocket gophers in BritishColumbia at the three levels of intensity..............................................................21
Table 3. Standard measurements of moles in British Columbia. .........................................27
Table 4. Types of inventory surveys, the data forms needed, and the level of intensity of thesurvey. .............................................................................................................35
Table 5. Population estimation techniques that have been used to obtain relative abundance ofpocket gophers (After Teipner et al. 1983)..........................................................42
Table 6. Sources for sample size calculation.....................................................................49


Biodiversity Inventory Methods - Moles and Pocket Gopher
April 10, 2001 1
1. INTRODUCTIONIn general, fossorial mammals are small mammals with long pointed snouts that are coveredwith short, close-set fur. They walk in a plantigrade style and possess short limbs that areusually equipped with a full compliment of five digits. They have a highly developed sense oftouch and smell and small eyes and ears that may be barely visible (Gorman and Stone 1990).Most of them are also solitary or live in a simple social structure and survive on aninvertebrate diet. This manual will focus on fossorial mammals commonly known as molesand gophers.
In British Columbia there are three mole species in the family Talpidae; the Coast Mole(Scapanus orarius); the Townsend's Mole (Scapanus townsendii), and the Shrew-mole(Neurotrichus gibbsii). Both the Coast Mole and the Shrew-mole are extensively distributedthroughout the Lower Mainland. In contrast, the Townsend’s Mole is found only within a 15to 20 km2 area around Huntingdon and Abbotsford (Sheehan and Galindo-Leal 1996a). BothScapanus spp. are considered pests by various landowners because of the damage, real orperceived, created by their tunneling activities; as a result they frequently become the focusof indiscriminate kill-trapping efforts.
There is also one gopher species that exists in BC (Cowan and Guiguet 1973; Nagorsen1990), the Northern Pocket Gopher (Thomomys talpoides) that belongs to the familyGeomyidae. It inhabits the dry southern interior and the southern Kootenays and RockyMountains of BC (Nagorsen 1990). More specifically, these animals are present from theManning Park region east to the Alberta border and north from the international border to theThompson and Fraser Rivers.
Habitat loss and fragmentation are the critical issues facing long term mole persistence in theFraser Valley. The population of Townsend’s Mole on Sumas Mountain is currentlythreatened from residential development. In the Abbotsford area, a sizable percentage of theland that is occupied by the Coast Mole and the historical sites where the Townsend’s Molespecimens have been collected are in the Agricultural Land Reserve. Although this land is notat an immediate risk to urbanization intensive agriculture is a continuous threat to theTownsend’s Mole (Sheehan 1999).
Glendenning (1959) reported that moles had only ‘recently’ multiplied to become pests toFraser Valley farmers. The increase in mole activity/abundance was attributed to agriculturalpractices such as intensive cultivation and heavily manured fields. Increased arable land andsoil fertility corresponded to a rise in earthworm numbers that provided a growing supply ofideal mole habitat. In fact, Glendenning (1959) suggested that the presence of earthworms inthe area prior to agriculture is a 'disputed point' and that their abundance was 'scarce' ifpresent at all, when compared to current concentrations. Therefore, farming practices fromthe past may have contributed significantly to the problems present-day farmers have withmoles in the Fraser Valley.
Moles are credited with being beneficial to agriculture by improving the aeration anddrainage of the soil, consuming harmful soil invertebrates, and circulating soil minerals(Kuhn and Edge 1990). Others authors (Glendenning 1959; Stone 1989; Gerber 1995) believethat these advantages have been replaced by modern agricultural practices and that any

Biodiversity Inventory Methods - Moles and Pocket Gopher
2 April 10, 2001
benefits accruing to agriculture, due to mole activity, are now grossly outweighed by theirdamage.
Most mole studies relate to the economic damage caused by this small mammal (Glendenning1959; Pedersen 1963, 1966; Giger 1973; Schaefer 1978). Often, the objective of studyingmoles is to obtain information to improve the effectiveness of mole control efforts that rangefrom trapping to poisoning to the use of deterrents (Glendenning and MacCarthy 1965;Hawthorne 1980; Gorman and Stone 1990; Gerber 1995). In contrast, this manual is notintended to prescribe techniques for eradicating the focal species but rather to study themwith as little intervention as is necessary. The purpose of this manual is to recommendmethods and protocols for determining presence and abundance of moles and pocket gophersin BC.

Biodiversity Inventory Methods - Moles and Pocket Gopher
April 10, 2001 3
2. INVENTORY GROUPBelow is the current taxonomy as of April 2001. If you are concerned that this may havechanged, you will always find the most current taxonomy in manual No. 5, The Vertebratesof British Columbia: Scientific and English Names (RIC).
Order Insectivora, Family Talpidae:
Neurotrichus gibbsii (Baird) Shrew-mole M-NEGIssp: gibbsii (Baird)
Scapanus orarius True Coast Mole M-SCORssp: schefferi Jackson
Scapanus townsendii (Bachman) Townsend's Mole M-SCTOssp: townsendii (Bachman)
Order Rodentia, Family Geomyidae:
Thomomys talpoides (Richardson) Northern Pocket Gopher M-THTAssp: cognatus Johnstone M-THTA-CO
fuscus Merriam M-THTA-FUincensus Goldman M-THTA-INmedius Goldman M-THTA-MEsaturatus Bailey M-THTA-SAsegregatus Johnstone M-THTA-SE
The family Talpidae is divided into three subfamilies: Talpinae (New and Old World molesand American and Japanese shrew-moles); Uropsilinae (Chinese or Asiatic shrew-mole); andDesmaninae (the Russian and Pyrenean desman). Only the subfamily Talpinae with its sevenspecies is present in North America: the Hairy-tailed mole, Parascalops breweri; the Broad-footed mole, Scapanus latimanus; the Eastern American mole, Scalopus acquaticus; the Star-nosed mole, Condylura cristata; the Coast Mole, Scapanus orarius; the Townsend’s Mole,Scapanus townsendii; and the Shrew-mole, Neurotrichus gibbsii (the latter three occur inBC).
Five subspecies of Neurotrichus gibbsii are recognized, but only N. g. gibbsii exists in BritishColumbia (van Zyll de Jong 1983; Nagorsen 1990). Both Scapanus townsendii and Scapanusorarius have two subspecies. However, only S. t. townsendii and S. o. schefferi occur in thisprovince (Hartman and Yates 1985; Nagorsen 1990; Carraway et al. 1993). In Canada, theScapanus and Neurotrichus genera are found only in southwestern British Columbia.
Thomomys talpoides belongs to the family Geomyidae and it is the only species of this familythat exists in BC (Cowan and Guiguet 1973; Nagorsen 1990). Based upon pelage colour andskull characteristics, six subspecies of Thomomys talpoides are recognized in the province(Nagorsen 1990).

Biodiversity Inventory Methods - Moles and Pocket Gopher
4 April 10, 2001
2.1 Shrew-mole (Neurotrichus gibbsii) M-NEGI
Description
The Shrew-mole is a small mole that has shrew-like features (Figure 1). Its grey to black furis directed backwards like a shrews and it is not as velvety as the fossorial mole’s. Its feet andtail are scaly. It has minute eyes, no external ears and a long, flattened nose. Its front feet arelonger than they are wide and have long, curved claws (Nagorsen 1996). Averagemeasurements are: total length 105 mm, tail 35 mm, hindfoot 15 mm and weight 10 g.
Figure 1. Shrew-mole (Nagorsen 1996)
Distribution
Species Range
In Canada, Shrew-mole distribution is limited to southwestern British Columbia. This speciesranges east from the Sechelt region to Hope and Manning Park. In the Unites States it extendssouthwards along the Pacific slope to central California (van Zyll de Jong 1983).
Provincial Range
The Shrew-mole is widely distributed in BC, occurring across the southwestern portion of theprovince from the lower Fraser Valley and Cascade Mountains east to Manning ProvincialPark (Figure 2). The northern limits of its range are the Sechelt Peninsula and Boise Creek,north of Pitt Lake. Some localized populations may inhabit some of the wet valleys on theeast side of the Cascade Mountains (Cowan and Guiguet 1973; Nagorsen 1996).

Biodiversity Inventory Methods - Moles and Pocket Gopher
April 10, 2001 5
Figure 2. Shrew-mole distribution in BC (Nagorsen 1996)
Density Patterns
Little information is available on population numbers, but densities of 12 – 15 Shrew-molesper hectare have been reported in ideal habitats in Washington (Nagorsen 1996). The Shrew-mole is a shy, secretive animal that is rarely seen. In the Lower Mainland, Campbell andHochachka (2000) reported nine captures in 932 trap nights, Zuleta and Galindo-Leal (1994)cite capture rates of 0.1 -0 .23 per 100 trap nights and Kremsater et al. (1993) reported onlytwo captures after 1100 trap days. Home range and movements have not been determined.
Activity Patterns
The Shrew-mole is frequently active above ground and is surprisingly agile and quick ifdisturbed (Dalquest and Orcutt 1942). The Shrew-mole has no well defined activity period.However, temperature appears to influence summer surface activity. Campbell andHochachka (2000) live trapped in early autumn and were successful only between 2300 and0700 hours. They suggest that during this time of year the surface activity of the Shrew-moleis primarily nocturnal.
Status
The Shrew-mole appears on BC’s Yellow list. Nagorsen (1996) states that there is concernthat local populations in the lower Fraser Valley may be at risk because of rapid habitat lossand fragmentation from urban development.

Biodiversity Inventory Methods - Moles and Pocket Gopher
6 April 10, 2001
Habitat Requirements
The Shrew-mole prefers forested hillsides and valley bottoms with loose soils comprised ofhigh humus, abundant leaf litter, decaying vegetation, rotting logs and stumps (van Zyll deJong 1983). Ravines comprised of big-leaf maple (Acer macrophyllum), vine maple (Acercircinatum), salmonberry (Rubus spectabilis), thimbleberry (Rubus parvifloris), trailingblackberry (Rubus ursinus), sword fern (Polystichum munitum), and mosses provide idealShrew-mole habitat (Carraway and Verts 1991). They are also often found where standingwater or mud occurs. The Shrew-mole is less numerous in swampy localities and generallyavoids dry hard soils and grassy meadows (van Zyll de Jong 1983).
Most Shrew-moles have been captured in second growth forests in the Lower Mainland buthave also been caught in clear-cut and old growth habitats (Seip and Savard 1992). Shrew-moles persist in a broad habitat range, from moist, mature forest to shrub habitat (Kremsateret al. 1993). Research from the U.S. implies that Shrew-moles are also habitat generalists(Terry 1981; Carraway and Verts 1991). However, other studies suggest a higher abundanceof this species in riparian habitats (Anthony et al. 1987; Doyle 1990). In the Lower Mainland,the Shrew-mole does not appear to favor riparian habitats (Zuleta and Galindo-Leal 1994).
Ground cover is important to the Shrew-mole in western Oregon (Hooven and Black 1976).Most captures of this species (85%) occurred in a forested control plot comprised of anundisturbed mat of decaying litter. No Shrew-moles were found in the experimental clear-cutplot that was slashed and burned (Hooven and Black 1976). In western Washington, Shrew-mole presence was negatively correlated to open areas and forest edges (Terry 1981). Shrew-moles appeared to be dependent upon closed forests and preferred habitats where the organiccomponent of the soil was high and they avoided areas where the soil was rocky (Terry1981).
Conspicuousness and Distinctiveness of Sign
There are no definitive habitats that can distinguish the Shrew-mole from the other two molespecies in BC where their ranges overlap. However, when identifying Shrew-mole specimensthree external traits may be used to distinguish it from the Coast and Townsend’s Moles: asmall, shrew-like body; a longer, hairier tail (>25% of total length); front claws and feet thatare only moderately suited for excavating (Figure 3); and 36 teeth instead of 44. Neurotrichusgibbsii is significantly different from Scapanus spp. and researchers are strongly encouragedto view all three simultaneously at a vertebrate museum, which will help minimize confusionin the field.
Figure 3. Shrew-mole (l) and Scapanus front foot (Nagorsen 1996)

Biodiversity Inventory Methods - Moles and Pocket Gopher
April 10, 2001 7
Feeding
The Shrew-mole does not appear to be as dependent upon earthworms for its survival as theother two moles in the province are. Earthworms represent only 42% of its diet, by volume,and isopods (sowbugs) represent 36%. Insect larvae and pupae are also important (van Zyllde Jong 1983). Whitaker et al. (1979) examined eleven stomachs and discovered theexistence of 11 types of prey. Earthworms were the most prevalent, occurring in 82% of thestomachs, accounting for 49% of the volume, followed by centipedes (Chilopoda), snails andslugs (Mollusca), insects (Diptera and Coleoptera), unidentified insects and unidentifiedvegetation.
Generally, this species consumes invertebrates that are damaging to trees and plant life.However, its diet does not differ dramatically from that of the fossorial moles. However, N.gibbsii appears to vary its diet seasonally. In September, 75-88% of its diet are invertebrateswhile in July a great proportion is conifer seeds (36%) and lichens (32%) (Carraway andVerts 1991). Reed (1944) kept a Shrew-mole in captivity for two weeks by feeding it a diet ofwinged adult termites and earthworms. Attempts to feed the animal meal-worms and theviscera of a freshly killed mouse were unsuccessful. Campbell and Hochachka (2000)successfully kept six Shrew-moles in captivity for almost four weeks on a diet of water and amixture of earthworms, mealworms and sow bugs.
Reproduction
Information pertaining to the life expectancy and reproductive rates of the Shrew-mole in BCis presently unavailable.
Predators
Natural enemies of the Shrew-mole include: weasels (Silver 1933), great horned owls (Maserand Brodie 1966), barn owls (Giger 1965), red-tailed hawks (Silver 1933; Roest 1952),coyotes (Toweill and Anthony 1988), screech owls (Dalquest and Orcutt 1942), long-earedowls (Reynolds 1970) and northern saw-whet owls (Foreman and Maser 1970). Domesticcats and dogs predate upon Neurotrichus in urban areas (Sheehan, pers. comm. 2001).
Herons, crows, foxes and mink are known predators of the European Mole Talpa europa(Gorman and Stone 1990) and possibly prey upon Neurotrichus and Scapanus spp. Theextent to which these natural predators control mole populations is presently unknown.

Biodiversity Inventory Methods - Moles and Pocket Gopher
8 April 10, 2001
2.2 Coast Mole (Scapanus orarius) M-SCOR
Description
The Coast Mole has luxurious light to dark grey short velvety fur, which offers no resistanceto the touch. Its most striking characteristic are its broad front feet, each possessing five long,flat claws (Figure 4). In contrast, its small hind feet have short, relatively weak claws. TheCoast Mole’s body is cylindrical; it has tiny eyes which are hidden by fur, a long sparsely-haired snout and a short, almost naked, double-tapered tail. Average measurements are: totallength 162 mm, tail 31 mm, hind foot 21 mm and weight 67 g (Sheehan and Galindo-Leal1996b).
Figure 4. Coast Mole (Nagorsen 1996)
Distribution
Species Range
This mole occupies the Pacific coast north from California to southwestern British Columbiaand eastern Washington and Oregon (Nagorsen 1996). The eastern limits of its range are inextreme western Idaho (Hartman and Yates 1985).
Provincial Range
The Coast Mole range is more extensive than that of the Townsend’s Mole. The Coast Moleis found throughout the Puget sound Lowlands north to Vancouver and Agassiz on the northside of the Fraser River (Figure 5). Its range extends up the Fraser Valley to the Boston BarArea (Cowan and Guiguet 1973; Nagorsen 1996).

Biodiversity Inventory Methods - Moles and Pocket Gopher
April 10, 2001 9
Figure 5. Coast Mole distribution in BC (Nagorsen 1996)
Density Patterns
Home range size for Coast Moles averages 0.12 hectares and density estimates for BC rangefrom less than one mole per hectare to 13 per hectare (Nagorsen 1996). Population numberscorrelate with the physical characteristics of the soil and its associated biomass.
Activity Patterns
The Coast Mole is active throughout a 24 hour period. Fresh mole mounds can be foundthroughout the day and the presence of new mounds in the morning indicates nocturnalactivity. Researchers have directly captured and live trapped the Coast Mole during daylighthours, which refutes the notion that this species is primarily nocturnal (Schaefer 1978;Sheehan and Galindo-Leal 1997).
Status
The Coast Mole appears on BC’s Yellow list.
Habitat Requirements
Coast Moles are not dependent upon a specific habitat. They can be found in agriculturalland, grassy meadows and sagebrush, alder, dogwood, yellow pine and Douglas fir forests;spruce and hemlock woodlands (Hartman and Yates 1985). This mole prefers lighter, better-drained soils than those inhabited by the Townsend’s Mole (Hartman and Yates 1985) andcan be found in soils with a high-gravel content (van Zyll de Jong 1983). Throughout thefragmented landscape where this mole persists in BC, it is found along roadway shoulders, inrecreational fields and residential lawns and gardens.

Biodiversity Inventory Methods - Moles and Pocket Gopher
10 April 10, 2001
Conspicuousness and Distinctiveness of Sign
The only mole that can be confused with this species is the larger Townsend’s Mole.Physically, the total length of the adult Coast Mole is <180 mm, hind foot <24 mm and thecondylobasal length of the skull is < 37 mm (van Zyll de Jong 1983). Also, the Coast Mole isunlikely to exceed 90 g in weight (Schaefer 1978; Sheehan and Galindo-Leal 1996b).
Coast Moles produce hundreds of mounds annually in the construction, maintenance andextension of their underground tunnel systems. Sheehan and Galindo-Leal (1997) calculatedthe average Coast Mole mound to be 30 cm in diameter and 11 cm in height with acorresponding average tunnel diameter (measured from top to bottom of tunnel) of 3.6 cm(Figure 6).
Figure 6. Mound and tunnel measurements for Scapanus spp.
Scapanus spp. in BC produce cloddy, conical mounds that are distinguishable from those ofthe pocket gopher which are generally fan or crescent shaped and comprised of fine, sifteddirt (Figure 7).
Figure 7. Mole and Pocket Gopher mound differences

Biodiversity Inventory Methods - Moles and Pocket Gopher
April 10, 2001 11
Feeding
Coast Moles are principally dependent upon soil invertebrates for their sustenance andnaturally prefer soils that are capable of supporting healthy populations of such organisms.Consequently, they seem more abundant in grassland habitats where there is high soilinvertebrate biomass. Earthworm biomass concentrations, especially Lumbricus terrestris, aregreater in pastures than wooded habitats, which partially explains why the former supportshigher mole densities.
Coast Moles feed mostly on earthworms. Glendenning (1959) found a highly significantcorrelation between the density of Coast Moles and the density of earthworms in 157 fields inthe lower Fraser Valley. He stated that the Coast Mole eats arthropods, annelids, andmolluscans. He examined the stomach contents of 108 kill trapped Coast Moles and found noevidence of any vegetable matter (which, incidentally, is a commonly cited concern ofgardeners/farmers). Earthworms were found in 93% of the stomach contents indicating theimportance of these invertebrates in the Coast Mole's diet. Van Zyll de Jong (1983) reportedthat earthworms constitute more than 90% of the food consumed by the Coast Mole whilesmall quantities of plant material (bulbs, grains, peas, potatoes) may be ingested. In fact,Glendenning (1959) estimated that one mole required 150 worms per day, roughly 1 every 10minutes. This amount would equate to the consumption of an unbelievable number of 52,560earthworms a year!
Reproduction
During their estimated life expectancy of 4 or 5 years, a female Coast Mole will have from 9to 15 offspring (Glendenning 1959). Breeding takes place in late winter and the pups are bornthroughout the spring after a gestation of 4 to 6 weeks. The young are weaned during thesummer months and establish their own home range shortly afterwards. They are capable ofreproduction during their first year.
Predation
Natural enemies of the Coast Mole include: weasels (Silver 1933), great horned owls (Maserand Brodie 1966), barn owls (Giger 1965), red-tailed hawks (Silver 1933; Roest 1952),coyotes (Toweill and Anthony 1988) and rubber boas on nestlings (Maser et al. 1981).Domestic cats and dogs are probably the Coast Moles most significant predators consideringthe human population in the Greater Vancouver and Fraser Valley region.
Herons, crows, foxes and mink are known predators of the European Mole, Talpa europa,(Gorman and Stone 1990) and undoubtedly prey upon both Neurotrichus and Scapanus spp.The extent to which natural predators control mole populations in BC is presently unknown,however, it is likely insignificant considering the presence and density of Coast Mole moundsthroughout the Lower Mainland.

Biodiversity Inventory Methods - Moles and Pocket Gopher
12 April 10, 2001
2.3 Townsend’s Mole (Scapanus townsendii) M-SCTO
Description
The Townsend’s Mole is the largest mole in North America and is similar to the Coast Moleexcept for size (Figure 8). It is cylindrical in shape, varying in color from gray to black. Likethe Coast Mole, its fur is velvety soft and unidirectional. The front feet are broad and shovel-like, equipped with 5 long flat claws. In contrast, the hind feet are relatively small withweaker claws. Tiny blue eyes are hidden beneath their facial fur and a layer of skin, whichmakes them difficult to see. Both their long, flexible snout and short tail are sparsely haired.
Figure 8. Townsend’s Mole (Nagorsen 1996)
Distribution
Species Range
This mole is found throughout the coastal areas of California, Oregon, and Washingtonnorthwards into extreme southwestern BC (Nagorsen 1996).
Provincial Range
This mole occurs only in the vicinity of Huntingdon and Abbotsford in the Fraser Valley(Figure 9). Sheehan and Galindo-Leal (1996b) extensively sampled this region andsurrounding areas and concluded that the range of Townsend’s Mole in BC is less than 20km2.
Biodiversity Inventory Methods - Moles and Pocket Gopher
April 10, 2001 13
Figure 9. Townsend’s Mole distribution in BC (Nagorsen 1996)
Density Patterns
Sheehan and Galindo-Leal (1996b) performed crude density estimates based upon moundconstruction in two fields near Huntingdon and reported densities of 2.1/ha and 5.3/ha. InOregon, densities may reach 12/ha (Pedersen 1963; Giger 1973) or be as low as 0.4/ha inareas with few earthworms and unsuitable soils. It is unlikely that Townsend’s Mole densitiesin BC would be as high as in Oregon considering it occurs at its northernmost range in theprovince.
Activity Patterns
Like the Coast Mole, the Townsend’s Mole is active both night and day. Sheehan andGalindo-Leal (1997) live trapped this mole day and night and directly captured it duringdaylight hours. Fresh mounds can be found at any time during a 24 hr period. Active molescan produce upwards of 8 mounds per day; however, less than 3 is average (Sheehan andGalindo-Leal 1996b). Mound construction peaks during the period of juvenile dispersal insummer and during the wetter fall months when the soil softens.
Status
The Townsend’s Mole appears on BC’s Red List (Sheehan 1999) and COSEWIC hasdesignated Townsend’s Mole as Threatened (Sheehan and Galindo-Leal 1996a). This molehas a global ranking of G5 because it is not at risk in California, Oregon or Washington, buthas a sub national rank of S1? because it is rare and localized in BC.
Habitat Requirements
The Townsend’s Mole prefers damper habitats than the smaller Coast Mole, inhabiting themeadows on the flood plains of low elevation rivers and glacial outwash prairies. However,both Townsend’s and Coast Moles do co-exist in some localities (Dalquest 1948) and they

Biodiversity Inventory Methods - Moles and Pocket Gopher
14 April 10, 2001
are sympatric throughout the larger mole range in BC. Townsend’s Mole is known to occupyfir (Abies) forests in Washington, but its mounds and tunneling activities are reportedly lessvisible (Dalquest 1948). This is likely because the Townsend’s Mole can compact theexcavated dirt against the tunnel walls causing less mounding; as well as any moundsproduced are concealed by litter on the forest floor. The deep loose soil of cultivated fields isfavored by this mole which avoids areas where the gravel content of the soil is high (van Zyllde Jong 1983). However, Townsend’s Mole inhabiting Sumas Mountain persist in rocky,relatively shallow Alderwood Silt Loam as compared to those in the Huntingdon area whichenjoy deep, fertile Lynden Silt Loam. An isolated subspecies of Townsend’s Mole, Scapanustownsendii olympicus, is found only in the rugged terrain of the Olympic peninsula inWashington State at elevations exceeding 1000 m (Carraway et al. 1993). This suggests thatthe Townsend’s Mole may be more of a habitat generalist than a specialist. Furthermore,since logging, agriculture and urbanization have significantly altered the natural landscapewhere Townsend’s Mole persists in BC, suitable habitat may include residential backyards,ditches, hayfields or forests.
Pedersen (1963) reported that pastures that received more fertilizer (solid cow manure) alsohad greater densities of moles because this type of fertilizer provided ideal conditions andhabitat for earthworms. The effects of liquid manure on earthworm numbers and molepopulations have not been investigated although mole activity appears less in fields whereliquid manure is regularly applied (Sheehan, pers. comm. 2001)
Conspicuousness and Distinctiveness of Sign
Adult Townsend’s Moles can be differentiated from Coast Moles by: 1) total length >180mm; 2) hind foot >24 mm; 3) weight >90 g; and 4) condylobasal length of skull >37 mm (vanZyll de Jong 1983). However, sub-adult Townsend’s Mole may be confused with the CoastMole because of the obvious overlapping of measurements that occur during the larger molesfirst year of growth.
The tunnels and mounds constructed by the larger Townsend’s Mole exceed those of thesmaller Coast Mole. Sheehan and Galindo-Leal (1997) reported the average Townsend’sMole mound to be 44 cm in diameter, 17 cm in height and a vertical tunnel diameter of 5 cm.Overlap does exist between Scapanus mound width and height which leaves vertical tunneldiameter as the most reliable discriminating measure.
Feeding
Townsend’s Moles are principally dependent upon soil invertebrates for their sustenance andnaturally prefer soils that are capable of supporting healthy populations of these organisms.They seem more abundant in grassland habitats where there is high soil invertebrate biomass.Earthworm biomass concentrations, especially Lumbricus terrestris, are greater in pasturesand hayfields than wooded habitats which partially explains why this mole is more abundantin these locations.
Townsend’s Moles feed mainly on earthworms, but vegetable matter is also part of their diet.Pedersen (1963) analyzed 200 Townsend’s Mole stomachs and found that the primary foodsource was the earthworm (72%). The remaining 28% were composed of roots. One stomachcontained 100% slugs and six stomachs had traces of insect skeletons. Wight (1928)examined 306 Townsend’s Mole stomachs and found that 97% contained enough vegetablematter to suggest that it was consumed deliberately. Moore (1933) concluded that tulip,

Biodiversity Inventory Methods - Moles and Pocket Gopher
April 10, 2001 15
tigridia, bulbous iris bulbs, wheat, oats, peas, vetch, corn, carrots, parsnips, and potatoesfrequently form a significant proportion of the Townsend's and Coast Mole diet. In addition,he suggested that moles occasionally prefer a vegetarian diet to their natural food ofearthworms, insects, and other invertebrates. He mentioned that the Townsend’s Moledemonstrates an acquired taste for many cultivated plants even in the presence of its naturalfood supply. Other authors have confirmed the prevalence of earthworms in the mole's diet(Hall and Kelson 1959; van Zyll de Jong 1983; Forsyth 1985). In fact, Townsend’s Mole canbe kept healthy in captivity for weeks solely on a diet of earthworms.
Reproduction
The breeding season coincides with the winter months (Pedersen 1963) during which time thefemales construct shallow underground nests averaging 1.6 L in size (Kuhn et al. 1966). Anaverage of 3 pups are delivered during the spring and in 5 to 6 weeks they exceed 115 mm inlength and weigh between 60 and 80 g (Kuhn et al. 1966). Juveniles are capable of breedingduring their first winter. The reproductive potential of this mole is likely similar to that of theCoast Mole, which limits it to 3-4 breeding seasons.
Predation
Natural enemies of the Townsend’s Mole include: weasels (Silver 1933), great horned owls(Maser and Brodie 1966), barn owls (Giger 1965), red-tailed hawks (Silver 1933; Roest1952) coyotes (Toweill and Anthony 1988), and rubber boas on nestlings (Maser et al. 1981).Herons, crows, foxes and mink are known predators of the European Mole, Talpa europa,(Gorman and Stone 1990) and possibly prey upon Neurotrichus and Scapanus spp. in BC.The extent to which these natural predators control mole populations is presently unknown.
Domestic cats and dogs are probably the most important predators of Townsend’s Moleconsidering their restricted distribution and the human population they live amongst.Interestingly, dogs and cats do not eat the moles that they kill (Maser et al. 1981), possiblybecause of their unpleasant taste and smell (Glendenning 1959).
Benefits
Unfortunately, a mole’s usefulness is directly related to how its existence benefits humans.Moles are credited with being beneficial to agriculture by improving the aeration anddrainage of the soil, consuming harmful soil invertebrates and circulating soil minerals (Kuhnand Edge 1990). However, other authors believe that these advantages have been replaced bymodern agricultural practices and that any benefits accruing to agriculture, due to moleactivity, are now grossly outweighed by their damage (Glendenning 1959; Stone 1989;Gerber 1995). Regardless, moles are unique and benefit our concept of biodiversity with theirinteresting forms, behaviour and genetic composition.
In the Abbotsford area, a sizable percentage of the land that is now occupied by the CoastMole and the historical sites where the Townsend’s Mole specimens have been collected arein the Agricultural Land Reserve (ALR). Although this land is not at an immediate risk tourbanization, agriculture and industrial activities will continue to threaten the long termpersistence of Townsend’s Mole in this region. Unfortunately, the population of Townsend’sMole on Sumas Mountain, not in the ALR, is currently threatened by intensive urbanization.

Biodiversity Inventory Methods - Moles and Pocket Gopher
16 April 10, 2001
2.4 Northern Pocket Gopher (Thomomys talpoides) M-THTA
Description
There are currently six subspecies of pocket gopher described in BC (Table 1). Nagorsen(1991) and Cowan and Guiguet (1973) briefly summarize the distribution of each subspecies.Cowan and Guiguet (1973) describes the Northern Pocket Gopher as follows: about the sizeof a rat (average of six subspecies is 187-212 mm), tail is about half the length of body,slender, scantily haired, broad head, small eyes, short ears hardly projecting above fur, largefur-lined pouch (for carrying food) extending back inside the cheek from an opening on eachside of the mouth. The hair colour varies, but is generally brownish to gray/black with a palerunderbelly (Bonar 1995). Its fore claws are strongly curved and sharp-pointed. Many of thesemorphological traits clearly distinguish this species from moles although many peopleregularly confuse moles and pocket gophers.
Table 1. Measurements of pocket gophers from different regions. Total length (TL), taillength (T), hind foot (HF) (in mm) and weight (W) (in grams).
Species TL T HF W ReferenceT. talpoides
mean N/A 13.8 m(104.4)f(91.4)
range N/A N/A 6.0 - 22
Andersen 1977
T. t. cognatusmean 187 57 26.3 N/Arange 175-197 55-64 25-27 N/A
Cowan and Guiguet 1965
T. t. fuscusmean 192 61.5 25.6range 175-205 56-67 25-27
Cowan and Guiguet 1965
T. t. incensusmean 204 71 26range 184-277 56-82 24-27
Cowan and Guiguet 1965
T. t. mediusmean m(195)
f(196)m(67)f(67)
m(25)f(25)
N/A
range m(183-210)f(183-210)
m(60-82)f(61-76)
m(24-27)f(23-27)
N/A
Cowan and Guiguet 1965
T. t. saturatusmean m(212)
f(203)m(71)f(65.5)
m(28)f(27)
N/A
range m(196-223)f(186-218)
m(61-79)f(58-73)
m(27-29)f(25-29)
N/A
Cowan and Guiguet 1965
T. t. segregatusmean m(208)
f(199)m(74)f(72)
m(27)f(26)
N/A
Range m(193-220)f(190-210)
m(64-81)f(65-86)
m(24-29)f(23-29)
N/A
Cowan and Guiguet 1965
For a detailed revision of Northern Pocket Gopher subspecies, see Johnstone (1954).

Biodiversity Inventory Methods - Moles and Pocket Gopher
April 10, 2001 17
Pocket gophers have fine textured, soft, glossy hair, not really fur (Bonar 1995). Because oftheir low dispersal rate and subsequently limited gene flow, gopher populations adapt well tolocal conditions, and therefore exhibit little colour variation within a local population (Case1983). Several studies have claimed that fur colouration is a result of the environment. Darkerspecies occur in areas with darker soils and lighter species occur in areas with lighter soils(Teipner et al. 1983). Pocket gophers annually undergo variable and irregular molts.Semiannual molts result in distinctive summer and winter coats (Teipner et al. 1983).Furthermore, early summer molts often result in the presence of a “molt line” that spreadsdown to the tail.
Distribution and Habitat
Species Range
The Northern Pocket Gopher, T. talpoides, has the widest distribution of all pocket gophers,extending from central Alberta and southeastern British Columbia to northern New Mexicoand Arizona, and from the western three-fourths of North and South Dakota to easternWashington, Oregon, and northeastern California (Chase et al. 1982).
Provincial Range
In British Columbia, the Northern Pocket Gopher inhabits the southern dry interior, southernKootenays, and southern Rocky Mountains (Nagorsen 1991). Nagorsen (1991) also givesbrief summaries on each of the sub-species occurring in British Columbia.
Density Patterns
Home range size usually corresponds to the burrow system, and a single gopher will inhabitand actively defend individual territories (Teipner et al. 1983; Bonar 1995). Although rare,several authors have found that multiple occupancy of a single burrow system exists (e.g.,Chase et al. 1982). Home ranges of males will typically exclude other males, but will includeseveral females (Bonar 1995). Population densities fluctuate naturally depending on thequality and quantity of food available (Bonar 1995). Ground disturbing activities generallyincrease the carrying capacity of an area for Northern Pocket Gophers by increasing thesupply of preferred foods and allowing a build up of the resident population (Bonar 1995).Gophers will reach their highest densities on friable, light-textured soils with high plantbiomass, especially large, fleshy roots, tubers, bulbs, or other storage structures (Bonar 1995).Scrivner and Smith (1981) found that densities of gophers were highest in stands less than 10years old and greater than 80 years old, compared with stands in the 11 – 79 year old ageclass. This was attributed to the conditions of the understory vegetation.
Burrow systems can be divided into two parts: shallow feeding burrows located 12-20 cmbelow ground, roughly 5 cm in diameter; and deep permanent nesting galleries situated at amuch deeper depth of 1-3 m which often contain shredded grasses (Anderson and Kluge1986). One pocket gopher may require 0.5 ha for its burrows (Godfrey 1987). In heavilyinfested areas, densities may approach 123 adults/ha (Howard and Childs 1959). Pocketgophers can construct more than 50 mounds per year (Anonymous 1984). Gophers willdiligently repair any open break in their burrows at ground level by sealing them with anearthen plug. These plugs will also be used to seal off feeding tunnels, and although difficultto see, these plugs can be used to indicate gopher presence (Teipner et al. 1983). Tunnelsystems can be fairly extensive. Over a five-month period, Richens (1966) followed a pocket

Biodiversity Inventory Methods - Moles and Pocket Gopher
18 April 10, 2001
gopher and recorded the construction of 146 meters of feeding tunnels. Deep tunnels oftenlead to nests and may attain depths of 1.5 meters or more (Teipner et al. 1983). In winter,gophers can burrow through the snowpack, with tunnels often reaching lengths of 30 meters(Teipner et al. 1983). Gophers form soil casts by pushing soil up from their burrow systeminto tunnels dug into the snow. These cylindrical casts settle into the ground during springsnowmelt, leaving evidence of winter activity (Teipner et al. 1983).
Activity Patterns
Pocket gophers are primarily fossorial and live in extensive burrow systems in which they areactive throughout the year (Cowan and Guiget 1973; Anderson and Kluge 1986). Increasedactivity takes place in the fall when food is cached for the winter (Kreps 1909). Arid areasand soils with dense brush and forest-cover are avoided by this species. Where suitable soilsoccur, the pocket gopher is found from valley bottoms to alpine meadows (Cowan and Guiget1973). In Alberta, Thomomys is associated with the sandy, lighter textured soils of the blacksoil zones where better quality soils and forage productivity occurs (Nietfeld and Roy 1993).Preference for this soil type may also be accounted for its ability to drain moisture away,allow air to diffuse through the closed burrow systems and the ease with which it can be dugthrough (Nietfeld and Roy 1993).
Status
The Northern Pocket Gopher subspecies T. talpoides segregatus is on the provincial Red List.Globally, this subspecies is listed as critically imperiled or imperiled
Conspicuousness and Distinctiveness of Sign
Although pocket gophers are often confused with moles they can be differentiated by themounds they construct. Fresh Thomomys mounds are comprised of sifted dirt (indicatingkicking) and generally fan-shaped while the dirt in mole mounds is cloddy (indicatingpushing) and they are conical in shape. Another distinguishing characteristic of the pocketgopher is that they regularly fill their abandoned runways with dirt, a process rarelyundertaken by Scapanus spp. (Moore 1939). Also, the existence of observable raised ridges,which result from Scapanus spp. surface tunneling are not usually produced by Thomomys(Anderson and Kluge 1986). Generally, the pocket gopher inhabits an area further east thaneither the Townsend's or Coast Mole, although its range may overlap that of the Coast Molein the vicinity of Manning Park.
Feeding
Pocket gopher food preferences show marked geographical variation (Teipner et al. 1983).Pocket gophers are mostly root eaters and not insectivores like the moles. Thomomysgenerally remain underground; however, surface vegetation may be taken in large quantitiesduring the growing season (Ward 1960). Their diet consists of the roots of many species oftrees, grasses and flowering plants although legumes and broad-leaved forbs are preferred(Nietfeld and Roy 1993). This vegetation is sometimes stored in underground chambers(Keith et al. 1958; Ward 1960; Cowan and Guiget 1973).

Biodiversity Inventory Methods - Moles and Pocket Gopher
April 10, 2001 19
Reproduction
Sexual development and fertility depend on nutrition, and gestation and lactation requirehigher than average energy requirements, an ample supply of nutritious food speeds sexualmaturity and promotes large litters and increased survival (Bonar 1995). The breeding seasonfor pocket gophers varies throughout their range and depends on the physical characteristicsof the environment (Teipner et al. 1983). The major reproductive effort generally takes placein the spring, coinciding with periods of abundant green growth and optimum soils forburrowing (Teipner et al. 1983). On western range lands females produce one litter ranging insize from one to thirteen are born sometime in April or May after a gestation period ofapproximately 28 days (Cowan and Guiget 1973; Teipner et al. 1983; Bonar 1995).Approximately 5 to 8 weeks after birth, the young disperse as a result of increasing agonisticbehaviour between the mother and her young (Teipner et al. 1983; Bonar 1995).


Biodiversity Inventory Methods - Moles and Pocket Gopher
April 10, 2001 21
3. PROTOCOLSWhen considering sampling designs and methods, the type of information desired, theamount of effort and cost, specific site characteristics and limitations must be considered inlight of the objectives of the study and the urgency of the management decisions to be made.Often, several different methods may be needed to address different aspects of a study. Asnew information is obtained, new questions and hypotheses may be formed, the objectivesredefined and the methods modified. Typically, there will be a tradeoff between the amountof time and money an investigator can devote to a particular site and the number of replicatesites that is possible to establish. It is important for researchers to report the details of theirresearch so that the assumptions behind each study are clearly understood. A variety ofsurvey techniques may need to be used to fulfill the study objectives, however, cautionshould be exercised when attempting to compare results among studies, study areas, orthrough time (RIC 1999).
Table 2. Recommended methods for inventory of moles and pocket gophers in BritishColumbia at the three levels of intensity.
Species Presence/NotDetected
RelativeAbundance
AbsoluteAbundance
Shrew-mole Direct Observation Direct Observation Mark-Recapture
Coast Mole Direct Observation Direct Observation Mark-Recapture
Townsend’s Mole Direct Observation Direct Observation Mark-Recapture
Northern Pocket Gopher Direct Observation Direct Observation Mark-Recapture

Biodiversity Inventory Methods - Moles and Pocket Gopher
22 April 10, 2001
3.1 Sampling StandardsThe following are guidelines for conducting inventory studies on moles and pocket gophersin the province. Close adherence to these guidelines will permit the collection of reliable datathat should satisfy individual and corporate inventory needs, as well as contribute tobiodiversity monitoring at local, regional, and provincial scales.
3.1.1 Preliminary SurveysResearchers should always solicit landowners when searching for information on thepresence of local species. Haeck (1969) was successful in appealing to the public forinformation pertaining to dead moles found on the roads in Holland. The collation of this dataprovided enough information to uncover the peak period of Talpa europaea juvenile dispersalin that country.
The period of juvenile Townsend’s Mole dispersal in Oregon was obtained from informationacquired from road kills (Pedersen 1963; Giger 1973). Although the effectiveness of this typeof research is dependent upon the co-operation of usually unsympathetic landowners thatconsider moles pests, valuable knowledge can be the amassed. Existing information on therestricted distribution of Townsend’s Mole could be refined with the use of road kill data. Ifundertaken, this information would also provide researchers with an understanding of thejuvenile dispersal period, increase the public’s awareness of this presently red-listed speciesand provide specimens for laboratory analyses and museums. If this approach is undertaken,it is important to provide specimen bags and instructions on how to collect and preserve molecarcasses to those willing to assist (see manual No. 4a, Voucher Specimen Collection,Preparation, Identification and Storage Protocol: Animals (RIC 1999b)).

Biodiversity Inventory Methods - Moles and Pocket Gopher
April 10, 2001 23
3.1.2 Selecting Study AreasThe presence of molehills is the only criterion used by all researchers when selecting studyareas. Schaefer (1978) extensively searched for farmland throughout the Lower Mainlandwith the largest number of molehills (qualitatively assessed) before selecting his 10 studysites to trap the Coast Mole. Only the area within each study site that contained the mostmolehills was then marked off for his research purposes. Pedersen (1963) explained that thebulk of his Townsend’s Mole trapping took place within a five mile radius of Tillamook,Oregon, because the farms are centrally located where this species' habitat is abundant whichwould reduce travel time between study areas. Giger (1973) chose a 150 ha area hedged bymountains, river and ocean to study the movements and homing of the Townsend’s Mole inTillamook, Oregon. Sheehan and Galindo-Leal (1997) used voucher specimen data andinformation from professional mole trappers to begin their sampling of the Central FraserValley for Townsend’s Mole. Therefore, there is no standard method followed when selectinga study area other than the search for signs of mole activity.
Unlike the Scapanus spp. whose mound construction indicates their presence, signs of Shrew-mole activity and presence are less obvious. Therefore, surveying efforts should be directedtowards areas where research indicates there is an association between this species, otherspecies, and habitat. Shrew-mole runways can be located by raking away the surface cover ofdead litter to expose shallow troughs that are roughly one and one-half inches wide by three-quarters of an inch deep (Dalquest et al. 1942). Since such runways may be traveled regularlyby the animal in its search for food, they may also provide an ideal site to place pitfalls orother traps.
It is advisable to select a study area that consists of a single ecological association which isrelatively uniform (Blair 1940). A particular species that occurs in two or more ecologicalassociations is likely to behave differently in each (Blair 1940). For example, Pedersen(1963) sampled moles in two pastures of identical soil type, the only difference was in theapplication of cow manure to one pasture. The manured plot contained a higher density ofmoles attributed to an association between soil fertility and earthworm abundance. Thissituation helps to illustrate why, if more than one habitat type is selected for trapping, theresults from each type should be evaluated separately: even within a single associationpopulation densities may vary.
3.1.3 Habitat Data StandardsA minimum amount of habitat data must be collected for each survey type. The type andamount of data collected will depend on the scale of the survey, the nature of the focalspecies, and the objectives of the inventory. As most, provincially-funded wildlife inventoryprojects deal with terrestrially-based wildlife, standard attributes from the terrestrialEcosystem Field Form developed jointly by MELP and MOF (1998) will be used. AppendixE of the manual, Species Inventory Fundamentals (No.1), contains a generic discussion ofhabitat data collection as well as a list of standard attributes, which may be relevant to moleand pocket gopher surveys (RIC 1998).

Biodiversity Inventory Methods - Moles and Pocket Gopher
24 April 10, 2001
3.1.4 Time of Year
Mound Count Surveys
During the autumn months, mounds are more conspicuous and the year’s juvenilestemporarily increase population numbers. Mole activity and mound formations are visiblyreduced during periods of cold weather when the soil freezes. Mound activity increases as theground softens which generally occurs after prolonged cold spells or heavy rainfall.
Owl Pellets
If this method is used, the collection of owl pellets should coincide with the period ofaboveground juvenile mole dispersal. This period is estimated to occur somewhere betweenMay and June for juvenile Townsend’s Moles in Oregon (Giger 1965). BC researchers shouldconsider the possible effects that the latitudinal gradient (affecting soil temperature and foodavailability) between Tillamook, Oregon and the Fraser Valley has on this period of dispersal.The breeding season of moles come later in the year as one moves north due to climaticconditions. For example, breeding periods for Talpa europaea vary from mid-February incentral Italy to late June in north-east Scotland (Gorman and Stone 1990). Scalopus aquaticusexhibits a two month latitudinal variation in its breeding season between the 32nd and 45th Nparallels which would also result in a different timing of juvenile dispersal (Eadie andHamilton 1956).
Open-Burrow Surveys
Plan for late summer / early fall because the young-of-the-year pocket gophers have dispersedby this time (Bonar 1995).
Trapping
Mole activity and mound formations are visibly reduced during periods of cold weather whenthe soil freezes. In the Fraser Valley, the winter temperatures are rarely low enough to freezethe soil, but if the ground does freeze trapping should be temporarily ceased until it thaws.
Trap-outs have been used successfully to determine the absolute abundance of pocketgophers (Ingles et al. 1949; Howard and Childs 1959; Richens 1965; Reid 1973). The basis ofthe trap-out method is to capture all of the animals in a given unit to determine the size of anactive pocket gopher population. Fall trapping will produce the most accurate numbers as theyoung-of-the-year will have attained trappable size by this time (Teipner et al. 1983). Theadvantages of this technique include count accuracy and rodent availability for immediateexamination (Reid 1973; Teipner et al. 1983).

Biodiversity Inventory Methods - Moles and Pocket Gopher
April 10, 2001 25
3.1.5 HandlingTo avoid prolonging stress while handling study animals, take standard measurements assoon and quickly as possible. However, moles are difficult to handle because of theirhyperactive nature. The use of the ‘mole holder’ speeds up this task by freeing up both handsof the researcher (Figure 10). Wearing gloves hampers the deft handling of moles althoughwearing them is advisable to avoid being bitten or scratched. Work on the mole or pocketgopher over a pail half filled with dirt so that if the animal falls, it will not get hurt and can beeasily retrieved. A mole or pocket gopher dropped on the ground will burrow immediatelyand escape unless it is quickly unearthed with a shovel.
A clip, identical to those on the end of electrical test leads, can be fixed to a 20-inch L-shapedrod with light wire and attached to the tail of the mole. This frees both of the researcher’shands, allowing the vertical specimen to be measured relatively easy over a pail. Individualmole measurements require only a minute with this device and the specimens are all releasedunharmed. Temporary discomfort to the mole can not be denied. However, this device speedsup the process and eliminates the need to grasp the moles firmly to reduce their struggling,which may result in more permanent injuries.
Figure 10. Mole holder
Handling live moles and pocket gophers for measuring purposes is difficult because theycontinually struggle to escape. Another option is to use ether, which has been usedsuccessfully to anesthetize Townsend’s Mole (Pedersen 1963). Moles are placed into a canwith a piece of cotton saturated with ether and then sealed with a tight lid. The moles aresubdued in three to four minutes and then can be removed from the container. In this way,weighing, measuring, and the collection of ectoparisites is much easier. Moles can bereturned to their tunnel after 10 minutes and when later recaptured have no visible ill effects.

Biodiversity Inventory Methods - Moles and Pocket Gopher
26 April 10, 2001
The Coast Mole appears to be mild mannered. When it bites it feels like a harmless pinch.However, the larger Townsend’s Mole can be tenacious when removed from a trap formeasuring and its more powerful bite can be detected through leather gloves. This animal'sbite would certainly sting, and possibly break, bare skin. Both Scapanus spp. occasionallyemit a loud high-pitched ‘Eeek! Eeek! Eeek!’ when handled which appears more as a protestto being handled than reflecting physical pain.
Following data collection return the mole to a five-gallon pail that contains a few centimetersof soil and provide five to six earthworms to help restore its energy prior to release. When theworms have been ingested (10-15 minutes) release the mole into the study plot. If thedecision is made to keep the mole for further observation, half-fill the pail with soil and addanother five worms to satiate its appetite during transport. Do not put more than one mole in apail at one time because they will fight violently.
Retained Coast and Townsend’s Moles can survive in small terrariums (10 by 20 inches) forshort periods and can exist solely on a diet of earthworms. The amount of worms allotted toeach mole should be no less than 2/3 of their body weight. However, because they canconsume over two dozen earthworms/day (18 worms cost $3.85), moles are costly to keep incaptivity. The only way to avoid this cost is to have access to an area where at least onedozen earthworms can be dug up daily for each mole in captivity. The subterraneanenvironment that the moles have adapted to is relatively stable and every attempt should bemade to duplicate it. It is important to ensure that the moles temporary lodgings are notexposed to extreme temperatures, direct sunlight or precipitation. The soil should be replacedin the terrariums at least weekly and secure, ventilated lids will keep your mole fromescaping.
If long-term captivity is required several authors have provided suggestions and moredetailed information (Reed 1944; Glendenning 1959; Gorman and Stone 1990; Campbell andHochachka 2000).
Hantavirus is transmitted to humans from persistently infected rodents and other smallmammals (National Research Council 1991). Multiple species may serve as hosts within aparticular area and the strain of virus and its likelihood of causing disease in humans variesfrom region to region (National Research Council 1991). Although no research can be foundthat implicates either moles or pocket gophers as hantavirus hosts, the fact that mole tunnelsare often communal, used by mice and voles, suggests a potential risk to workers handlingfossorial mammals. Deer mice Peromyscus maniculatus have been identified as hantavirushosts in BC and have transmitted the virus to humans. Direct animal contact is not necessaryas the virus is spread to humans primarily through the aerosols of infected urine, feces, orsaliva (National Research Council 1991). Wearing a mask when excavating the moles andpocket gophers dirty and dusty lateral shafts and tunnels may help prevent the field workerfrom inhaling these potentially deadly aerosols. The virus can also be transmitted to humansfrom the bite of an infected animal (National Research Council 1991). Researchers shouldtake precautions and wear gloves when handling moles and pocket gophers to help avert anypotential health problems associated with bites from these animals.
Biodiversity Inventory Methods - Moles and Pocket Gopher
April 10, 2001 27
3.1.6 Identification of Moles
Distinguishing Scapanus townsendii from Scapanus orarius
Scapanus townsendii can be distinguished from Scapanus orarius by the followingmeasurements [Hartman and Yates (1985) and Carraway et al. (1993) figures provided firstfollowed by van Zyll de Jong (1983) in parentheses]: total length larger than 200 mm (> 175mm), length of hind foot larger than 24 mm and the condylobasal length of the skull is greaterthan 40 mm (>37 mm).
Distinguishing Scapanus townsendii from Neurotrichus g. gibbsii
Differentiating the Townsend’s Mole from the Shrew-mole is much easier as the formerpossesses 44 teeth (i3/3, cl/1, p4/4, m3/3 dentition) while the latter has 36 (i3/3,cl/1, p2/2,m4/4 dentition). S. t. townsendii has forefeet as wide as long, a total length larger than 130mm, it's tail is smaller then 25% of total length and it's hind feet are larger than 18 mm(Carraway et al. 1993). Also, unlike either of the two Scapanus spp. in the province,Neurotrichus possesses forefeet that are only moderately adapted to digging. This species cantherefore climb small bushes and move with speed and agility above ground (Carraway andVerts 1991). Both Scapanus species have powerful forefeet that are permanently orientedoutwards to facilitate their lateral-thrust type of digging activity (Hartman and Yates 1985).
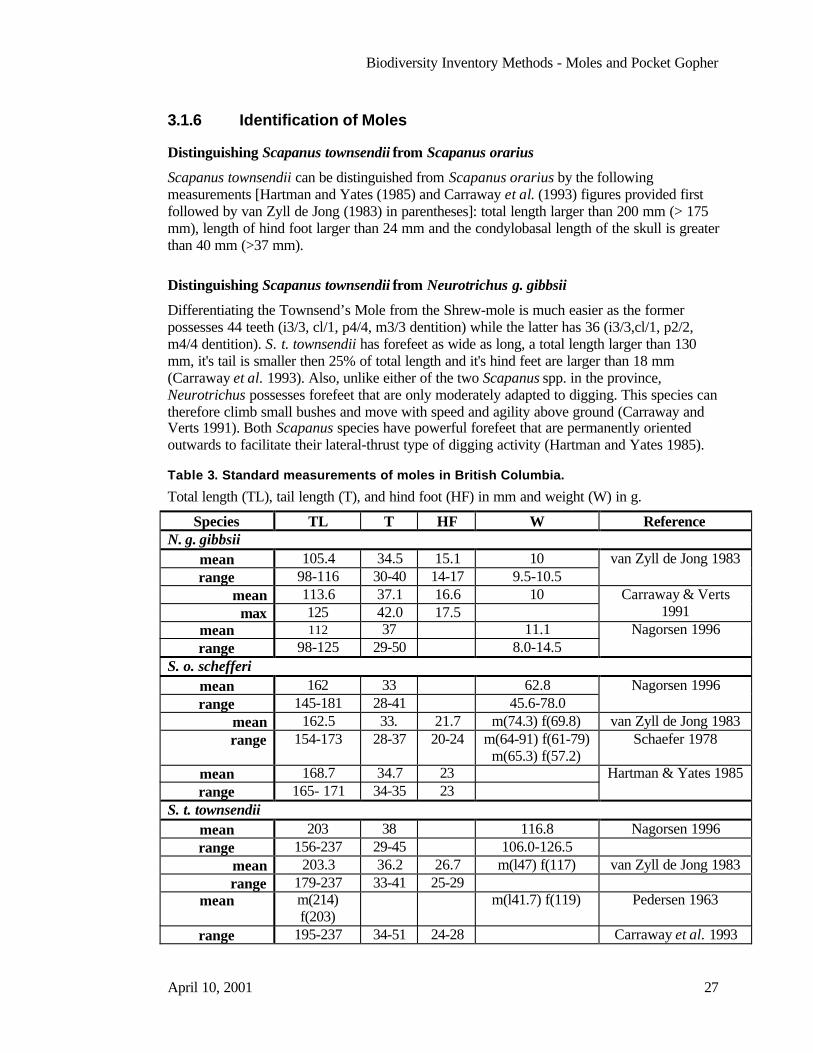
Table 3. Standard measurements of moles in British Columbia.
Total length (TL), tail length (T), and hind foot (HF) in mm and weight (W) in g.
Species TL T HF W ReferenceN. g. gibbsii
mean 105.4 34.5 15.1 10range 98-116 30-40 14-17 9.5-10.5
van Zyll de Jong 1983
mean 113.6 37.1 16.6 10max 125 42.0 17.5
Carraway & Verts1991
mean 112 37 11.1range 98-125 29-50 8.0-14.5
Nagorsen 1996
S. o. schefferimean 162 33 62.8range 145-181 28-41 45.6-78.0
Nagorsen 1996
mean 162.5 33. 21.7 m(74.3) f(69.8) van Zyll de Jong 1983range 154-173 28-37 20-24 m(64-91) f(61-79)
m(65.3) f(57.2)Schaefer 1978
mean 168.7 34.7 23range 165- 171 34-35 23
Hartman & Yates 1985
S. t. townsendiimean 203 38 116.8 Nagorsen 1996range 156-237 29-45 106.0-126.5
mean 203.3 36.2 26.7 m(l47) f(117) van Zyll de Jong 1983range 179-237 33-41 25-29
mean m(214)f(203)
m(l41.7) f(119) Pedersen 1963
range 195-237 34-51 24-28 Carraway et al. 1993

Biodiversity Inventory Methods - Moles and Pocket Gopher
28 April 10, 2001
3.1.7 Sexing MolesResearch on the European Mole indicates that sexing this species can be accomplished bycareful external examination (Gorman and Stone 1990). Measuring the distance from the anusto the urinary papilla has revealed that this measurement is always greater in the male(Gorman and Stone 1990). This method has not been validated with Scapanus spp., but itwould provide an excellent measure for researchers attempting to sex live trapped moles inthe field.
Body weight can be used by researchers to sex moles because females are generally lighterthan males (Pedersen 1963; Gorman and Stone 1990). Pedersen (1963) recorded the standardmammalian measurements for 300 Townsend’s Moles from Oregon and found only slightdifferences in the external measurements. However, body weights were discovered to revealthe greatest difference between the sexes; males averaged 141.65 grams and females 119.03grams (Pedersen 1963). Unfortunately, considerable overlap exists between these averageweights, but Townsend’s Moles that weigh more than 140 grams are probably male.Glendenning (1959) also reported that male Coast Moles were heavier than females althoughsignificant overlap with this species also exists. A Coast Mole that weighs more than 79grams is likely a male (Glendenning 1959); however, pregnant females can exceed thisweight (Sheehan, pers. comm. 2001).
Moles examined during the breeding season may be more easily sexed because the males arelikely to have enlarged testes and the vaginas in females become perforated and visible. Thisprocedure is difficult and should only be performed by experienced researchers to ensureaccuracy. Also, moles captured during the spring should be examined for signs of lactation.
3.1.8 Ageing MolesGlendenning (1959) trapped 940 Coast Moles in Aggasiz, BC from November to Aprilbetween 1935 and 1945. Based on weight categories, fur condition (no criteria provided) andthe number of embryos in gravid females he classified moles into four age classes: young ofthe year (40-60 g), one year old adults (65-70 grams), two year old adults (71-75 g) and agedadults (>75 g). A constant 45% of the specimens were adults older than one year and 6 %were over three years old. This methodology is problematic and its usefulness can only helpto identify Coast Moles less than one year old.
Schaefer (1978) developed a key based upon tooth wear for aging the 23 Coast Moles he killtrapped in Aldergrove, BC. Tooth wear is influenced by habitat and therefore the agesderived from this method should be regarded only as estimates. Schaefer (1978) estimatedthat 18% were one year old, 52% were two years old, 26% were three years old and 4% werefour years old.
The most accurate assessment of a mole’s age can be derived from histological sections madethrough jaw and teeth samples. In these sections the dense annual growth lines can becounted with the use of a microscope (Gorman and Stone 1990). Obviously, this requires thatanimals be killed which is inappropriate for any species at risk. Thus, weighing appears to bethe quickest method for roughly ageing Coast Moles, but it lacks the accuracy possible fromhistological sections. At present there is no ageing criteria for either the Shrew-mole orTownsend’s Mole.

Biodiversity Inventory Methods - Moles and Pocket Gopher
April 10, 2001 29
3.1.9 Marking MolesMole research requiring repeat captures (e.g., growth rates, dispersal distances) will requirethe implementation of some type of system whereby individual moles can be marked andsubsequently identified. Some researchers have found toe-clipping in Townsend’s Mole to besatisfactory and reported no detrimental side-effects (Pedersen 1963; Kuhn et al. 1966). Giger(1973) found that size 5 bands (16.0 by 3.5 by 0.5 mm) fastened to the proximal end of amole's tail resulted in necrosis and tail loss in 7 of 40 (18 %) recaptured Townsend’s Molesmarked this way. Monel butt-end bands (National Band and Tag Company, Newport,Kentucky) of size 6 (19.0 by 3.5 by 0.5 mm) that were attached above the hind foot werefound to be the most effective means of marking adult and sub-adult Townsend’s Mole(Giger 1973).
The use of Monel butt-end bands appears to be the best available method for markingTownsend’s Mole. This method should be investigated with different sized bands, on both theShrew-Mole and Coast Mole. Researchers will have to experiment to establish an effectivemethodology for marking moles. Perhaps tattooing or permanent marker applied to thebackside of the forefeet may also work for recapture studies.

Biodiversity Inventory Methods - Moles and Pocket Gopher
30 April 10, 2001
3.1.10 Mole Trapping
Live Traps
1) Victor-based live trap
Figure 11. Victor-based live trap
After a straight section of tunnel has been identified dig a rectangular plot 35 by 20 cm (cutthe top section of sod in one piece so that it can be replaced when the trap is pulled) keepingthe approximate location of the mole tunnel in the center. When the sod has been lifted off(about 10 cm) carefully scrape the ends of the plot with a hand trowel and locate the moletunnels before continuing to dig. It is extremely important that the trap be packed firmly withdirt below the inside trigger paddle (making a dirt ball with the hands and placing it under thetrigger paddle works). This will ensure that the moles tunneling will force the trigger paddleto ‘spring’ the trap. The ends of the trap are then packed with dirt to the middle section. Apiece of rebar or dowel (< 2 cm) can be reamed into both ends of the trap up to, but notthrough, the harder-packed center to create a tunnel. Center the ends of the trap with theexposed mole tunnels in the plot and set the trap in place. Ensure the ends of the trap aresealed to the mole tunnels with dirt so that no light can enter as this will repel the moles.Mark the trap site with high visibility flagging. Traps should be checked every 12 hours toensure captured moles do not starve. Baits are not necessary with this trap.
Sheehan and Galindo-Leal (1996b) reported an efficiency rate of 14% with this trap. Giger(1973) experienced an efficiency rate of 31% using a similar, but better designed trap.Although these traps are cumbersome and can take up to 30 minutes to set properly they cancatch both Scapanus spp. Considering the central Fraser Valley has been extensivelysampled, it is doubtful that their use for future distribution research would be cost-effective(Sheehan and Galindo-Leal 1996b).
Biodiversity Inventory Methods - Moles and Pocket Gopher
April 10, 2001 31
2) Pipe Trap
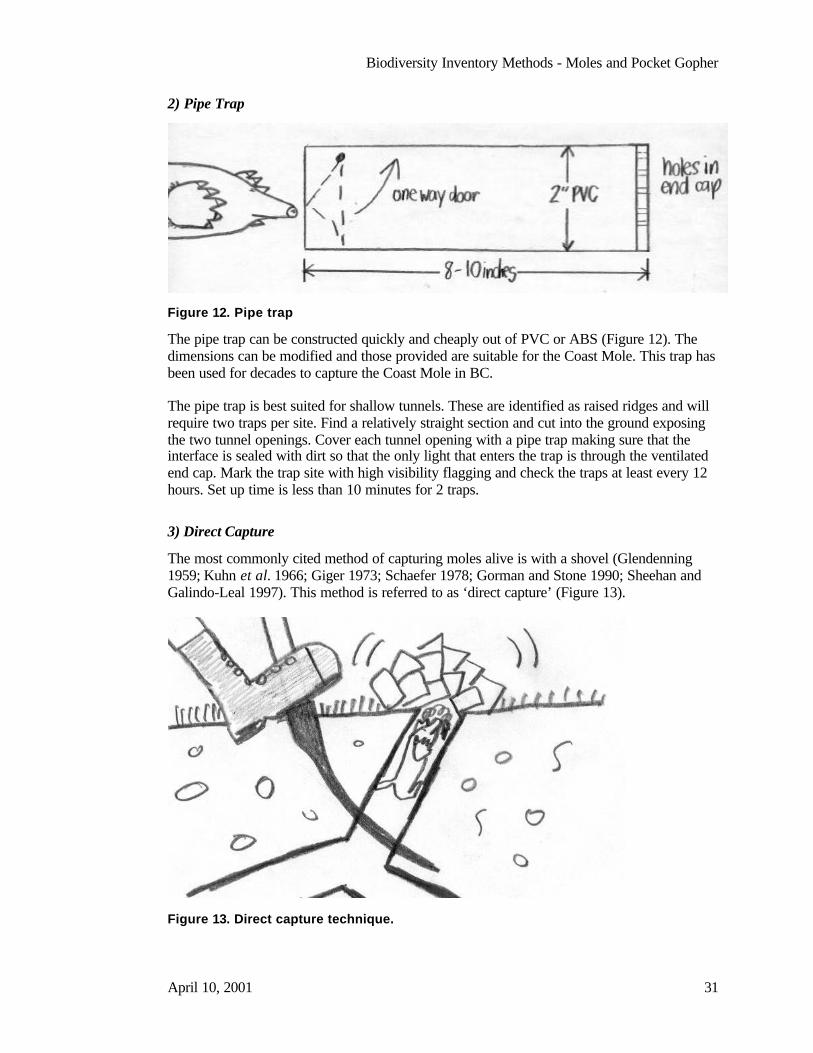
Figure 12. Pipe trap
The pipe trap can be constructed quickly and cheaply out of PVC or ABS (Figure 12). Thedimensions can be modified and those provided are suitable for the Coast Mole. This trap hasbeen used for decades to capture the Coast Mole in BC.
The pipe trap is best suited for shallow tunnels. These are identified as raised ridges and willrequire two traps per site. Find a relatively straight section and cut into the ground exposingthe two tunnel openings. Cover each tunnel opening with a pipe trap making sure that theinterface is sealed with dirt so that the only light that enters the trap is through the ventilatedend cap. Mark the trap site with high visibility flagging and check the traps at least every 12hours. Set up time is less than 10 minutes for 2 traps.
3) Direct Capture
The most commonly cited method of capturing moles alive is with a shovel (Glendenning1959; Kuhn et al. 1966; Giger 1973; Schaefer 1978; Gorman and Stone 1990; Sheehan andGalindo-Leal 1997). This method is referred to as ‘direct capture’ (Figure 13).
Figure 13. Direct capture technique.
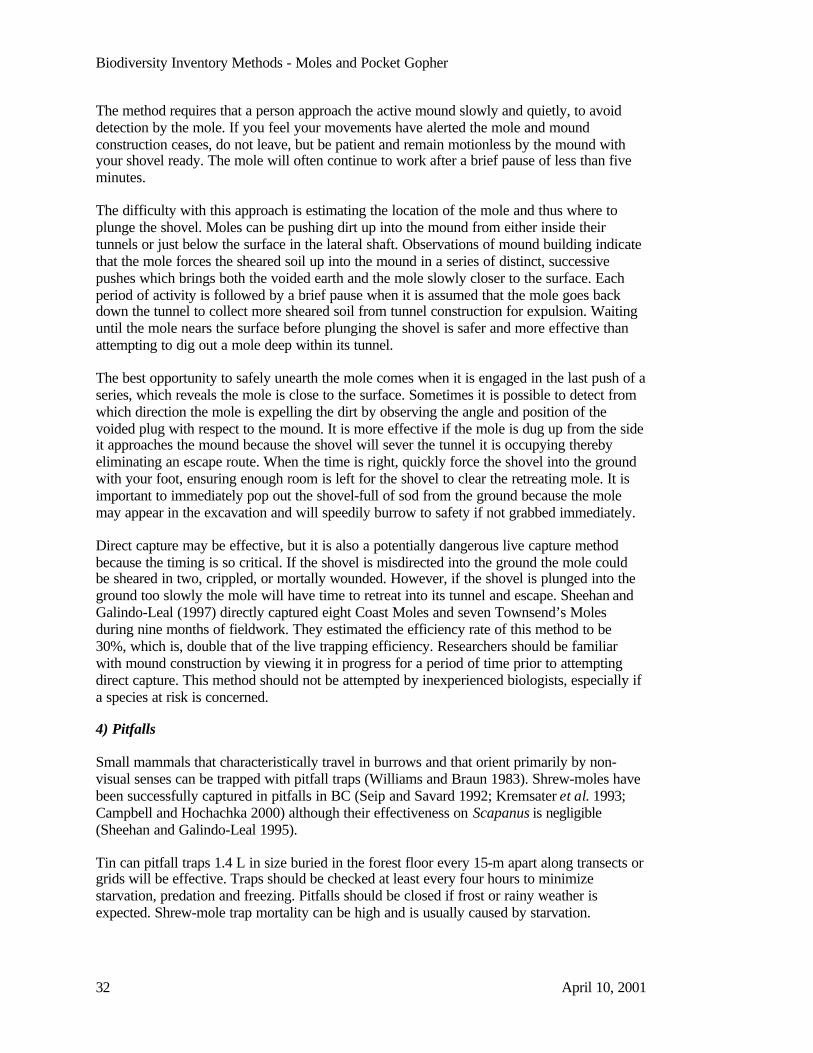
Biodiversity Inventory Methods - Moles and Pocket Gopher
32 April 10, 2001
The method requires that a person approach the active mound slowly and quietly, to avoiddetection by the mole. If you feel your movements have alerted the mole and moundconstruction ceases, do not leave, but be patient and remain motionless by the mound withyour shovel ready. The mole will often continue to work after a brief pause of less than fiveminutes.
The difficulty with this approach is estimating the location of the mole and thus where toplunge the shovel. Moles can be pushing dirt up into the mound from either inside theirtunnels or just below the surface in the lateral shaft. Observations of mound building indicatethat the mole forces the sheared soil up into the mound in a series of distinct, successivepushes which brings both the voided earth and the mole slowly closer to the surface. Eachperiod of activity is followed by a brief pause when it is assumed that the mole goes backdown the tunnel to collect more sheared soil from tunnel construction for expulsion. Waitinguntil the mole nears the surface before plunging the shovel is safer and more effective thanattempting to dig out a mole deep within its tunnel.
The best opportunity to safely unearth the mole comes when it is engaged in the last push of aseries, which reveals the mole is close to the surface. Sometimes it is possible to detect fromwhich direction the mole is expelling the dirt by observing the angle and position of thevoided plug with respect to the mound. It is more effective if the mole is dug up from the sideit approaches the mound because the shovel will sever the tunnel it is occupying therebyeliminating an escape route. When the time is right, quickly force the shovel into the groundwith your foot, ensuring enough room is left for the shovel to clear the retreating mole. It isimportant to immediately pop out the shovel-full of sod from the ground because the molemay appear in the excavation and will speedily burrow to safety if not grabbed immediately.
Direct capture may be effective, but it is also a potentially dangerous live capture methodbecause the timing is so critical. If the shovel is misdirected into the ground the mole couldbe sheared in two, crippled, or mortally wounded. However, if the shovel is plunged into theground too slowly the mole will have time to retreat into its tunnel and escape. Sheehan andGalindo-Leal (1997) directly captured eight Coast Moles and seven Townsend’s Molesduring nine months of fieldwork. They estimated the efficiency rate of this method to be30%, which is, double that of the live trapping efficiency. Researchers should be familiarwith mound construction by viewing it in progress for a period of time prior to attemptingdirect capture. This method should not be attempted by inexperienced biologists, especially ifa species at risk is concerned.
4) Pitfalls
Small mammals that characteristically travel in burrows and that orient primarily by non-visual senses can be trapped with pitfall traps (Williams and Braun 1983). Shrew-moles havebeen successfully captured in pitfalls in BC (Seip and Savard 1992; Kremsater et al. 1993;Campbell and Hochachka 2000) although their effectiveness on Scapanus is negligible(Sheehan and Galindo-Leal 1995).
Tin can pitfall traps 1.4 L in size buried in the forest floor every 15-m apart along transects orgrids will be effective. Traps should be checked at least every four hours to minimizestarvation, predation and freezing. Pitfalls should be closed if frost or rainy weather isexpected. Shrew-mole trap mortality can be high and is usually caused by starvation.

Biodiversity Inventory Methods - Moles and Pocket Gopher
April 10, 2001 33
3.1.11 Pocket Gopher Trapping
Live Traps
A variety of live traps designed to capture pocket gophers (Thomomys) have been describedin the literature (Scheffer 1934; Ingles 1950; Howard 1952; Sargeant 1966; Hart 1973).
The most important variable to consider when choosing which trap to construct is the soilcondition present at the proposed research sites. Other factors such as season, weather, animalsize, animal residency status, and odours of previous animals captured in the trap will effectthe efficiency of the trap (Allen et al. 1997). If the land is sandy it is advisable to select theHart's trap because it was designed specifically for use in this type of soil. Hart's successfullycaptured Thomomys talpoides, the species of gopher that does exist in BC. In addition, Hart(1973) stated that his trap captured both Geomys and Thomomys genera in all types of soil.
Trapping sites composed of stable soils are less likely to require specifically designed traps.The Hart trap is recommended when working with strict budget constraints, as it is cheaper toconstruct than the Bolten trap. Also, it has been field tested on Thomomys talpoides and it iseffective in a wide variety of soil conditions (Hart 1973). When budget is not a concern, theBolten trap should be used, as it has been field tested in BC, and is considered a versatile,successful trap (Fraker pers. comm. 1998). It is recommended that when possible the Boltentrap be favoured over the Hart trap due to the success of the Bolten trap in BC.
1) Bolten Trap
Formally known as the Longworth live trap, this trap has been used extensively for thecapture of small mammals in BC. This trap has several advantages over other traps and isconsidered to be the trap of choice for the live capture of pocket gophers (Fraker, pers. comm.1998). The Bolten trap has several features that make it appealing. First, it has a door that canbe locked open when not trapping. This is particularly useful if you are trying to desensitizean animal to the trap. Second, the trap comes apart into two pieces, the nest box and thetunnel, therefore the trap is easily maintained. And third, the trap is small, easily transported,and relatively easy to operate. The only drawback with the Bolten trap is its significant cost.At around $50.00 per trap, these traps may not be suitable for those working with a limitedbudget. However, these traps have been proven to work in BC, and have been very successfulwhen used to capture pocket gophers (Fraker pers. comm. 1998).
Generally, Bolten traps are used in pairs, with the opening of each trap facing oppositedirections. This increases the capture probability and eliminates potential trap avoidancebehaviour. The traps should be covered with soil and cotton batten to prevent any light fromentering the tunnel system. When trapping within the tunnel system of a pocket gopher, it isadvisable to disturb the tunnel as little as possible. Placement of the traps should occur suchthat the trap is angled slightly downward, allowing for complete door closure.
2) Hart Trap
Hart (1973) reported from field-testing that his trap captured over 200 gophers (trap nightsnot revealed) and resulted in only one injury and one death (causes not disclosed). This trapsuccessfully captured Geomys bursarius throughout its range in all types of soil, even thoseapproaching pure sand, as well as Thomomys talpoides (Hart 1973). Although no figures areprovided, this trap is also claimed to be as effective as the Macabee kill trap when set under
Biodiversity Inventory Methods - Moles and Pocket Gopher
34 April 10, 2001
optimal conditions (Hart 1973). In 1973, the cost of materials for one trap was estimated at$0.40. Traps can be constructed in 45 minutes to one hour (Hart 1973). Despite Hart's (1973)confidence in his trap design he suggested adjustments to the trap diameter, length andsensitivity of the trigger wire, the placement of supporting loops, and the tension andsuspension of the door.
This trap should be placed into an excavated cavity adjacent to the main burrow at an angle.It is important not to break into the main burrow, which requires careful digging down thelateral shaft to ensure that the trap can be positioned horizontally at the junction of the lateralshaft and the main tunnel (Hart 1973). A natural tunnel floor can be simulated in the trap bygently twisting and pushing the trap into the enlarged excavation which will push soil up intothe bottom of the trap (Hart 1973). The trap is then carefully covered, not filled with dirt. Ifthe soil is sandy, a piece of sod placed on the trap will help prevent excess dirt from enteringthe trap (Hart 1973). Do not cover the top perforation in the tin can with dirt. Leave it open toallow light and air into the trap to entice the gopher to enter and trip the trap with its pluggingreflex.
Although Hart (1973) was successful with the use of one trap per site, with its door openingflush with the main burrow, he suggested that two traps facing in opposite directions in themain tunnel might also be effective. Baits are not necessary with this trap.
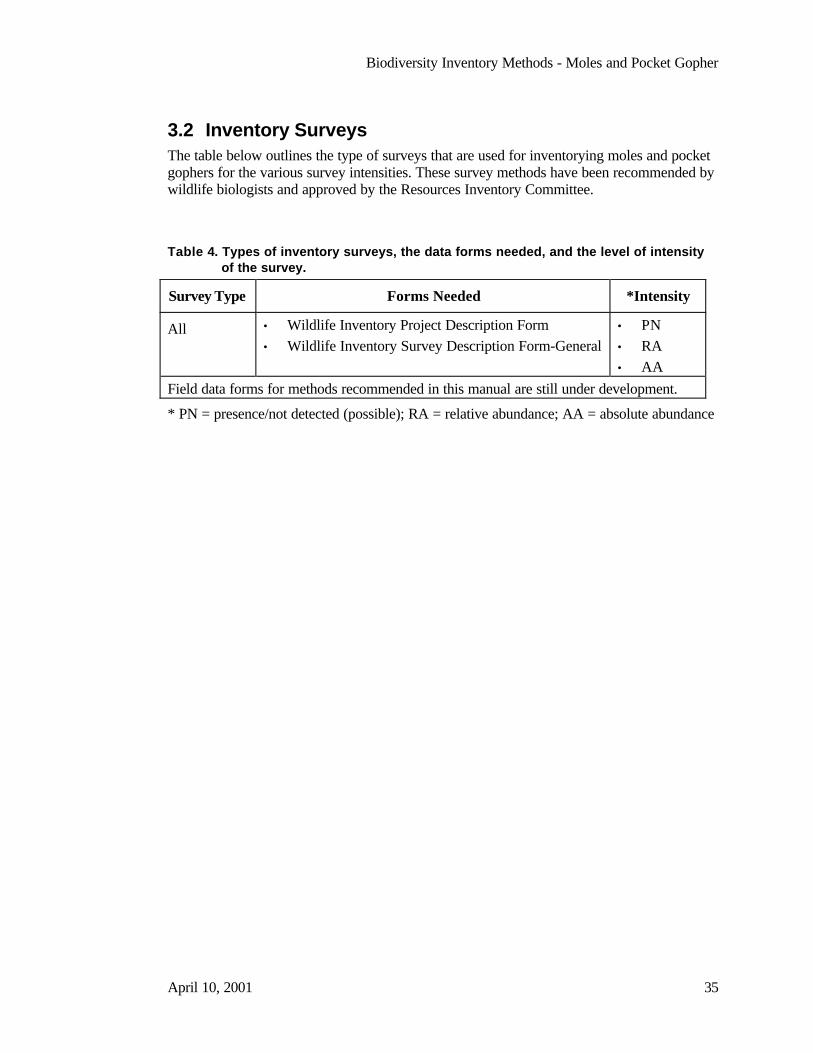
Biodiversity Inventory Methods - Moles and Pocket Gopher
April 10, 2001 35
3.2 Inventory SurveysThe table below outlines the type of surveys that are used for inventorying moles and pocketgophers for the various survey intensities. These survey methods have been recommended bywildlife biologists and approved by the Resources Inventory Committee.
Table 4. Types of inventory surveys, the data forms needed, and the level of intensityof the survey.
Survey Type Forms Needed *Intensity
All • Wildlife Inventory Project Description Form• Wildlife Inventory Survey Description Form-General
• PN• RA• AA
Field data forms for methods recommended in this manual are still under development.
* PN = presence/not detected (possible); RA = relative abundance; AA = absolute abundance

Biodiversity Inventory Methods - Moles and Pocket Gopher
36 April 10, 2001
3.3 Presence/Not DetectedRecommended method: Sign Sampling for moles and pocket gophers.
3.3.1 Sign SamplingThe presence of molehills is the only criterion used by all researchers when selecting studyareas. Areas with active moles are easily identifiable by fresh molehills. Mounds are moreconspicuous during the autumn months when the year’s juveniles temporarily increasepopulation numbers. Mole activity and mound formations are visibly reduced during periodsof cold weather when the soil freezes.
Until recently, sympatric Scapanus spp. could not be differentiated without trapping. A lessinvasive approach using mound and tunnel measurements after Sheehan and Galindo-Leal(1997) is recommended as a way to differentiate Townsend’s Mole from the Coast Mole.Pocket gopher mounds can be differentiated from mole mounds by shape and appearance (seesection 2.4, heading Conspicuousness and Distinctiveness of Sign).
The collection and investigation of the remains in owl pellets provides researchers withanother method of gathering data on the distribution of both Scapanus spp. and Neurotrichusin BC. One regurgitated barn owl pellet usually represents one meal (Giger 1965) whichprovides physical evidence of prey species when analysed.
Giger (1965) found that although Scapanus spp. were preyed upon by the barn owl, very feware consumed. Also, Pedersen (1963) stated that neither dogs or cats were observedconsuming the moles that they killed. This fact should encourage researchers to seek theassistance of landowners considering the less that are eaten the more specimens there shouldbe available. Campbell (1983) examined over 11,000 barn owl pellets, some coming from the13 km2 area surrounding Huntingdon believed to be the range of the Townsend’s Mole inCanada. He found the remains of 317 Coast Moles and only one Townsend’s Mole. Campbell(1983) concluded that Scapanus spp. accounted for less than 0.5% of the barn owl's diet.Kremsater et al. (1991) examined 976 barn owl pellets from the Fraser Valley, 303 from theTownsend’s Mole range. They found 29 Coast Moles and no Townsend’s Mole remains.
Owl pellets have also been examined for the Shrew-mole (Cowan 1942; Campbell 1983;Kremsater and Kremsater 1993). Similar to Scapanus spp., the Shrew-mole made-up less than0.5% of the barn owl's diet in BC (Campbell 1983). Cowan (1942) attributed the low numberof Shrew-mole remains in the barn owl pellets he examined (one in 300 pellets) to differencesin the habitat hunted by the barn owl (open meadowlands) and the mainly wooded habitatpreferred by Shrew-moles. Kremsater et al. (1993) collected 976 barn owl pellets, from Delta,Surrey, Langley, and the Abbotsford area, and discovered the remains of six Shrew-moles.Interestingly, all six remains were recovered from Langley and all but one from a single site.This suggests that although Shrew-moles comprise a very small percentage of the averagebarn owl's diet, some owls may predate upon this species more than others. Several authorshave reported the percentage that shrew moles represent in the diet of different predators:Screech Owl, 5% (Dalquest and Orcutt 1942), Great Horned Owl, 2.3%, and Barn Owl,0.98% (Maser and Brodie 1966). These percentages indicate Shrew-moles are a moresignificant food source for owls than either the Coast or Townsend’s Mole. However,Kremsater et al. (1993) believe that live trapping N. gibbsii offers more potential than BarnOwl pellet analysis in acquiring information on this species.
Biodiversity Inventory Methods - Moles and Pocket Gopher
April 10, 2001 37
Mound-oriented and owl-pellet methods may be used independently or combined whenconducting and animal sign survey.
Office Procedures• Review the introductory manual No. 1 Species Inventory Fundamentals.• Obtain maps for Project and Study Area(s). Any map, which is used to record data,
should be referenced to NAD83.• Outline the Project Area on a map. Due to the limited distributions of moles and gophers,
the scale of this map will probably be no smaller than 1:50,000.• As appropriate, determine Biogeoclimatic zones and subzones, Ecoregion, Ecosection,
and Broad Ecosystem Units for the Project Area from maps.• Delineate Study Areas within this Project Area using the presence of molehills as the
criterion for selecting study areas. Study Areas will generally be fairly small (no morethan a few hectares) for this species and as “closed” as possible to movement over thestudy area boundary.
• Study areas should be representative of the Project Area if conclusions are to be madeabout the Project Area. For example, this means if a system of stratification is used in theSampling Design then strata within the Study Areas should represent relevant strata in thelarger Project Area.
• Draft a letter to landowners whose properties are to be surveyed. This letter shouldoutline who will be working in the area, what they will be doing, the objectives of theresearch, and the dates and duration that the property would be visited if access isgranted.
Scapanus differentiation based on mound and tunnel characteristics
More data are desirable to support the use of mound and tunnel characteristics as a tool fordifferentiating the presence of one Scapanus species from another. The protocol belowprovides a simple method to further test this method before using it to determine speciespresent in a new area where either or both species may occur.
• Choose study areas where mole sign is present. Study areas should possess boundariesover which movement will be minimized (e.g. roadways). Ensure that study areas aresmall enough that they can be thoroughly searched, or if larger study areas are desired,these should be stratified to ensure that “likely” habitats are thoroughly searched. Includecontrol areas that contain only the Coast Mole considering this mole is extremelyabundant and widespread (e.g. Surrey, Langley and Vancouver).
• Completely search each study area. Transects which cover the entire study area canensure that it is searched thoroughly. Roughly map and number each encampment in thedelineated study area.
• Randomly select a number of encampments to sample within each study area. If there areonly a few encampments, sample them all.
• For each encampment sampled, roughly map and number the mounds.• Randomly select mounds for measurement (preferably 3-5 fresh mounds per
encampment).• Measure and describe attributes of each randomly selected mound (as described in Field
procedures below).

Biodiversity Inventory Methods - Moles and Pocket Gopher
38 April 10, 2001
• Perform an Analysis of Variance based on these measurements to investigate significantdifferences in mound measurements and possible occurrence of Townsend’s mole,characterized by significantly larger mounds and tunnel diameter, in a study area. SeeData Analysis.
• Perform additional Townsend’s Mole live trapping in areas known to support this species(e.g. Farmer and MacKenzie Road west of Huntingdon and Ledgeview Golf Course areaon Sumas Mountain). This is necessary to create a robust Townsend’s Mole mound andtunnel measurement sample size.
Sampling Design• There is no standard sampling design to determine presence other than concentrating in
areas that have a high density of activity and sign for the target species. Searchappropriate habitat areas within the restricted ranges of each species.
• If the survey is attempting to evaluate the presence of mole fauna in an area wheresympatric mole species may occur, it is recommended that the sampling design follow theapproach described above (Species differentiation based on mole mound and tunnelcharacteristics).
• Owl pellets: As above, collect any pellets that are found.
Sampling Effort• The amount of effort and time required for a survey will depend largely on the size and
the number of study areas.• If more than one study area is to be sampled, sampling efforts should remain constant if a
valid comparison of species richness between areas is to be made.
Personnel• Field personnel should be familiar with identifying mole remains or signs, especially the
differences between Scapanus spp. mound and tunnel characteristics.• At least one person should be familiar with the collection of habitat data.
Equipment• Maps • Calipers (tunnel diameters, mole measurements)• Gloves • Tape measure (mound diameters, heights)• Hand trowel • Bendable ruler• Wire flags (orange) • Weight scale (up to 200 grams)• Probe (rebar) • Specimen tags/bags• Field book with data forms and pen • Field guide to mammals• Indelible ink marker (for flagging) • Binoculars• Golf balls (4.3 cm diameter) • 5 gallon pails (carry gear) and long handled
shovels

Biodiversity Inventory Methods - Moles and Pocket Gopher
April 10, 2001 39
Field Procedures - Mounds• It is best if fresh mounds can be found, as this supports the conclusion that moles or
gophers presently occupy the study area. This approach works well if the study area is alarge pasture or hayfield that could be chain harrowed with a tractor and then observedfor signs of fresh activity. Also, a freshly cut hayfield would provide an excellent sitebecause the machinery would have leveled most molehills, flattened numerous surfaceruns and cleared the field to permit the observation of the latest diggings. However, thewindow of opportunity is limited to the growth rate of the grasses. Therefore, researchersshould be in regular contact with farmers during the haying season to take advantage ofthis opportunity.
• Draw a sketch map of the sample area that indicates directions to the site, outline of thestudy area, prominent features within the site, and the location of transect lines (if used)so that other investigators may relocate the appropriate site for future sampling.
• Follow either a systematic or random sampling design (see section Sampling designabove).
• Record any mole or pocket gopher observations or sign detections on the appropriatedataforms.
• Determine whether a detected mound belongs to a pocket gopher or a mole:• Thomomys mounds are constructed of finely sifted dirt and are generally fan-shaped
while mole mounds are cloddy and conical in appearance (see Figure 7).• Pocket gophers regularly fill their abandoned runways with dirt, a process rarely
undertaken by Scapanus spp. (Moore 1939).• The existence of observable raised ridges which result from Scapanus spp. surface
tunneling are not usually produced by Thomomys (Anderson and Kluge 1986).• For each selected mole mound record the following attributes (see Figure 6):
• Mound width = greatest diameter at the base of the molehill (measuring tape)• Mound height = distance from the ground to the apex of the mound (ruler)• Perform the ‘Golf Ball’ test to determine whether the tunnel is large enough for a golf
ball (~ 4.3 cm diameter) to fit into. Expose tunnels by digging through mound untilthe vertical shaft reaches the permanent horizontal tunnels. Dig the tunnels squarelyback about 10 cm to ensure a consistent measure before inserting the golf ball.Drilling through the middle of the golf ball and pulling a string through and tying itoff on either side will eliminate losing the ball down a tunnel.
• Vertical tunnel diameter = taken approximately from 10 cm from either side of thefork where the vertical shaft originates (use calipers).
• Determine from mound and tunnel measurements which mole species are present (seedata analysis calculations).• Base decisions on your own calculations from earlier field testing (see section,
“Species differentiation based on mole mound and tunnel characteristics”) and/or• on the results of studies by Sheehan and Galindo-Leal (1997) in southwestern BC.
They determined that encampments containing mounds, which exceed 15 cm inheight and 40 cm in width with shallow tunnel diameters greater than 4.5 cm(approximately the size of a golf ball) strongly indicate the presence of Townsend’sMole.
• If it is not clear from mound and tunnel measurements which Scapanus spp. is presentlive-capture may be necessary.

Biodiversity Inventory Methods - Moles and Pocket Gopher
40 April 10, 2001
Field Procedures - Owl pellets• Draw a sketch map of the sample area that indicates directions to the site, outline of the
study area, prominent features within the site, and the location of transect lines (if used)so that other investigators may relocate the appropriate site for future sampling.
• Transects may be used to ensure complete coverage of the study area. If this is notfeasible, it may be most efficient to include portions of the study area where perching androosting trees for raptors are present.
• Record any mole observations or sign detections on the appropriate dataforms.• Collect any owl pellets found.• Examine pellets (or have them examined if you are not skilled at identifying prey
remains) to determine prey items, specifically whether any moles were consumed.
Data Analysis• Compile lists of the sampled species indicating which were present at each study area. It
is important to note that not detecting a species does not necessarily indicate that it isabsent from the study area. However, the greater the sampling effort, the more confidenceone has about which species are present and which are absent.
• Summarize attributes of measured mounds, if appropriate, by study area.• If appropriate, perform Analysis of Variance by study area and by encampment (if
sample size permits – as discussed in Species differentiation based on mole mound andtunnel characteristics). This may provide a valuable clue as to where Townsend’s Mole,which is characterized by significantly larger mounds than Coast Mole, may occur.Beware of the effects of “diluting” measurements from Townsend’s Mole mounds withthose from Coast Mole mounds in study areas where the two species’ distributionsoverlap. This will result in less discernable differences between mound measurementscollected from study areas occupied exclusively by Coast Moles, and those that alsocontain Townsend’s Mole.
Biodiversity Inventory Methods - Moles and Pocket Gopher
April 10, 2001 41
3.4 Relative AbundanceRecommended method: Sign Sampling for moles; and Ground Counts of Mounds and EarthPlugs and/or Aerial Photographic Surveys for pocket gophers.
3.4.1 Sign SamplingWhereas section 3.3.1 contains protocols for sampling mounds to determine presence, it isnecessary to sample new mound activity to evaluate relative abundance of fossorialmammals. Many of the procedures for sampling mounds will be the same as those describedin section 3.3.1.
Mound Activity
At present, there is no accurate means of calculating the number of moles from the number ofmounds in an area. However, indirect indices of mole abundance can be acquired byphysically destroying existing mole activity and recording the subsequent mound and surfacetunnel production. This approach would be ideally suited to a large pasture or hayfield thatcould be chain harrowed with a tractor and then observed for signs of fresh mole activity.Concentrations of new mole mounds when observed on a daily basis and isolated from others(20-30 m) would indicate distinct mole encampments. Daily flagging each area of newactivity will provide the researcher with a rough estimate of mole numbers, in less than aweek, for a particular study plot.
Sampling Design• Search in areas that have a high density of mole activity and signs.• Unlike methods described for Presence/Not Detected, it is very important to attempt to
keep bias constant between the different units sampled when evaluating relativeabundance.
Sampling Effort• Sampling efforts must remain constant if a valid comparison is to be made among study
areas, or over time at a study area.• Depending on the density of the target species, surveyors may choose to standardize their
results by unit effort (e.g. mounds per linear distance of transect searched) or per squareunits (e.g. meters) of study area searched.
Data Analysis• Be explicit in written discussion that mound activity values do not equate to actual
animals.• Comparisons of relative abundance among sites is only possible if biases (e.g. effort,
detectability) can be maintained at a constant level when sampling within each of thestudy sites. Surveyors should be clear in their written discussion as to where unequalbiases may lead to possibly erroneous results.
• To determine relative abundance, summarize the data in terms of observations per uniteffort, i.e., area or time.

Biodiversity Inventory Methods - Moles and Pocket Gopher
42 April 10, 2001
3.4.2 Ground or Aerial Photography to Count SignGround Counts of Mounds & Earth Plugs and/or Aerial Photographic Surveys for pocketgopher sign counts.
Relative abundance has been shown to only be useful if it can exhibit a reasonably consistentrelationship with actual abundance over time and/or space. Teipner et al. (1983) describeseveral techniques which may be used when determining relative abundance of pocketgophers. Richens (1965) found that a positive correlation existed between gopher density andfresh gopher mounds counted bimonthly in a given area; he did not find a positive correlationwhen counting in 72 hour intervals. Conversely, Reid et al. (1966) found that a positivecorrelation between gopher densities and mound counts done in 48-hour intervals did exist.They combined mound counts with a session of kill trapping immediately following a countsession. In this way they were able to determine the number of active pocket gophers presentin a given area. Teipner et al. stated that ground counts and aerial photography were the mostfavourable methods to use as they provided the highest level of accuracy. Table 4 lists seventechniques that have been used to determine relative abundance of pocket gophers.
Table 5. Population estimation techniques that have been used to obtain relativeabundance of pocket gophers (After Teipner et al. 1983).
Technique Timing/Method Recommended References
Surface Sign
Surface signand killtrapping
• Bimonthly throughout summer• Visually count mounds and
earth plugs• Visual sign every 48 hours.
Trapping: best results in latesummer, early fall
• Yes• With caution
• (invasive)
• Richen 1965• Reid et al. 1966
Winter SoilCasts
• Winter, after snowmelt • With caution • Richens 1965; Reidet al. 1966; Reid1973; Reid 1981.
Open Hole • Spring/Summer/Fall• Open marked burrows, then
check the number of pluggedholes 24 hours later forindications of activity
• Yes• (inclement
weather canresult inconservativeestimates)
• Miller and Howard1951; Miller 1953;Richens 1968;Barnes et al. 1970;Hungerford 1976;Birch 1978.
AerialPhotography
• Whenever mounds are visible• Photograph mounds from air
and count from photo
• Yes • Driscoll and Watson1974.
NearestNeighbor
• Seasonally • With caution • Hansen andRemmenga 1961
Bonar (1995) also describes three types of pocket gopher surveys that can be used to establisha relative abundance:
Biodiversity Inventory Methods - Moles and Pocket Gopher
April 10, 2001 43
Visual Reconnaissance
This method is used to determine the presence of pocket gophers and determine the relativedensity of gopher activity. Recently created mounds and winter casts are used to estimate arough percentage of a particular area that has an active gopher population associated with it(Bonar 1995). These surveys can be conducted using a predetermined survey design such ascircular or linear plots selected systematically or randomly in such a way that the area inquestion is sufficiently sampled.
Mound-Count Surveys
These will provide an approximate population density and are easy to do. Using a plot surveythat samples 1 to 5 percent of the area, one is able to ascertain the locations of concentratedgopher activity. This will also enable one to approximate the number of gophers per unit areaas well as the range of gopher activity over the entire area. Because earth plugs do not affectthe reliability of only counting mounds, they can be ignored in any tally of gopher sign(Bonar 1995). Population indices based on mound-counts alone are more reliable than thosebased on winter soil casts alone. Reid (1973) reports that winter soil casts may have utility inestimating relative abundance in early summer before the young disperse.
Mound-count surveys can be done quickly and efficiently using linear transects selectedrandomly or systematically throughout the area in question. One possible survey design mayincorporates 2m linear transects selected randomly from a random numbers table such thateach transect spans the width and/or length of the sample plot. The sample area may be afraction of the desired area or may very well include the entire sample area. It is suggestedthat linear transects be used as they are easy to set up and can be repeated readily. To increasethe randomness of the survey, one may choose to select different compass bearings and/ortransect lengths from a random numbers table.
Open-Burrow Surveys
The open-burrow method gives a more accurate relative abundance method than does themound-count survey. This is in part due to the pocket gopher’s solitary nature and to theirtendency to plug any hole in their burrow system. To obtain an estimate, you expose a mainrunway in a representative sample of the burrow systems in a unit, and check the holes within48 hours to see if the gophers closed them. If a hole remains open, the burrow is presumed tobe unoccupied. The same procedure that is used for mound-count surveys can be appliedhere, with the addition of a probing device, which can be used to create the holes in activeburrows.
Bonar (1995) found that the most effective method to determine relative abundance of pocketgophers was (in decreasing order): Open-burrow surveys, Mound-count surveys, and Visualreconnaissance. Therefore it is the recommendation of this manual that if the most preciserelative abundance is required, then the Open-burrow systems be used when ever possible todetermine relative abundance. When determining presence/not detected, Visualreconnaissance can be used quite successfully, perhaps in combination with Mound-countsurveys. It is also possible to use a combination of ground counts and/or aerial photography,as it is non-invasive, efficient, and economical. Furthermore, surveys should be planned forlate summer / early fall because the young-of-the-year have dispersed by this time (Bonar1995).
Biodiversity Inventory Methods - Moles and Pocket Gopher
44 April 10, 2001
3.5 Absolute AbundanceRecommended method: Mark-recapture sampling.
Live trapping should be performed only if sufficient precautions have been taken to minimizethe risk of death to the captured animals (see below, Field Procedures).
Prior to inventorying study species, researchers must first decide the size of the study area(s)they require to accomplish the objectives of their research. The next step is to identifylocations where there is animal activity and to assess the suitability between this area andyour research goals (see section 3.1.2). Locating study sites to live trap the Shrew-mole andCoast Mole in BC is relatively easy because of their widespread distribution as compared toTownsend’s Mole. Researchers undertaking the live capture of Townsend’s Mole should lookto previous fieldwork, voucher specimens and professional mole trappers for assistance indelineating a study area.
Information pertaining to the absolute abundance of a species in different habitat types isuseful for the development of wildlife management policies. Unfortunately, acquiring thisknowledge for moles is difficult because they are rarely observed; however, severaltechniques have been developed to assist researchers in determining the population levels ofmoles and pocket gophers.
Although the sampling methods described below focus primarily on moles they can beapplied to pocket gophers, provided the sample size is adjusted accordingly.
3.5.1 Mark-recapture SamplingAbsolute abundance of a population can be determined by utilizing a mark-recapturemethodology. Captured animals can be marked and then released. Despite the disturbancesthis method will cause to the local population it would be considerably less than that causedby kill trapping the population. Mark-recapture sampling requires significantly more labourto execute and the success rate in recapturing the wary, elusive mole is probably low despitesome past success. Townsend’s Moles were recaptured using Victor-based live traps and onewas re-captured a total of eight times (Giger 1973). Attempts to establish absolute abundancefigures for Scapanus spp. in BC by live trapping would be costly and extremely difficultconsidering low capture rates.
There are several concerns to incorporate into a researcher’s mark-recapture study design,such as: length of trapping schedule, time of year, biased trapping of males and varyingtrapping skills amongst personnel must be addressed when live trapping. Weather conditions,differences in the distances between traps, and the varying ability of certain traps to capturemoles are variables that will also influence population estimates when trapping.
There are numerous variations on the MRR method. However, all have common assumptionsthat must be met, or approximated, in order for subsequent data analysis and abundanceestimates to be valid. These assumptions are:1. Demographic and geographic closure (i.e., The sample population is not significantly
altered by births, deaths, immigration or emigration during the time of sampling).

Biodiversity Inventory Methods - Moles and Pocket Gopher
April 10, 2001 45
2. All members of a population must have an equal or known probability of being captured(i.e., any sample should be representative of the population being sampled).
Only in rare situations are both of these assumptions ever met; however, it is important thatcontinued efforts be made to approximate them, if accurate estimates of population size are tobe attained. When trapping Scapanus researchers should be aware that during the breedingseason males will leave their encampments in search of receptive females and that males aremore frequently live trapped (Pedersen 1963). Also, females with pups to nurture do notventure far from their nests. It is possible to minimize the effects of violating assumptions bymodifying the general approaches discussed below. It can be useful to review somemodifications to the basic formulas in literature such as Eberhardt (1969), Cormack (1972),O'Farrell et al. (1977), Pollock (1982), Krebs and Boonstra (1984), Nichols et al. (1984),Kenneth and Anderson (1985), Wilson and Anderson (1985), and Chao (1988). However, thecomputer program CAPTURE integrates all of these formulae into one comprehensivepackage, and researchers may find it easier to consult documents which deal with the suite ofmodels used in CAPTURE, such as Otis et al. (1978), White et al. (1982), or Rexstat andBurnham (1991). See also the introductory manual, Species Inventory Fundamentals, No. 1.
Office Procedures• Review the introductory manual No. 1 Species Inventory Fundamentals.• Obtain maps for Project and Study Area(s) (e.g., 1:50 000 air photo maps, 1:20 000 forest
cover maps, 1:20 000 TRIM maps, 1:50 000 NTS topographic maps). Any map, which isused to record data, should be referenced to NAD83.
• Outline the Project Area on a small to large scale map (1:250,000 – 1:20,000).• Determine Biogeoclimatic zones and subzones, Ecoregion, Ecosection, and Broad
Ecosystem Units for the Project Area from maps.• Delineate one to many Study Areas within this Project Area. Study areas should be
representative of the Project Area if conclusions are to be made about the Project Area.For example, this means if a system of stratification is used in the Sampling Design thenstrata within the Study Areas should represent relevant strata in the larger Project Area.
• Based on map interpretation, identify transects and/or grids for census.• Draft a letter to landowners whose properties are to be surveyed. This letter should
mention: who the researchers are, what species is under study, the objectives of theresearch, dates and duration that property is be accessed.
• Acquire necessary permits for trapping.
Sampling Design• Sampling designs for mark-recapture will vary with the objectives of a study. Traps are
generally arranged systematically along straight or meandering transect lines or in a gridfashion. Length of transacts, dimensions of grids, and distance between trap stations willvary upon topography and home range size of the inventory species.
Time of Day• Late afternoon to early morning may be the most humane time to live trap moles or
pocket gophers during hot weather. During the hot summer months exposed traps shouldbe closed during the day.

Biodiversity Inventory Methods - Moles and Pocket Gopher
46 April 10, 2001
Sampling Effort• It is difficult to recommend appropriate sample sizes (number of animals sampled) for the
different trapping techniques described in the ‘sampling standards’ section. In general,the larger the sample size, the more precise the abundance estimate will be. Trappingshould be performed consistently, i.e., trap sessions should be scheduled uniformlyamong the different study areas.
Personnel• Field personnel should be familiar with identifying mole or pocket gopher signs and the
differences between Scapanus spp. mound and tunnel measurements.• At least one person should be familiar with proper trap setting techniques.• At least one person should be familiar with the collection of habitat data.
Equipment• Trapping license(s) • Indelible ink marker (for flagging)• Maps • Calipers (tunnel diameters, mole
measurements)• Traps (ensure enough are available and that
they are in working condition)• Tape measure (mound diameters, heights)
• Bait • Five-gallon pails (2)• Shovel • Earthworms• Gloves • Weight scale (up to 200 grams)• Hand trowel • Bendable ruler• Wire flags (orange) • Specimen tags/bags• Probe (rebar) • Field guide to mammals• Mole Holder • Binoculars• Field book with data forms and pen
Field Procedures
Place traps at predetermined capture (trap) stations.
Plot size for small mammals is generally 10-20 times the expected size of the species averagehome range, or no less than 2 ha (Blair 1940). Schaefer (1978) tracked one Coast Mole andcalculated its home range to be 39 m by 39 m. Giger (1973) calculated the mean of thegreatest distance between points of capture for 14 Townsend’s Moles of both sexes, capturedthree or more times, to be roughly 41 m. If we accept these figures as workable home rangevalues for each species and multiply them by 15 (average of 10-20) then a minimum plot sizewould be between 2.3 and 2.5 ha for trapping the Coast Mole and the Townsend’s Molerespectively. These are only approximations and should only be used as a guide.
Once a study site has been selected it can be marked off into a 1 ha study plot that will allowthe researcher to uniformly subdivide the plot (e.g., 10 by 10 m). Schaefer (1978) subdividedhis study plot so that he could make comparisons between molehill and earthworm numbers,within each study site.
There is no information pertaining to the Shrew-mole's home range (van Zyll de Jong 1983),but their population density has been estimated to be 12 to 15 animals/ha (Dalquest andOrcutt 1942).

Biodiversity Inventory Methods - Moles and Pocket Gopher
April 10, 2001 47
Grids and transects provide a systematic approach to trapping. They allow the researcher tocompare results from different trap sites. Terry (1981) successfully trapped Shrew-moles inWashington by setting up parallel traplines in 10 seral forest stages with internallyhomogenous vegetation. The parallel traplines were 12 m apart and each individual traplinewas comprised of 10 stations, at 6 m intervals, containing two Victor mouse traps baited witha mixture of peanut butter, bacon grease and rolled oats.
Paired (Calhoun) traplines were also used by Anthony et al. (1987) to investigate thepresence of small mammals in riparian zones (1 m from the stream and 15-25 m from thestream) in young, mature, and old-growth coniferous forests. However, only one Shrew-molewas captured after 900 trap nights. Each trapline consisted of 25 trap sites and positionedevery 15 m were two museum special traps and one Victor rat trap that were baited withrolled oats and peanut butter.
Gashwiler (1959) used small-mammal grids to investigate mouse populations in differentforest habitats that could be also be used when trapping Shrew-moles. Seip and Savard (1992)established grids of pitfalls and other traps throughout the north shore mountains of the FraserValley and after 13,722 pitfall trap nights, 48 Shrew-moles were captured.
Hooven and Black (1976) established permanent grids for live-trapping small mammals inwestern Oregon to investigate the effects clearcutting practices had upon their populations.Each grid was comprised of 10 rows that were spaced at 20 m intervals with two Sherman-type metal live traps of 22-gauge steel (9 by 9 by 25 cm) set at each station. These researcherssheltered each trap with bark and limbs to protect the captured animals from the elements.The traps were baited with a mixture of rolled oats, Douglas-fir seed, commercial bird seedand opened for three consecutive days per month from April to October 1968-1970. Threeyears of trapping (31,500 trap nights calculated) resulted in the 'infrequent' capture of 26Shrew-moles and four Coast Moles (Hooven and Black 1976). Unlike the Shrew-mole, CoastMoles were captured in all three plots; the undisturbed forest, the clearcut forest, and theburned clearcut plot (Hooven and Black 1976). These results suggest that the Sherman metallive trap may be an effective trap for Coast Moles and Shrew-moles since it successfullycaptured both species.
Setting & Checking traps• Please see ‘Sampling Standards’ section for details on trap types and trap placement.
Ensure that enough traps are available and that they are in good working condition.• During the hot summer months exposed traps should be closed during the day unless
personnel are available to check them regularly. Late afternoon to early morning maybe the most humane time to live trap moles or pocket gophers during hot weather. Ifdaytime trapping must be undertaken, attempts should be made to shelter the trapsfrom direct sunlight.
• When trapping in cold weather the traps should be baited and supplied with nestingmaterial and checked at least every 12 hours. A caged mole will die in 12 hours if leftin a live trap without food (Glendenning 1959; Pedersen 1963; Schaefer 1978).
Mark & measure unmarked animals• See ‘Sampling Standards’ section for details on species’ measurement and marking.
Biodiversity Inventory Methods - Moles and Pocket Gopher
48 April 10, 2001
Data Analysis - General
There are numerous ways of analyzing data from a mark-recapture study. Absoluteabundance is determined by means of various estimators. The following is a short list of someuseful texts that can be consulted for specific details for mathematical formulas:
1. Begon (1979). Investigating animal abundance: capture-recapture for biologists.2. Davis (1982). CRC handbook of census methods for terrestrial vertebrates.3. Krebs (1989). Ecological methodology.4. Schemnitz (1980). Wildlife management techniques manual.5. Seber (1973). The estimation of animal abundance and related parameters.6. White et al. (1982). Capture-recapture and removal methods for sampling closed
populations.
If a density estimate is required then at least four sessions should be conducted in a brief timeperiod (to minimize violations of the assumption of closure). Many small mammal studiestrap for four or five successive nights to get density estimates. The effect of trapping onanimals should be considered when deciding the interval between trapping sessions; it will beless disruptive to the local population to allow for breaks in a trapping schedule. Data fromthis design can be used with program CAPTURE (see White et al. 1982).
As an alternative, the Jolly-Seber model will allow calculation of survival estimates, as wellas a population size; however, biologists should be aware that this is not a true measure ofdensity even though it provides a good measure for comparison over time or among areas.Sampling sessions can be conducted with a longer duration between trapping periods (i.e., afew sessions each month). Many analysis options exist for the Jolly-Seber model; these arediscussed in Species Inventory Fundamentals, No. 1.
Both of the designs above can be combined to allow density and survival estimates. Thisdesign is called “Pollock’s robust design” and is also discussed in Species InventoryFundamentals, No.1.
For systematic sampling, one trap per capture (trap) station is usually sufficient. Within densepopulations, however, 2 or 3 traps per capture station may be necessary to avoid competitionfor traps.
Data Analysis - Sampling Effort
It is difficult to recommend sample sizes (numbers of observations or animals sampled)which are appropriate for every situation, as this will depend on the level of precision needed.Of course, the larger the sample size is, the more precise the abundance estimates will be. Ingeneral, sample sizes can be increased by increasing sampling effort. However, there arealways limits to the amount of sampling effort that can be afforded during a study. Thesolution then becomes a compromise between available resources and levels of precisionrequired to meet the objectives of the study. The simulation modules provided in CAPTUREand NOREMARK can be very helpful in determining the sampling effort needed to getadequate estimates. In addition, Pollock et al. (1990) provide sample size tables for the Jolly-Seber model.
The “robust” study design of Pollock (1990) is recommended if density estimates, andsurvival, and other demographic rates are an objective of inventory efforts. With this design,a series of five-day samples are conducted at equal intervals (i.e., every month) during thetime period of interest. The data from the five-day sessions is used to estimate density using

Biodiversity Inventory Methods - Moles and Pocket Gopher
April 10, 2001 49
program CAPTURE. (See section on data analysis, and Species Inventory Fundamentals, No.1, Appendix G for more details on program CAPTURE.) In addition, these data are pooledand used with the Jolly-Seber model to estimate survival and other demographic parameters(using JOLLY or JOLLYAGE). This design has the following advantages:
1. Theoretically robust estimates of population size and survival are possible
2. Temporary emigration from the study area can be estimated from the data set allowingfor further demographic inference, and less biased survival estimates if a subset of thepopulation is not available for capture in a given trapping period. A new program,RDSURVIV, has been designed for this purpose when the robust design is used (seeSpecies Inventory Fundamentals, No. 1, Appendix G).
3. The data should also allow further demographic inference and model fitting of survivalrates using programs MARK, SURGE, and POPAN (see Species InventoryFundamentals, No. 1, Appendix G).
Methods are available for biologists to determine appropriate sample sizes for the variousmark-recapture estimators. It is recommended that project biologists consult the followingsources for sample size calculations (Table 3).
Table 6. Sources for sample size calculation
Estimator Source for optimal sample size calculation:Lincoln-Peterson estimator. Krebs (1989 page 22)Jolly Seber estimates Pollock (1990, page 72)
Simulation: POPAN (Arnanson and Schwarz, 1987)CAPTURE White et al. (1985)
Simulation: CAPTURE
The above references include graphs, and discussions of needed sample sizes for estimators.The determination of optimal sample sizes for program CAPTURE is complex. An easy touse simulation module is available as part of the program CAPTURE to allow biologists toexplore sample size issues.
Data Analysis - MRR
The project biologist should be familiar with the different methods of data analysis for mark-recapture inventories before data collection begins. Different assumptions and requirementsof the various models will have great bearing on sample design, effort and overall approach.
Below is a cursory discussion of mark-recapture models. This is included to providebiologists with an overview; however, a greater depth of knowledge will be required toactually carry out a mark-recapture inventory. Prior to commencing, it will be necessary toconsult Species Inventory Fundamentals No. 1 as this manual provides descriptions of manytechniques, which are generic to species inventory. In addition, the following is a short list ofsome useful texts and articles. For complete citations see Literature Cited.
1. White et al. 1982. In some opinions, this is by far the most readable reference onmark-recapture that is available. Available at:
2. http://www.cnr.colostate.edu/~gwhite/software.html3. Buckland et al. 1993. Good text for distance and transect sampling.

Biodiversity Inventory Methods - Moles and Pocket Gopher
50 April 10, 2001
4. Krebs 1989, (also 1998, 2nd Edition). Good all round discussion of study design, butChapter 2, Estimating abundance: Mark-and-Recapture techniques, is especiallyappropriate).
5. Pollock et al. 1990. A good discussion of the Jolly-Seber model.6. White and Garrot 1990. A good discussion of study design for radio-telemetry
estimation studies.7. White 1996. A good discussion of mark-resight estimation procedure.8. Schemnitz 1980. Wildlife management techniques manual (especially chapter 14 -
Estimating the numbers of wildlife populations. pp 221-246).
There are numerous ways of analyzing data from a MRR program. The level of confidenceplaced in any estimator is largely dependent upon sample size, sample effort and how wellthe assumptions of the analysis methods are met in the field. Some common methods ofanalyses found in the literature are summarized below to provide some backgroundinformation. Many sophisticated and robust methods of analyzing MRR data are available aspart of the programs CAPTURE, JOLLY and MARK; all of these are discussed in SpeciesInventory Fundamentals.
Minimum-Number-Alive Estimator (MNA)
One of the easiest ways of estimating the abundance of a population from a mark-release-recapture (MRR) program is called the minimum number alive method (MNA). MNA (alsocalled the calendar count or enumeration) is an estimate based on the sum of all individualsknown to be alive during a particular capture (trapping) session. An individual is known to bealive during a given capture session if it was captured during that session, or if it wascaptured before and after that capture session. For example, if an individual is capturedduring capture session #1 and #3, it can be accurately stated that it was missed (but alive)during session #2.
Although the MNA method is simple to use, this estimator has been criticized as beingnegatively biased in most situations. For this reason, in a summary, Ritchie and Sullivan(1989) suggest that the MNA estimate should only be used when the trappability of animals is>70%. Several articles have been written on the use of the MNA estimator (Hilborn et al.1976; Jolly and Dickson 1983; Nichols and Pollock 1983; Boonstra 1985; Efford 1992;Hilborn and Krebs 1992). Most of these papers recommend the use of the Jolly-Seberestimator over MNA if trappability is low or unknown.
This approach which is also referred to as “saturation trapping” or “enumeration” is generallynot the best means of achieving a statistically valid estimate, and is not recommended. Thereasons for this are:
• In many cases, a large amount of effort is needed to fully trap a population. In contrast, avalid estimate of population can be gained with less effort by using a ratio estimator, or aclosed CAPTURE mark-recapture estimator.
• The assumption that an entire population is trapped or marked cannot be validated andtherefore population estimates can be negatively biased (Pollock et al. 1990).
• To get an unbiased estimate of density, a population should be geographically closed. Tominimize violation of this assumption, sampling should occur in a relatively smallamount of time. Saturation trapping usually takes long periods of time, and thereforeclosure assumptions will be violated unless the researcher is working on an entirelyclosed system, such as an island.

Biodiversity Inventory Methods - Moles and Pocket Gopher
April 10, 2001 51
Estimation by Asymptotic Capture
Population abundance can be estimated by intensively trapping and marking a populationuntil no new (unmarked) individuals are captured. This method is essentially a modified (i.e.,non-lethal) version of kill trapping where animals are removed until no animals remain. It isgenerally not recommended as it is subject to criticisms similar to those described above.
Ratio estimators
The Lincoln, Petersen, and Schnabel estimators are based on the ratio of marked to unmarkedindividuals within a population. These estimators assume that the population is “closed” toimmigration and emigration. The formulas are based on the assumption that the populationsize is related to the number of marked and released animals in the same way that the totalcaught at a subsequent time is related to the number recaptured (Davis and Winstead 1980).White et al. (1982) offer excellent discussion of closed models which many can be calculatedusing the program CAPTURE.
The Petersen (or Lincoln-Petersen) estimate is the most basic MRR method. It is based ontwo sample periods only (i.e., one period of marking animals, followed by a single period ofrecapture). It is described using the following formulas:
NM
CR
= (1)
therefore: NCM
R= (2)
where:
N = Population Estimate
M = Number of marked and released animals
C = Total number of animals captured
R = Number of marked animals that were recaptured
Lincoln-Peterson estimates are easy to calculate, and the estimator has been shown to berobust to time variation in capture probabilities. However, there are important assumptionsassociated with this estimator such as equal probabilities of capture between animals,population closure, and no net loss of animal marks between samples. If relative abundance isthe objective then violations of assumptions may not be as significant provided that thedegree to which assumptions are violated is similar between studies and over time, andtherefore the estimator will show a consistent, comparable bias. If absolute abundance is theobjective of methods, and animals can be marked individually then the use of the estimatorsin program CAPTURE is recommended.
Numerous variations on the Petersen Estimate have been developed. The Petersen Estimate isbiased in that it tends to overestimate the actual population, especially if the sample is small.In response to this bias, Seber (1982) offers a variation on Petersen’s formula that is lessbiased, and nearly unbiased if there are at least seven recaptures of marked animals. Anothervariation, the Schnabel estimate was developed to allow investigators to analyze data frommultiple (>2) marking sessions.

Biodiversity Inventory Methods - Moles and Pocket Gopher
52 April 10, 2001
The Jolly-Seber Estimator
Like the Lincoln, Petersen, and Schnabel estimators (above), the Jolly-Seber estimator is alsobased on the ratio of marked to unmarked individuals within a population. However, theJolly-Seber estimate differs from others in that it recognizes, and attempts to incorporate, thefact that biological populations are generally not “closed”. This “open” model will notprovide a true estimate of density, but rather of abundance, as the population is not defined interms of area. This estimator requires that at least three sampling periods be carried out inorder to calculate certain variables. Pollock et al. provide good discussion of Jolly-Sebermodels, and the program JOLLY is very useful for simulating MRR or analyzing data.
The formula for the Jolly-Seber estimate of population size is given below.
NM
tt
t= α (3)
where:Nt = Population estimate just before sample tt = Sample period (1,2,3,4,5,......t th sample)αt = proportion of animals marked
αtmn
t
t=
++
11 (4)
mt = Number of marked animals that were recaptured during sample tnt = Total number of animals captured during sample tMt = Estimated number of marked animals just before sample t
( )M
s ZR
mtt t
tt=
++
+1
1 (5)st = Number of animals releasedst = (nt - accidental deaths)Rt = Number of animals released during sample t, or st that were recaptured during a
later sampling periodZt = Number of animals that were not captured during sample t, but were captured
before and after sample t
The Jolly Seber model is also susceptible to biases if unequal capture probabilities areexhibited in the trapped population; however, the survival rate estimate of the Jolly Seber isrobust to most forms of capture probability variation, and is therefore a useful alternative formonitoring populations. In addition, there are many modifications to the Jolly-Seber toaccommodate age-specific capture probabilities and survival rates (program JOLLYJOLLYAGE and POPAN). If the robust design is used then program RDSURVIV can beused to estimate temporary emigration, and allow more precise survival estimates. Also, theJolly Seber approach to survival modeling has been modified to allow the testing ofbiological hypothesis using various model fitting procedures as documented in programsSURGE, and MARK. However, many of the programs mentioned (with the exception ofJOLLY and JOLLYAGE) require advanced statistical knowledge, and project biologists areurged to seek the advice of a qualified biometrician. A summary of useful software isavailable in Species Inventory Fundamentals, No. 1, Appendix G.

Biodiversity Inventory Methods - Moles and Pocket Gopher
April 10, 2001 53
3.5.2 Removal TrappingAlthough this sampling method is viable, kill trapping is not a recommended method forstudying red-listed species such as Townsend's Mole or the Northern Pocket Gopher. It isalso generally not recommended due to the possible by-catch of other species at risk. Thefollowing review is provided for interested readers.
Trap-outs have been used successfully to determine the absolute abundance of pocketgophers (Ingles et al. 1949; Howard and Childs 1959; Richens 1965; Reid 1973). The basis ofthe trap-out method is to capture all of the animals in a given unit to determine the size of anactive pocket gopher population. The advantages of this technique include count accuracyand rodent availability for immediate examination (Reid 1973; Teipner et al. 1983).
It is possible to conduct a mole or pocket gopher census by trapping out and counting all ofthe individuals within a certain delineated region. Pedersen (1963) used this technique andtrapped out two pastures (6.07 ha and 8.1 ha) in Oregon to calculate the population density ofTownsend’s Mole which he calculated to be 4.8 and 11.8 moles per hectare. Schaefer (1978)kill-trapped 23 Coast Moles from a field in Aldergrove with the English scissor trap andcalculated their density to be 6.36 moles per hectare. Glendenning (1959) calculated a densityof 2.4 Coast Moles per ha after trapping out 157 moles from a 65 ha field in Agassiz.
This approach assumes that all of the moles are trapped to the same degree and that all of theanimals within the delineated area were indeed trapped. However, unless this method iscarried out for a sufficient period of time there is no validity to these assumptions. Trappingeffectiveness varies between animals of the same species. For example, male European molesare more frequently captured than females, especially during the breeding season (Stone1989). Similarly, Pedersen (1963) trapped 300 Townsend’s Moles over two years and foundthat males were captured more regularly than females, by a 2 to 1 ratio
It is important to consider the social organization of a particular mole species whenestimating population density from trapping since the number of captures expected at eachsite will vary if the species is solitary or social, territorial or not (Stone 1989). Giger (1973)found the Townsend’s Mole to be solitary and no overlapping movements of adults inestablished burrows were discovered except during the mating season. However, Dalquestand Orcutt's (1942) trapping results indicate that the Shrew-mole is possibly gregarious as 11animals were found in a set of traps positioned along a 50 foot log, at one check. During thecourse of a mole census it is difficult to ensure that no moles leave the study site or enterfrom adjacent areas.
Operator control, the way the traps are handled and set, varies between researchers and isanother variable that can interfere with population measurements (Stone 1989). Someresearchers feel that seasoned traps are more effective than new traps (Stone 1989) whileothers found no difference in capture rates (Sheehan, pers. comm. 2001).

Biodiversity Inventory Methods - Moles and Pocket Gopher
54 April 10, 2001
GLOSSARYABSOLUTE ABUNDANCE: The total number of organisms in an area. Usually reported asabsolute density: the number of organisms per unit area or volume.
ACCURACY: A measure of how close a measurement is to the true value.
BIODIVERSITY: Jargon for biological diversity: “the variety of life forms, the ecologicalroles they perform, and the genetic diversity they contain” (Wilcox, B.A. 1984 cited inMurphy, D.D. 1988. Challenges to biological diversity in urban areas. Pages 71 - 76 inWilson, E.O. and F.M. Peter, Eds. 1988. Biodiversity. National Academy Press, Washington,DC. 519 pp.).
BLUE LIST: Taxa listed as BLUE are sensitive or vulnerable; indigenous (native) speciesthat are not immediately threatened but are particularly at risk for reasons including low ordeclining numbers, a restricted distribution, or occurrence at the fringe of their global range.Population viability is a concern as shown by significant current or predicted downwardtrends in abundance or habitat suitability.
CBCB (Components of B.C.’s Biodiversity) Manuals: Wildlife species inventory manualsthat have been/are under development for approximately 36 different taxonomic groups inBritish Columbia; in addition, six supporting manuals.
CONDYLOBASAL LENGTH: The length of the skull, measured from the front of thepremaxillary bones to the rear surface of the occipital condyles.
DESIGN COMPONENTS: Georeferenced units which are used as the basis for sampling,and may include geometric units, such as transects, quadrats or points, as well as ecologicalunits, such as caves or colonies.
EWG (Elements Working Group): A group of individuals that are part of the TerrestrialEcosystems Task Force (one of 7 under the auspices of RIC) which is specifically concernedwith inventory of the province’s wildlife species. The EWG is mandated to provide standardinventory methods to deliver reliable, comparable data on the living “elements” of BC’secosystems. To meet this objective, the EWG is developing the CBCB series, a suite ofmanuals containing standard methods for wildlife inventory that will lead to the collection ofcomparable, defensible, and useful inventory and monitoring data for the species populations.
INVENTORY: The process of gathering field data on wildlife distribution, numbers and/orcomposition. This includes traditional wildlife range determination and habitat associationinventories. It also encompasses population monitoring, which is the process of detecting ademographic (e.g. growth rate, recruitment and mortality rates) or distribution changes in apopulation from repeated inventories and relating these changes to either natural processes(e.g. winter severity, predation) or human-related activities (e.g. animal harvesting, mining,forestry, hydro-development, urban development, etc.). Population monitoring may includethe development and use of population models that integrate existing demographicinformation (including harvest) on a species. Within the species manuals, inventory alsoincludes, species statusing, which is the process of compiling general (overview) informationon the historical and current abundance and distribution of a species, its habitat requirements,rate of population change, and limiting factors. Species statusing enables prioritization ofanimal inventories and population monitoring. All of these activities are included under theterm inventory.

Biodiversity Inventory Methods - Moles and Pocket Gopher
April 10, 2001 55
MONITOR: To follow a population (usually numbers of individuals) through time.
OBSERVATION: The detection of a species or sign of a species during an inventory survey.Observations are collected on visits to a design component on a specific date at a specifictime. Each observation must be georeferenced, either in itself or simply by association with aspecific, georeferenced design component. Each observation will also include numeroustypes of information, such as species, sex, age class, activity, and morphometric information.
POPULATION: A group of organisms of the same species occupying a particular space at aparticular time.
PRECISION: A measurement of how close repeated measures are to one another.
PRESENCE/NOT DETECTED (POSSIBLE): A survey intensity that verifies that aspecies is present in an area or states that it was not detected (thus not likely to be in the area,but still a possibility).
PROJECT: A species inventory project is the inventory of one or more species over one ormore years. It has a georeferenced boundary location, to which other data, such as a projectteam, funding source, and start/end date are linked. Each project may also be composed of anumber of surveys.
PROJECT AREA: An area, usually politically or economically determined, for which aninventory project is initiated. A project boundary may be shared by multiple types of resourceand/or species inventories. Sampling for species generally takes place within smaller,representative study areas so that results can be extrapolated to the entire project area.
RANDOM SAMPLE: A sample that has been selected by a random process, generally byreference to a table of random numbers.
RED LIST: Taxa listed as RED are candidates for designation as Endangered or Threatened.Endangered species are any indigenous (native) species threatened with imminent extinctionor extirpation throughout all or a significant portion of their range in British Columbia.Threatened species are any indigenous taxa that are likely to become endangered in BritishColumbia, if factors affecting their vulnerability are not reversed.
RELATIVE ABUNDANCE: The number of organisms at one location or time relative tothe number of organisms at another location or time. Generally reported as an index ofabundance.
RIC (Resources Inventory Committee): RIC was established in 1991, with the primary taskof establishing data collection standards for effective land management. This processinvolves evaluating data collection methods at different levels of detail and makingrecommendations for standardized protocols based on cost-effectiveness, co-operative datacollection, broad application of results and long term relevance. RIC is comprised of seventask forces: Terrestrial, Aquatic, Coastal/Marine, Land Use, Atmospheric, Earth Sciences,and Cultural. Each task force consists of representatives from various ministries and agenciesof the Federal and BC governments and First Nations. The objective of RIC is to develop acommon set of standards and procedures for the provincial resources inventories. [Seehttp://www.for.gov.bc.ca/ric/ ]
SPI: Abbreviation for ‘Species Inventory’; generally used in reference to the SpeciesInventory Datasystem and its components.

Biodiversity Inventory Methods - Moles and Pocket Gopher
56 April 10, 2001
STRATIFICATION: The separation of a sample population into non-overlapping groupsbased on a habitat or population characteristic that can be divided into multiple levels. Groupsare homogeneous within, but distinct from, other strata.
STUDY AREA: A discrete area within a project boundary in which sampling actually takesplace. Study areas should be delineated to logically group samples together, generally basedon habitat or population stratification and/or logistical concerns.
SURVEY: The application of one RIC method to one taxonomic group for one season.
SYSTEMATIC SAMPLE: A sample obtained by randomly selecting a point to start, andthen repeating sampling at a set distance or time thereafter.
TERRESTRIAL ECOSYSTEMS TASK FORCE: One of the 7 tasks forces under theauspices of the Resources Inventory Committee (RIC). Their goal is to develop a set ofstandards for inventory for the entire range of terrestrial species and ecosystems in BritishColumbia.
YELLOW-LIST: Includes any native species, which is not red- or blue-listed.

Biodiversity Inventory Methods - Moles and Pocket Gopher
April 10, 2001 57
REFERENCESAllen, K.L., D. Flath and T. Weaver. 1997. Small mammal capture efficiencies among three
trap types. Intermt. J. Sci. 3:1-6.
Anderson, G.G., and H.A. Kluge. 1986. Rodent control on agricultural land in BritishColumbia. BC Min. Agric. and Food. 15 pp.
Anonymous. 1984. Control of pocket gophers and ground squirrels. Print Media Branch.Alberta Agriculture, 7000 - 113 St., Edmonton, AB. 4 pp.
Anthony, R.G., E.D. Forsman, G.A. Green, G. Witmer and S.K. Nelson. 1987. Smallmammal populations in riparian zones of different-aged coniferous forest. The Murrelet68:94-102.
Barnes, V.G., P. Martin and H.P. Tietjen. 1970. Pocket gopher control on Oregon ponderosapine plantations. J. For. 68:433-435.
Begon, M. 1979. Investigating animal abundance. Edward Arnald Publishers Limited.London. 97 pp.
Birch, L.E. 1978. Guidelines for effective contract control of the Rocky Mountain pocketgopher. St. Anthony, ID. U.S. Dep. Agric., For. Serv., Targhee National Forest, AshtonRanger District 46 pp.
Blair, W.F. 1940. Study of mammal populations. J. Mammal. 22:148-157.
Bonar, R.E. 1995. The northern pocket gopher – most of what you thought you might want toknow, but hesitated to look up. U.S. Dep. Agric., For. Serv. 62 pp.
Campbell, K.L. 2000. Thermal biology and metabolism of the American shrew-mole,Neurotrichus Gibbsii. J. Mammal. 81:578-585.
Campbell, R.W. 1983. Feeding ecology of the common Barn Owl in North America. M.Sc.Thesis. Univ. Wash., College of Forest Resources. 87 pp.
Carraway, L.N. and B.J. Verts. 1991. Neurotrichus gibbsii. Mammalian Species, 387, 1-7.
Carraway, L.N., L.N. Alexander and B.J. Verts. 1993. Scapanus townsendii, MammalianSpecies 434:1-7.
Case, R.M. 1983. Pocket Gophers. Pages B13-B26 in: Prevention and control of wildlifedamage. R.M. Timm (ed.). Great Plains Agric. Council, Wildl. Res. Comm. and NebraskaCoop. Ext. Serv., Instit. Agric. and Nat. Res. Univ. Nebraska, Lincoln.
Chao, A. 1988. Estimating animal abundance with capture frequency data. J. Wildl. Manage.52(2):295-300.

Biodiversity Inventory Methods - Moles and Pocket Gopher
58 April 10, 2001
Chase, J.D., W.E. Howard and J.T. Roseberry. 1982. Pocket gophers: Geomyidae. Pages 239-255 in: Wild Mammals of North America: Biology, Management, and Economics. J.A.Chapman and G.A. Feldhamer, (eds.) WR 199.
Conniff, R. 1994. The mole has a way of undermining out assumptions. Smithsonian24(12):52-63.
Cormack, R.M. 1972. The logic of capture-recapture estimates. Biometrics 28:337-343.
Corn, P.S., R.B. Bury and T.A. Spies. 1988. Douglas-fir forests in the Cascade mountains ofOregon and Washington: Is the abundance of small mammals related to stand age andmoisture? Pages 340-358 in R.C. Szaro, K.E. Severson and D.R. Patton, eds. Proceedingsof the symposium Management of Amphibians, Reptiles, and Small Mammals in NorthAmerica, July 19-21, 1988, Flagstaff, AZ. U.S. Dep. Agric. For. Serv., Gen. Tech. Rep.RM 166.
Cowan, I. McT. 1942. Food habits of the barn owl in British Columbia. The Murrelet 23:48-53.
Cowan, I. McT., and C.J. Guiguet. 1973. The mammals of British Columbia. BC Prov. Mus.5th ed. Handb. 11:1-414.
Dalquest, W.W. 1948. Mammals of Washington. Univ. Kans. Mus. Nat. Hist. Publ. 2:1-144.
Dalquest, W.W., and D.R. Orcutt. 1942. The biology of the least shrew-mole, Neurotrichusgibbsii minor. Am. Midland Naturalist 27:387-401.
Davis, D.E. 1982. CRC handbook of census methods for terrestrial vertebrates. CRC Press,Inc., Boca Raton, FL. 397 pp.
Doyle, A.T. 1990. Use of riparian and upland habitats by small mammals. J. Mammal. 71:14-23.
Driscoll, R.S., and T.C. Watson. 1974. Aerial photography for pocket gopher populations.Pages 481–492 in Proceedings on remote sensing and photo interpretation; 1974 October;Banff, AB. Ottawa, ON: Canadian Institute of surveying.
Eadie, W.R., and W.J. Hamilton, Jr. 1956. Notes on reproduction in the star-nosed mole. J.Mammal. 37:223-231.
Eberhardt, L.L. 1969. Population estimates from recapture frequencies. J. Wildl. Manage.33:28-39.
Forsman, E., and C. Maser. 1970. Saw-whet owl preys on red tree mice. The Murrelet 51:10.
Forsyth, A. 1985. Mammals of the Canadian wild. Camden House. 351 pp.

Biodiversity Inventory Methods - Moles and Pocket Gopher
April 10, 2001 59
Fraker, M.A., B.A. Sinclair, D. Joly and M.V. Ketcheson. 1997. Distribution and habitatassociations of Northern Pocket Gophers (Thomomys talpoides) in the eastern CrestonValley, BC. Unpubl. Rep. by TerraMar Environmental Research Ltd., Sidney, BC forColumbia Basin Fish and Wildlife Compensation Program, Nelson, BC. 27 pp. +Appendices.
Gashwiler, J.S. 1959. Small mammal study in west-central Oregon. J. Mammal. 40:128-139.
Gerber, H.S. 1995. Mole Control in British Columbia. Factsheet: Min. Agric., Fisheries, andFood, Jan. 1995.
Giger, R.D. 1965. Surface activity of moles as indicated by remains in barn owl pellets. TheMurrelet 46:32-36.
Giger, R.D. 1973. Movements and homing in Townsend's mole near Tillamook, Oregon. J.Mammal. 54:648-659.
Glendenning, R. 1959. Biology and control of the coast mole, Scapanus orarius True, inBritish Columbia. Can. J. Animal Sci. 39:34-44.
Glendenning, R., and H.R. MacCarthy. 1965. Mole Control in British Columbia. EntomologyCircular No. 21, Dep. Agric., Victoria, BC. 3 pp.
Godfrey, M.E.R. 1987. A novel strategy for pocket gopher control. U.S. Dep. Agric. For.Serv., Gen. Tech. Rep. RM-154. 5 pp.
Gorman, M.L., and D.R. Stone. 1990. The natural history of moles. Ithaca, NY. ComstockPublishing Associates. 138 pp.
Haeck, J. 1969. Colonization of the mole (Talpa europaea, L) in the Ijsselmeerpolders. Neth.J. Zool. 19:145-148.
Hall, E.R., and K.R. Kelson. 1981. The mammals of North America. J. Wiley and Sons, NewYork, NY. 1:1-600.
Hansen, R.M., and E.E. Remmenga. 1961. Nearest neighbor concept applied to pocketgopher populations. Ecology 42:812–814.
Hart, E.B. 1973. A simple and effective live trap for pocket gophers. Am. Midland Naturalist89:200-202.
Hartman, G.D., and T.L. Yates. 1985. Scapanus orarius, Mammalian Species 253:1-5, Am.Soc. Mammalogists.
Hawthorne, D.W. 1980. Wildlife Damage and Control Techniques. Wildlife managementtechniques manual, 4th ed. Edited by S.D. Schemnitz. Washington, DC: The WildlifeSociety. 686 pp.
Hooven, E.F., and H.C. Black. 1976. Effects of some clearcutting practices on small mammalpopulations in western Oregon. Northwest Scientist 50:189-208.
Howard, W.E. 1952. A live trap for pocket gophers. J. Mammal. 33:61-65.

Biodiversity Inventory Methods - Moles and Pocket Gopher
60 April 10, 2001
Howard, W.E., and H.E. Childs. 1959. Ecology of pocket gophers with emphasis onThomomys bottae mewa . Hilgardia 29:277–358.
Hungerford, K.E. 1976. Food preferences and food location by pocket gophers in Idaho.Pages 131–138 in Proceedings, 7th vertebrate pest conference, Monterey, CA. Sacramento,CA: Dep. Food and Agric., Control and Eradication, Vertebrate Pest Conference.
Ingles, L.G. 1950. An improved live trap for pocket gophers. The Murrelet 30:55-56.
Ingles, L.G., R. Clothier and L.A. Crawford. 1949. Methods of estimating pocket gopherpopulations. J. Wildl. Manage. 13:311–312.
Jensen, I.M. 1982. A new live trap for moles. J. Wildl. Manage. 46:249-252.
Keith, J.O., R.M. Hansen and A.L. Ward. 1958. Changes in abundance and food habits ofpocket gophers following treatment of range with 2-4-D. J. Wildl. Manage. 23:137-145.
Kenneth, R.W., and D.R. Anderson. 1985. Evaluation of two density estimators of smallmammal population size. J. Mammal. 66:13-21.
Krebs, C.J. 1989. Ecological methodology. Harper Collins Publishers. New York. 654 pp.
Krebs, C.J., and R. Boonstra. 1984. Trappability estimates for mark-recapture data. Can. J.Zool. 62:2440-2444.
Kremsater, L., and L. Andrusiak. 1991. Status report for the Townsend's mole (Scapanustownsendii). Unpubl. Rep. BC Environ., Wildl. Br., Victoria, BC.
Kremsater, L., L. Andrusiak. and F. Bunnell. 1993. Status of the Shrew-mole in BritishColumbia. BC Environ., Wildl. Br., Victoria, BC, Wildl. Work. Rep. No. WR-55. 22 pp.
Kreps, E. 1909. Science of trapping. Columbus, OH: A.R. Harding Pub. Co. 229 pp.
Kuhn, L.W., and W.D. Edge. 1990. Controlling moles. Oreg. State Univ., Ext. Serv., EC987:1-4.
Kuhn, L.W., W.Q. Wick and R.J. Pedersen. 1966. Breeding nests of Townsend's mole inOregon. J. Mammal. 47:239-249.
Maser, C., and E.D. Brodie, Jr. 1966. A study of owl pellet contents from Linn, Benton, andPolk counties, Oregon. The Murrelet 47:9-14.
Maser, C., J.F. Mate, J.F. Franklin and C.T. Dyrness. 1981. Natural history of Oregon coastmammals. U.S. Dep. Agric., For. Serv., Gen. Tech. Rep. PNW-133:1-496.
Miller, M.A. 1953. Experimental studies on poisoning pocket gophers. Hilgardia 22:131–166.
Miller, M.A., and W.E. Howard. 1951. Size of bait for pocket gopher control. J. Wildl.Manage. 15:62–68.

Biodiversity Inventory Methods - Moles and Pocket Gopher
April 10, 2001 61
Ministry of Environment, Lands and Parks, and Ministry of Forests. 1998. Field manual fordescribing terrestrial ecosystems in the field. Land Manage. Handb. 25. Vicotira, BC.
Moore, A.W. 1933. Food habits of Townsend and coast moles. J. Mammal. 14:36-40.
Moore, A.W. 1939. Notes on the Townsend mole. J. Mammal. 20:499-501.
Moore, A.W. 1940. A live mole trap. J. Mammal. 21:223-225.
Nagorsen, D. 1990. The mammals of British Columbia. A taxonomic catalogue. Roy. BCMus. Memoir No.4, Victoria, BC 140 pp.
Nagorsen, D.W. 1996. Royal British Columbia Museum Handbook: Opossums, shrews, andmoles of British Columbia. UBC Press, 169 pp.
National Research Council. 1991. Companion Guide to Infectious Diseases of Mice and Rats.National Academy Press, Washington, DC. 95 pp.
Nichols, J.D., J.E. Hines and K.H. Pollock. 1984. Effects of permanent trap response incapture probability on Jolly-Seber capture-recapture model estimates. J. Wildl. Manage.48:289-294.
Nietfeld, M.T., and L.D. Roy. 1993. Alberta pocket gopher survey. Alberta EnvironmentCentre, Wildl. Ecol. Br. 17 pp.
Nowak, R.W., and Paradiso, J.L. 1983. Walker's mammals of the world. 4th ed. The JohnHopkins Univ. Press, Baltimore, MD. 1:1-568.
O'Farrell, M.J., D.W. Kaufman and D.W. Lundahl. 1977. Use of live trapping with theassessment line method for density estimation. J. Mammal. 58:575-582.
Pedersen, R.J. 1963. The life history and ecology of Townsend's mole Scapanus townsendii(Bachman) in Tillamook County, Oregon. M.S. Thesis, Oreg. State Univ. Corvallis, 60 pp.
Pedersen, R.J. 1966. Nesting behaviour of Townsend's mole. The Murrelet 47:47-48.
Pollock, K.H. 1982. A capture-recapture design robust to unequal probability of capture. J.Wildl. Manage. 46:752-757.
Racey, K. 1929. Observations on Neurotrichus gibbsii gibbsii. The Murrelet 10(3):61-62.
Reed, C.A. 1944. Behavior of a shrew-mole in captivity. J. Mammal. 25:196-198.
Reid, V.H. 1973. Population biology of the northern pocket gopher. In G.T. Turner et al., eds.Pocket gophers and Colorado mountain rangeland. Bull. 554S. Fort Collins, CO: Colo.State Univ., Agric. Exp. Sta. 90 pp.
Reid, V.H. 1981. Population dynamics of northern pocket gophers on rangelands on westernColorado. Fort Collins, CO: US. Bureau of Sport Fisheries and Wildlife 36 pp.
Reid, V.H., R.M. Hansen and A.L. Ward. 1966. Counting mounds and earth plugs to censusmountain pocket gophers. J. Wildl. Manage. 39:327–334.

Biodiversity Inventory Methods - Moles and Pocket Gopher
62 April 10, 2001
Resources Inventory Committee. 1998. Species inventory fundamentals. Standards forcomponents of British Columbia’s biodiversity. No. 1. Version 2.0. Resour. Inventory Br.,Victoria, BC.
Resources Inventory Committee. 1999a. Inventory methods for Plethodontid Salamanders.Standards for components of British Columbia’s biodiversity. No. 36. Version 2.0.Resour. Inventory Br., Victoria, BC.
Resources Inventory Committee. 1999b. Voucher specimen collection, preparation,identification and storage protocol: animals. Standards for components of BritishColumbia’s biodiversity. No. 4a. Version 2.0. Resour. Inventory Br., Victoria, BC.
Rexstad, E., and K. Burnham. 1991. Users’ guide for interactive program CAPTURE.Colorado Cooperative Fish and Wildlife Res. Unit, Fort Collins, CO.
Reynolds, R.T. 1970. Nest observations of the long-eared owl (Asio otus) in Benton county,Oregon. With notes on their food habits. The Murrelet 51:8-9.
Richens. V.B. 1965. An evaluation of control on the Wasatch pocket gopher. J. Wildl.Manage. 29:413–425.
Richens, V.B. 1966. Notes on the digging activity of a northern pocket goper. J. Mammal. 47:531-533.
Richens, V.B. 1968. The status and use of gophacide. Pages 118–125 in Proceedings, 3rd
vertebrate pest conference, San Francisco, CA. Davis, CA: Univ. Calif., Dep. Agric.Zoology, vertebrate pest conference.
Roest, A.I. 1952. Red-tailed hawk a mole predator. J. Mammal. 33:110.
Sargeant, A.B. 1966. A live trap for pocket gophers. J. Mammal. 47:729-731.
Schaefer, V.H. 1978. Aspects of habitat selection in the coast mole (Scapanus orarius) inBritish Columbia. Unpubl. Ph.D. Thesis, Simon Fraser Univ., Burnaby, BC 205 pp.
Scheffer, T.H. 1934. Hints on live trapping. J. Mammal. 15:197-202.
Schemnitz, S.D. 1980. Wildlife management techniques manual. Wildlife Society,Washington, DC. 686 pp.
Scrivner, J.H. and H.D. Smith. 1981. Pocket gophers (Thomomys talpoides) in successionalstages of spruce-fig forest in Idaho. Great Basin Nat. 41: 362-367.
Seber, G.A.F. 1973. The estimation of animal abundance and related paramaters. Griffin,London. 506 pp.
Seip, D., and J.P. Savard. 1992. Wildlife diversity in old-growth forests and managed stands.BC Ministr. For., Vancouver Forest District. Unpubl. draft Rep.
Sheehan, S.T., and C. Galindo-Leal. 1995. Distribution and live-trapping methods ofTownsend’s Mole Scapanus townsendii in the Fraser Valley, British Columbia. Unpubl.Rep. BC Environment, Wildl. Br., Victoria, BC.

Biodiversity Inventory Methods - Moles and Pocket Gopher
April 10, 2001 63
Sheehan, S.T., and C. Galindo-Leal. 1996a . Status Report on Townsend’s Mole, Scapanustownsendii, in Canada. Committee on the Status of Endangered Wildlife in Canada(COSEWIC). 45 pp.
Sheehan, S.T., and C. Galindo-Leal. 1996b. Townsend’s Mole, Scapanus townsendii, in theLower Fraser Valley: distribution, habitat, densities and habitat management. Unpubl.Rep. BC Environment, Wildl. Br., Victoria, BC.
Sheehan, S.T., and C. Galindo-Leal. 1997. Identifying Coast Moles, Scapanus orarius, andTownsend’s Moles, Scapanus townsendii, from tunnel and mound size. Can. FieldNaturalist Notes: 463-65.
Sheehan, S.T. 1999. Townsend’s Mole. Wildlife in British Columbia at Risk Series. Min.Environment, Land and Parks, Wildl. Br., Victoria, BC.
Silver, J. 1933. Mole control. U.S. Dep. Agric., Farmer's Bull. 1716:1-17.
Stone, R. David. 1989. Moles as pests, mammals as pests. R.J. Putman, ed. New York:Chapman and Hall, 271 pp.
Taylor, C.A., C.J. Ralph and A.T. Doyle. 1988. Differences in the ability of vegetationmodels to predict small mammal abundance in different-aged Douglas-fir forests. Pages368-374 in R.C. Szaro, K.E. Severson and D.R. Patton, eds. Proceedings of thesymposium, Management of amphibians, reptiles, and small mammals in North America.July 19-21, 1988, Flagstaff, AZ. U.S. Dep. Agric. For. Serv., Gen. Tech. Rep. RM 166.
Teipner, C.L., E.O. Garton and L. Nelson, Jr. 1983. Pocket gophers in forest ecosystems. U.S.Dep. Agric., Gen. Tech. Rep. INT-154 53 pp.
Terry, C.J. 1981. Habitat differentiation among three species of Sorex and Neurotrichusgibbsii in Washington. Am. Midland Naturalist 106:119-125.
Toweill, D.E., and R.G. Anthony. 1988. Coyote foods in a coniferous forest in Oregon.J.Wildl. Manage. 52:507-512.
van Zyll de Jong, C.G. 1983. Handbook of Canadian Mammals. 1. Marsupials andInsectivores. Nat. Mus. Can. Ottawa, ON. 210 pp.
Ward, A.L. 1960. Mountain pocket gopher food habits in Colorado. J. Wildl. Manage. 24:89-92.
West, S.D. 1985. Differential capture between old and new models of the museum specialsnap trap. J. Mammal. 66:798-800.
Whitaker, J.O., C. Maser and R.J. Pedersen. 1979. Food and ectoparasitic mites of Oregonmoles. Northwest Science 53:268-273.
White, G.C., D.R. Anderson, K.P. Burnham and D.L. Otis. 1982. Capture-recapture andremoval methods for sampling closed populations. Los Alamos National Laboratory LA-8787-NERP, Los Alamos, NM. 235 pp.

Biodiversity Inventory Methods - Moles and Pocket Gopher
64 April 10, 2001
Wight, H.M. 1928. Food habits of the Townsend's mole, Scapanus townsendii (Bachman). J.Mammal. 9:19-32.
Williams, D.F., and Braun, S.E. 1983. Comparison of pitfall and conventional traps forsampling small mammal populations. J.Wildl. Manage. 47:841-845.
Wilson, K.R., and D.R. Anderson. 1985. Evaluation of a nested grid approach for estimatingdensity. J. Wildl. Manage. 49:675-678.
Zuleta, G.A., and C. Galindo-Leal. 1994. Distribution and abundance of four species of smallmammals at risk in a fragmented landscape. BC Environ., Wildl. Br., Victoria, BC Wildl.Work. Rep. No. WR-64. 34 pp.