Inventory Brochure - Global Research Alliance
12
About this booklet Livestock development and climate change outcomes can support each other. More productive and efficient farm systems generally produce food at much lower greenhouse gas (GHG) emissions per unit of product. However, many countries use simple (Tier 1) methods for estimating livestock emissions in their GHG inventories. Tier 1 methods are unable to capture the reductions in emissions intensity that result from improvements to livestock farming. This booklet shows how advanced (Tier 2) inventory methods can support climate change and productivity goals and help broaden countries’ policy options. Inside, you will find information on: Why are livestock GHG inventories important? The benefits of advanced GHG inventories for livestock development The difference between Tier 1 and Tier 2 methods How to set up an advanced inventory An example of a Tier 2 approach for beef production A case study of Uruguay’s Tier 2 inventory Where to find more information Livestock development and climate change: The benefits of advanced greenhouse gas inventories
Transcript of Inventory Brochure - Global Research Alliance
About this bookletLivestock development and climate change outcomes can support each other. More productive and efficient farm systems generally produce food at much lower greenhouse gas (GHG) emissions per unit of product.
However, many countries use simple (Tier 1) methods for estimating livestock emissions in their GHG inventories. Tier 1 methods are unable to capture the reductions in emissions intensity that result from improvements to livestock farming.
This booklet shows how advanced (Tier 2) inventory methods can support climate change and productivity goals and help broaden countries’ policy options.
Inside, you will find information on:
Why are livestock GHG inventories important?
The benefits of advanced GHG inventories for livestock development
The difference between Tier 1 and Tier 2 methods
How to set up an advanced inventory
An example of a Tier 2 approach for beef production
A case study of Uruguay’s Tier 2 inventory
Where to find more information
Livestock development and climate change:The benefits of advanced greenhouse gas inventories

National GHG inventories play a key role in monitoring and reporting emissions under the United Nations
Framework Convention on Climate Change (UNFCCC). They are compiled in line with a country’s capacity and in accordance with UNFCCC requirements. They are based on methodologies and good practice guidelines developed by the Intergovernmental Panel on Climate Change (IPCC).
Inventory methods will be critical in implementing the landmark climate change agreement concluded in December 2015. The Paris Agreement puts in place a new framework designed to promote greater transparency of country reporting. Inventories will underpin countries’ ‘Intended Nationally Determined Contributions’ (INDCs) and inform global progress towards the goal to limit warming to below 2 degrees. Inventories will be required on an at least biennial basis.
GHG inventories can also help increase access to climate finance because they demonstrate a country’s broader commitment to climate change. They show the effective-ness of Nationally Appropriate Mitigation Actions (NAMAs) and low-carbon development strategies, as well as other national and sub-national approaches. They can also be used to respond to trade and consumer concerns for more climate-friendly products.
However, systems for measuring and monitoring changes in livestock GHG emissions are under-developed in many countries. This is despite the growing importance of inventories and the increase in countries’ ambitions to undertake mitigation action in the agriculture sector. More accurate and robust information on livestock GHG emissions and productivity, captured through an advanced inventory system, will be essential if the sector is to con-tribute effectively to climate and development outcomes.
For some countries, achieving a basic Tier 1 inventory is the immediate priority. However, for others, developing Tier 2 methods for their inventory may offer far greater returns than investing in improvements to the existing Tier 1 inventory.
“Climate change is an environmental issue, but also, and more importantly, a development issue.”
China’s Second National Communication, November 2012
Are you working on any of these?• Tracking trends or improvements in livestock
productivity
• Managing resource constraints (e.g. water, fertiliser, feed)
• Working out how livestock can contribute to the UN Sustainable Development Goals
• Seeking international support to improve livestock sector performance
• Responding to market demands for sustainable products
• Better understanding and forecasting agricultural GHG emissions
• Assessing the options for mitigating GHG emis-sions through improving productivity
Did you know that (a) advanced GHG inventories are essential to support these outcomes, and (b) they may be more straightforward than you think?
1
Why are livestock GHG inventories important?

Advanced inventories using Tier 2 methods are beneficial for livestock development for a range of reasons. They:
• Reflect a country’s national circumstances and actual production systems
• Allow reporting of trends in emissions intensity as well as absolute emissions
• Capture reductions of emissions intensity resulting from increased productivity/efficiency at farm and national levels
• Allow a much wider range of potential mitigation actions to be captured
• Use data from multiple sources that can also support other work e.g. agricultural development plans, industry support programmes, water quality forecasting
• Allow development of tailored national policy to accelerate productivity gains and enhance credibility of policy measures
• Can facilitate climate-friendly branding and market access for livestock products
Inventories can be put together using different levels of complexity. While the simplest method (Tier 1) takes the least resources, it is unable to reflect a country’s unique circumstances or trends over time other than changes in total animal numbers. Tier 2 and Tier 3 methods require more detailed data but capture country-specific production systems. Crucially, they also reflect changes in emissions that result from improvements in the productivity and efficiency of those systems over time.
Productivity and associated emissions intensity of livestock farming differs widely around the world and the potential for change is huge (Figure 1). A global analysis found that doubling the milk production of low-yielding dairy systems, from 1,500 to 3,000 litres per cow per year, could roughly halve the GHG emissions per litre of milk from those systems. However, if a country’s livestock GHG inventory does not use Tier 2 methods, then the impact of such productivity gains are missed. They are missed not only in designing national goals that deliver against climate and development outcomes but also in discussions with potential investors in agricultural development.
Tier 2 inventories do need more detailed country-specific data – there is no escaping this fact. However, they can still use defaults and inferred or estimated data where direct measurements or statistics are not (yet) available.
1,00000
2
4
6
8
10
12
2,000 3,000 4,000 5,000 6,000 7,000 8,000 9,000
kg FPCM/cow
Note: FPCM = fat and protein corrected milkSource: Gerber et al. 2011
kg C
O2
-eq/
kg F
PCM
Each data point represents a country, based on di�erentcountries’ average productivity and associated emissions
Figure 1: Relationship between emissions intensity and milk yield per dairy cow
Benefits of advanced inventories
2

Livestock GHG emissions in a farm system depend on the number of animals and how much and what they eat
(gross energy or dry matter intake per animal). As a rule, as animal productivity improves, emissions per head increase but emissions per unit of product decrease (e.g. per kilogram of meat or litre of milk). This is because less of the energy in the feed consumed is used for body maintenance and more is used to produce milk, meat and fibre.
Inventories using Tier 1 methods cannot recognise changes in emissions resulting from changes in productivity. Inventories using Tier 2 or Tier 3 methods can. This critical difference is illustrated in Figure 2 and 3.
Tier 1 inventories estimate emissions by multiplying the total number of animals with a fixed emission factor. This approach assumes that emis-sions per animal do not change and are the same for both young and mature, breeding and non-breeding animals (see Figure 2). In most cases, this emission factor is estimated for all animals of a given ‘cate-gory’ across an entire continent (e.g. beef cattle, dairy cattle,
sheep). Because Tier 1 inventories assume fixed emissions per animal, they cannot be used to report on changes in emissions intensity over time. This is because a change in emissions intensity necessarily assumes that emissions per animal do change over time.
Given the wide diversity of livestock systems across large continents such as Asia or Africa, Tier 1 inventories are only crude estimates of any individual country’s livestock emissions. From a Tier 1 perspective, the only way to reduce emissions would be to reduce animal numbers – not plausible for countries concerned with food security and rural development.
Emissions / Animal
Fixed continental-scale default
No change over time
Number of animals
3
Figure 2: Tier 1 equation for estimating enteric methane emissions
The difference between Tier 1 . . .

In contrast, Tier 2 based inventories use information on the animal’s gross energy or dry matter intake to estimate their actual emissions (see Figure 3). Gross energy or dry matter intake reflects the amount of feed that the animal must have consumed in order to maintain its body and produce a certain amount of milk or gain weight at a certain rate. It is inferred from productivity measures such as live weight gain, milk yield, fertility etc. By using this approach, Tier 2 inventories more closely reflect a country’s actual farming systems and their productivity, and automatically pick up any changes over time.
The Tier 2 method then calculates enteric methane emis-sions per animal by multiplying the estimated intake per animal with the amount of methane emissions produced per unit of intake. The latter is also known as the ‘methane yield’.
Methane yield can be based on default values or reflect country- and feed-specific measurements. It is surprisingly steady for non-concentrated feed systems, with roughly 6.5% of intake consumed being released in the form of methane (IPCC, 2006). Methane yield does change with the quality of the diet but emissions per animal generally depend far more on how much an animal is eating than the exact methane yield for a given feed.
More productive animals generally have higher absolute emissions, but lower emissions per unit of product.
In this way, Tier 2 inventories give countries a choice to:
a. reduce absolute GHG emissions without compromising food security,
OR
b. use productivity gains to increase food produc-tion but with a lower GHG footprint.
Because Tier 2 inventories offer a more accurate picture of a livestock system and its productivity, they can support the reporting of emissions not just nationally but at sub- national and farm levels too. They can therefore also inform the design of mitigation actions across these scales, and provide a sound basis for quantifying NAMAs or local-scale mitigation projects.
Note that while Figure 2 and 3 show the formula for esti-mating emissions of enteric methane in a livestock system, similar principles apply when estimating other livestock GHGs. Estimates of GHG emissions from animal manure depend on the amount of carbon and nitrogen excreted as manure per animal, which is also directly related to feed intake per animal. Different manure management systems then determine the amount of methane, ammonia and nitrous oxide produced from a given amount of manure. See also page 7.
Number of animals
Intake /Animal
Emissions /Intake
Estimated from keyproductivity measures
Can change over time
Use default orcountry/diet-speci�c
values if available
. . . and Tier 2 methods
4
Figure 3: Tier 2 equation for estimating enteric methane emissions

• Identify key source categories
• Choose the most appropriate method for estimating emissions for each source category, using a higher Tier method for key source categories
• Classify livestock populations into subcategories for each species according to age, type of production, and sex
• For higher Tier inventories:
Collect data to describe the animal’s typical diet and performance in each subcategory
Estimate feed intake from the animal performance and diet data for each subcategory
• Develop a consistent time series that reflects changing practices
• Analyse uncertainties in the inventory
• Use country-specific methods and data where available
• Comprehensively document the inventory method
• Implement quality control and quality assurance procedures
2006 IPCC Guidelines: www.ipcc-nggip.iges.or.jp/public/2006gl
Design a simple systemConstruction of a Tier 2 inventory begins with the identifi-cation of priority emissions sources. These will often be the largest emissions sources. However, they could also include sources where countries expect to see significant changes in productivity and want to use their inventory to capture changes in emissions intensity (e.g. if extensive smallholder systems shift towards more intensive production).
The next and critical step is to develop a simple structure for livestock classes where the Tier 2 approach will be applied. An example structure for a beef system is included on page 7.
Keep these blocks of information as aggregated as possible, rather than trying to reflect minor differences in production systems in your country. Aggregation is important because it keeps the structure simple and data requirements manageable.
Throughout this process, make sure to keep in mind the availability of data. The structure should be designed so that the inventory can use existing data from agricultural or economic statistics, or data that can be readily inferred. An inventory can mix Tier 1 and Tier 2 methods for different emission sources.
An inventory based on Tier 2 methods is by its nature more detailed than a Tier 1 inventory, but it does not have to be much more complicated. The key to success is to start with as simple a structure
for Tier 2 methods as possible. The inventory itself can then guide priority areas for further improvements in terms of data sources and detailed characterisation of different livestock systems.
How to set up an advanced inventory
IPCC good practice in inventory development for livestock emissions:
5
Photo: S. Mann (ILRI) Photo: P. Vishwanathan (CCAFS)

Document the data sources and any assumptions or uncertainty in the data
Data for an advanced GHG inventory need not be over-whelming. Even though the Tier 2 approach is based on the gross energy or dry matter intake of animals, this is not normally measured directly. Instead, productivity measures such as milk yield, weight at slaughter, lambing percentage are used to estimate intake.
A range of sources exists for productivity data and it is perfectly acceptable to use small-scale surveys and expert judgments to fill gaps in more formal statistics. For example, a country may have no specific statistics on the number of replacement animals but this could be estimated from the number of breeding females and their longevity.
Examples of data sources include:
• Annual or periodic census/surveys
• Agricultural production/export statistics
• Other information collected by Agriculture Ministries
• Industry sources, consultations, reports
• Research studies
• International databases
• Expert judgment
Countries can then use default equations provided in IPCC guidelines that link country-specific productivity data to gross energy or dry matter intake, or they may use country-specific feeding standards if available. Additional information that may be relevant is the use of different manure management systems across the country.
It is important to document all data sources and any key assumptions, especially where values are not measured directly but are derived from feeding standards, expert judgments, spot samples or defaults.
A simple spreadsheet can be used initially to carry out a ‘sensitivity analysis’ (to assess uncertainty in the data and its impact on overall emissions). A sensitivity analysis is also a key step because it informs priority setting for improving the data over time.
Moving to a Tier 2 based inventory will not necessarily reduce the uncertainty in emissions estimates for any given year. However, it will far more accurately track changes in emissions over time arising from changes in productivity or specific mitigation actions. Tier 2 methods also make the uncertainty in emissions estimates more transparent and allow countries to gradually reduce the uncertainty over time.
Assumptions and generalisations will always have to be made in a Tier 2 inventory – no country has all the data it would like. Starting with a simple
structure and using some defaults is better than not starting at all on Tier 2. Keep in mind that the alternative (Tier 1) is to use a continent-wide default
emission factor that assumes that each animal emits exactly the same year in and year out, regardless of its age, feed intake and productivity.
6
Photo: CCAFS

Table 1 shows a very simple and hypothetical Tier 2 based inventory for enteric methane emissions from a national
beef herd in an Asian country. Specific numbers are made up but reflect real-world situations where countries have a domestic beef herd but also import animals for finishing.
In this example, absolute emissions change very little from Tier 1 to Tier 2. Crucially, however, because the Tier 2 estimates are based on actual productivity data, they can demonstrate efficiency changes over time and report mitigation outcomes from improvements across the beef production system. Tier 1 assumes that emissions are constant even if productivity changes so it would be inap-propriate to report trends in emissions intensity on the basis of Tier 1 emissions estimates.
A similar approach can be used for a Tier 2 method for estimating nitrous oxide emissions from soils, and methane and nitrous oxide emissions from manure management systems. Nitrous oxide emissions from soils can be calculated by using productivity data to work out total feed intake com-bined with information about the crude protein content of the diet. The same productivity data can be used to calculate deposition of organic matter in different manure manage-ment systems, and the emissions specific to those systems. In both cases, a country may use IPCC default emission factors initially but replace them over time with country- specific measurements for different soils, climate zones and manure management systems.
Animal class Relevant productivity data Emissions per head per year
Number of animals
Total methane emissions
Tier 1
Beef cattle (none) 47 kg1 1,000,000 47 kt
Tier 2
Breeding cows Liveweight, pregnancy rate 44 kg2 300,000 13.2 kt
Calves (0-1 year) Birth weight, weight gain 20 kg2 200,000 4.0 kt
Calves (1-2 years) Weight gain 35 kg2 180,000 6.3 kt
Replacements (2-3 years) Weight gain 40 kg2 50,000 2.0 kt
Finishing animals (2-3 years) Weight gain, finishing weight, number of days alive / year
65 kg2 130,000 8.5 kt
Finishing animals (imported) Import and finishing weight, number of days alive / year
75 kg2 135,000 10.1 kt
Breeding bulls Liveweight 50 kg2 5,000 0.3 kt
Total beef herd 1,000,000 44.4 kt1 IPCC regional default for Asia2 Calculated using IPCC 2006 default equations for gross energy intake using hypothetical productivity data, along with country-specific data on average digestibility of diet (if appropriate, differentiated for breeding and feedlot finishing animals, which may have a more concentrated diet)
An example of a Tier 2 approach for beef production
Table 1: Hypothetical Tier 2 inventory for national beef herd in an Asian country
7 Photo: S. Mann (ILRI)
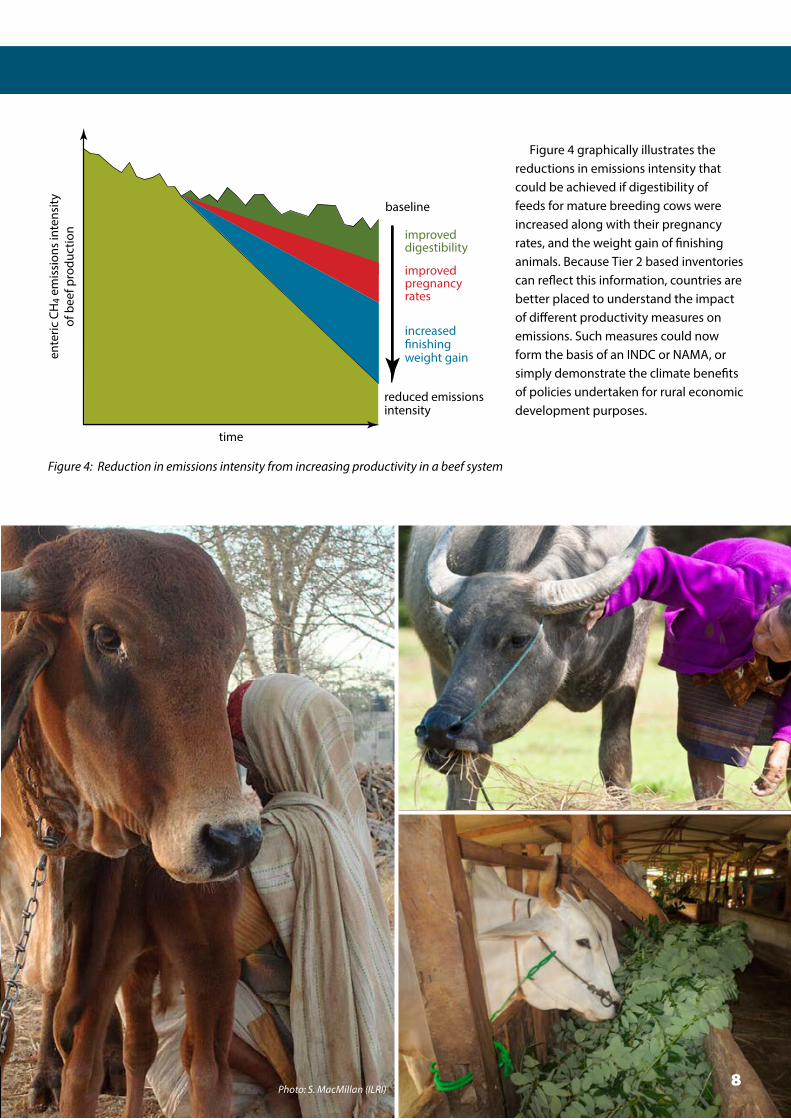
Figure 4: Reduction in emissions intensity from increasing productivity in a beef system
time
baseline
improveddigestibility
improvedpregnancyrates
increased�nishingweight gain
reduced emissionsintensity
ente
ric C
H4
emis
sion
s in
tens
ityof
bee
f pro
duct
ion
An example of a Tier 2 approach for beef production
Figure 4 graphically illustrates the reductions in emissions intensity that could be achieved if digestibility of feeds for mature breeding cows were increased along with their pregnancy rates, and the weight gain of finishing animals. Because Tier 2 based inventories can reflect this information, countries are better placed to understand the impact of different productivity measures on emissions. Such measures could now form the basis of an INDC or NAMA, or simply demonstrate the climate benefits of policies undertaken for rural economic development purposes.
8Photo: S. MacMillan (ILRI)

Beef production is a key part of Uruguay’s economy and a major source of export earnings. It also produces over half the country’s GHG emissions. Methane from enteric fer-mentation contributes 41% of total emissions and nitrous oxide emissions from pasture, range and paddock manure deposition contributes 17%.
Uruguay’s Tier 2 inventory has enabled it to define national climate change goals for cattle farming that reflect and encourage productivity improvements in the sector. See Table 2.
Gas Sector/Activity2030 Targets – % emission reduction targets from base year 1990
With domestic resources With additional means of implementation
MethaneBeef production
Accounts for 78% of CH4 emissions by 2010
Reduce emissions intensity per kilo of beef by 33%
Reduce emissions intensity per kilo of beef by 46%
Nitrous oxide
Beef production Accounts for 61% of N2O
emissions by 2010
Reduce emissions intensity per kilo of beef by 31%
Reduce emissions intensity per kilo of beef by 41%
These ambitious targets were stated in Uruguay’s INDC in September 2015. They will be pursued through improve-ments to general productivity, efficiency of the total herd, and animal diets.
None of Uruguay’s achievements or policy goals would have been possible with a Tier 1 inventory. The country’s advanced inventory enabled identification of improvements in the effi-ciency of beef production over recent decades. It also allowed the magnitude of those gains to be properly quantified and then translated into future policy goals. The Tier 2 inventory will also be the tool by which Uruguay monitors progress in reducing the emissions intensity of beef production.
Uruguay first began advancing its livestock GHG inven-tory in 2002, aiming to refine it to better reflect its national circumstances and reduce uncertainty. In 2004, the Climate Change Office of the Ministry of Housing, Planning and Environment convened a group of experts from different institutions to begin reporting beef cattle emissions using Tier 2 methods. They divided the country into agro-
ecological zones and developed estimates of methane emis-sions for each zone. National agricultural research institutions provided data on diet quality necessary for the calculations, which used the IPCC’s Tier 2 method (see page 4). It was not necessary to undertake direct measurements in order to do this, but they could be done in the future to further improve estimates.
A subsequent quality control of the 2004 inventory identified systemic overestimation of emissions due to poor activity data. Improvements were carried out in the following years to improve data collection and reduce uncertainty – now estimated to be less than 5%.
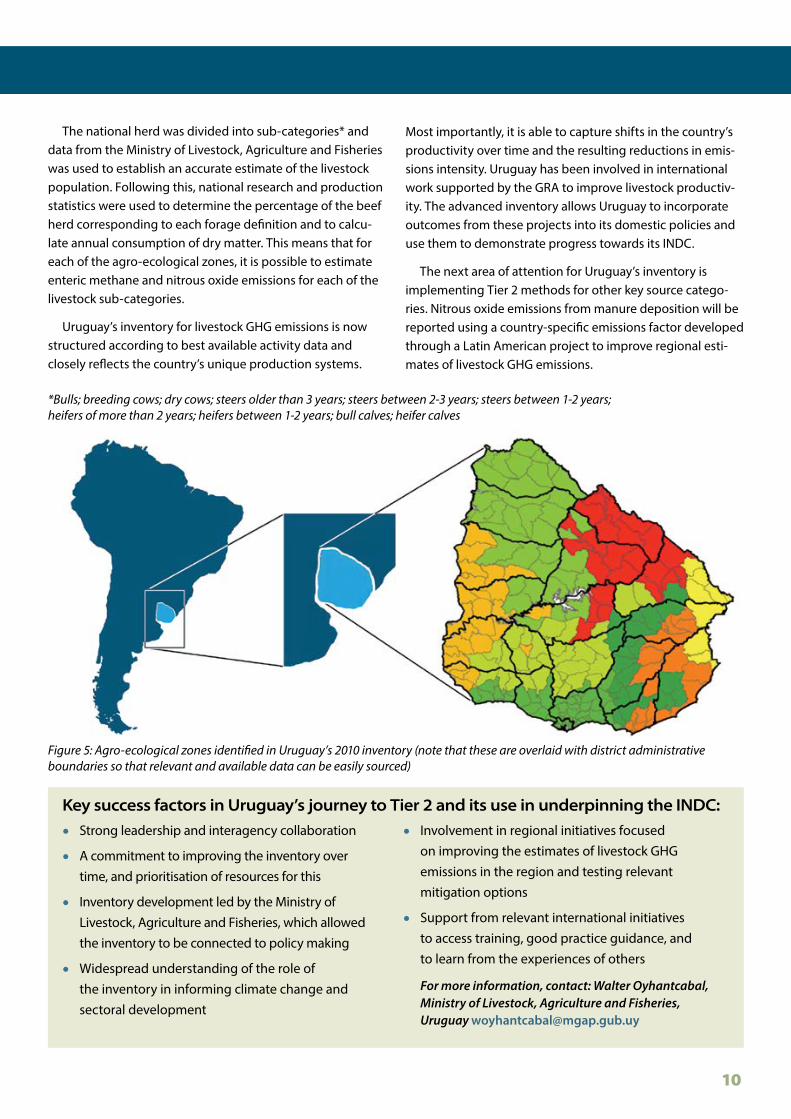
The inventory’s structure was reviewed as part of this work and further ‘regionalised’ (see Figure 5). This involved defining land use or forage types within the agro-ecological zones, e.g. natural pastures, prairies, fertilised pastures, annual cultivation etc. For each of these forage types, dry matter production and feed quality (digestibility and crude protein) were estimated using publications from national research institutions.
9
A case study of Uruguay’s Tier 2 inventory
Uruguay is a leading example of a country using its GHG inventory to inform low emissions develop-ment in its livestock sector.
Table 2: Uruguay’s INDC (September 2015)
The national herd was divided into sub-categories* and data from the Ministry of Livestock, Agriculture and Fisheries was used to establish an accurate estimate of the livestock population. Following this, national research and production statistics were used to determine the percentage of the beef herd corresponding to each forage definition and to calcu-late annual consumption of dry matter. This means that for each of the agro-ecological zones, it is possible to estimate enteric methane and nitrous oxide emissions for each of the livestock sub-categories.
Uruguay’s inventory for livestock GHG emissions is now structured according to best available activity data and closely reflects the country’s unique production systems.
Most importantly, it is able to capture shifts in the country’s productivity over time and the resulting reductions in emis-sions intensity. Uruguay has been involved in international work supported by the GRA to improve livestock productiv-ity. The advanced inventory allows Uruguay to incorporate outcomes from these projects into its domestic policies and use them to demonstrate progress towards its INDC.
The next area of attention for Uruguay’s inventory is implementing Tier 2 methods for other key source catego-ries. Nitrous oxide emissions from manure deposition will be reported using a country-specific emissions factor developed through a Latin American project to improve regional esti-mates of livestock GHG emissions.
*Bulls; breeding cows; dry cows; steers older than 3 years; steers between 2-3 years; steers between 1-2 years; heifers of more than 2 years; heifers between 1-2 years; bull calves; heifer calves
10
A case study of Uruguay’s Tier 2 inventory
• Strong leadership and interagency collaboration
• A commitment to improving the inventory over time, and prioritisation of resources for this
• Inventory development led by the Ministry of Livestock, Agriculture and Fisheries, which allowed the inventory to be connected to policy making
• Widespread understanding of the role of the inventory in informing climate change and sectoral development
• Involvement in regional initiatives focused on improving the estimates of livestock GHG emissions in the region and testing relevant mitigation options
• Support from relevant international initiatives to access training, good practice guidance, and to learn from the experiences of others
For more information, contact: Walter Oyhantcabal, Ministry of Livestock, Agriculture and Fisheries, Uruguay [email protected]
Figure 5: Agro-ecological zones identified in Uruguay’s 2010 inventory (note that these are overlaid with district administrative boundaries so that relevant and available data can be easily sourced)
Key success factors in Uruguay’s journey to Tier 2 and its use in underpinning the INDC:

Where to find more information
Advanced GHG inventories deliver dual benefits for climate change and for broader development. While
their construction is more complex and needs more detailed information than a Tier 1 inventory, countries can decide on the level of complexity that is feasible and appropriate for their systems and national capacity. Importantly, they can improve this over time.
A growing body of good practice resources and support is available to help strengthen countries’ abilities to progress to Tier 2 systems for livestock GHGs. The following initiatives bring countries together to learn from each other’s experiences and access good practice tools and training.
The Livestock Research Group of the Global Research Alliance on Agricultural Greenhouse Gases (GRA) has a significant programme of work underway to help countries improve how their inventories capture livestock GHG emissions. Regional collaborative projects, technical training and country-specific initiatives build capability and connect countries with resources and support mechanisms. A key goal is to help embed Tier 2 methods within broader development programmes and connect to policy goals. For more, email [email protected]
The CGIAR’s Research Program on Climate Change, Agriculture and Food Security (CCAFS) works with countries to improve estimates of farm emissions in smallholder systems and provide tools and information to support agricultural decision-makers to implement low emissions agricultural practices and policies. For more, www.samples.ccafs.cgiar.org
The Food and Agriculture Organization of the United Nations (FAO) has a Mitigation of Climate Change in Agriculture Programme (MICCA). This has developed various tools and training programmes
for supporting countries in measuring, reporting and verifying agricultural GHG emissions and in identifying mitigation options, both for national GHG inventories and NAMAs. Specifically for the livestock sector, FAO developed GLEAM-i, a Tier 2 simulation tool to support countries tackling climate change through livestock.
Various consultancies focus on improving the monitoring and reporting of GHG emissions and support low-emissions development pathways. When engaging in training programmes and specific projects, countries should consider whether a Tier 2 inventory would be desirable for specific emissions sources, and discuss with the consultancies and the above organisations what support can be provided to assist them in this journey.
Further readingFAO (2009) The State of Food and Agriculture: Livestock in the balance. www.fao.org/docrep/012/i0680e/i0680e.pdf
FAO (2015) Estimating Greenhouse Gas Emissions in Agriculture. www.fao.org/documents/card/en/c/1a92660d-5e84-4686-86ad-f338fa9e58aa
Gerber et al. (2013) Tackling climate change through live-stock – A global assessment of emissions and mitigation opportunities. www.fao.org/3/i3437e.pdf
GRA (2014) Reducing greenhouse gas emissions from livestock: Best practice and emerging options. www.globalresearchalliance.org/n/global-best- practice-guidelines-for-reducing-ghg-emissions-from-livestock-released/
IPCC (2006) 2006 IPCC Guidelines for National Greenhouse Gas Inventories. www.ipcc-nggip.iges.or.jp/public/2006gl