INVE_MEM_2011_107279.pdf
7
Noise-Figure Measurement of Differential Amplifiers Using Nonideal Baluns Óscar García-Pérez, Vicente González-Posadas, Luis Enrique García-Muñoz, and Daniel Segovia-Vargas, Member, IEEE Abstract—This paper analyzes the noise and gain measurement of microwave differential amplifiers using two passive baluns. A general model of the baluns is considered, including potential losses and phase/amplitude unbalances. This analysis allows de-embed- ding the actual gain and noise performance of the isolated ampli- fler by using single-ended measurements of the cascaded system and baluns. Finally, measured results from two amplifler proto- types are used to valídate the theoretical principies. Index Terms—Baluns, differential amplifiers, low-noise ampli- fiers, noise measurement. I. INTRODUCTION D URING THE last decades, differential amplifiers have been widely used in low-frequency electronics. More re- cently, engineers have exploited the interesting properties of dif- ferential amplifiers in the microwave range to improve the in- terference mitigation or the dynamic range. One of the applica- tions in which differential amplifiers are being used is the de- sign of differential active antenna arrays for the next generation of radio telescopes (e.g., Square Kilometre Array) [1]. The use of a differential active device directly connected to a differen- tial Vivaldi antenna element avoids the use of a passive balun, and therefore, allows improving the system noise temperature. For these types of applications, a method to accurately charac- terize the gain and noise performance of the low-noise ampli- fiers for non-50-íí antenna impedances is required. Neverthe- less, the main constraint with differential devices is their non- trivial characterization at microwave frequencies [2]. Mixed-mode scattering parameters (5-parameters) are de- fined in order to facilítate the analysis of differential devices since they make use of differential or common-mode exci- tations instead of conventional single-ended ones [3]. These parameters can be calculated from the conventional 5-param- eter matrix [3] or directly measured with a multiport network analyzer [4]. However, although S'-parameter characterization of differen- tial devices is possible, the noise measurement is still a chal- lenge at microwave frequencies. A method based on a hot/cold differential load connected at the input of the amplifler has been presented in [5]. This method requires a mechanism to cool the load (e.g., liquid N2) that may not be easily available. Although resistive load impedances can be easily used, arbitrary complex source impedances can be difflcult to synthesize. Furthermore, the connecting lines between the load and input of the amplifler introduce a phase rotation that distorts the impedance connected at the edge. In [6], another method to determine the noise figure of a differential amplifler has been described. It is based on mea- suring the partial gain and noise between pairs of input/output ports. Although it only requires a conventional gain and noise analyzer for 50-Í2 measurements, the limitation of this method is that it is difflcult to synthesize arbitrary and symmetrical source impedances for the input differential ports. This fact would re- quire a special differential impedance tuner [7]. The use of passive baluns is the simplest method to char- acterize differential amplifiers. Any source impedance condi- tion can be generated by using a conventional single-ended impedance tuner, which is indispensable to obtain the noise circles of the differential device-under-test (DUT) [7]. Since the external baluns affect the measurement procedure, it is necessary to de-embed the gain and noise valúes of the iso- lated DUT from the measurement of the cascaded system (Le., input balun, amplifler, and output balun). However, the de-embedding methods described in the literature [8] assume a simplifled model of the balun, with symmetrical losses and ideal 180° phase difference between the output ports, which is far from the behavior of real baluns used in practice. With this simplifled balun model, only differential-mode signáis are propagated so the effect of common-mode signáis was not taken into account. Thus, there is not a procedure to de-embed the noise performance of the DUT when phase unbalances or asymmetrical amplitude responses appear in the baluns. This paper analyzes the noise performance of differential am- plifiers with input/output baluns using a general model of the baluns with arbitrary losses and phase/amplitude unbalances in both branches. The main improvement with this analysis is that it considers the presence of both differential and common-mode signáis due to the unbalances in the balun, and therefore, pro- vides a more accurate measurement. The proposed procedure can be used for both 50-Í2 measurements and for source-pull measurements using an additional conventional load-pull tuner at the input [7]. II. THEORETICAL ANALYSIS The method that will be analyzed in this section is shown in Fig. l(a). Ideally, the input balun equally splits the signal
-
Upload
rasoul-arg -
Category
Documents
-
view
10 -
download
0
description
NF
Transcript of INVE_MEM_2011_107279.pdf

Noise-Figure Measurement of Differential Amplifiers Using Nonideal Baluns
Óscar García-Pérez, Vicente González-Posadas, Luis Enrique García-Muñoz, and Daniel Segovia-Vargas, Member, IEEE
Abstract—This paper analyzes the noise and gain measurement of microwave differential amplifiers using two passive baluns. A general model of the baluns is considered, including potential losses and phase/amplitude unbalances. This analysis allows de-embed-ding the actual gain and noise performance of the isolated amplifler by using single-ended measurements of the cascaded system and baluns. Finally, measured results from two amplifler proto-types are used to valídate the theoretical principies.
Index Terms—Baluns, differential amplifiers, low-noise amplifiers, noise measurement.
I. INTRODUCTION
D URING THE last decades, differential amplifiers have been widely used in low-frequency electronics. More re-
cently, engineers have exploited the interesting properties of differential amplifiers in the microwave range to improve the in-terference mitigation or the dynamic range. One of the applica-tions in which differential amplifiers are being used is the de-sign of differential active antenna arrays for the next generation of radio telescopes (e.g., Square Kilometre Array) [1]. The use of a differential active device directly connected to a differential Vivaldi antenna element avoids the use of a passive balun, and therefore, allows improving the system noise temperature. For these types of applications, a method to accurately charac-terize the gain and noise performance of the low-noise amplifiers for non-50-íí antenna impedances is required. Neverthe-less, the main constraint with differential devices is their non-trivial characterization at microwave frequencies [2].
Mixed-mode scattering parameters (5-parameters) are de-fined in order to facilítate the analysis of differential devices since they make use of differential or common-mode exci-tations instead of conventional single-ended ones [3]. These parameters can be calculated from the conventional 5-param-eter matrix [3] or directly measured with a multiport network analyzer [4].
However, although S'-parameter characterization of differential devices is possible, the noise measurement is still a challenge at microwave frequencies. A method based on a hot/cold
differential load connected at the input of the amplifler has been presented in [5]. This method requires a mechanism to cool the load (e.g., liquid N2) that may not be easily available. Although resistive load impedances can be easily used, arbitrary complex source impedances can be difflcult to synthesize. Furthermore, the connecting lines between the load and input of the amplifler introduce a phase rotation that distorts the impedance connected at the edge. In [6], another method to determine the noise figure of a differential amplifler has been described. It is based on mea-suring the partial gain and noise between pairs of input/output ports. Although it only requires a conventional gain and noise analyzer for 50-Í2 measurements, the limitation of this method is that it is difflcult to synthesize arbitrary and symmetrical source impedances for the input differential ports. This fact would re-quire a special differential impedance tuner [7].
The use of passive baluns is the simplest method to char-acterize differential amplifiers. Any source impedance condi-tion can be generated by using a conventional single-ended impedance tuner, which is indispensable to obtain the noise circles of the differential device-under-test (DUT) [7]. Since the external baluns affect the measurement procedure, it is necessary to de-embed the gain and noise valúes of the isolated DUT from the measurement of the cascaded system (Le., input balun, amplifler, and output balun). However, the de-embedding methods described in the literature [8] assume a simplifled model of the balun, with symmetrical losses and ideal 180° phase difference between the output ports, which is far from the behavior of real baluns used in practice. With this simplifled balun model, only differential-mode signáis are propagated so the effect of common-mode signáis was not taken into account. Thus, there is not a procedure to de-embed the noise performance of the DUT when phase unbalances or asymmetrical amplitude responses appear in the baluns.
This paper analyzes the noise performance of differential amplifiers with input/output baluns using a general model of the baluns with arbitrary losses and phase/amplitude unbalances in both branches. The main improvement with this analysis is that it considers the presence of both differential and common-mode signáis due to the unbalances in the balun, and therefore, provides a more accurate measurement. The proposed procedure can be used for both 50-Í2 measurements and for source-pull measurements using an additional conventional load-pull tuner at the input [7].
II. THEORETICAL ANALYSIS
The method that will be analyzed in this section is shown in Fig. l(a). Ideally, the input balun equally splits the signal

Fig. 1. (a) Measurement procedure of a differential amplifier (A) using baluns (Bl and B2) and typical circuit schematics of a: (b) balanced and (c) fully differential amplifier.
along two 180° out-of phase output branches. The behavior of the output balun is equivalent, although combining the output signáis from the amplifiers. Thus, the measured noise figure of the system with ideal baluns is equal to the noise figure of the isolated amplifier with differential excitations [8].
Differential amplifiers can be classified into two groups: balanced and fully differential [see Fig. l(b) and (c)] [2]. Although the response when using differential excitations is equivalent in both cases, it is not so for common-mode excitations. Balanced amplifiers equally amplify both differential- and common-mode signáis, which means CMRR = 1 [common-mode rejection ratio (CMRR)]. However, fully differential amplifiers only amplify differential signáis since common-mode excitations are mitigated by the structure (i.e., CMRR = oo). If a simplified model of the balun with symmetrical losses and no phase unbal-ance were used, only differential signáis would propágate along the system, and a single general model of the amplifier could be considered [8]. In this case, both losses and phase/magnitude unbalances are considered in the baluns. Therefore, since both differential- and common-mode signáis may appear, a sepárate analysis for the balanced and fully differential amplifier should be done.
A. Balanced Amplifier
Balanced amplifiers consist of two independent amplifiers working in parallel [see Fig. l(b)]. In this case, all the 5-param-eters of the amplifier are assumed to be zero, except the trans-mission parameters between ports 1-3 and 2-4, i.e.,
s 3 1 — s42 — A (1)
where A is the gain factor of the amplifier. For the case of the baluns, it is assumed that all the 5-parameters are zero (per-fect impedance matching and output ports isolation), except the transmission coefficients between ports 1-2 and 1-3 (arbitrary losses and phase/magnitude unbalances), i.e.,
s12 — s „B2 612
Bl 21
„B2 s21
s13 „B2 s13
= S Bl 31
„B2 s31
where super-indices Bl and B2 indicate the input and output baluns, respectively, assuming perfect output ports isolation and impedance matching in the balun is necessary to ensure that the amplifier loading conditions are the same as in the case of a 50-O isolated environment. Otherwise, the amplifier would not be correctly excited and the de-embedding would not be fea-sible. For the case of the ^-parameters, one can re-normalize the parameters matrix obtained for certain port impedance conditions and extract the corresponding matrix for any other port impedance conditions. However, this is not so for noise mea-surements. Measuring the noise figure (even knowing the 5-pa-rameters) of a device under certain port-impedance conditions does not give enough information to analytically obtain the corresponding noise figure for other matching conditions. It would require to have available the complete set of noise parameters (i.e., minimum noise figure (Fmin), optimum noise matching ( r o p t ) , and noise resistance (ün)) , which is assumed to be un-known a priori in this case. This last point could be achieved by exciting the amplifier for many source impedances (i.e., by using an additional impedance tuner) and following the method in Fig. 1, as was explained in [7].
The noise factor of a two-port device can be written as
/ = Total noise power at the output
Noise power at the output due to the source resistor (3)
In this case, the noise power at the output port is due to the contributions from the source resistor, from the two baluns, and from the amplifier. For the input balun, it can be assumed that the two branches genérate uncorrelated noise signáis [8]. Since the noise factor of a passive device is equal to its losses, the noise spectral density at its output is kT (W2/Hz), where k is the Boltzmann constant and T is the system temperature. For the case of the 1-2 and 1-3 branches of the input balun, this power density propagates to the output through the amplifier and the output balun as
N- kT Bl,a 1-2
N?2f = kT
\qA B2\2
| 5 3 1 5 1 2 |
qA B2\2
^42*13 (4)
where sub-indices 1-2 and 1-3 indicate the corresponding branch of the balun; super index a is used for the balanced topology, while super-indices B1,A,B2 denote the corresponding input balun or amplifier or output balun parameter. Terms in (4) contain the combined contribution of the source resistor and the input balun. For the balanced amplifier, it can be assumed that the noise generated by the two independent branches is uncorrelated. By definition, the noise power at the output of an amplifier is kT^A^A, where JA is the noise factor of the amplifier and GA is the power gain [8]. In order to calcúlate the contribution of the amplifier alone, the contribution from the source must be eliminated (i.e., kTGA)- Thus, the noise power of each stage of the balanced amplifier propagated to the output of the system is, respectively,
N?'a = (kTfA
= kT(fA
s 3 1 — kT S 3 1 j |¿s1 2 5 2 1
i) qA B2\ s 3 1 s 1 2
(2) N?'a = kT(fA-l)\si2s?i\2 TA,a (5)

where sub-indices 1 and 2 indicate the corresponding input port of the amplifler. The noise spectral density at the output of the balun B2 is kT (W2/Hz). Since two independent source resistors launch noise at the second and third output balun ports, the noise generated by the balun alone can be obtained as
NB2'a = kT-kT\sfi\ kT ' 13
kT - 0 , B 2 | '12 + *
B2\ 13 (6)
Finally, the noise contribution from the source resistor at the output of the system is obtained as
N' S,a h T \ B l A B2 lí-L *21 *31*12
, B l A B 2 I 2
T *31 *42*13 (7)
From the last expression, the power gain of the cascaded system when using a balanced amplifler can be extracted, Le.,
n(a) — \aBlaA „B2 , „B1„A „ B 2 | 2 f m
^ c a s c — |*21 *31*12 "+" *31 *42*13 | • W
The noise figure of the cascaded system can be obtained from (3)-(7) as
f(«) ./case
JVl_T + #1-3 + ^ 1 + ^2 + N jB2,a
/ x ( |
jyS.a
,A B2I '31*12 + \s A „ B 2 |
42*13 0 — O , B 2 | '12 + \S B2\
13
„B1„A „B2 i „B1„A „ B 2 | *21 *31*12 "+" *31 *42*13
(9)
If the mixed-mode parameters of the baluns were used instead of the conventional ones [2], Le.,
< ¡ B 1 -*ds21 —
*cs21 —
qB2 _ ssd21 — „B2 _ *sc21 —
s 2 1
5 21
s 3 1 )/y/2
+ s Bl\ 31 >
(qB2 _ oB2\ (*12 *13 )
„B2 s 12 ' 42) (10)
where the sub-indices c, d, and s denote differential-, common-, and single-ended excitations, respectively. In addition, the sub-index order in the mixed-mode parameters considers the differential or common-mode outputs for the flrst balun and single-ended output for the second balun. Assuming an ideal balanced amplifler (1) and using mixed-mode 5-parameter notation (10), (9) can then be simplifled to
f(«) = /case
{ÍAW „B2 I ' s d 2 l | + \s B2 I
sc21
„B1 bds21
AsBl <¿21 „B1 bcs21 ^fior
(ID
It can be seen that for the case of ideal baluns, Le.,
<B1
&21 „B2 ' 1 2
s 3 1 „B2 s 1 3
- 1
- 1 (12)
the noise figure and gain of the cascaded system is equal to the performance of the isolated amplifler, Le.,
/ c a s e — ÍA a n d Gcasc — A. (13)
B. Fully Differential Amplifier
A fully differential amplifler, also known as a differential pair, is an amplifler in which the sources of two transistors are both connected to a common current source [see Fig. l(c)]. Unlike the previous case, the differential pair cannot be analyzed as two independent stages. Thus, in the ideal case, all the S-parameters of the amplifler are zero, except the transmission parameters between the input ports and the output ports, Le.,
31 — *42 — A/2
-A/2. „A (14)
In this case, the noise power present in one of the inputs of the amplifler is propagated through the two outputs. Thus, the noise coming from one branch of the input balun is divided in two paths in the amplifler and combined in the output balun as
N:
N1_2 — kT \s31s12 „-4 B2\ ' 4 1 * 1 3
1 - 3 kT s A B2 , A B 2 I 2
32*12 T *42*13 (15)
where sub-indices 1-2 and 1-3 indicate the corresponding branch of the balun. The noise contribution of the differential amplifler can be calculated assuming two independent noise sources in both input ports. Therefore, the noise launched by each source is propagated through the two outputs of the amplifler and finally combined by the output balun as
N?'0 = kT(fA - 1)
kT(fA - 1) TV; •A,b
„A B2 ' 3 1 * 1 2
„A B2 ' 3 2 * 1 2
A „B2\ + SÍi S 41*13 |
.A „ B 2 | + s%s 42*13 (16)
where sub-indices 1 and 2 indicate the corresponding input port of the amplifler. For the output balun, the noise coming from ports 2 and 3 cannot be considered uncorrelated in this case since there are not two independent paths in the overall scheme. As the differential pair only propagates differential signáis (common-mode gain is zero), the noise can be modeled as a differential source connected between ports 2 and 3. The output balun can then be interpreted as a two-port passive device, with a differential input port and a single-ended output port, whose transmission parameter ssd2i can be obtained from (10). Since the output noise power density is kT (W2/Hz), the contribution of the balun alone is obtained as
N B2,b kTÍl- 0.5 UB 2
*12 - « B 2 | 2
*13 (17)
Finally, the noise contribution from the source resistor propagated to the output can be calculated from the combination of the different paths along which the source signal propagates, Le.,
TV' S.b kT (oBl.A , Bl A\ 1*21 *31 + *31 s32)
qB2 *12
, B 1 „A ' 2 1 *41
„B1 „A \ ' 3 1 *42)
, B 2 | s 1 3 (18)
The gain of the cascaded system in this case is directly obtained from (18) as
^1 = 1(^4 B l A\ B2 ' 3 1 *32 j *12
_L t.BlqA , B l A \ B2 + 1*21 *41 + *31 * 4 2 j *13 (19)

and the corresponding noise figure is shown in (20) at the bottom of this page. For an ideal fully differential amplifier (14) and using notation of mixed-mode 5-parameters for the baluns, (10), (20) can be simplified to
f(6) = «/case
W-i) qB2 I bsd2l\ + 1
^ - 5 J 0 -QB1 bds21^°sd21
(21)
It can be seen that (21) is analogous to (11), but removing the common-mode terms. That conclusión is logical since the fully differential amplifiers mitigate the common-mode signáis.
C. Step-by-Step Gain and Noise Measurement Procedure
The step-by-step gain and noise measurement procedure for both balanced and fully differential amplifier topologies is sum-marized below.
1) Characterization of the balun. Measure the transmission parameters (2) of baluns Bl and B2 by using a conventional network analyzer. Also, it should be checked that the reflection coefficients and the output ports isolations are significantly lower (e.g., lower than —15 dB) in the band of interest.
2) Gain measurement. Connect the baluns and the differential amplifier following the scheme shown in Fig. l(a). Measure the gain Gcasc of the two-port cascaded system by means of a conventional two-port network or gain analyzer. Assuming condition (1) in the case of the balanced amplifier or (14) in the case of the fully differential amplifier, de-embed the gain A of the amplifier making use of (8) or (19), respectively.
3) Noise measurement. Measure the noise figure / c a s c of the cascaded system by using a conventional two-port noise analyzer. Making use of (9) in the case of the balanced amplifier or (20) in the case of the fully differential amplifier, de-embed the noise figure JA of the amplifier.
D. Numerical Example: De-Embedding the Noise Figure
Equations (9) and (20) give analytical expressions that can be used to de-embed the noise figure of a balanced or a fully differential amplifier using nonideal baluns. Nevertheless, the choice of a proper configuration of a given set of baluns can di-minish the noise increment in /caso and therefore, reduce the uncertainty and errors during the de-embedding due to the lim-itations of the measurement equipments. A numerical example has been computed by using the formulas presented in the pre-vious section, in order to illustrate the effects of the baluns over the measurement of a balanced and a fully differential amplifier. For both cases, it is assumed an amplifier with a gain A — 6 dB, and a noise figure JA — 1 dB. Additionally, the same examples
4.5 4
3.5 3
2.5 2
1.5 1
0.5 4.5 4
3.5 3
2.5 2
1.5 1
0.5
Balan^d
(r\ \^K
/ o \
(a), ÍU\
"7CT
Fullj r-differfti,™i
(, \S
\ (i\\
)Aah fa\ Vw7Sr
~^<b) 10 15 20 25 30 35
Phase unbalance &(Deg)
40 45
Fig. 2. Phase unbalance effect in different scenarios. (a) Unbalance in B l ( £ B 1 = E) . (b) Unbalance in B2 (£ B 2 = s) • (c) Unbalances in phase in B l and B2 ( e B i = £ B 2 = s). (d) Unbalances in antiphase in B l and B2 ( e B i = £, £ B 2 = -e).
have been validated by means of the software AWR Microwave Office obtaining the same results.
Fig. 2 shows the effect of the phase unbalances in the baluns. It should be noticed that phase unbalances are not treated in the de-embedding analysis developed in the literature [8]. The unbalances SBI and 632 are defined as the increment in the phase difference between the output ports of both baluns with respect to the ideal 180°, i.e.,
¿ 4 1 - ¿*ii = 180° + eBi ls?2
2-¿s?32 = 180o+eB2. (22)
Several scenarios have been simulated, with unbalances in one or both baluns, and assuming that they do not present losses (see legend of Fig. 2). The first scenario, (a), only considers a phase unbalance in the input balun Bl (esi = ¿)\ the second scenario, (b), only considers a phase unbalance in the output balun (eB2 = e)\ the third scenario, (c), considers equal phase unbalances in the input and output balun (eei = £B2 = ¿) \ finally, the fourth scenario, (d), considers equal, but opposite, phase unbalance in both the input and output baluns (eei = e, £B2 = s). For the case of the balanced amplifier, scenarios (a) and (b) (the same unbalanced balun connected at the input or the output) equally affeets in the measurement. For the third scenario, (c), the increase in the noise figure for the balanced configuration is the largest since there is no compensation between the input and output baluns. However, for the fourth scenario, (d), there is no increment in the noise figure since the unbalances of Bl and B2 compénsate each other. Thus, for the balanced configuration, if two identical baluns are used to characterize a balanced amplifier, it is a good practice to connect them antisymmetrically (port 2 of Bl and port 3 of B2 in the upper path and vice versa). For
f(6) = J case
N?_l'b + N*_l'b+N?'b+N?'b+NB2'b
ÑsTb
fA Í\„A B2 , A B2\2 , JA l | * 3 1 é 1 2 + * 4 1 * 1 3 | +
10 .BlcA '21 6 3 1 + S
GA QB2>QA QB2 b 3 2 6 1 2 " r 6 42 ¿ , 13
2 )+ l -0 .5 QB2 0B2\ >12 >13
B1„A 31 6 3 2 )«f2
2+(< 21 6 4 1 + S BlaA\ 31 6 4 2 j
Q B 2 | (20)
4.5 4
3.5 3
2.5 2
1.5 1
0.5 4.5
4 3.5
3 2.5
2 1.5
1 0.5
Balance ri
^ s = = =
p)>.——' (¿)
/" • = ~~(fl) Xb)
Fiilly-H ¡fferentíí 1 V \ £ ¿ > —
(a) r
(E) Xb) 0.5 1 1.5 2.5
Loss factor a(dB)
Fig. 3. Losses effect in different scenarios. (a) Unbalance only in Bl (a'B1 = a, aB1 = 1). (b) Unbalance only in B2 (a'B2 = a, aB2 = 1). (c) Symmetric losses only in B1 (a'B1 = ctB1 = a), (d) Symmetric losses only inB2 (aB2 = « B 2 = « ) •
the case of the fully differential amplifier, the effect of the input balun is the same as the one with the balanced amplifier, (a), but the effect of the output balun is mitigated by the gain factor of the amplifier, (b). For the case of unbalances in the two baluns, it is indifferent whether the unbalances appear in phase or an-tiphase, [(c) or (d)].
The losses and amplitude unbalance effeets are now analyzed. Fig. 3 shows the impact of the losses and magnitude unbalances of the balun in the noise-figure measurement. The loss factors are defined from
s21 = l/(a'mV2) \s§11\=l/(a'j31V2)
\sf22\ = ll{a'mV2) |sf3
2| = l/(a'¿2y/2). (23)
It can be seen that the effect is very similar for the two types of amplifier. As is expected from the Friis formula, the losses in the output balun [(b) and (d)] are less critical than the losses in the input balun [(a) and (c)] since they are mitigated by the gain factor of the amplifier. It should be noticed that [8] only considers symmetrical losses in the baluns (Le., scenarios (c) and (d) in this case), but does not explain how to deal with the amplitude unbalances [Le., scenarios (a) and (b)].
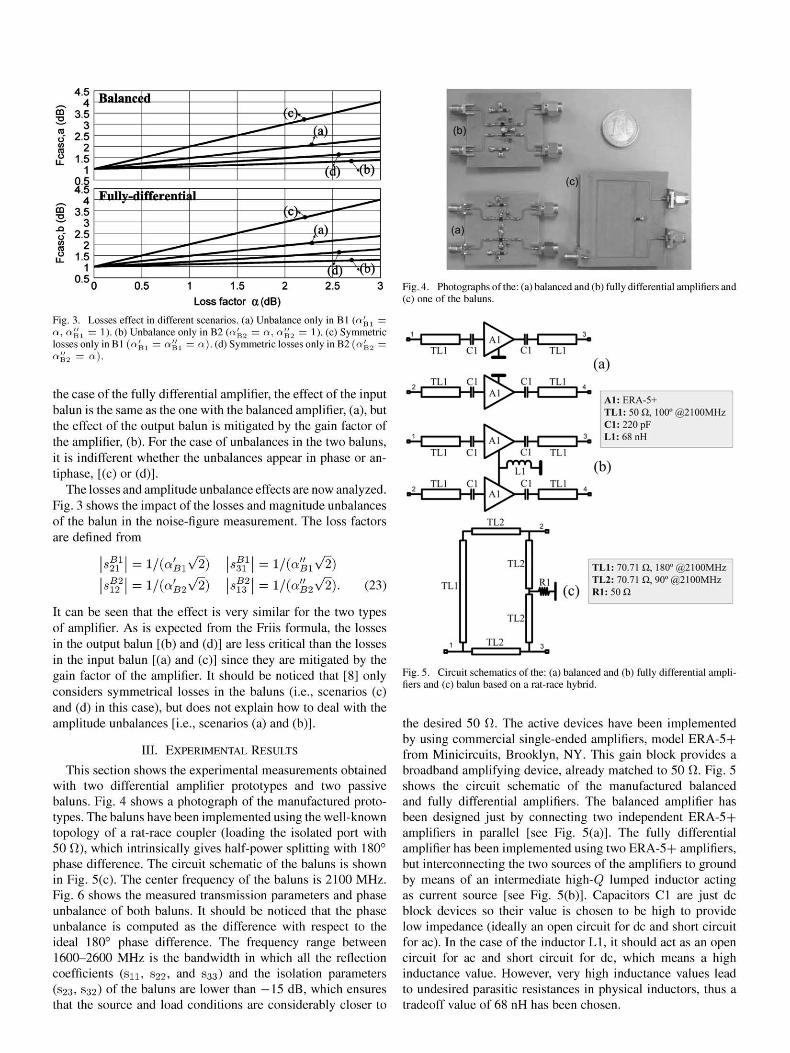
III. EXPERIMENTAL RESULTS
This section shows the experimental measurements obtained with two differential amplifier prototypes and two passive baluns. Fig. 4 shows a photograph of the manufactured prototypes. The baluns have been implemented using the well-known topology of a rat-race coupler (loading the isolated port with 50 Í2), which intrinsically gives half-power splitting with 180° phase difference. The circuit schematic of the baluns is shown in Fig. 5(c). The center frequeney of the baluns is 2100 MHz. Fig. 6 shows the measured transmission parameters and phase unbalance of both baluns. It should be noticed that the phase unbalance is computed as the difference with respect to the ideal 180° phase difference. The frequeney range between 1600-2600 MHz is the bandwidth in which all the reflection coefficients (su, S22, and S33) and the isolation parameters (S23> S32) of the baluns are lower than —15 dB, which ensures that the source and load conditions are considerably closer to
Fig. 4. Photographs of the: (a) balanced and (b) fully differential amplifiers and (c) one of the baluns.
TL1
TL1
Cl [,£ Cl
ci r ^ ci :HHAI>HH:
TLl
TL1
(a)
Al:ERA-5+ TLl: 50 Q, 100°@2100MHz Cl:220pF Ll:68nH
(b)
TL2
TLl
- ^
*T^ TLl: 70.71 Q, 180°@2100MHz
I, RI TL2: 70.71 Q, 90° @2100MHz fí^Ír\ ( c ) R1:50Q
Fig. 5. Circuit schematics of the: (a) balanced and (b) fully differential amplifiers and (c) balun based on a rat-race hybrid.
the desired 50 O. The active devices have been implemented by using commercial single-ended amplifiers, model ERA-5+ from Minicircuits, Brooklyn, NY. This gain block provides a broadband amplifying device, already matched to 50 Í7. Fig. 5 shows the circuit schematic of the manufactured balanced and fully differential amplifiers. The balanced amplifier has been designed just by connecting two independent ERA-5+ amplifiers in parallel [see Fig. 5(a)]. The fully differential amplifier has been implemented using two ERA-5+ amplifiers, but interconnecting the two sources of the amplifiers to ground by means of an intermedíate high-Q lumped inductor acting as current source [see Fig. 5(b)]. Capacitors Cl are just de block devices so their valué is chosen to be high to provide low impedance (ideally an open circuit for de and short circuit for ac). In the case of the inductor Ll, it should act as an open circuit for ac and short circuit for de, which means a high inductance valué. However, very high inductance valúes lead to undesired parasitic resistances in physical inductors, thus a tradeoff valué of 68 nH has been chosen.

~ -2
-3
E c -5 2 K -6 -^ 20 a 10
<D (O CD .C Q_
-10
: - ^ K s3f tur-^-
j* 0 9 1
f
>fcw>iiwit«niin „.. T**—
••••• i Balun B1 B H B R a l n n R'
^ ^ « H ^
^%
1
\
"""-—L **"*«̂
1600 1800 2400 2600 2000 2200
Frequency (MHz)
Fig. 6. Measured transmission parameters and phase unbalance of the baluns.
10 9.5
m 9 B 8.5 c "(5
8 O 7.5
7 6.5
^ 6.5
! e
.2> 5 .5 LL (D
w 5 o z
4.5
Éstimated gain +&££<
• Single-ended •> Balanced
™ Fully-differential
yp^^^Z'Z'f- — — — ̂ ̂ T N^gü'd
1600 1800 2000 2200 Frequency (MHz)
2400 2600
Fig. 7. Measured results with the balanced and fully differential amplifiers, be-fore and after the de-embedding process, and comparison with the performance of the single-ended amplifier.
The measured results for the gain and for the noise have been plotted in Fig. 7. The gain and noise measurements have been obtained using the noise analyzer N8975A from Agilent Technologies, Santa Clara, CA. Two sets of curves have been rep-resented in each graph. The continuous lines represent the gain and noise curves obtained from the single-ended amplifier. A set of lines that are labeled as Gcasc and F c a s c , respectively, represents the measured gain and noise curves directly obtained from the cascaded system formed by the baluns and the corre-sponding balanced/fully differential amplifier. The actual performance of the differential amplifiers should be the same as the performance of the single-ended amplifier of the two branches (for equivalent loading conditions). Thus, if no de-embedding procedure is applied to the measurement, the gain would be un-derestimated up to 1.5 dB and the noise would be overestimated up to 1 dB with respect to the actual valué (i.e., single-ended measurement) in the worst cases. In the edges of the band, the error is higher due to the larger phase and magnitude unbalances in the baluns. In the center of the band, although the unbalances are not significant, the error is still high due to the balun losses. The gain and noise curves after the de-embedding procedures are labeled as "Éstimated Gain" and "Éstimated Noise" in the graph. Such de-embedded gain and noise curves have been compared with the curves measured from the single-ended amplifier, obtaining a good agreement. It can be seen that both losses
3.5 S 3 S 2.5 2 2
UJ 1.5 • - 1 te '
O 0.5 This work '**.>
5L"Z Z. - > 1 -
y
<$> f !!imw«ta».iiw)»4¿' ííliu*.~ú&L'i*-n /rti •&"
• Balanced (This work) - ™ Fully-differential (This work)
• Balanced [8] — Fully-differential [8]
JThis worft*^
1600 1800 2000 2200
Frequency (MHz)
2400 2600
Fig. 8. Measured gain and noise-figure errors obtained with the method pro-posed in this paper and with the method described in [8] for both differential amplifier implementations.
and phase/magnitude unbalance effeets have been significantly corrected following the proposed de-embedding methodology (Section II-C).
It is remarked that other de-embedding procedures do not deal with magnitude and phase unbalances in the baluns. In [8], it is assumed that the outputs of the balun are 180° out-of-phase and the transmission between ports 1-2 and 1-3 are equal in module. Thus, only the valué of |s2i | is used to characterize each balun. A comparison between the de-embedding method described in [8] (based on the 1-2 branch of the balun, as specified in [8, Fig. 2]) and the one proposed in this paper is done in Fig. 8. This graph represents the error after the de-embedding the gain and the noise figure of the two differential amplifiers by using the two methods. This error is defined as the difference (in module) between the actual performance of the amplifier (i.e., single-ended measurement) and the performance obtained after the de-embedding procedure. It can be seen that the present method presents much better results, especially at the frequencies in the edge of the band, at which the unbalances in the baluns are more significant. Since the proposed analysis does not only consider the losses in the balun (as in [8]), but also the phase and magnitude unbalances, the present method covers a more general case, and therefore, it is inherently more aecurate.
IV. CONCLUSIÓN
Aecurate and simple measurement of differential amplifiers at microwave frequencies is needed for some current telecom-munication applications. Using baluns to characterize a differential amplifier allows the use of conventional measurement equipments. However, the effect of the baluns should be prop-erly eliminated. This paper has presented a complete analysis of this measurement setup, using a general model of the baluns with arbitrary losses and unbalances. The propagation of corre-lated noise signáis along the structure, including both common and differential-mode contributions, has been considered. From this analysis, it is possible to exactly extract the desired gain and noise performance of the isolated amplifier. The theory has been validated by means of computer-aided design (CAD) sim-ulations and the measurement of two amplifier prototypes, obtaining good results. Future research can be oriented toward im-
proving this theoretical study, including a general model of the active device as, for example, assuming arbitrary CMRR valúes in the amplifler.
REFERENCES
[1] L. E. Garcia-Muñoz, O. Garcia-Perez, V. González-Posadas, J. L. Vazquez-Roy, D. Segovia-Vargas, J. M. Serna-Puente, T. Finn, and J. A. Lopez-Fernandez, "FIDA3: A novel active array design for the midfrequency range of the square kilometre array," in Eur. Antennas Propag. Conf., Barcelona, Spain, Apr. 2010, pp. l^t.
[2] W. R. Eisenstadt, B. Stengel, and B. M. Thomson, Microwave Differ-ential Circuit Design Using Mixed Mode S-Parameters. Norwood, MA: Artech House, 2006.
[3] D. E. Bockelman and W. R. Eisenstadt, "Combined differential and common-mode scattering parameters: Theory and simulation," IEEE Trans. Microw. Theory Tech., vol. 43, no. 7, pp. 1530-1539, Jul. 1995.
[4] D. E. Bockelman and W. R. Eisenstadt, "Pure-mode network analyzer for on-wafer measurements of mixed-mode S-parameters of differential circuits," IEEE Trans. Microw. Theory Tech., vol. 45, no. 7, pp. 1071-1077, Jul. 1997.
[5] J. Morawietz, R. H. Witvers, J. G. B. de Vaate, and E. E. M. Woesten-burg, "Noise characterization of ultra low noise differential amplifiers for next generation radiotelescopes," in Eur. Microw. Conf., Munich, Germany, Oct. 2007, pp. 1570-1573.
[6] L. Belostotski and J. W. Haslett, "A technique for differential noise figure measurement of differential LNAs," IEEE Trans. Instrum. Meas., vol. 57, no. 7, pp. 1298-1303, Jul. 2008.
[7] O. Garcia-Perez, L. E. Garcia-Munoz, V. González-Posadas, and D. Segovia-Vargas, "Source-pull characterization of differential active antennas for radio-astronomy applications," in Eur. Wireless Tech. Conf., Rome, Italy, Sep. 2009, pp. 84-87.
[8] A. Abidi and J. C. Léete, "De-embedding the noise figure of differential amplifiers," IEEE J. Solid-State Circuits, vol. 34, no. 6, pp. 882-885, Jun. 1999.
Óscar García-Pérez was born in Madrid, Spain, on December 23, 1984. He received the Engineer degree in telecommunications from Universidad Carlos III de Madrid (UC3M), Madrid, Spain, in 2007, and is currently working toward the Ph.D. degree in Communications at UC3M.
His main research interests are the study of microwave active circuits with metamaterial structures and broadband differential low-noise amplifiers for radio astronomy applications.
Vicente González-Posadas was born in Madrid, Spain, in 1968. He received the Ing. Técnico degree in radio-communication engineering from the Polytechnic University of Madrid (UPM), Madrid, Spain, in 1992, the M.S. degree in physics from the Universidad Nacional de Educación a Distancia (UNED), Madrid, Spain, in 1995, and the Ph.D. degree in telecommunication engineering from Universidad Carlos III de Madrid (UC3M), Madrid, Spain, in 2001.
He is currently an Associate Professor with the Technical Telecommunication School, UPM. He has authored or coauthored over 80 technical conference, letter, and journal papers. His interests are related to active antennas, microstrip antennas, composite right/left-handed (CRLH) lines, and metamaterials and microwave technology.
Luis Enrique García-Muñoz is currently an Associate Professor with the Universidad Carlos III de Madrid (UC3M), Madrid, Spain. He has managed or participated in several national and European research projects on áreas such as antennas and array design. He has coauthored over 50 papers in international journals and conferences. He holds three patents. His current research interests include terahertz antennas, array design, truncation in an-tenna arrays, and radio astronomy instrumentation.
Daniel Segovia-Vargas (M'98) was born in Madrid, Spain, in 1968. He received the Telecommunication Engineering degree and Ph.D. degree from the Polytechnic University of Madrid (UPM), Madrid, Spain, in 1993 and 1998, respectively.
From 1993 to 1998, he was an Assistant Professor
áwith Valladolid University. Since 1999, he has been an Associate Professor with Universidad Carlos III de Madrid (UC3M), Madrid, Spain, where he is in charge of the microwaves and antenna courses. Since 2004, he has been the leader of the Radiofrequency
Group, Department of Signal Theory and Communications, UC3M. He has authored or coauthored over 110 technical conference, letters, and journal papers. His research áreas are printed antennas and active radiators and arrays, broadband antennas, left-handed (LH) metamaterials, terahertz antennas, and passive circuits.
Dr. Segovia-Vargas has been and expert of the European Projects Cost260, Cost284, and COST IC0603.


![H20youryou[2] · 2020. 9. 1. · 65 pdf pdf xml xsd jpgis pdf ( ) pdf ( ) txt pdf jmp2.0 pdf xml xsd jpgis pdf ( ) pdf pdf ( ) pdf ( ) txt pdf pdf jmp2.0 jmp2.0 pdf xml xsd](https://static.fdocuments.net/doc/165x107/60af39aebf2201127e590ef7/h20youryou2-2020-9-1-65-pdf-pdf-xml-xsd-jpgis-pdf-pdf-txt-pdf-jmp20.jpg)