Introductory to TI-84 Plus Graphing Calculatordocshare01.docshare.tips/files/13007/130073829.pdf ·...
57
Introductory to TI-84 Plus Graphing Calculator Training Module
Transcript of Introductory to TI-84 Plus Graphing Calculatordocshare01.docshare.tips/files/13007/130073829.pdf ·...

Introductory to
TI-84 Plus
Graphing Calculator
Training Module

______________________________________________________________________________________________
© 2006 STATWORKS (M) SDN BHD i www.ict-education.com.my
Table of Contents
INTRODUCTION: WORKING WITH TI-84 PLUS .......................................................... 1
TI-84 PLUS KEYBOARD ................................................................................................. 2
SWITCHING ON/OFF THE TI-84 PLUS............................................................................... 3
HOME SCREEN............................................................................................................... 4
SCREEN CONTRAST ....................................................................................................... 4
CURSOR......................................................................................................................... 4
IMPORTANT KEYS ........................................................................................................... 4
SUCCESSIVE COMMANDS ............................................................................................... 5
STORING NUMBERS........................................................................................................ 6
USING MENUS ................................................................................................................ 6
STANDARD SETTINGS..................................................................................................... 7
INTRODUCTION: CALCULATIONS .............................................................................. 9
EQUATION OPERATING SYSTEM (EOS) – ORDER OF EVALUATION .................................. 9
Practice Examples: .................................................................................................10
EDITING .......................................................................................................................12
USING THE DEL KEY ....................................................................................................12
INSERTING A NUMBER ..................................................................................................13
POWER AND ROOTS .....................................................................................................13
MATH MENU.................................................................................................................14
Example: .................................................................................................................14
REPEAT CALCULATIONS ...............................................................................................15
REPEATING SIMILAR CALCULATIONS.............................................................................15
INTRODUCTION : GRAPHING.....................................................................................17
MAIN GRAPHING KEYS .................................................................................................17
HOW TO CREATE A GRAPH ...........................................................................................18
Defining Functions to be Graphed......................................................................18
Defining Windows ...................................................................................................18

______________________________________________________________________________________________
© 2006 STATWORKS (M) SDN BHD ii www.ict-education.com.my
Graphing the Function ........................................................................................19
Tracing the Function ...........................................................................................20
Graphing a Second Function ..............................................................................20
Zooming ..............................................................................................................21
Evaluating at a specific x values.........................................................................21
SOLVING EQUATIONS ...................................................................................................22
Graphical Solutions.............................................................................................22
GRAPH VIEWS ..............................................................................................................25
Practice Example ................................................................................................25
INTRODUCTION............................................................................................................27
RELEVANT KEYS FOR STATISTICS.................................................................................27
UNIVARIATE STATISTICS ...............................................................................................27
Entering Data as a List........................................................................................27
Clear a List ..........................................................................................................29
Build A Histogram ...............................................................................................29
Naming A List......................................................................................................30
BIVARIATE STATISTICS .................................................................................................31
Practice Example ................................................................................................31
INTRODUCTION : SPECIAL FEATURES....................................................................33
FLASH TECHNOLOGY....................................................................................................33
DATA COLLECTION DEVICES WITH THE TI-84 PLUS.......................................................33
TI-84 PLUS AND THE TI-GRAPHLINK CABLE WITH TI-CONNECT .....................................34
TI-Connect Homescreen.....................................................................................36
Connecting A device ...........................................................................................37
Updating device software....................................................................................37
TI DeviceExplorer Overview ...............................................................................38
Transferring device files using drag and drop ................................................39
Backing up device files....................................................................................40
Restoring backed-up device files ....................................................................40
TI ScreenCapture overview ................................................................................41
Capturing device screens................................................................................42

______________________________________________________________________________________________
© 2006 STATWORKS (M) SDN BHD iii www.ict-education.com.my
Saving captured screens.................................................................................42
Sending images to a device............................................................................43
Deleting device applications............................................................................44
TI-INTERACTIVE WITH THE TI-84 PLUS..........................................................................44
Features ..............................................................................................................45
The Math Box......................................................................................................45
The Math Palette.................................................................................................46
Graphing Function...............................................................................................47
Data Analysis ......................................................................................................48
Connecting a Graphing Calculator .....................................................................51
ACKNOWLEDGEMENTS .............................................................................................53

1 Working with TI-84 PLUS
______________________________________________________________________________________________
© 2006 STATWORKS (M) SDN BHD 1 www.ict-education.com.my
Introduction: Working with TI-84 PLUS
This introduction training manual is to help educators to understand the operations of a
TI-84 PLUS graphing calculator and its application for computation purposes.
Mathematics and Science are visual subjects, and graphics calculators can provide the
picture in a number of important areas of mathematics. They are also useful in
allowing students to explore mathematics numerically and graphically. Graphics
calculators are portable, powerful and, for what they do, relatively cheap.
These notes are specifically designed for use with the TI-84 Plus, a graphic calculator
manufactured by Texas Instruments. It is suitable for
• those who already have some knowledge about graphics calculators, but are
looking for directions with specific operations
• those who have only just found the ON button.
What can do the TI-84 Plus do?
• all the features of a scientific calculator plus matrices and complex numbers
• multi-line screen, which displays input and output of calculations
simultaneously
• ability to graph Cartesian, parametric, polar and sequence graphs
• statistical functions for organising, analysing and displaying data
• programmable, with a large number of programs available for downloading
• can be linked to other calculators, computers and printers for electronic transfer
of programs, data, etc and downloading programs from a computer or the web
• can be used in conjunction with a data logger and its probes (Calculator based
laboratory (CBL 2)): these enable easy collection of real data, which can be
organised, displayed and analysed
• an overhead-projector view screen is available (only for the Teacher’s set).

1 Working with TI-84 PLUS
______________________________________________________________________________________________
© 2006 STATWORKS (M) SDN BHD 2 www.ict-education.com.my
TI-84 PLUS Keyboard
Generally, the keyboard is divided into these zones:
• Graphing — Graphing keys access the interactive graphing features.
• Editing — Editing keys allow you to edit expressions and values.
• Advanced — Advanced function keys display menus that access the
advanced functions.
• Scientific — Scientific calculator keys access the capabilities of a standard
scientific calculator.

1 Working with TI-84 PLUS
______________________________________________________________________________________________
© 2006 STATWORKS (M) SDN BHD 3 www.ict-education.com.my
The keys on the TI-84 Plus are color-coded to help you easily locate the key you need.
• The light gray keys are the number keys.
• The blue keys along the right side of the keyboard are the common math
functions.
• The blue keys across the top, set up and display graphs.
• The blue Œ key provides access to applications such as the Finance
application.
• The primary function of each key is printed on the keys. For example, when
you press �, the MATH menu is displayed.
• The secondary function of each key is printed in yellow above the key. When
you press the yellow y key, the character, abbreviation, or word printed in
yellow above the other keys becomes active for the next keystroke. For
example, when you press y and then �, the TEST menu is displayed. This
guidebook describes this keystroke combination as y :.
• The alpha function of each key is printed in green above the key. When you
press the green ƒ key, the alpha character printed in green above the
other keys becomes active for the next keystroke. For example, when you
press ƒ and then �, the letter A is entered. This keystroke combination
as ƒ [A].
Switching on/off the TI-84 Plus
The calculator is turned on by pressing the É button; press y É (i.e. OFF) when
you have finished. The calculator will turn itself off if not used for a short time, but
nothing is lost when this happens. Just turn it back on and you will return to your work
where you last left it.
Notice that the y key is yellow. When you need to use any function or value which is
printed in yellow above a particular key, first press y and then the corresponding
key.

1 Working with TI-84 PLUS
______________________________________________________________________________________________
© 2006 STATWORKS (M) SDN BHD 4 www.ict-education.com.my
Home Screen
The Home screen is the main screen which is used to display operations and to enter
expressions and instructions. It is the first screen you will see when the calculator is
first turned on.
Screen Contrast
If the screen is difficult to read then adjust the contrast. To make the screen display
darker press y and then hold down the } key. Pressing y and then † will lighten
the display.
You will see a number in the top right hand corner of the screen at this stage. The
numbers range from 1 (for lightest) to 9. If the screen is showing the number 9 and the
contrast is only adequate, you should replace the AAA batteries soon. (Refer to the
manual for instructions.)
Cursor
A flashing square appears in the position where the next entry is to be made. You can
access previous entries by using the cursor keys (they are the four keys with little
triangle arrows found at the top right of the keyboard) to move about the screen.
Important Keys
ÍÍÍÍ There is no = key on a graphics calculator. When you want to carry
out a calculation, enter the complete expression and then press Í
These are the cursor keys. In these notes they are referred to using the
symbols } † ~and |These keys will enable you to move around the
screen.
{{{{ This key is used to correct a little mistake. Using the cursor keys, place
the cursor over the item to be deleted and then press {

1 Working with TI-84 PLUS
______________________________________________________________________________________________
© 2006 STATWORKS (M) SDN BHD 5 www.ict-education.com.my
‘‘‘‘ This key clears bigger mistakes. It will clear all of the line that you are
currently working on. But if you have already pressed Í then
pressing ‘ clears the whole screen.
5555 To access this feature you need to press y z. These keystrokes
will always return you to the Home Screen. If necessary use these
when you are stuck and can't see how to recover.
yyyy This key has already been mentioned. It is used to access any feature
which is printed in yellow at the top left of most keys. For example, to
use the value of B in a calculation, press y •
zzzz This key fixes the way the calculator operates. For example you can
choose to display answers with a fixed or floating number of decimal
places, you can have a graph which is joined or just a series of points
and so on.
Successive Commands
You can construct lengthy commands on the screen if you want before pressing Í,
but you can also do chain calculations. The result of the most recent calculation is
stored in Z. This is used in chain calculations, and can be recalled using y • . As
an example, try the following key sequence. Watch where Z is automatically
recalled.
À Â Ã À ¶ Ã À · Í
¥ ¬ Í
¡ Í
— Í
• C • Z ¤ Í
note that you have to key in Ans here
1 Working with TI-84 PLUS
______________________________________________________________________________________________
© 2006 STATWORKS (M) SDN BHD 6 www.ict-education.com.my
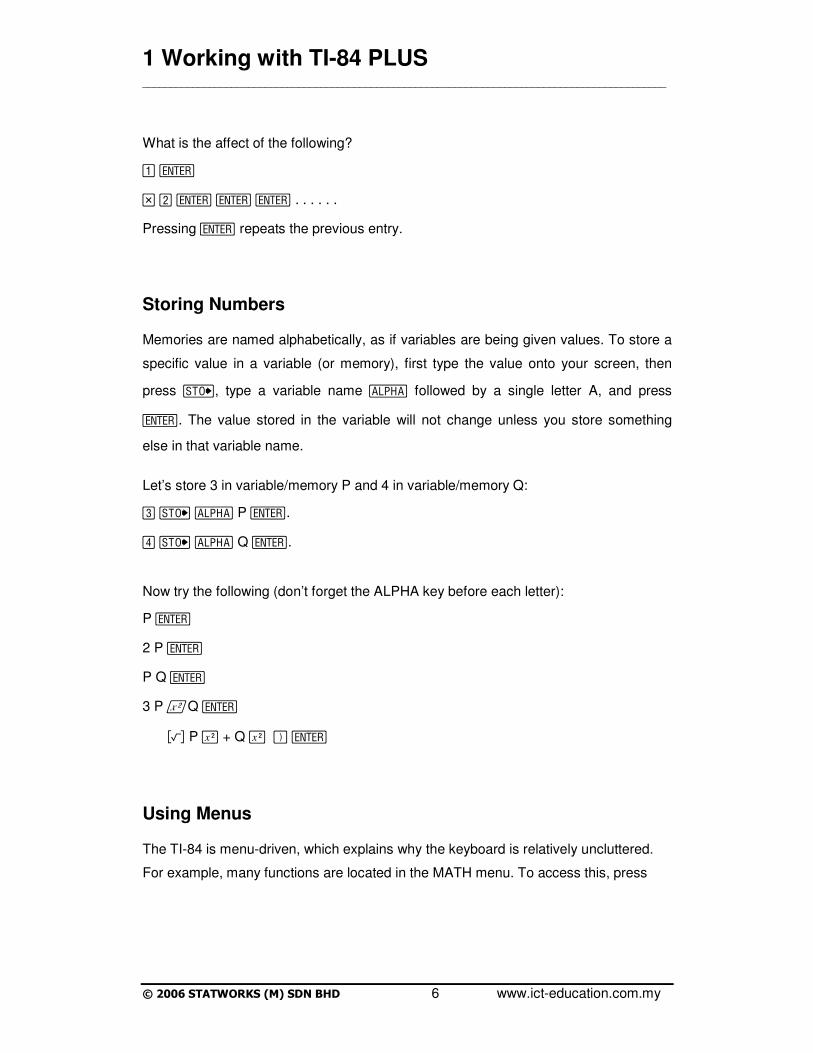
What is the affect of the following?
À Í
¯ Á Í Í Í . . . . . .
Pressing Í repeats the previous entry.
Storing Numbers
Memories are named alphabetically, as if variables are being given values. To store a
specific value in a variable (or memory), first type the value onto your screen, then
press ¿, type a variable name ƒ followed by a single letter A, and press
Í. The value stored in the variable will not change unless you store something
else in that variable name.
Let’s store 3 in variable/memory P and 4 in variable/memory Q:
 ¿ ƒ P Í.
¶ ¿ ƒ Q Í.
Now try the following (don’t forget the ALPHA key before each letter):
P Í
2 P Í
P Q Í
3 P ¡ Q Í
• C P ¡ + Q ¡ ¤ Í
Using Menus
The TI-84 is menu-driven, which explains why the keyboard is relatively uncluttered.
For example, many functions are located in the MATH menu. To access this, press

1 Working with TI-84 PLUS
______________________________________________________________________________________________
© 2006 STATWORKS (M) SDN BHD 7 www.ict-education.com.my
� and you will see the four sub-menus displayed, with headings [MATH], [NUM],
[CPX] and [PRB]. The arrow keys allow you to move between these.
To access a menu function, press its number (or use the up- and down-arrow keys and
Í ). Generally you construct an expression just as you would on paper. To leave a
menu without selecting a function, press ‘ , which returns you to the home
screen. Try the following examples:
¬ � Â Í for 73
� ~ À Á ¹ ® • Í for |2-9|: absolute-value function
� ~ · Â • À • Í for [3.1], greatest-integer function
À · � | Â ¶ Í for 15C4
� | À Í Í for successive random numbers on (0: 1)
À Á � | ¶ Í for 12!
Á ¥ ¬ Ã Â ¥ · � À Í for 2/7 + 3/5 as a fraction
Standard Settings
When you first turn on a new calculator (or when you have reset to clear all the
memories) it is already set to display certain features and to be used in a pre-
determined way. We can change these to suit the type of calculations that are to be
performed.
What are the standard settings and what other options are there anyway? Press z
- the screen looks a bit daunting doesn't it! Notice that there are a number of words
already 'blacked out' - this means that these settings have already been selected.
• The first line determines the how the calculation results are displayed
o Normal means that numbers are written in the normal way. But on the
same row, we could choose Sci or Eng. Sci means that the answers would

1 Working with TI-84 PLUS
______________________________________________________________________________________________
© 2006 STATWORKS (M) SDN BHD 8 www.ict-education.com.my
be given in scientific notation. If we wanted to have answers given in
scientific notation, we would use the cursor keys to move the cursor so that
it is blinking on Sci, however because Normal is still blacked out this is still
the selected option. To change to Sci, when the cursor is flashing on Sci,
press Í . Notice that Sci becomes the selected choice.
• The second line determines how many decimal places you may want in the
answers.
• The third line determines whether angles are expressed in radians or degrees.
• The fourth line indicates the different types of graphs that are possible.
o Func for ‘function graphs’, y = f(x), and this is the graph mode we will use
most of the time.
o The other modes are parametric, polar and sequence.
• Line 5 in Mode controls whether the plotted ‘dots’ in a function (or other) plot are
connected or not. Change the mode to Dot, and graph again using ZOOM
Standard.
• Set line 5 back to Connected, and change line 6 from Sequential to Simul(taneous)
Graph again, and figure out what this setting does.
• Line 7 allows you to enter Complex mode, with complex numbers in either
Cartesian or polar form.
• Change line 8 from Full screen to G–T. Graph again.
o Press 0 to move to the table and s to go back to the graph. Then
try r . You need to use the arrow keys appropriate to the graph to
move around both the table and the graph.
o If you choose Horiz on line 8, the top half of the screen shows the graph,
while the home screen, 0, oand p all use the bottom half of the
screen.
o Full-screen menus (e.g. MODE) will temporarily use the whole screen and
then restore the split screen (if it is still selected) when you exit from them.

3 Graphing with the TI-84 PLUS
______________________________________________________________________________________________
© 2006 STATWORKS (M) SDN BHD 9 www.ict-education.com.my
Introduction: Calculations
Calculations are performed by entering the numbers in the usual manner, keeping in
mind that rule of order is obeyed. You can make use of the brackets on the keypad to
enter quite complex computations.
Try this simple addition: 345 + 678
When you press Í the addition remains on the screen and the answer appears on
the right hand side of the next line. It is not necessary to press ‘ before the next
calculation.
Equation Operating System (EOS) – Order of Evaluation
The Equation Operating System (EOS) defines the order in which functions in
expressions are entered and evaluated on the TI-84 Plus. EOS lets you enter numbers
and functions in a simple, straightforward sequence. EOS evaluates the functions in an
expression in this order.
Order Number Function
1 Functions that precede the argument, such as (, sin(, or log(
2 Functions that are entered after the argument, such as 2, -1, !, °, r, and
conversions
3 Powers and roots, such as 2^5 or 5x32
4 Permutations (nPr) and combinations (nCr)
5 Multiplication, implied multiplication, and division
6 Addition and subtraction
7 elational functions, such as > or ≤
8 Logic operator and
9 Logic operators or and xor
3 Graphing with the TI-84 PLUS
______________________________________________________________________________________________
© 2006 STATWORKS (M) SDN BHD 10 www.ict-education.com.my
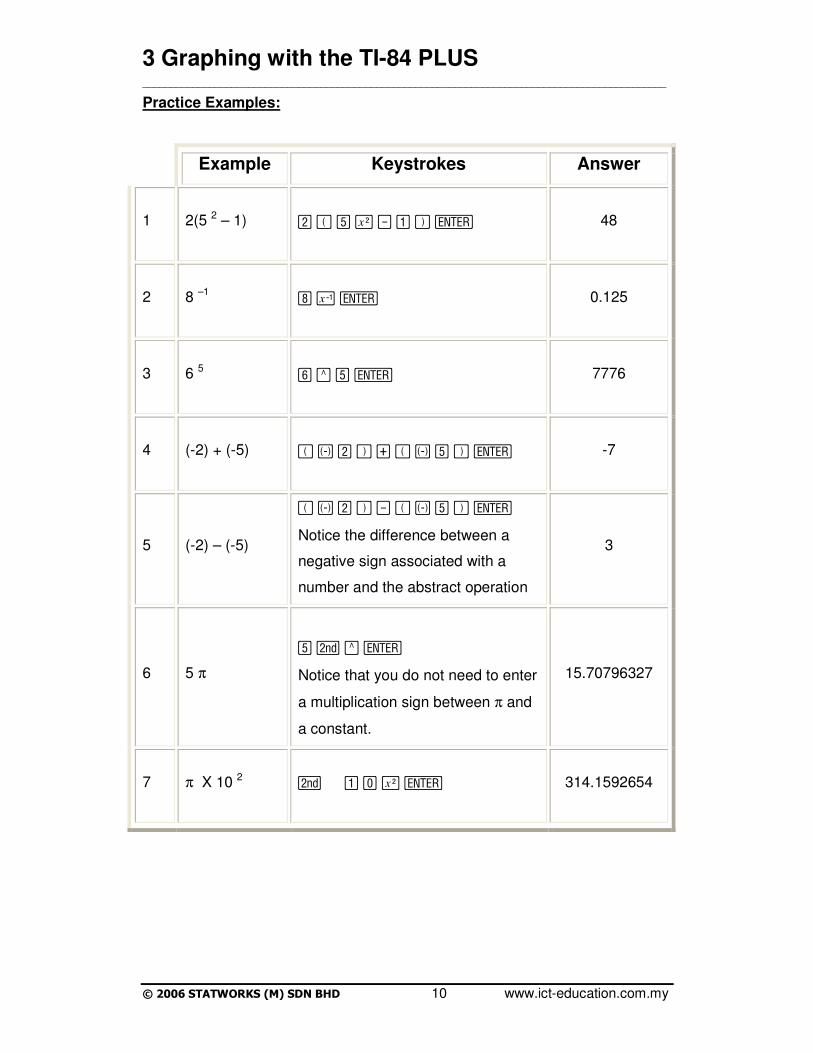
Practice Examples:
Example Keystrokes Answer
1 2(5 2 – 1) Á £ · ¡ ¹ À ¤ Í 48
2 8 –1 − œ Í 0.125
3 6 5 ¸ › · Í 7776
4 (-2) + (-5) £ Ì Á ¤ Ã £ Ì · ¤ Í -7
5 (-2) – (-5)
£ Ì Á ¤ ¹ £ Ì · ¤ Í
Notice the difference between a
negative sign associated with a
number and the abstract operation
3
6 5 π
· y › Í
Notice that you do not need to enter
a multiplication sign between π and
a constant.
15.70796327
7 π X 10 2 y • À Ê ¡ Í 314.1592654

3 Graphing with the TI-84 PLUS
______________________________________________________________________________________________
© 2006 STATWORKS (M) SDN BHD 11 www.ict-education.com.my
Example Answer
1 65 - 42 X 7 -47
2 1/24 + 6.4 6.441666667
3 10.36- 8.5 / 4 + 3.674 11.909
4 2.3 x (3.1 + 4.98) 18.584
5 24 + (6 – 4.5) X 3 28.5
6 6.2 x (-4.8) + 3.22 -19.52
7 789/(123 * 456) 0.140671801
8 789/ (123 + 456) 1.362694301
9 (123 + 789) / 456 2
10 (12.62 + 3.8172) / (6.5 + 1.04) 2.18
11 (6.2 + 5) 3 1404.928
12 34.952 1221.5025
13 35.52/(-2.4) -14.8

3 Graphing with the TI-84 PLUS
______________________________________________________________________________________________
© 2006 STATWORKS (M) SDN BHD 12 www.ict-education.com.my
Editing
Editing is how you correct your mistakes, or change your mind about a calculation.
Suppose you have entered the calculation
35 × 1.63 – 1 •
3 ÷ 25 •
1 + 48 ÷ 14.5 •
The answer given on the right hand side of the screen is 4.310344828. But perhaps
you have now realized that instead of 25 (in the numerator) you should have entered
35. Since you can see what you have done on the screen, these kinds of mistakes are
easy to spot!
• Press y Í • • and you will see the calculation repeated (you have
recalled the previous entry) - but there is no answer this time.
• Use the | key repeatedly (or } ~ • ) so that the cursor is blinking on top of
the 2.
• Then press 3 (which changes 25 to 35) and Í
The corrected answer is given 0.0857142857
Using the DEL key
Suppose that the calculation above should have been
35 × 1.3 – 1
3 ÷ 25
1 + 48 ÷ 14.5
i.e. the 1·63 should have been simply 1.3
Press y Í until you reach 35 × 1.63 – 1, place the cursor over the 6 and then
press { followed by Í - the answer is now 44.5

3 Graphing with the TI-84 PLUS
______________________________________________________________________________________________
© 2006 STATWORKS (M) SDN BHD 13 www.ict-education.com.my
Inserting a Number
If you need to insert a number, move the cursor until it is to the immediate right of
where you need to insert, press y { (this is equivalent to INS), followed by the
number (or numbers) to be inserted. Complete the calculation by pressing Í
Power and Roots
You may have noticed that the › key is used to indicate that something is raised to a
power. However, if you wish to square a number then ¡ is an option which uses one
less keystroke.
Example
7·62 can be found by either of these methods.
• 7·6 ¡ Í
• or 7·6 ^ 2 ÍThe answer is 57.76
The square root key is accessed by y ¡ but these must be pressed before the
number is entered.
Example
64 is entered as y ¡ 64
( )14425 + is entered using brackets like this.
• • ¡ 25 • 144 • Í (Answer = 13)
The final bracket is optional here, though there may be times when it is essential. You
need to think about the calculation and the rule of order to decide when the closing
bracket is essential.

3 Graphing with the TI-84 PLUS
______________________________________________________________________________________________
© 2006 STATWORKS (M) SDN BHD 14 www.ict-education.com.my
Math Menu
Evaluate 5
4
3
2+ and give the answer as a fraction.
There is no fraction key on the TI-84, however this is not a problem. The sum is
entered in conventional manner using the 'divide' symbol. Here are the keystrokes:
2 ¥ 3 Ã 4 ¥ 5 Í The answer is given as 1·46666…
We can change this to fraction form by using the following keystrokes:
� À You will be returned to the Home screen and see that the
calculator has been instructed to change the answer to a
fraction.
Í The answer is given as 22/15
If you want to change this back to a decimal form, press � Á
If a calculation involves a mixed numeral (for example 6 2/5 ) then you can change it to
an improper fraction ( 32/5 ) or recognize that 6 2/5 means (6 + 2/5 )
Example:
6 √ 50 can be found by:
¸ � · You will be immediately returned to the Home screen
with the symbol x shown. This gives the instruction to
find the sixth root of the number which is entered next.
50 Í The answer 1·91938… is displayed.
There are many other operations that can be done from the MATH menu, but we will
only consider some of them here.
3 Graphing with the TI-84 PLUS
______________________________________________________________________________________________
© 2006 STATWORKS (M) SDN BHD 15 www.ict-education.com.my
Repeat Calculations
Most calculators have the ability to repeat an operation over and over. Let's see how
the TI-84 Plus does this.
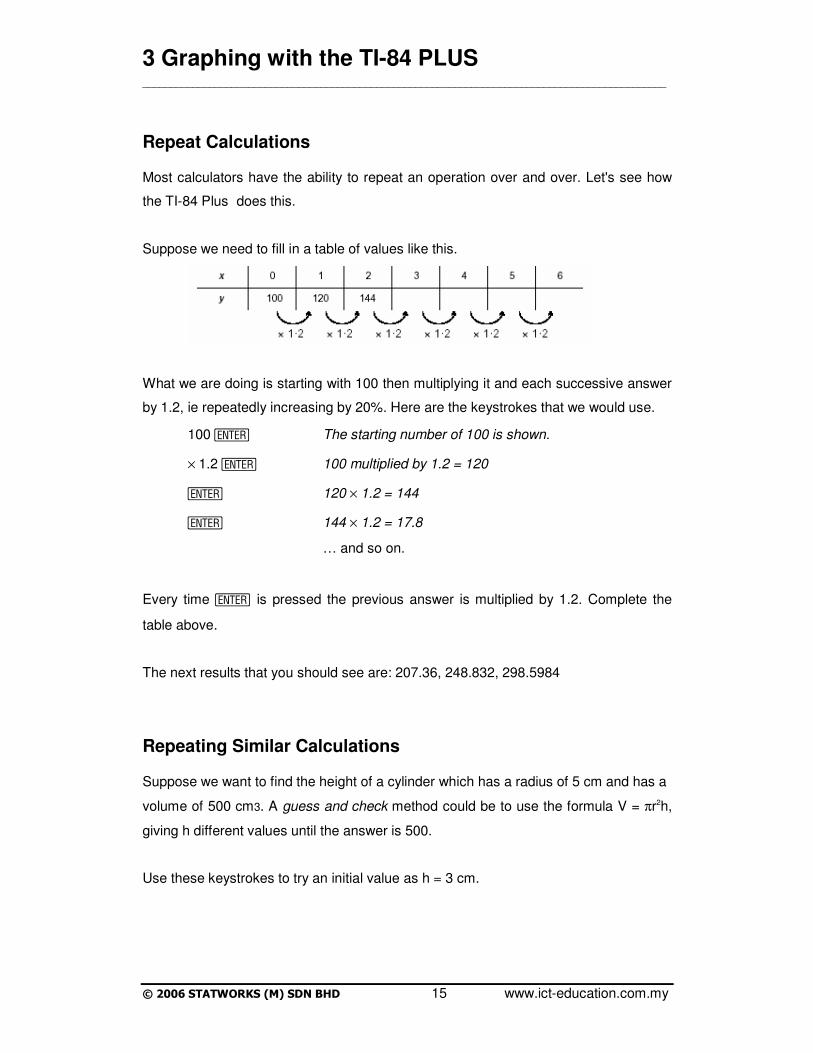
Suppose we need to fill in a table of values like this.
What we are doing is starting with 100 then multiplying it and each successive answer
by 1.2, ie repeatedly increasing by 20%. Here are the keystrokes that we would use.
100 Í The starting number of 100 is shown.
× 1.2 Í 100 multiplied by 1.2 = 120
Í 120 × 1.2 = 144
Í 144 × 1.2 = 17.8
… and so on.
Every time Í is pressed the previous answer is multiplied by 1.2. Complete the
table above.
The next results that you should see are: 207.36, 248.832, 298.5984
Repeating Similar Calculations
Suppose we want to find the height of a cylinder which has a radius of 5 cm and has a
volume of 500 cm3. A guess and check method could be to use the formula V = πr2h,
giving h different values until the answer is 500.
Use these keystrokes to try an initial value as h = 3 cm.
3 Graphing with the TI-84 PLUS
______________________________________________________________________________________________
© 2006 STATWORKS (M) SDN BHD 16 www.ict-education.com.my
π 52× 3 Í The value for V is 235·619… , obviously then
h = 3 cm is too little.
So we could next try h = 4 cm. Instead of entering the complete calculation again,
simply press
y Í You will now see the previous expression on the screen.
Use the cursor keys to replace 3 with 4, and again press Í. The key combination
of y Í recalls the previous expression. This can then be edited and an answer
recalculated.
If you continue this process of recalling the previous expression and trying other
values for h you should find that h = 6·37 cm (2 d.p.).
3 Graphing with the TI-84 PLUS
______________________________________________________________________________________________
© 2006 STATWORKS (M) SDN BHD 17 www.ict-education.com.my
Introduction : Graphing
Main Graphing Keys
The keys which are located just under the screen are the main ones used to create
and investigate graphs.
oooo This is the key used to enter the expression, or function, which you
want to graph.
pppp This key allows you to specify the scale for the x- and y-axes. This is
where you set the maximum values for x and for y that you wish to see
on the screen.
qqqq You can zoom in on a graph to show more detail - just like using a
magnifying glass. Or you can zoom out to see more of the graph if you
need to see the 'big picture'. Other options will be described as they are
needed later.
rrrr When you need to investigate how x and y values are changing, we use
the trace facility. It allows you to follow the path of a graph with a cursor,
and to read the coordinates of the point where the cursor is located
ssss Once you have told the calculator what you want to graph, pressing this
key then actually draws the graph.
There are other options printed in yellow above each of these keys. These are
accessed by first pressing y - their use will be explained later.

3 Graphing with the TI-84 PLUS
______________________________________________________________________________________________
© 2006 STATWORKS (M) SDN BHD 18 www.ict-education.com.my
How to create a Graph
Defining Functions to be Graphed
In order to graph a function, it must first be entered on the function list. Press o to go
to the function list. If there are any functions already defined, you can clear these by
moving the flashing cursor (using the ~ † etc. keys) to any position of the expression
itself (but not on the = sign), and press ‘.
You can define up to 10 different functions (labelled as Y1, Y2, Y3, etc.) and all or
some of these can be graphed simultaneously. If you wish to leave a function defined
but do not want it graphed, then move the flashing cursor to be over the = of that
expression, and press Í. The = sign will no longer be highlighted. To reselect a
function to be graphed, move the cursor to the = sign and press Í.
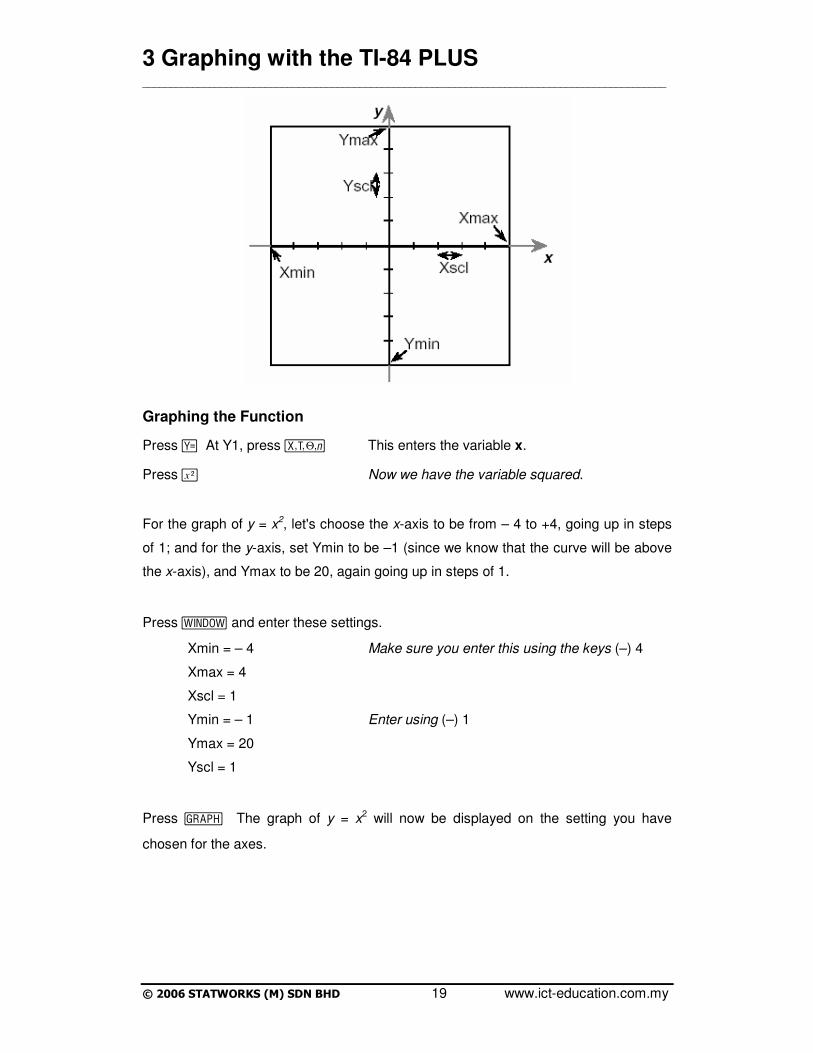
Defining Windows
Unless you specify otherwise, a graph will be displayed on the standard screen. For
this the x-axis is from –10 to +10 in steps of 1 unit, and the same for the y-axis. You
need to be aware of the settings for the axes so that you can interpret the graph, as no
scale is written on the axes. You can design the x and y axes for a graph by specifying
maximum and minimum values that you wish.
Press p . You will see the current information about the axes. You can change
any of these settings by overwriting them.
The setting Xscl means the scale for the marks along the x-axis; that is, the size of the
'jumps' between the maximum and minimum values. Similarly for Yscl. Xres sets the
pixel resolution.
If Xres = 1, the function is graphed at every pixel on the x-axis.
If Xres = 8, the function is graphed at every 8th pixel on the x-axis.
Generally we leave Xres = 1.
3 Graphing with the TI-84 PLUS
______________________________________________________________________________________________
© 2006 STATWORKS (M) SDN BHD 19 www.ict-education.com.my
Graphing the Function
Press o At Y1, press „ This enters the variable x.
Press ¡ Now we have the variable squared.
For the graph of y = x2, let's choose the x-axis to be from – 4 to +4, going up in steps
of 1; and for the y-axis, set Ymin to be –1 (since we know that the curve will be above
the x-axis), and Ymax to be 20, again going up in steps of 1.
Press p and enter these settings.
Xmin = – 4 Make sure you enter this using the keys (–) 4
Xmax = 4
Xscl = 1
Ymin = – 1 Enter using (–) 1
Ymax = 20
Yscl = 1
Press s The graph of y = x2 will now be displayed on the setting you have
chosen for the axes.

3 Graphing with the TI-84 PLUS
______________________________________________________________________________________________
© 2006 STATWORKS (M) SDN BHD 20 www.ict-education.com.my
Tracing the Function
A graph can be traced by pressing the r key. A flashing cursor ('star') appears on
the graph, the coordinates of that point are given at the bottom of the screen. The
equation on which the cursor is currently located is shown at the top left of the screen.
Use the ~ key to move the cursor to the right along the graph. Notice how the
coordinates given at the base of the screen of this point change. To move to the left,
use the | key. These coordinates are given to the number of decimal places specified
using the z key.
To remove the tracing cursor (and its coordinates) press ‘. The starting position
of the cursor is always at the central value for x on the screen. Since the window is set
for – 4 ≤ x ≤ 4, the central position is at x = 0.
Graphing a Second Function
1. Press o. At Y2, press „ This enters the variable x.
2. Press + 2
3. Press s
The graphs of y = x2 and y = x + 2 are both displayed. If we wish to investigate where
these two graphs intersect it will be more convenient to view over a smaller range of x
and y values.
4. Change these values using p (– 4 ≤ x ≤ 4 and – 1 ≤ y ≤ 5 is a good window to
use.)
5. Press s to return to the graph screen, and then press TRACE .
The flashing cursor will be on the curve of y = x2 - as indicated by the equation at the
top of the screen. Use the } (or † ) keys to move the cursor to the graph of Y2 (i.e. y
= x + 2), and the equation Y2 = x + 2 is now shown at the top of the screen.

3 Graphing with the TI-84 PLUS
______________________________________________________________________________________________
© 2006 STATWORKS (M) SDN BHD 21 www.ict-education.com.my
To determine the coordinates of the points of intersection, move the cursor (either
~ or | ), until it appears to be at the point of intersection and then read the
coordinates. (One point should be very close to x = 2, y = 4)
Zooming
In trying to locate the point of intersection of y = x2 and y = x + 2 when x is positive
(above) you may have noticed that the cursor 'jumps' and you may not be sure of its
position. This is when we need to 'zoom in' to magnify the graph.
With the cursor located as close as you can to the point of intersection, which we
know will be at (2,4),
Press q 2 The number 2 is pressed so that you zoom in. At this
stage you will be returned back to the graph, but nothing
seems to have changed - yet!
Press Í Now you will see a close up of the point of intersection!
Press r and use the cursor keys to locate the point of intersection more
accurately, and then zoom in again if you wish.
The keystrokes q 3 Í will undo the zooming process. Alternatively, q 6
Í will return you to the standard graph window, i.e. – 10 ≤ x ≤ 10 and – 10 ≤ y
≤ 10.
Evaluating at a specific x values
A very convenient feature is the ability to find the y-value for any graph at any
particular value for x.
Whilst you have the graphs on the screen, press y r and then choose the
option value. You will be returned to the graph screen and notice that the cursor is
positioned at the bottom of the screen and waiting for you to prompt it with an x value.

3 Graphing with the TI-84 PLUS
______________________________________________________________________________________________
© 2006 STATWORKS (M) SDN BHD 22 www.ict-education.com.my
Enter – 1, say - this means find the y-value of Y1 when x = – 1. After pressing Í
the value of y is also shown at the bottom of the screen; in this case, y = 1.
If you press } you will notice that the cursor moves to Y2, and you can also evaluate
Y2 at x = – 1. Since this will show you that Y2 also is 1 when x = – 1, you have
confirmed that the point (– 1, 1) is a point of intersection of the graph.
If you look at the graph, it appears that the other point of intersection is at x = 2. Try
evaluating Y1 and Y2 at x = 2 to confirm that this is the other point of intersection.
You will have probably realised by now that finding these points of intersection has
actually given you the solution of the equation
x2 = x + 2 or x2 – x – 2 = 0
Solving Equations
Algebraic equations can be solved graphically by finding where the equation intersects
with the x-axis, or by using an algebraic method. For a quadratic equation, an
algebraic method could be by factorizing or using the quadratic formula.
Using a graphics calculator any equation can be solved by either graphical or
algebraic means.
Graphical Solutions
There are two alternatives to use here:
1. You can graph the function and then use the Trace facility to zoom in on the
coordinates of the x-intercepts. Enlarge the region around the intercept until
you have the desired level of accuracy.
2. You can use the Calc facility and ask the calculator to find the roots of any
graph.
We will use the function f(x) = x3 – 3x2 + 2 to demonstrate both of these methods:

3 Graphing with the TI-84 PLUS
______________________________________________________________________________________________
© 2006 STATWORKS (M) SDN BHD 23 www.ict-education.com.my
The 'trace' method
Plot the function f(x) = x3 – 3x2 + 2.
1. Suggested window settings:
Xmin = – 2 Ymin = – 3
Xmax = 4 Ymax = 3
Xscl = 0·5 Yscl = 0·5
2. Press s The graph appears to have one root at x = 1, and the
other two are in the intervals – 1< x < – 0.5 and
2.5 < x < 3.
3. Press r You will notice that the cursor is at the point (1,0)
,because x = 1 is the centre of the screen. This confirms
that there is one root at x = 1.
4. Use the ~ key to put the cursor as close as possible to the root which is at x ≈ 2.7.
You will notice that you only need to use the ~ and | keys to move the cursor
along the path of the curve.
5. Press q 2 Í r Using TRACE ensures that the cursor
Stays on the curve when either → or
← are pressed. Position it as close as
possible to the intersection of the curve
and the x-axis.
6. Continue to press q 2 Í r until you have a value for the xintercept
which is to the required level of accuracy. (To 2 d.p., x = 2.73)
3 Graphing with the TI-84 PLUS
______________________________________________________________________________________________
© 2006 STATWORKS (M) SDN BHD 24 www.ict-education.com.my
7. To leave this enlarged screen, you can return directly to the standard screen by
pressing q 6 Í . Then reset the window to the settings as given at the
beginning. You can 'unzoom' by progressively pressing q 3 Í. However
this will not take you back to the original window, so the method above is probably
the easier one.
Finding the Roots of the Function Method
Plot the function f(x) = x3 – 3x2 + 2
1. Suggested window settings:
Xmin = – 2 Ymin = – 3
Xmax = 4 Ymax = 3
Xscl = 0.5 Yscl = 0.5
2. Press s The graph appears to have one root at x = 1, and the
other two are in the intervals – 1< x < – 0.5 and
2.5 < x < 3.
3. Press y r This accesses the Calc key.
4. Press 2 This chooses to calculate a zero (or root) of the
equation.
5. The graph is displayed with a prompt at the bottom of the screen to enter Left
Bound. This is a value for x which is less than the actual root. Use the cursor ~ or
| to move along the curve to locate an x value less than the required zero. Then
press Í . You will notice that a little black triangle appears at the top of the
screen - this is to let you know where you have selected the lower estimate for the
root.
6. You will now be prompted for an Right Bound, so use the cursor to move along
the curve to locate an x value greater than the required zero. Press Í, another
little triangle will appear to show you the interval that you have selected and from
which the zero will be determined.

3 Graphing with the TI-84 PLUS
______________________________________________________________________________________________
© 2006 STATWORKS (M) SDN BHD 25 www.ict-education.com.my
7. The calculator now asks you for a Guess. In other words, guess a value where you
think the zero is, but it must be between the Left Bound and the Right Bound.
Select this guess by moving the cursor back to the left and pressing Í
8. The coordinates of this root will now be displayed. The y coordinate will be 0 or
very close to it. The x coordinate is the value of the zero to an accuracy of as many
decimal places set using the z key.
For this example, you should find x = 2·7320508 (to 7 d.p.) is the zero of the equation
in the interval 2·5 < x < 3.
Repeat the procedure to find the zero which is in the interval – 0·5 < x < – 1.
You should find that this zero is at x = – 0·7320508 (to 7 d.p.)
Graph Views
On the TI-84, there are different ways that you can view a graph.
Practice Example
Graph Y1 = – x2 + 4x using a window of – 2 ≤ x ≤ 6, – 2 ≤ y ≤ 6 and both Xscl = Yscl
= 1. After pressing s you will see the graph with the standard view:
1. Press o then use the cursor keys to select the \ mark to the left of Y1.
2. Press Í. You will notice that the \ mark changes to a thick oblique line. This
changes the graph to one with a thick line.
3. Press s to have a peek.
4. Go back to o and again select the mark to the left of Y1.
5. Successively pressing Í changes the mark to the following options. Try them,
and then look at the resulting graph.

3 Graphing with the TI-84 PLUS
______________________________________________________________________________________________
© 2006 STATWORKS (M) SDN BHD 26 www.ict-education.com.my
Here's what each option does.

4 Lists and Statistics with TI-84 Plus
______________________________________________________________________________________________
© 2006 STATWORKS (M) SDN BHD 27 www.ict-education.com.my
Introduction
There are a few keys which are used frequently when analysing statistics. A brief description of the relevant ones is given.
Relevant Keys for Statistics
………… This key allows you to enter data as lists (when EDIT is chosen)
and the / option enables you to specify which calculations or
analysis you wish to carry out.
yyyy oooo This key combination accesses STAT PLOTS, and allows you
to define and view three different statistical graphs.
yyyy ………… You can access lists of data in this way. Up to 6 different lists
can be entered using the TI-84 Plus lists which are labelled L1
to L6, however you can generate more giving them your own
names. These can then be sorted into order, filled with a
constant or a sequence created and stored as a list.
Univariate Statistics
Entering Data as a List
Press … Í This chooses the 'Edit' feature.
You will now see a table on the screen - it is actually just 3 columns of the 6 standard
lists. For the time being we will only enter one list. The cursor should already be in L1
column, and you will see L1(1) at the base of the screen. You are ready to enter a
number into position 1 of list L1. Enter this list of 13 numbers into L1 as follows:
12 Í 13 Í 6 Í 26 Í 20 Í
4 Lists and Statistics with TI-84 Plus
______________________________________________________________________________________________
© 2006 STATWORKS (M) SDN BHD 28 www.ict-education.com.my
40 Í 15 Í 30 Í 16 Í
21 Í 31 Í 29 Í 18 Í
You can check the list at this stage to make sure you have not made any mistakes – if
you have, simply use the - key to select the incorrect entry and re-enter the correct
value by 'overwriting'.
If you wish you can sort the list into either ascending or descending order. To sort into
ascending order press … Á y À ¤ Í To check that this has been done,
press … Í .
Since there is only one list entered, calculation of statistical measures can only be
found for 1 variable.
Press … ~ À This returns you to the Home Screen and shows that 1-
Var Stats will be generated, but you have to tell the
calculator that data is in L1.
Press y À Í The 1-Var Stats will be calculated and displayed.
You will need to use the ↓ to see all the summary
statistics.
Unless you specify otherwise, the calculator assumes that the data is in L1 and that
the frequency of each score is 1. So for this situation, simply pressing Í will
calculate the required one variable statistics. You should find that the mean is
21·30769231 and the median is 20.
Note:
Sx means the sample standard deviation
σx means the population standard deviation
Q1 is the lower quartile and Q3 is the upper quartile

4 Lists and Statistics with TI-84 Plus
______________________________________________________________________________________________
© 2006 STATWORKS (M) SDN BHD 29 www.ict-education.com.my
Clear a List
There are a few ways that this can be done:
1. After choosing … Í you can manually delete (by pressing {), each
list value individually - pretty tedious eh?
2. Press … ¶; you then need to specify which lists are to be cleared. Press
y 1 to clear L1, 2nd 2 to clear L2 … and so on. Each of these must be
separated by a comma ¢.
3. After choosing … Í if you use the arrow keys to place the cursor over
the heading for L1, then just press ‘ Í and the whole list will be
deleted.
4. Pressing y à takes you to the Memory menu. Press Á to select Delete,…
and ¶ to ask for a List to be deleted. Use the cursor keys to move the small
triangle to the list you want to delete, then press Í.
Build A Histogram
A frequency table of data such as the following is entered with the scores in one list
(perhaps L1) and the frequencies in another list (say, L2), or vice versa - it doesn't
matter, as long as you know which list represents what.
Alternatively, you can choose to name these lists, perhaps as SCORE and FREQ.
Instructions to name list is given later.

4 Lists and Statistics with TI-84 Plus
______________________________________________________________________________________________
© 2006 STATWORKS (M) SDN BHD 30 www.ict-education.com.my
Press p to set the axes for the histogram as you want them. Perhaps going
from 0 - 11 along the horizontal axis, and 0 - 15 for the vertical axis. Both the x
scale and the y scale should be 1.
Use … PLOTS to ensure that only one graph is ON - otherwise you may find it
confusing if two or more graphs are superimposed.
Choose whichever plot is convenient, though we will choose Plot 1.
Press y o À Make sure that Plot 1 is ON by pressing
ENTER when the cursor is flashing here
† ~ ~ Ò Í You should now have the flashing cursor over
the histogram icon.
y À To select L1 for the Xlist, and
y Á For L2 as the frequency.
s The histogram should now be displayed.
Naming A List
As with many of the functions and operations of the calculator there is more than one
way to name a list.
We'll use the frequency data above and enter these under the names SCORE and
FREQ.
Press … Í. This takes you to the screen showing lists and the cursor is already
in L1.

4 Lists and Statistics with TI-84 Plus
______________________________________________________________________________________________
© 2006 STATWORKS (M) SDN BHD 31 www.ict-education.com.my
Move the cursor over the heading for L1 and then press 2nd DEL (i.e. INS ) This
creates a new list, and moves all the other lists, L1 to L6, to the right.
You will be prompted for a name at the bottom of the screen and alpha lock is on, so
you use the keys to spell the name SCORE.
Then press Í The name is transferred to the top of the list. Move the cursor over
the heading for L1 and go through the same process to enter the name FREQ.
Bivariate Statistics
When we are dealing with two data lists, usually we need to calculate statistical
information about the two separate lists, and also about how the two lists are related.
That is, we are interested in the bi-variate statistics.
To illustrate the use of the TI-84 for the calculation of bi-variate statistics, work through
the following example.
Practice Example
The following data shows IQ and corresponding results of a Scholastic Aptitude Test
(AST) for 10 people.
For this data
(a) determine the summary statistics
(b) plot a scatter diagram
Solution:
Enter the x data into L1 and the y data into L2.

4 Lists and Statistics with TI-84 Plus
______________________________________________________________________________________________
© 2006 STATWORKS (M) SDN BHD 32 www.ict-education.com.my
Press … ~ Á This returns you to the Home Screen and indicates
that 2-Var Stats will be calculated. The cursor will be
prompting you to enter the Xlist and Ylist, separated by
a comma.
Press y À , y Á then Í The statistics are now displayed. You will need to use
the ↓ key to see all the summary statistics.
First set the range for x and y values using WINDOW . ( To predict for a SAT score of
145 Xmax should be >145.)
Suggested:
Xmin = 90 Xmax = 150 Xscl = 5
Ymin = 40 Ymin = 90 Yscl = 5
Press y o Í You have chosen Plot 1, Ensure that it is ON, and
use the cursor arrows to choose the 'scatter plot'
icon. At this stage also check that x and y data are
being read from the correct lists.
Press s The scatter diagram is now displayed.

5 Special Features
______________________________________________________________________________________________
© 2006 STATWORKS (M) SDN BHD 33 www.ict-education.com.my
Introduction : Special Features
Flash Technology
The TI-84 Plus uses Flash technology, which lets you upgrade to future software versions without buying a new calculator. As new functionality becomes available, you can electronically upgrade your TI-84 Plus from the Internet.
Future software versions include maintenance upgrades that will be released free of charge, as well as new applications and major software upgrades that will be available for purchase from the TI web site: education.ti.com The TI84 Plus has 160K of available memory whereas the TI-84 Plus Silver Edition has 1.56 M. About 24 kilobytes (K) of RAM (random access memory) are available for to compute and store functions, programs, and data. About 1.54 M of user data archive allow you to store data, programs, applications, or any other variables to a safe location where they cannot be edited or deleted inadvertently. You can also free up RAM by archiving variables to user data
Applications can be installed to customize the TI-84 Plus to your classroom needs. The big 1.54 M archive space lets you store up to 94 applications at one time. Applications can also be stored on a computer for later use or linked unit-to-unit.
Press Πto see the complete list of applications that came with your calculator.
Data Collection Devices with the TI-84 Plus
The TI-84 Plus comes with the CBL/CBR application already installed. When coupled with the CBL 2 or CBR accessories, you can use the TI-84 Plus to analyze real world data. CBL 2 and CBR with the available probes let you explore mathematical and scientific relationships among distance, velocity, acceleration, and time using data collected from activities you perform. CBL 2 and CBR differ in that CBL 2 allows you to collect data using several different probes analyzing temperature, pH, light, voltage, or sonic (motion) data. CBR collects data using a built-in Sonic probe. CBL 2 and CBR accessories can be linked together to collect more than one type of data at the same time. These handheld data collection devices together with the TI-84 Plus will be explained further in the Science sessions.
5 Special Features
______________________________________________________________________________________________
© 2006 STATWORKS (M) SDN BHD 34 www.ict-education.com.my
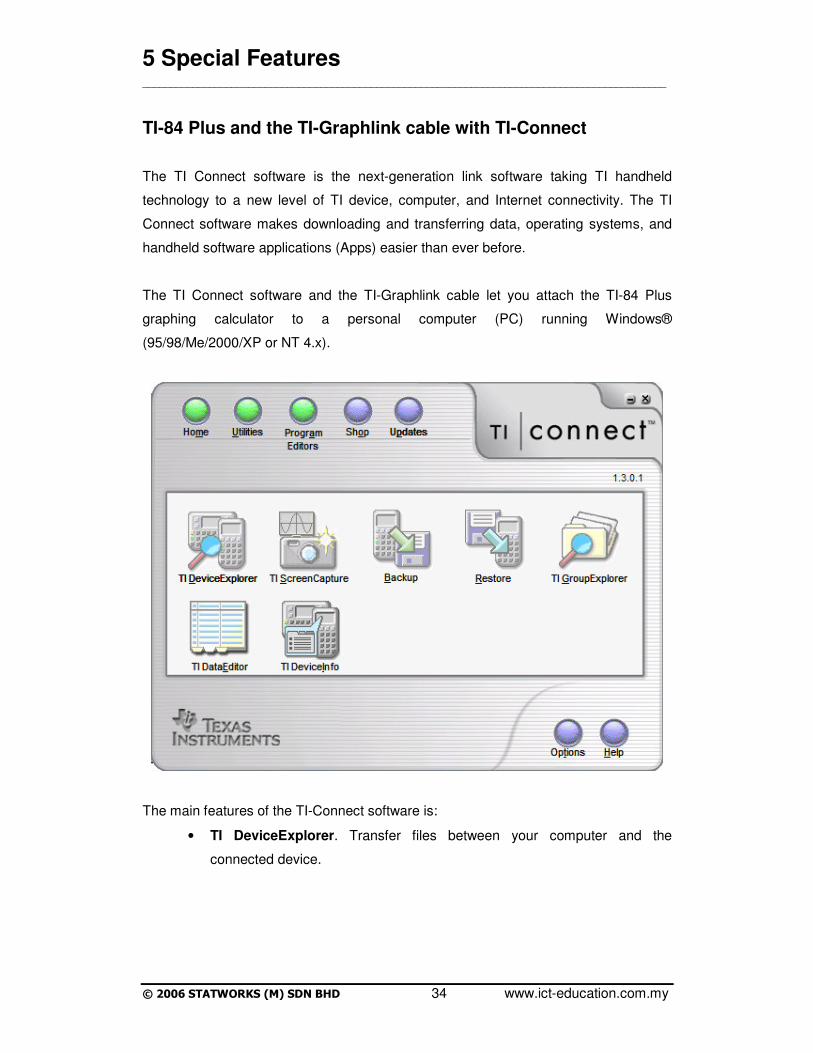
TI-84 Plus and the TI-Graphlink cable with TI-Connect
The TI Connect software is the next-generation link software taking TI handheld
technology to a new level of TI device, computer, and Internet connectivity. The TI
Connect software makes downloading and transferring data, operating systems, and
handheld software applications (Apps) easier than ever before.
The TI Connect software and the TI-Graphlink cable let you attach the TI-84 Plus
graphing calculator to a personal computer (PC) running Windows®
(95/98/Me/2000/XP or NT 4.x).
The main features of the TI-Connect software is:
• TI DeviceExplorer. Transfer files between your computer and the
connected device.
5 Special Features
______________________________________________________________________________________________
© 2006 STATWORKS (M) SDN BHD 35 www.ict-education.com.my
• TI GroupExplorer. Combine device files into groups and then move those
grouped files back and forth between the device and your computer.
• TI ScreenCapture. Capture screens from the attached device. Paste the
captured screens into another application or save them to a file on your
computer.
• TI DataEditor. Create, display, and modify List, Number, or Matrix files.
• TI DeviceInformation. Find information about your device, including
general information, installed applications, and ID Lists.
• Shop. The TI Connect software provides limited World Wide Web access
that lets you browse the TI Online Store, locate and download operating
system upgrades, purchase applications, and receive product support.
• Backup. Backup device files (except Flash applications) onto your
computer.
• Restore. Restore backed-up files to your device.
• Options. Specify the type of device that is connected to your computer,
select the start-up screen to display, select your default directories, enable
or disable the check for an upgraded operating system, or change your
communication settings.
• Updates. Scan the TI Online Store automatically to locate a new device
operating system or application upgrades. Choose to upgrade now, save
the upgrades to your computer so you can upgrade later, or cancel.
• Utilities. Start other TI applications from your computer, including TI
CellSheet™ Converter, TI StudyCards™ Creator, TI InterActive!™
software, and TI NoteFolio™ Creator.

5 Special Features
______________________________________________________________________________________________
© 2006 STATWORKS (M) SDN BHD 36 www.ict-education.com.my
The TI Connect software does not emulate the connected handheld device. The TI
Connect software is designed for you to use in conjunction with the handheld device,
not in place of it. The TI Connect software does not perform on-screen computations
nor does it have graph functions.
TI-Connect Homescreen
You can launch software applications from the Home screen, Utilities screen, and
Program Editors screen.
Note: The software applications available under Utilities and Program Editors do not
come with the TI Connect™ software. You must download or purchase these
applications from the TI Connect Store.
From the Home screen, you can launch TI DeviceExplorer, TI ScreenCapture, TI
GroupExplorer, TI DataEditor, and TI DeviceInformation.
1. Click Home.
2. Click the desired application.
From the Utilities screen, you can launch TI CellSheet™ Converter, TI StudyCards™
Creator, TI InterActive!™ software, and TI NoteFolio™ Creator.
1. Click Utilities.
2. Click the desired application.
From Program Editors, you can launch the TI-GRAPH LINK application. To launch
these application:
1. Click Program Editors.
2. Click the desired application.

5 Special Features
______________________________________________________________________________________________
© 2006 STATWORKS (M) SDN BHD 37 www.ict-education.com.my
Connecting A device
You can connect a TI handheld device to your computer by using a TI-GRAPH LINK™
Serial cable for Windows® (black), a TI-GRAPH LINK Serial cable for Windows/Mac®
(gray), or a TI-GRAPH LINK USB cable for Windows/Mac (silver). A 9-pin to 25-pin
cable adapter is required only if you are connecting to a 9-pin serial port on the
computer.
To Connect Your Device with a TI-GRAPH LINK Serial Cable (Black or Gray)
1. Connect one end of the cable to the computer’s serial port.
2. Connect the other end of the cable to the port on the device.
To Connect Your Device with a TI-GRAPH LINK USB Cable (Silver)
1. Make sure you have installed the TI Connect™ software (see caution below).
2. Connect one end of the TI-GRAPH LINK USB cable to the computer’s USB
port.
3. Connect the other end of the cable to the port on the device.
Caution: Always connect the TI-GRAPH LINK USB cable after you install the TI
Connect software. If you connect the TI-GRAPH LINK USB cable before you install the
TI Connect software and you are using Windows® XP, Windows 2000, Windows Me,
or Windows 98, the incorrect driver may be installed and you will have to re-install the
USB driver.
Updating device software
Click Updates to update the operating system and/or Flash application software on the
connected device. You must have an active connection to the Internet to update Flash
applications, but you do not need an active connection to the Internet if you are
updating the operating system. The TI Connect™ software includes the latest device
operating systems.

5 Special Features
______________________________________________________________________________________________
© 2006 STATWORKS (M) SDN BHD 38 www.ict-education.com.my
The instructions below describe checking for updates and updating your device's
operating system, free Flash applications, and purchased Flash applications. If Check
for new software on every startup is your default setting, you do not need to check for
updates. With this setting, the TI Connect software automatically checks for an
updated operating system every time you start up.
Caution: Do not disconnect a USB cable during the update.
TI DeviceExplorer Overview
Click TI DeviceExplorer to work with your device files. With TI DeviceExplorer and a TI
device connected to your computer, you can
• Copy device files to your computer
• Copy computer files to a connected device
• Move device files to your computer
• Edit device files
• Delete device files

5 Special Features
______________________________________________________________________________________________
© 2006 STATWORKS (M) SDN BHD 39 www.ict-education.com.my
• Backup your device
• Restore backups to your device
• Manage device date and time
• Update the device's operating system
• Refresh device files in the TI DeviceExplorer window
Transferring device files using drag and drop
If you have device files located on your computer, you can drag a file and drop them
onto the TI Connect™ desktop icon for a quick transfer to the device. Here are a
couple of ways to transfer a file to your connected handheld device quickly without
actually starting the TI Connect software.
To transfer device files located on your hard drive:
1. Using Windows® Explorer, locate the device file you want to transfer to the
connected device.
2. Reduce the size of the Windows Explorer window so you can see the TI
Connect desktop icon.
3. Click the device file you want to transfer.
4. Drag the device file out of Windows Explorer and drop it on the TI Connect
desktop icon.
To transfer device files located on your desktop:
1. Click the device file that you want to transfer.
2. Drag the device file and drop it on the TI Connect desktop icon.
Cautions:
• Do not disconnect a USB cable during a transfer.
• You can accidentally overwrite a file located on the connected device. If the file
name of the application variable (AppVar) or third-party data type you are
transferring to the device begins with a digit, and that file exists on the
connected device, TI DeviceExplorer does not ask if you want to replace it, it
simply replaces it.

5 Special Features
______________________________________________________________________________________________
© 2006 STATWORKS (M) SDN BHD 40 www.ict-education.com.my
Notes:
• The total length of the full path and file name must be less than 128 characters
when performing a drag-and-drop operation.
• You may receive an Out of Memory error message if you transfer a large file
from your device to your computer and then try to send it back to your device.
This happens because the device was at its memory limit when the large file
was saved.
Backing up device files
Click Backup to back up your device to your computer. It’s always a good idea to
perform an occasional backup of your device files. Backup does not back up Flash
applications.
To backup the device to your computer
1. Make sure the device is properly connected to your computer and is turned on.
2. On the TI Connect™ home screen, click Backup.
The TI Connect software displays the Save As window.
1. Navigate to the location on your computer where you want to put the backup
file.
2. Enter a backup file name.
3. Click Save.
Caution: Do not disconnect a USB cable during the backup.
Restoring backed-up device files
Click Restore to restore files backed up on your computer back to your device.
To restore the backed up files to your device
1. Make sure your device is properly connected to your computer and is turned
on.

5 Special Features
______________________________________________________________________________________________
© 2006 STATWORKS (M) SDN BHD 41 www.ict-education.com.my
2. On the TI Connect™ home screen, click Restore.
The TI Connect software displays the Open window.
1. Navigate to the location on your computer where you put the backup file.
2. Click the backup file to select it.
3. Click Open.
Caution: Do not disconnect a USB cable during a transfer.
TI ScreenCapture overview
Click TI ScreenCapture to capture and edit device screens. You can then paste them
into other applications, save them as a file on your computer, or send them to the
device connected to your computer. TI ScreenCapture also gives you additional
capabilities for customizing your captured screens, such as adding borders, changing
image size, and rotating images.
• Use TI ScreenCapture to
• Capture screens

5 Special Features
______________________________________________________________________________________________
© 2006 STATWORKS (M) SDN BHD 42 www.ict-education.com.my
• Add borders to images
• Paste captured screens
• Flip images
• Resize images
• Rotate images
• Edit images
• Print images
• Save captured screens
• Send images to a device
Capturing device screens
To capture a device screen
1. Be sure the device is connected to your computer and is turned on.
2. On your device, display the screen you want to capture.
3. On the TI Connect™ home screen, click TI ScreenCapture.
TI ScreenCapture starts, connects to the device, captures the screen, and displays it
on your computer.
4. To capture another screen, click Actions > Get Screen.
Notes:
• TI ScreenCapture cannot capture a device screen if the ComPort is busy. For
example, you cannot capture a screen image while a transfer is in progress.
• You can display up to a maximum of 20 images at one time, from either new
screen captures, saved image files, or any combination.
Saving captured screens
To save the captured screen as a file on your computer

5 Special Features
______________________________________________________________________________________________
© 2006 STATWORKS (M) SDN BHD 43 www.ict-education.com.my
1. In TI ScreenCapture, display the captured screen you want to save.
2. Click File > Save As.
3. Navigate to the location on your computer where you want to store the captured
screen.
4. Select the file type (.jpg, .bmp, or a device-specific file type).
5. Click Save.
Note: Saved screens are always slightly larger than the actual screen image captured
from the device.
Sending images to a device
You can send an image to the connected device by using TI ScreenCapture,
Windows® Explorer, or TI DeviceExplorer.
To send an image to the connected device using TI ScreenCapture
1. Capture a device screen or open an existing image file.
2. Click Actions > Send To Device.
TI ScreenCapture displays the Send Picture window.
3. Depending on the type of device connected to your computer, either enter a
name for the image or select a name from the list.
4. Click OK.
To send an image file to the connected device using Windows Explorer
1. Start Windows Explorer.
2. Navigate to the directory that contains your image file.
3. Right-click the image file you want to send to the device.
4. Select Send To.
5. Select Connected TI Device.
6. Select Archive or RAM.

5 Special Features
______________________________________________________________________________________________
© 2006 STATWORKS (M) SDN BHD 44 www.ict-education.com.my
To send an image file to the connected device using TI DeviceExplorer
Caution: Do not disconnect a USB cable during a transfer.
Deleting device applications
Your handheld device has only a limited amount of memory available. Therefore, in
order to install additional applications, you may have to delete one of your other
applications to free up more memory.
To delete an application from the TI-84 Plus or TI-84 Plus Silver Edition
1. Press 2nd MEM to display the MEMORY menu.
2. Select 2:Mem Mgmt/Del.
3. Select A:Apps.
4. Select the application you want to delete
5. Press DEL.
6. Select 2:Yes.
TI-Interactive with the TI-84 Plus
TI InterActive!™ is a user-friendly, interactive computer software program that enables
school and college teachers and students to easily investigate ideas in mathematics
and science. Teachers can enhance students’ learning through interactive lessons that
encourage exploration, visualization, data analysis, and writing. TI InterActive! can
help students master math and science concepts and improve problem-solving skills.

5 Special Features
______________________________________________________________________________________________
© 2006 STATWORKS (M) SDN BHD 45 www.ict-education.com.my
Features
• Word processor with integrated math system
• TI graphing calculator functionality
• Symbolic Computer Algebra System
• Integrated Web browser
• Data editor with spreadsheet
• Calculator connectivity
The Math Box
1. Click the Math Box Button on TI-InterActive toolbar. An empty Math
Box is inserted, accompanied by the TI Math Palette.
2. Type your expression, for example, 2^8*43/12 into the Math Box. Press
the Enter key or click enter on Math Palette to evaluate the expression. TI-
InterActive creates another Math Box.
5 Special Features
______________________________________________________________________________________________
© 2006 STATWORKS (M) SDN BHD 46 www.ict-education.com.my
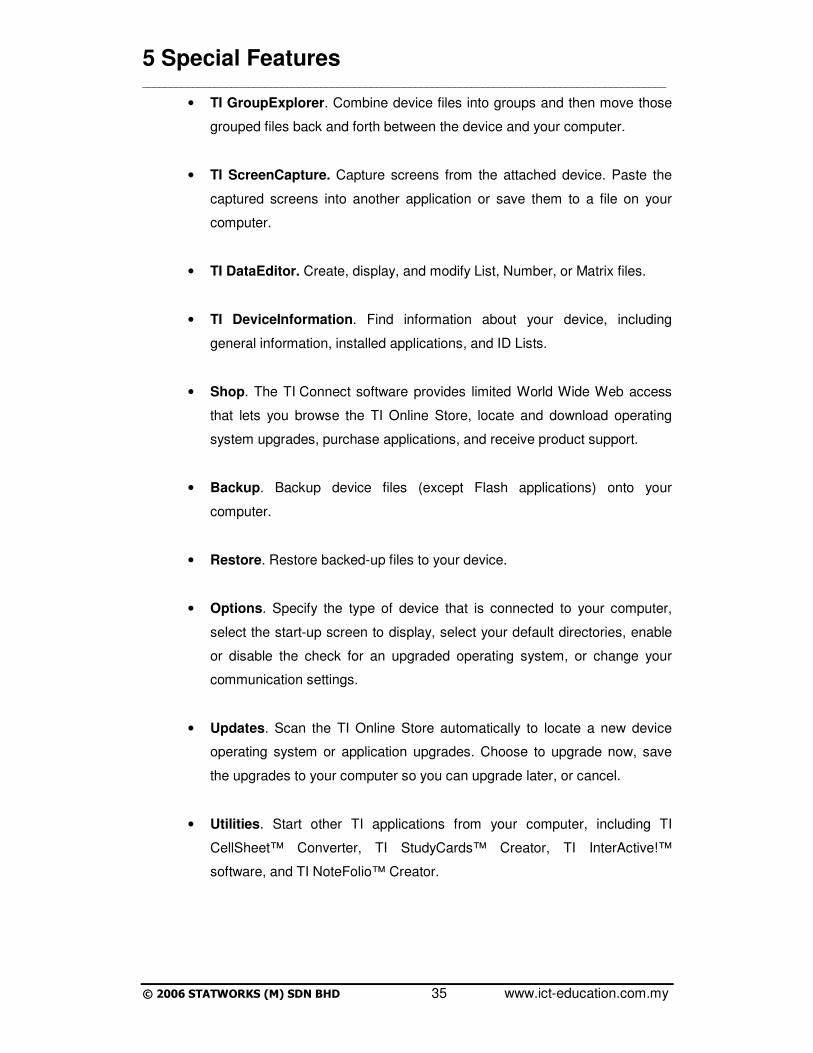
The Math Palette
The TI Math Palette resembles a
calculator keyboard. If you prefer to
use the mouse instead of the
keyboard, you can click the buttons on
to the palette. 1. Click to the right and below the
Math Box that you have already
entered, and press Enter. This places
the cursor at the end of the document.
2. Click the Math Box button . An
empty Math Box is inserted beneath
the previous one. 3. In the Math Palette, which opens
automatically when you open a Math
Box, you can type fraction, exponents
and different roots, using the
appropriate buttons.
4. The light blue and green
keys have hidden menus, click
on the box in TI-InterActive and hold
mouse down to see the hidden
operations.

5 Special Features
______________________________________________________________________________________________
© 2006 STATWORKS (M) SDN BHD 47 www.ict-education.com.my
Graphing Function
Create a graph in a new document, or report in Ti-InterActive. 1. On the Ti-InterActive toolbar, locate the Graph button and click the down
arrow nest to it. A group of buttons is displayed, representing the available
graph types.
2. Click the Y= button. The Function editor is displayed along with the
Graph Window.
3. Click the Save to Document button , to insert graph in document
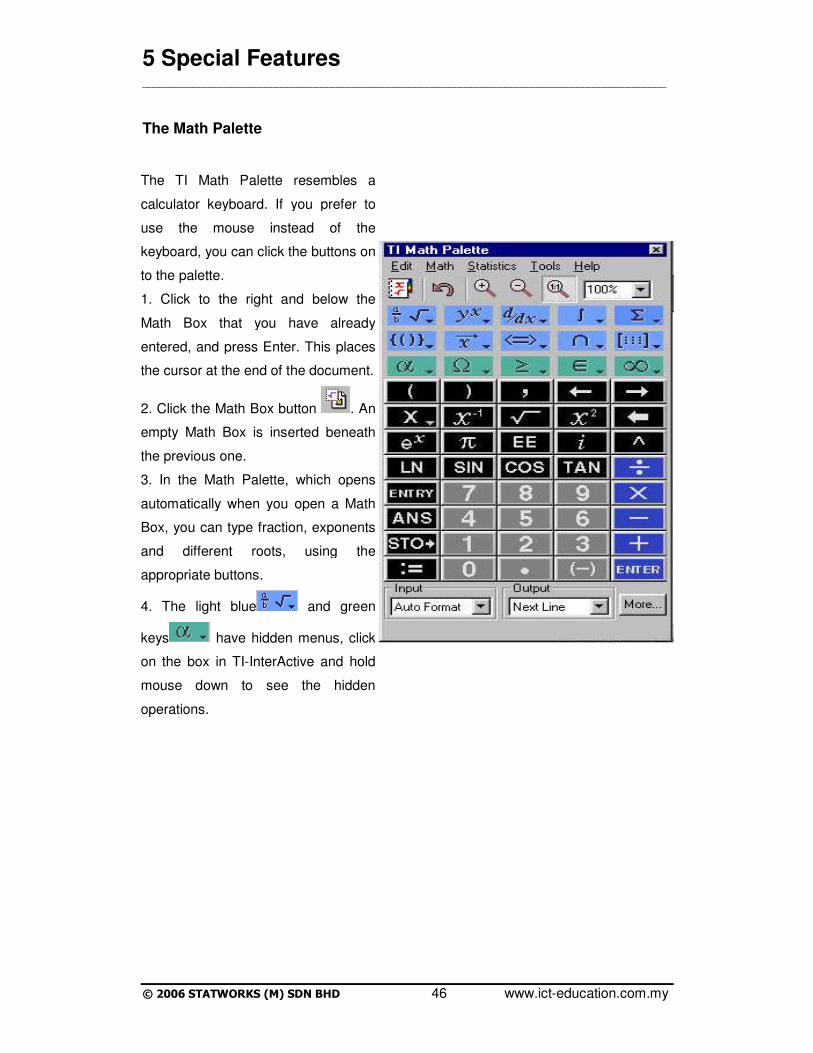
Changing the maximum and minimum values on graph. 1. Double clicking on the graph when it is in document will open the Function
options, where you can use Zoom options or x and y axis field boxes to
change size of the values.
5 Special Features
______________________________________________________________________________________________
© 2006 STATWORKS (M) SDN BHD 48 www.ict-education.com.my
Data Analysis
Enter statistical data using the List Editor.
1. On the Ti-InterActive toolbar, click the List button . The List Editor is
displayed, with the empty cell at the top of L1 already selected and ready for
an entry. 2. Type in the data, and then press the down arrow key on the computer
keyboard to move to the next cell. Key in all data using the arrow keys.
3. When all data is entered, click the close document button . The list will
be inserted into a document.
Viewing the plotted data.

5 Special Features
______________________________________________________________________________________________
© 2006 STATWORKS (M) SDN BHD 49 www.ict-education.com.my
1. In the Graph window, select all the data to be included in your graph,
then click the Zoom Statistics button . The viewing boundaries are
adjusted automatically to show all the plotted points.
2. Click Save to Document button to close the Graph window and insert the graph in the document.
Calculating a regression on the data. 1. Ti-InterActive allows you to calculate several types of regressions on data
stored in lists.
2. Click the Stat Calculation button on the Ti-InterActive toolbar. The
Statistics Regression Calculation tool is displayed. 3. Click the down arrow next to the Calculation Type, scroll down the through
the list, and click on the type you would like. 4. In text box labeled X List: Type L1. 5. In test box labeled Y List: Type L2. 6. Click Calculate to calculate the regression equation and its variables. 7. Click the Save Results button. Ti-InterActive stores the results in
variables, and displays the selected results tin your document.

5 Special Features
______________________________________________________________________________________________
© 2006 STATWORKS (M) SDN BHD 50 www.ict-education.com.my
Plotting the Regression 1. With cursor positioned at end of the regression results, press Enter on the
computer keyboard, type the heading Graphed regression equation, (or a
title to you graph) and press enter again. (Hint: it is a good idea to separate
graphs vertically on page, with several spaces.)
2. On the TI-InterActive toolbar, click Graph button . 3. Click the Plots tab.
4. In the uppermost text box, type the name of your first set of data L1. 5. In the second text box, type the name of your second set of data, L2. 6. Press Enter on keyboard. (Check the check box at left if it not checked.) 7. Select the f(x) tab. 8. In the uppermost text box of the f(x), type regEQ(x) and then press Enter
on the computer keyboard. TI-InterActive graphs the regression equation.
9. Click the Zoom Statistics button in the Graph window to adjust the

5 Special Features
______________________________________________________________________________________________
© 2006 STATWORKS (M) SDN BHD 51 www.ict-education.com.my
viewing boundaries. 10. Format the graph to show the relevant portion of the function.
11. Click the Save to Document button to close the Graph window and
insert the graph in the document. You can visually compare the plotted data
and graphed regression equation.
Connecting a Graphing Calculator
You can connect a TI-84 Plus to your computer and export data to the calculator or import data from the calculator.
Connecting the calculator to your computer.
1. The calculator needs to be connected to your computer, do this with a TI-
Graph Link. These come in either gray or black, the link cord has a serial
port either to connect to either port 1 or port 2 of your computer. Reboot
your computer when connected and start TI-Interactive!.
2. Click the Calculator Data Transfer button at the top of the browser
window. 3. Be sure your Communications Setting are correct... set type of calculator, type of graph link and port of computer.
Capturing the calculator screen for a word processing document. 1. Do the computations you need on your calculator. 2. Put cursor on place in your document, where screen shot is to be inserted.
3. With the calculator connected, click the Click the Insert Calculator Screen
Button. 4. The calculator screen should be inserted into your document.
Importing data from calculator to Computer.

5 Special Features
______________________________________________________________________________________________
© 2006 STATWORKS (M) SDN BHD 52 www.ict-education.com.my
1. With the calculator connected to the computer, Click the Calculator Data
Transfer button at the top of the browser window. 2. You can also drag-and-drop objects between the computer and calculator.
If you drag to the computer, drop the objects on the applicable folder. If you
drag to the calculator, drop the objects on the calculator name at the top of
the calculator pane. 3. If you have problems, use the help button on the bottom of the screen on
the Calculator Data Transfer Screen.

References
______________________________________________________________________________________________
© 2006 STATWORKS (M) SDN BHD 53 www.ict-education.com.my
Acknowledgements
This material has come from a variety of sources:
• Graphing Calculator Lab Manual to accompany Calculus: Modeling and Application
by Lewis Blake, David Smith
• Samuel Morris and Lawrence Moore, Heath Publications, 1996; from Calculating
on the TI-82 by Barry Kissane at wwwstaff.murdoch.edu.au/~kissane under
Publications;
• Using the TI-83 by M.J. Clark at www.eddept.wa.edu.au/graphcalc/sup;
• Integrating the Graphic Calculator into Year 9 and 10 NSW Mathematics Syllabus,
T3 Australasia, 1998.
• The TI-83 Plus Web tutorial by Peter McIntyre, School of Mathematics and
Statistics, University College (UNSW), Australian Defence Force Academy
• The TI-83 Plus User Guide – Texas Instruments
• TI-Interactive Online - ACETTC, Richard Stockton College
• TI-Connect Online Help – Texas Instruments