Introduction.doc
217
U. S. Department of Education Enterprise Transition Strategy Plan February 29, 2008 FINAL Version 1.2
-
Upload
timothy212 -
Category
Documents
-
view
1.025 -
download
13
description
Transcript of Introduction.doc
U. S. Department of Education
Enterprise Transition Strategy Plan
February 29, 2008
FINAL
Version 1.2
Department of Education
Enterprise Transition Strategy Plan, February 2008
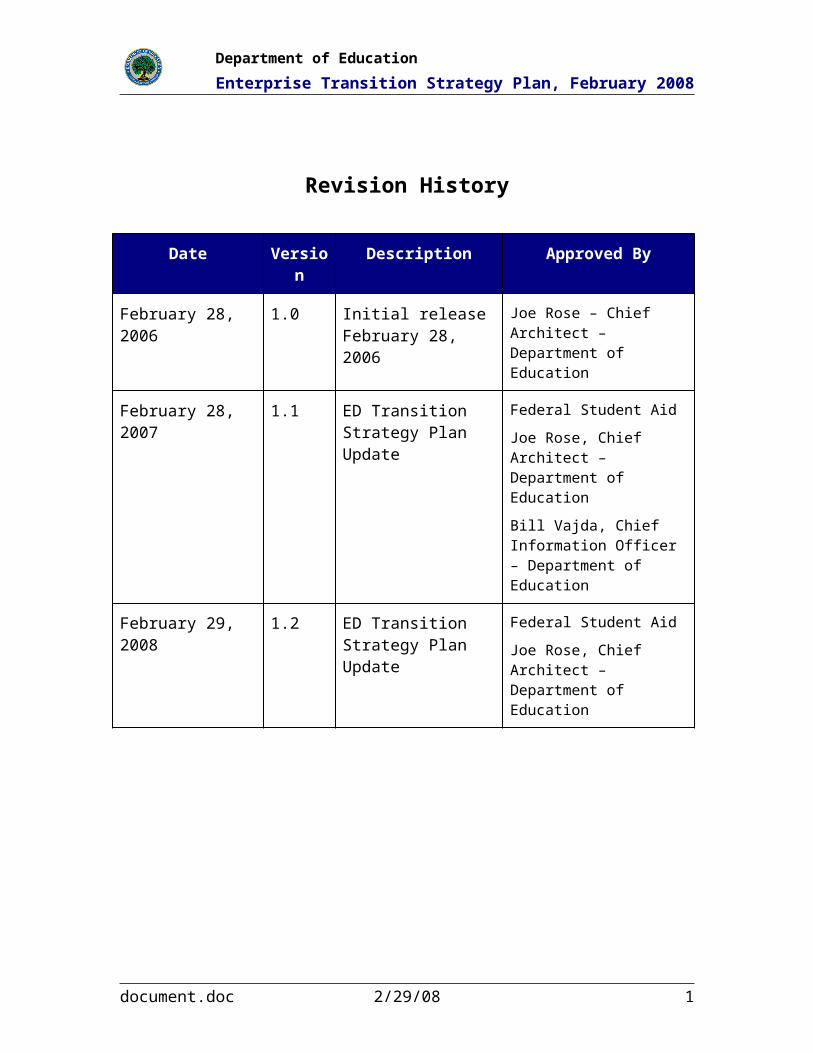
Revision History
Date Version Description Approved By
February 28, 2006 1.0 Initial release February 28, 2006
Joe Rose – Chief Architect – Department of Education
February 28, 2007 1.1 ED Transition Strategy Plan Update
Federal Student Aid
Joe Rose, Chief Architect – Department of Education
Bill Vajda, Chief Information Officer – Department of Education
February 29, 2008 1.2 ED Transition Strategy Plan Update
Federal Student Aid
Joe Rose, Chief Architect – Department of Education
document.doc 2/29/08 1

Department of Education
Enterprise Transition Strategy Plan, February 2008
Table of Contents
REVISION HISTORY......................................................................1
1.0 INTRODUCTION........................................................61.1 Overall Plan.................................................................61.2 Background.................................................................81.3 Framework..................................................................8
1.3.1 Step 0 – Baseline and Target Architecture Development.......................9
1.3.2 Step 1 – Redundancy and Gap Analysis..............................................10
1.3.3 Step 2 – Refine, Prioritize, Develop Segments....................................10
1.3.4 Step 3 – Define Programs and Projects...............................................10
1.3.5 Step 4 – ED Transition Sequencing Plan.............................................10
2.0 ED BASELINE AND TARGET ARCHITECTURE OVERVIEW......122.1 Baseline Enterprise Architecture.................................122.2 Future State Vision....................................................13
2.2.1 Lines of Business (LOB’s)....................................................................14
2.2.2 Primary IT Delivery Organizations........................................................17
3.0 REDUNDANCY AND GAP ANALYSIS...............................183.1 Redundancy Analysis..................................................18
3.1.1 Simplified ED Service Reference Model (SRM) Process.....................18
3.1.2 Simplified ED SRM Components..........................................................20
3.1.3 Common Enterprise Services (CES)....................................................21
3.1.4 EA Areas of Redundancy Under Investigation.....................................223.2 Gap Analysis..............................................................23
3.2.1 Performance Gap Analysis...................................................................23
3.2.2 Required Business Capabilities............................................................32
4.0 REFINE AND PRIORITIZE SEGMENTS.............................354.1 Core Mission Segments..............................................354.2 IT Spend Analysis.......................................................36
5.0 DEFINE PROGRAMS AND PROJECTS..............................395.1 Program Description..................................................395.2 Project Description.....................................................405.3 ED Programs and Projects..........................................40
5.3.1 ED Projects per Program and Completed Segment Architecture.........40
document.doc 2/29/08 2
Department of Education
Enterprise Transition Strategy Plan, February 2008
5.3.2 ED Projects per Program and Segment Architecture...........................455.4 Dependencies between Transition Programs and Projects
475.4.1 Project Dependencies per Program and Completed Segment
Architecture..........................................................................................49
5.4.2 Project Dependencies per Program & Segment Architecture..............515.5 ED Project – CES Linkage............................................52
5.5.1 Using ED’s TSP: CES Investments.....................................................56
6.0 ED TRANSITION SEQUENCING PLAN............................596.1 Transition Strategy Plan Timeline Overview................59
6.1.1 ED Projects Life Cycle Start/End Dates per Completed Segment........62
6.1.2 ED Projects Life Cycle Start/End Dates per Segment..........................64
7.0 IT INVESTMENT MILESTONES.....................................677.1 Implementation Milestones.........................................677.2 FSA Investment Milestones.........................................677.3 G5 Milestones............................................................687.4 Data Warehouse Milestones........................................697.5 EDUCATE Milestones..................................................737.6 CPSS Milestones........................................................837.7 FMSS Milestones........................................................867.8 ISS Milestones...........................................................897.9 TMS Milestones..........................................................917.10 E-Authentication Milestones.......................................937.11 NCES Web Milestones.................................................967.12 IPEDS Milestones.......................................................987.13 NAEP Milestones......................................................1007.14 ERIC Milestones........................................................1057.15 ID Access Control (EDSTAR) Milestones.....................1097.16 EDEN Milestones......................................................1117.17 MSIX Milestones.......................................................1147.18 ED eGov Alignment Milestones..................................117
7.18.1 Federal Transition Framework (FTF)..................................................120
8.0 MAJOR IT INVESTMENT RISK ASSESSMENT ANALYSIS......122
9.0 IPV6 TRANSITION STRATEGY AND MILESTONES.............1289.1 IPv6 Milestone Update............................................................133
document.doc 2/29/08 3

Department of Education
Enterprise Transition Strategy Plan, February 2008
Table of Figures
FIGURE 1: ED’S EA TRANSITION STRATEGY: FROM BASELINE TO TARGET.......................6
FIGURE 2: ED’S IT LCM FRAMEWORK...............................................................................9
FIGURE 3: LEGACY ED BUSINESS MODEL.........................................................................13
FIGURE 4: LEGACY ED BUSINESS WITH LINES OF BUSINESS OVERLAY...........................14
FIGURE 5: SIMPLIFIED ED SERVICE REFERENCE MODEL PROCESS...................................19
FIGURE 6: ED NON-FSA PROJECTS WITH DEPENDENCIES................................................48
FIGURE 7: ED FSA PROJECTS WITH DEPENDENCIES.........................................................49
FIGURE 8: TRANSITION STRATEGY PLAN TIMELINE..........................................................59
FIGURE 9: TRANSITION STRATEGY LIFECYCLE..................................................................60
FIGURE 10: LOANS SEGMENT LIFECYCLE..........................................................................61
FIGURE 11: FEDERAL TRANSITION FRAMEWORK (FTF) CATALOG STRUCTURE.............121
FIGURE 12: ED’S HIGH-LEVEL NETWORK ARCHITECTURE.............................................128
FIGURE 13: ED’S DEMONSTRATION ARCHITECTURE.......................................................129
FIGURE 14: HIGH-LEVEL IPV6 TRANSITION STRATEGY..................................................132
Figure 15: Department’s IPv6 Transition Strategy..........................................................133
Table of Tables
TABLE 1: RESULTS OF THE OMB FY2007 ASSESSMENT....................................................6
TABLE 2: FEA BRM MAPPING FOR LOANS LOB.............................................................15
TABLE 3: FEA BRM MAPPING FOR GRANTS LOB...........................................................15
TABLE 4: FEA BRM MAPPING FOR EVALUATION AND POLICY ANALYSIS LOB.............15
TABLE 5: FEA BRM MAPPING FOR RESEARCH LOB.......................................................16
TABLE 6: FEA BRM MAPPING FOR INFORMATION DISSEMINATION LOB.......................16
TABLE 7: FEA BRM MAPPING FOR COMPLIANCE LOB...................................................16
TABLE 8: FEA BRM MAPPING FOR ADMINISTRATION LOB............................................16
TABLE 9: ED’S IT PORTFOLIO ANALYSIS..........................................................................18
TABLE 10: SIMPLIFIED ED SERVICE REFERENCE MODEL COMPONENTS..........................20
TABLE 11: COMMON ENTERPRISE SERVICES (CES)..........................................................21
TABLE 12: EA AREAS OF REDUNDANCY UNDER INVESTIGATION....................................22
TABLE 13: ED PROGRAM – FEDERAL STUDENT AID.........................................................23
TABLE 14: ED PROGRAM – OFFICE OF THE CHIEF FINANCIAL OFFICER (OCFO)............24
TABLE 15: ED PROGRAM – OFFICE OF THE CHIEF INFORMATION OFFICER (OCIO)........26
TABLE 16: ED PROGRAM – INSTITUTE OF EDUCATION SCIENCES (IES)...........................28
document.doc 2/29/08 4

Department of Education
Enterprise Transition Strategy Plan, February 2008
TABLE 17: ED PROGRAM – OFFICE OF MANAGEMENT (OM)...........................................30
TABLE 18: ED PROGRAM – OFFICE OF PLANNING, EVALUATION, AND POLICY DEVELOPMENT (OPEDP)...........................................................................................30
TABLE 19: ED PROGRAM – OFFICE OF ELEMENTARY AND SECONDARY EDUCATION (OESE).......................................................................................................................31
TABLE 20: BUSINESS CAPABILITIES REQUIREMENTS ED’S IRM STRATEGIC PLAN..........32
TABLE 21: NUMBER OF PROJECTS WITH SIMILAR CES COMPONENTS..............................35
TABLE 22: SEGMENT TYPE WITH STATUS AND PROJECTED COMPLETION........................37
TABLE 23: COMPLETED SEGMENTS BY PROJECT DESCRIPTIONS.......................................41
TABLE 24: SEGMENT AND PROGRAM BY PROJECT DESCRIPTIONS....................................45
TABLE 25: SEGMENT AND PROGRAM BY COMPLETED PROJECT DEPENDENCIES..............49
TABLE 26: SEGMENT AND PROGRAM BY PROJECT DEPENDENCIES...................................51
TABLE 27: COMMON ENTERPRISE SERVICE NEEDED BY PROGRAM OFFICE AND PROJECT
...................................................................................................................................53
TABLE 28: PLANNED IMPLEMENTATION OF CES’S............................................................57
TABLE 29: CES IMPLEMENTATION TIMELINE....................................................................58
TABLE 30: COMPLETED ED SEGMENT ARCHITECTURE PROJECTS....................................62
TABLE 31: DETAILED ED SEGMENT ARCHITECTURE PROJECTS.......................................64
TABLE 32: G5 MILESTONES...............................................................................................68
TABLE 33: DATA WAREHOUSE MILESTONES....................................................................69
TABLE 34: EDUCATE MILESTONES.................................................................................73
TABLE 35: CPSS MILESTONES..........................................................................................84
TABLE 36: FMSS MILESTONES..........................................................................................86
TABLE 37: ISS MILESTONES..............................................................................................89
TABLE 38: TMS MILESTONES............................................................................................91
TABLE 39: E-AUTHENTICATION MILESTONES...................................................................93
TABLE 40: NCES WEB MILESTONES.................................................................................96
TABLE 41: IPEDS MILESTONES.........................................................................................98
TABLE 42: NAEP MILESTONES.......................................................................................100
TABLE 43: ERIC MILESTONES.........................................................................................105
TABLE 44: ID ACCESS CONTROL (EDSTAR) MILESTONES............................................109
TABLE 45: EDEN MILESTONES.......................................................................................111
TABLE 46: MSIX MILESTONES........................................................................................114
TABLE 47: ED EGOV ALIGNMENT MILESTONES.............................................................117
TABLE 48: ED IT INVESTMENT RISKS AND MITIGATION STRATEGIES............................122
TABLE 49: IPV6 FEATURES AND SUPPORTED BUSINESS CAPABILITIES REQUIREMENTS IN EACH LOB...............................................................................................................130
Table 50: IPv6 Transition Plan Milestones.....................................................................133
document.doc 2/29/08 5

Department of Education
Enterprise Transition Strategy Plan, February 2008
document.doc 2/29/08 6

Department of Education
Enterprise Transition Strategy Plan, February 2008
1.0 INTRODUCTION
1.1 Overall Plan
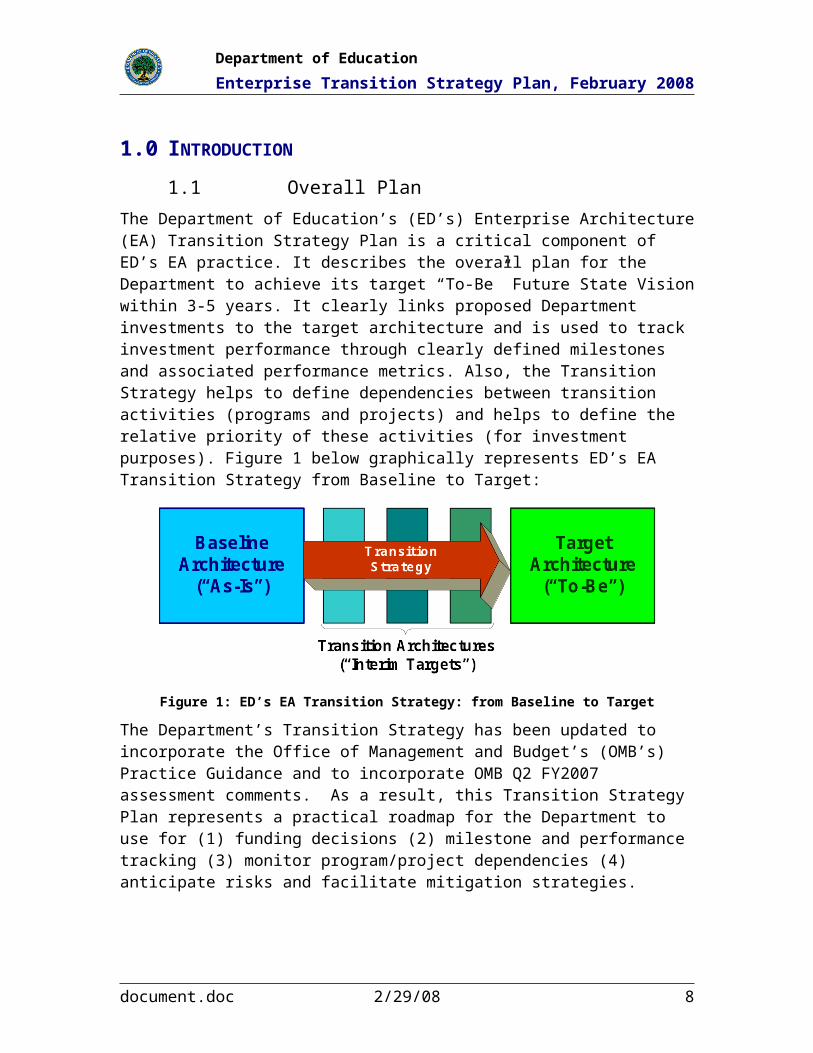
The Department of Education’s (ED’s) Enterprise Architecture (EA) Transition Strategy Plan is a critical component of ED’s EA practice. It describes the overall plan for the Department to achieve its target “To-Be” Future State Vision within 3-5 years. It clearly links proposed Department investments to the target architecture and is used to track investment performance through clearly defined milestones and associated performance metrics. Also, the Transition Strategy helps to define dependencies between transition activities (programs and projects) and helps to define the relative priority of these activities (for investment purposes). Figure 1 below graphically represents ED’s EA Transition Strategy from Baseline to Target:
Figure 1: ED’s EA Transition Strategy: from Baseline to Target
The Department’s Transition Strategy has been updated to incorporate the Office of Management and Budget’s (OMB’s) Practice Guidance and to incorporate OMB Q2 FY2007 assessment comments. As a result, this Transition Strategy Plan represents a practical roadmap for the Department to use for (1) funding decisions (2) milestone and performance tracking (3) monitor program/project dependencies (4) anticipate risks and facilitate mitigation strategies.
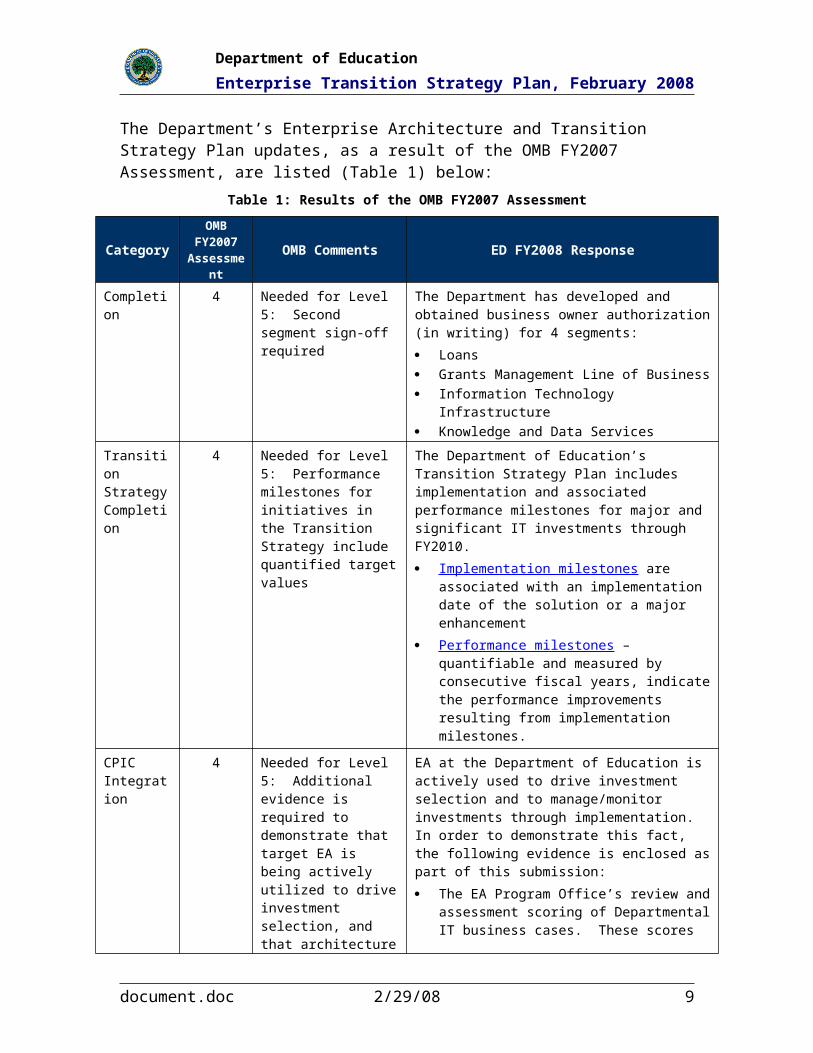
The Department’s Enterprise Architecture and Transition Strategy Plan updates, as a result of the OMB FY2007 Assessment, are listed (Table 1) below:
Table 1: Results of the OMB FY2007 Assessment
CategoryOMB
FY2007 Assessment
OMB Comments ED FY2008 Response
Completion 4 Needed for Level 5: Second segment sign-off required
The Department has developed and obtained business owner authorization (in writing) for 4 segments:
Loans Grants Management Line of Business Information Technology Infrastructure Knowledge and Data Services
document.doc 2/29/08 7
Department of Education
Enterprise Transition Strategy Plan, February 2008
CategoryOMB
FY2007 Assessment
OMB Comments ED FY2008 Response
Transition Strategy Completion
4 Needed for Level 5: Performance milestones for initiatives in the Transition Strategy include quantified target values
The Department of Education’s Transition Strategy Plan includes implementation and associated performance milestones for major and significant IT investments through FY2010.
Implementation milestones are associated with an implementation date of the solution or a major enhancement
Performance milestones – quantifiable and measured by consecutive fiscal years, indicate the performance improvements resulting from implementation milestones.
CPIC Integration
4 Needed for Level 5: Additional evidence is required to demonstrate that target EA is being actively utilized to drive investment selection, and that architecture is done before major investments are made and implemented. EA (transition strategy) should also be used to manage and monitor investments throughout implementation (i.e., not only used for investment selection).
EA at the Department of Education is actively used to drive investment selection and to manage/monitor investments through implementation. In order to demonstrate this fact, the following evidence is enclosed as part of this submission:
The EA Program Office’s review and assessment scoring of Departmental IT business cases. These scores were used by the Planning and Investment Review Working Group (PIRWG) to make investment decisions.
The EA Program Offices reviews Statements of Work issued by the Department’s Program Offices for architectural compliance. For SOW’s to be approved and funded, they must be approved by EA.
The EA Redundancy Analysis – which identified 18 common enabling services (CES’s) that will be implemented for shared use across the Department. The EA Program Office has presented these investment opportunities to the PIRWG for consideration. (Presentations and Meeting Minutes are attached). As a result, the Enterprise Data Warehouse (EDW) was implemented and Document Management is next.
Additionally, the referenced presentations and meeting minutes demonstrate that, in accordance with the Department’s EA Governance Plan, the EA program office recommends IT investments for funding consideration based on architectural analysis. One example is the Office of Post Secondary Education’s IT Transformation.
The EA Program Office developed the ITI Segment Architecture (a new investment at the Department) – defining its future vision and transition strategy plan. These architectural artifacts will be used to monitor and making investment decisions in regards to this investment.
The EA Program Office is responsible for maintaining
document.doc 2/29/08 8
Department of Education
Enterprise Transition Strategy Plan, February 2008
CategoryOMB
FY2007 Assessment
OMB Comments ED FY2008 Response
the Departmental Performance Architecture, which includes monitoring performance metrics and reporting discrepancies to the Planning and Investment Review Working Group
Results: Transition Strategy Performance
3 Needed for Level 4: Demonstrate that program/ project milestones were achieved on schedule (or other action was taken for missed milestones), and that target performance improvement was achieved.
The Department’s Transition Strategy has been updated with specific, results-oriented Implementation and Performance milestones. Performance milestones have a Planned Fiscal Year and Actual Completion Date – demonstrating that program/project milestones have been achieved. Missed milestones are explicitly noted and subsequent fiscal year milestones describe the actions taken to achieve desired performance levels.
1.2 Background
ED’s EA is a key component of the Department’s overall Information Technology (IT) Life Cycle Management (LCM) Framework. This Framework applies government and industry best practices in EA, IT investment management, systems engineering, and program management. Therefore, it provides the foundation for sound IT management practices, end-to-end EA governance of IT investments, and the alignment of IT investments with the goals and business mission of the Department.
1.3 Framework
The Framework is comprised of three phases – Architect, Invest, and Implement– which extend across the entire lifecycle of information technology. The diagram (Figure 2) below shows how the ED’s EA Transition Strategy fits into ED’s IT LCM Framework.
document.doc 2/29/08 9

Department of Education
Enterprise Transition Strategy Plan, February 2008
Figure 2: ED’s IT LCM Framework
The steps comprising Framework are described below:
1.3.1 Step 0 – Baseline and Target Architecture Development
Step Number Description TSP Section
Step 0 Baseline and Target Architecture Development Section 2.0
In order to create ED’s Transition Strategy, both ED’s Baseline EA and ED’s Target EA were documented, modeled, and approved by the Department. The required detail and completeness of ED’s baseline EA was to the level necessary for it to serve as the starting point for ED’s EA Transition Strategy. ED’s EA Transition Strategy addresses the 3-5 year timeframe for which the Department’s target architecture is defined. As the Department’s baseline and Target EAs are updated periodically, the ED’s EA Transition Strategy is also updated.
To begin this process, the EA team reviewed the various Departmental level and Program Office level planning documents as input to the ED EA Baseline and Future State Vision in order to define the “As Is” and To Be” business and enabling IT environments. This effort included:
Identifying common Lines of Business across the Department.
Documenting the Line of Business strategic objectives.
Identifying critical success factors.
Documenting potential capability needs.
Deriving potential core-IT enabling capabilities.
Previewing the hypothesized visions with key LOB ‘thought leaders’.
document.doc 2/29/08 10

Department of Education
Enterprise Transition Strategy Plan, February 2008
Analyzing common lines of business and services across the Department to define Education’s segment architectures.
1.3.2 Step 1 – Redundancy and Gap Analysis
Step Number Description TSP Section
Step 1 Redundancy and Gap Analysis Section 3.0
Once the Baseline and Target Enterprise Architectures were developed and validated through the Department’s EA governance process, the ED EA Program Office performed an IT Redundancy analysis within the As Is environment and a Gap Analysis (per Program) between the As-Is and the To-Be Environments.
1.3.3 Step 2 – Refine, Prioritize, Develop Segments
Step Number Description TSP Section
Step 2 Refine and Prioritize Segments Section 4.0
Upon completing and achieving Departmental approval of the Redundancy and Gap Analysis, the EA Program Office used the results of this Analysis to refine, prioritize, and begin development of ED’s segments (initially defined in Step 0). These results were a critical factor in finalizing the Department’s segments and determining the order of their development since they:
Facilitated the association of ED Programs to its seven Lines of Business
Defined the Common Enabling Services (CES’s) required by ED’s Programs
Provided insight into which Programs had the greatest performance gaps
Identified business capability and service redundancy across ED Programs – allowing the EA Program to facilitate a collaborative approach to Transition Strategy Planning
1.3.4 Step 3 – Define Programs and Projects
Step Number Description TSP Section
Step 3 Define Programs and Projects Section 5.0
As the Department’s Segment Architectures were refined, the EA Program Office associated Programs with Segments. Subsequently, with the development of the segment, the EA Program Office identified, or proposed to the Department’s Planning and Investment Review Working Group (PIRWG), specific IT investments to close the performance gaps (or eliminate redundancies) within Segments.
1.3.5 Step 4 – ED Transition Sequencing Plan
Step Number Description TSP Section
Step 4 ED Transition Sequencing Plan Section 6.0
Finally, in accordance with the prioritization of segmentsand their associated, approved, IT investments, the EA Program Office developed the Department of Education Transition Sequencing Plan, incorporating:
document.doc 2/29/08 11

Department of Education
Enterprise Transition Strategy Plan, February 2008
The Department’s Life Cycle Management Framework
Specific implementation milestones
Results oriented and measurable performance milestones
eGov Alignment and Performance Assessment Rating Tool (PART) objectives
IT investment dependencies
This Plan is actively used by the Department to measure transition progress, IT investment performance, and to guide ED’s path forward.
document.doc 2/29/08 12

Department of Education
Enterprise Transition Strategy Plan, February 2008
2.0 ED BASELINE AND TARGET ARCHITECTURE OVERVIEW
2.1 Baseline Enterprise Architecture
The Department of Education (ED) developed its Baseline Enterprise Architecture (EA) and Transition Strategy Plan (TSP) in November 2001 with participation across ED Program Offices. The Baseline EA was defined in five layers or domains: Business, Data, Application, Technology, and Performance, which have since been used to guide a focused, results-oriented Departmental Business Transformation.
The Department is leveraging the knowledge gained through its Enterprise Architecture efforts and has begun to identify opportunities for intergovernmental collaboration to improve services to customers. The Federal Enterprise Architecture (FEA) and Federal Transition Framework (FTF) are used to help identify these opportunities. Additional opportunities are expected to surface as the Department continues to develop and integrate its disparate enterprise architecture activities. ED will continue to be able to characterize its enterprise architecture within the context of the FEA reference models once they are released.
In the past, as captured in the Department’s Baseline Enterprise Architecture, ED pursued its mission and goals through a stove-piped, program-centric business model, as illustrated below in Figure 3.
document.doc 2/29/08 13

Department of Education
Enterprise Transition Strategy Plan, February 2008
Figure 3: Legacy ED Business Model
As illustrated in Figure 3: Legacy ED Business Model, the Office of the Under Secretary (OUS) oversees three offices including Federal Student Aid (FSA), the Office of Postsecondary Education (OPE), and the Office of Vocational and Adult Education (OVAE).
The Office of the Deputy Secretary (ODS) oversees five offices including the Office of Elementary and Secondary Education (OESE), the Office of Innovation and Improvement (OII), the Offices of Special Education and Rehabilitative Services (OSERS), the Office of English Language Acquisition (OELA), and the Office of Safe and Drug Free Schools (OSDFS).
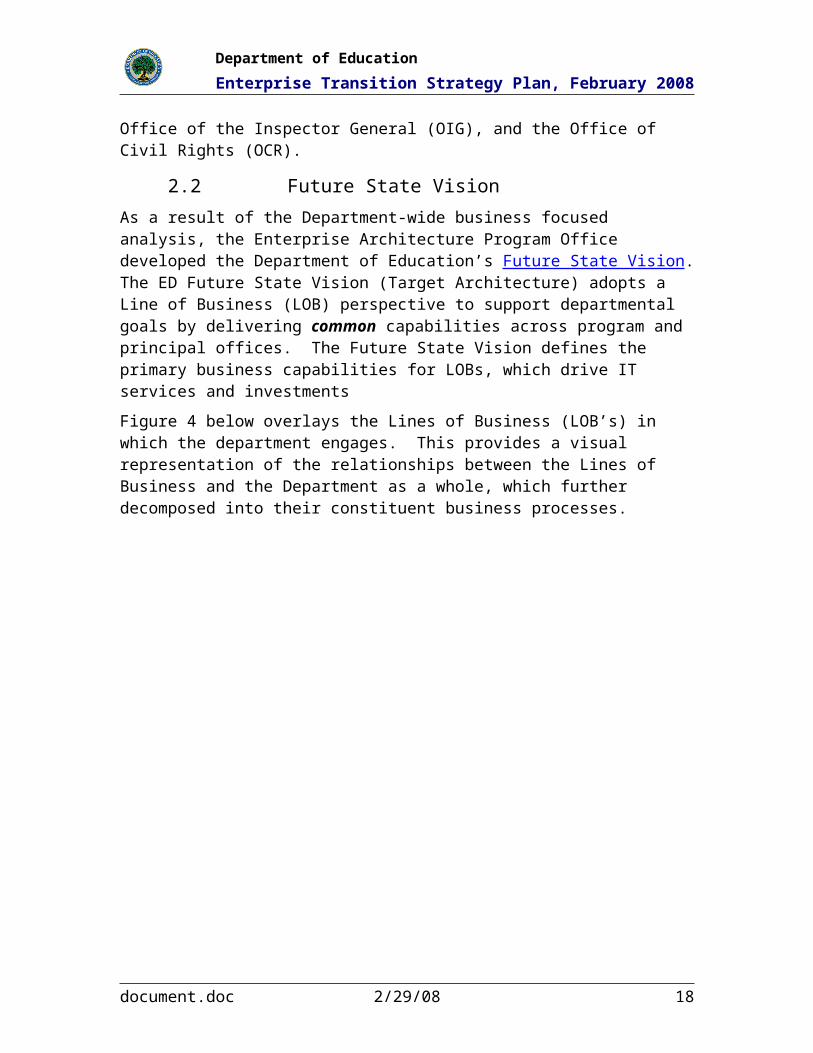
The Office of the Secretary (OS) oversees four offices, the Institute of Education Sciences (IES), the Office of Planning, Evaluation, and Policy Development (OPEPD), the Office of the Inspector General (OIG), and the Office of Civil Rights (OCR).
2.2 Future State Vision
As a result of the Department-wide business focused analysis, the Enterprise Architecture Program Office developed the Department of Education’s Future State Vision. The ED Future State Vision (Target Architecture) adopts a Line of Business (LOB) perspective to support departmental goals by delivering common capabilities across program and
document.doc 2/29/08 14

Department of Education
Enterprise Transition Strategy Plan, February 2008
principal offices. The Future State Vision defines the primary business capabilities for LOBs, which drive IT services and investments
Figure 4 below overlays the Lines of Business (LOB’s) in which the department engages. This provides a visual representation of the relationships between the Lines of Business and the Department as a whole, which further decomposed into their constituent business processes.
Figure 4: Legacy ED Business with Lines of Business Overlay
The Department’s business processes and IT investments are developed to move the Department away from a stove-piped environment where capabilities are invested to meet single Program Office needs, to a cooperative environment in which common capabilities and services can be employed to meet similar Program Office needs.
2.2.1 Lines of Business (LOB’s)
The Department’s Enterprise Architecture future state business model is established around the seven cross-Program Office Lines of Business (LOB’s). Where relevant, current and future IT investments are managed as a portfolio delivering enabling technical capabilities in support of LOB needs, which can span multiple Program Offices. For example, while OESE and OPE serve very different education segments (K-12, post-secondary education), the LOB mode of delivery remains the same, i.e., through formula and discretionary grants. The grants mode of delivery of these two offices are very
document.doc 2/29/08 15

Department of Education
Enterprise Transition Strategy Plan, February 2008
similar in terms of process workflow and system support requirements. By focusing on Grants management capabilities across the Enterprise, the Department reduces the need to develop multiple sub-scale systems within Program Offices.
The LOB enterprise view of grants enables the Department to evaluate how the portfolio of multiple grants managed by multiple Program Offices collectively contributes to improving Education’s performance. The Department’s seven Lines of Business (Loans, Grants, Evaluation and Policy Analysis, Research, Information Dissemination, Compliance, and Administration) are detailed in the Business are detailed in the following tables below:
Loans (Table 2)
Grants (Table 3)
Evaluation and Policy Analysis (Table 4)
Research (Table 5)
Information Dissemination (Table 6)
Compliance (Table 7)
Administration (Table 8)
Table 2: FEA BRM Mapping for Loans LOB
LOB Vision LOB Description FEA BRM Mapping
Deliver the right aid, to the right people, at the right time.
Management and delivery of federally funded or federally guaranteed financial assistance for post-secondary education. Management of financial student aid is provided through the Office of Financial Student Assistance.
Business Area: Mode of Delivery LOB: Federal Financial Assistance, Credit and Insurance
Subfunctions: Direct Transfers to Individuals, Loan Guarantees, Direct Loans
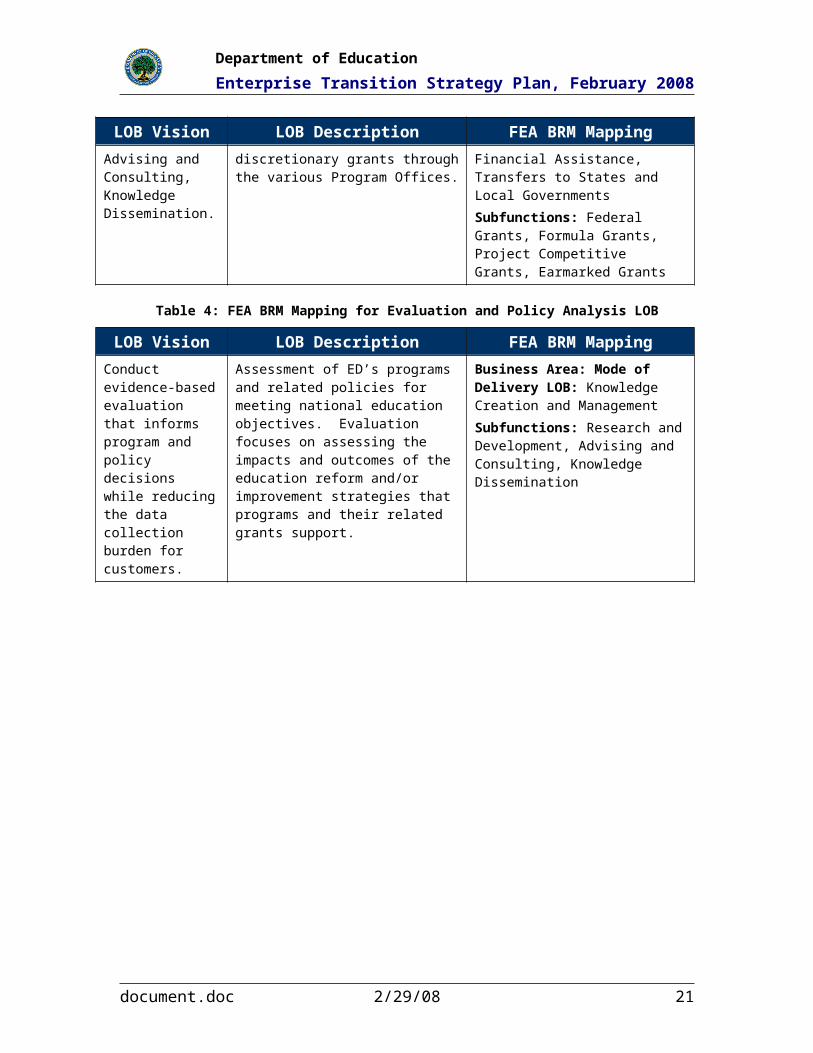
Table 3: FEA BRM Mapping for Grants LOB
LOB Vision LOB Description FEA BRM Mapping
Research and Development, Advising and Consulting, Knowledge Dissemination.
Review, award, and disbursement of formula and discretionary grants through the various Program Offices.
Business Area: Mode of Delivery LOB: Federal Financial Assistance, Transfers to States and Local Governments
Subfunctions: Federal Grants, Formula Grants, Project Competitive Grants, Earmarked Grants
Table 4: FEA BRM Mapping for Evaluation and Policy Analysis LOB
LOB Vision LOB Description FEA BRM Mapping
Conduct evidence-based evaluation that informs program and policy decisions while reducing the data collection
Assessment of ED’s programs and related policies for meeting national education objectives. Evaluation focuses on assessing the impacts and outcomes of the education reform and/or improvement strategies that programs and their related
Business Area: Mode of Delivery LOB: Knowledge Creation and Management
Subfunctions: Research and Development, Advising and Consulting, Knowledge Dissemination
document.doc 2/29/08 16

Department of Education
Enterprise Transition Strategy Plan, February 2008
LOB Vision LOB Description FEA BRM Mapping
burden for customers. grants support.
Table 5: FEA BRM Mapping for Research LOB
LOB Vision LOB Description FEA BRM Mapping
Provide greater awareness of and timely access to evidence-based research.
Education research and statistical analysis on the condition of education in the U.S. IES performs the majority of education research for the Department. The National Center for Education Statistics (NCES) collects, analyzes and reports statistics on the condition of education in the U.S.
Business Area: Mode of Delivery LOB: Knowledge Creation and Management
Subfunctions: Research and Development, Advising and Consulting, Knowledge Dissemination
Table 6: FEA BRM Mapping for Information Dissemination LOB
LOB Vision LOB Description FEA BRM Mapping
Provide ready access of relevant department education information to outside constituencies.
Distribution of education information products through multiple channels and formats. Two main types of information dissemination are performed: (1) dissemination of program evaluations and reports and (2) dissemination of information to the education community and the general public.
Business Area: Mode of Delivery LOB: Knowledge Creation and Management
Subfunctions: Knowledge Dissemination
Table 7: FEA BRM Mapping for Compliance LOB
LOB Vision LOB Description FEA BRM Mapping
Ensure consistent high quality and efficient compliance services that meet customer needs
Assurance that policies mandated by ED and by Federal law are being carried out. ED ascertains that policies mandated by ED and by Federal law are being carried out as intended by ED staff, grantees, contractors, and other stakeholders.
Business Area: Mode of Delivery LOB: Regulatory Compliance and Enforcement
Subfunctions: Inspections and Auditing, Standard Setting / Report Guideline Development
Table 8: FEA BRM Mapping for Administration LOB
LOB Vision LOB Description FEA BRM Mapping
Promote and deliver enterprise-wide support to ED program offices.
Enterprise-wide support services. These include the following sub-functions: Procurement, General Legal Services, Facilities and Travel Management, Human Resources Management, Financial Management, Information Resources Management, and Planning and Administration.
Business Area: Management of Government Resources LOB: Administrative Management
Subfunctions: Facilities, Fleet, and Equipment Management; Help Desk Services; Security Management; Travel; Workplace Policy Development and Management
document.doc 2/29/08 17
Department of Education
Enterprise Transition Strategy Plan, February 2008
2.2.2 Primary IT Delivery Organizations
Within the Department, the primary IT delivery organizations are FSA, IES, OCFO, and OCIO:
FSA delivers the Loans related mission applications, support applications (FMS), as well as the FSA technical infrastructure (VDC).
IES delivers the Research related mission applications operated from ED and vendor facilities.
OFCO provides mission and support applications through EDCAPS (a suite of financial management applications), including FMSS, CPSS, G5 (Grants related mission application), and Travel.
OCIO is responsible for the Department’s infrastructure service.
In addition, several Program Offices deliver mission applications, e.g., OPEPD contracts EDEN development (the Department’s primary Evaluation mission application) and, OPE and OESE contract for various grants-related applications support. Finally, the Department also uses IT-related services provided by external government centers of excellences (e.g., human resource management systems) as encouraged by the e-Gov Program.
document.doc 2/29/08 18

Department of Education
Enterprise Transition Strategy Plan, February 2008
3.0 REDUNDANCY AND GAP ANALYSIS
3.1 Redundancy Analysis
ED performed its redundancy and gap analysis to identify opportunities for consolidation or reuse in ED’s baseline architecture and to identify “gaps” between ED’s baseline and target architectures. Identified opportunities and gaps were then addressed by programs and projects laid out in ED’s enterprise sequencing plan (Section 6.0).
ED performed its redundancy analysis as part of a broader IT portfolio analysis. The findings (Table 9) of this analysis are available in ED’s IT Portfolio Analysis presentation.
Table 9: ED’s IT Portfolio Analysis
What We Did What It Means
Step 1. Began with the February 23, 2005 eCPIC list.
Step 2. Focused on the non-FSA investments.
Step 3. Created a “simplified” ED Service Reference Model (SRM) to codify IT component service functionalities.
Step 4. Evaluated and coded investments with the relevant SRM components.
Step 5. Based on an EA template that maps the SRM codes to the 18 Centers of Excellence (CoE)*, we coded investments with relevant CoE employed.
Step 6. Performed MS Excel pivot table analysis to identified CoE categories used by multiple projects, as well as potentially sharable CoEs across non-FSA and FSA investments.
Step 7. Reviewed regularly. Last updated October 2007.
• Analysis reveals that ED invests in a number of projects that independently use Center of Excellence capabilities, which could potentially be consolidated or shared.
• This analysis identifies areas worth further investigation.
• Decisions to re-architect a project to use shared component modules should be based on thorough analysis:
– Assessment of functionality employed to determine whether alternative components /products might be used instead
– Feasibility of consolidation or sharing
– Cost of transition vs. potential benefits
• New investments should be evaluated to determine whether they could make use of common or shared service components, when available for general use, thereby avoiding proliferation of duplicate capabilities.
3.1.1 Simplified ED Service Reference Model (SRM) Process
The figures on the following pages are taken from ED’s IT Portfolio Analysis and describe the results of the Department’s comprehensive redundancy analysis:
The following illustration (Figure 5) presents Education’s process for developing the “Simplified” ED Service Reference Model (SRM) Components.
document.doc 2/29/08 19

Department of Education
Enterprise Transition Strategy Plan, February 2008
Figure 5: Simplified ED Service Reference Model Process
document.doc 2/29/08 20
Department of Education
Enterprise Transition Strategy Plan, February 2008
3.1.2 Simplified ED SRM Components
The resulting, simplified ED SRM consists of 43 common components tailored to the Department and its business functions.
Table 10: Simplified ED Service Reference Model Components
SRM Domains Simplified ED SRM Component Types SRM Domains Simplified ED SRM Component Types
Customer Services 1. Customer Management Business Analytical Services
20. Analysis and Statistics2. Portal Management 21. Report Management3. Data Collection Data Warehouse4. Grants Application Management Performance Management
Work Management Back Office Services 22. Assets Management
Process Automation Services
5. Correspondence Management 23. Facilities Management6. Case Management 24. Mail Management7. Work Management 25. Data Management
Business Management Services
8. Performance Management 26. Data Mart9. Portfolio Management 27. Data Warehouse10. Strategic Planning and Management 28. IT Integration11. Grants Monitoring 29. IT Development12. IT Change Management 30. HR Management13. Program / Project Management 31. Travel14. Contracts & Procurement 32. Financial Budgeting
IT Development 33. Financial Management
Digital Asset Services 15. Content Management 34. Grants Financial Management16. Document Management Support Services 35. Collaboration17. Grants Document Management 36. Telephony18. Knowledge Management 37. Web Cast19. Records Management 38. Grants Review Management
Data Collection 39. Legal Management
Note: Components in Red denote new service components created specifically for ED’s use.
40. Web Information Search41. IT Security42. Physical Security43. IT Infrastructure
Data Collection
The Department’s EA Redundancy Analysis identified 18 potential Common Enterprise Services (CES) that are needed at Education. CES’s are shared service/business function needs that are common to multiple investments/Lines of Business across the Department – and that can be implemented at an Enterprise-level as opposed to a stove-piped manner.
document.doc 2/29/08 21

Department of Education
Enterprise Transition Strategy Plan, February 2008
3.1.3 Common Enterprise Services (CES)
The 18 Common Enterprise Services (CES’s) identified are listed in the table (Table 11) below:
Table 11: Common Enterprise Services (CES)
CES Description
Collaboration Management Allow people to work together more efficiently by enabling greater information sharing.
Work Management Allow the monitoring of activities within a business process.
Case Management Manage the life cycle of a particular claim or investigation (include creating, routing, tracking, assignment and closing of a case and case handler collaboration).
Performance Management Measure the effectiveness of an organization and/or its assets.
Document/ Record/ Content Management Control the capture and maintenance of an organizations documents and files.
Report Management Support the organization of data into useful information.
Knowledge Management Support the identification, gathering and transformation of documents, reports and other sources into meaningful information.
Data Management Usage, processing and general administration of unstructured information.
Customer Management Support the retention and delivery of a service or product to an organization’s clients.
Portal Management Allow customers to proactively seek assistance and service from an organization, personalize a user interface, and support the search of specific data from a data source.
Mobility Tools Tools that enable mobile computing.
Statistical and Analysis Tools Support the examination of business issues, problems and their solutions.
Survey Design Tools Tools enabling the collection of information from customers.
Survey Management Collect useful information from customers.
Operations Support Information Technology hardware, software and technical support for ongoing operations and maintenance.
Network, Storage, and Computing Platforms Hardware and software for networking and storage.
Security & Privacy Tools that support Confidentiality, Integrity and Availability.
SOA, Enabling Platforms Service Oriented Architecture (Interoperable Standards).
Other Services needed by your investment that can be considered as an Enterprise-wide service candidate.
document.doc 2/29/08 22

Department of Education
Enterprise Transition Strategy Plan, February 2008
3.1.4 EA Areas of Redundancy Under Investigation
The Enterprise Architecture Office will further investigate and refine the redundancy areas listed below:
Table 12: EA Areas of Redundancy Under Investigation
Areas of Redundancy Further Investigation
IT Infrastructure In principle, the IT infrastructure investments (IT hardware / software and associated maintenance contract(s) should be managed at the enterprise level through the IT Infrastructure LOB and VDC.
Analysis shows that multiple other POCs are engaged in procurement of IT equipment.
Opportunities exist to explore the feasibility of consolidating the procurement and management of IT infrastructure to improve asset control and purchase / support agreement terms.
Knowledge Worker Infrastructure
Multiple programs have launched different collaboration, workflow, and knowledge / document management environments to improve their task management and information sharing.
This has led to a proliferation of different, frequently not interoperable, products deployed.
Opportunities exist to define the Technology Standards and Technology Roadmaps to encourage the reuse of standard technologies and the sharing of best practices.
Grants Management Multiple POCs have created different program-specific peer review modules and grant monitoring modules to supplement the Department’s GAPS system.
As GAPS is reengineered, the pre-award and post-award capabilities can be incorporated to enhance ED’s offering as the government-wide services provider for the Grants Management Line of Business.
Data Collection / Data Mart / Data Warehouse
In addition to IES and PBDMI, multiple POCs own database systems that manage the data collection for research and evaluation purposes.
Moving towards the Target EA Vision of creating an enterprise data warehouse will help remove the need for the current islands of independent data collection.
Web Services / Portal Management
Different programs have created a variety of web sites for information dissemination and on-line transactions.
Opportunities exist to better integrate these interfaces to achieve a more consistent “brand image” or “single sign on” for ED as well as to leverage different on-line capabilities (e.g., search, self-serve, etc.).
document.doc 2/29/08 23
Department of Education
Enterprise Transition Strategy Plan, February 2008
3.2 Gap Analysis
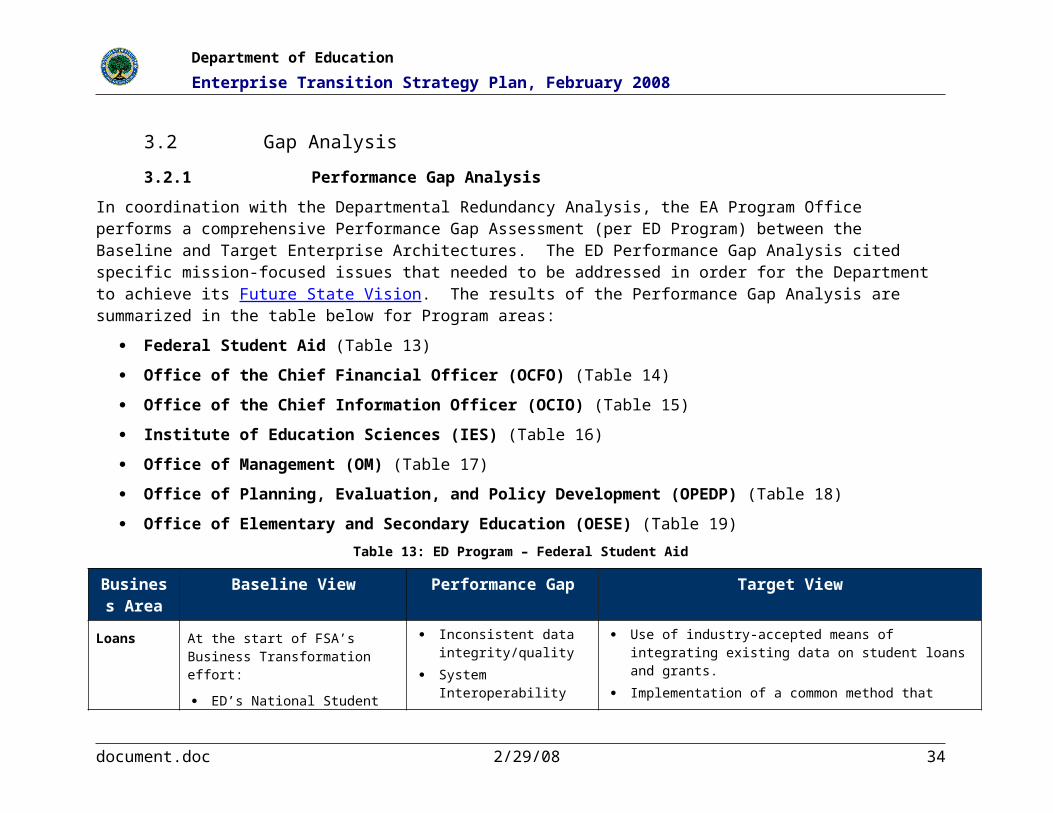
3.2.1 Performance Gap Analysis
In coordination with the Departmental Redundancy Analysis, the EA Program Office performs a comprehensive Performance Gap Assessment (per ED Program) between the Baseline and Target Enterprise Architectures. The ED Performance Gap Analysis cited specific mission-focused issues that needed to be addressed in order for the Department to achieve its Future State Vision. The results of the Performance Gap Analysis are summarized in the table below for Program areas:
Federal Student Aid (Table 13)
Office of the Chief Financial Officer (OCFO) (Table 14)
Office of the Chief Information Officer (OCIO) (Table 15)
Institute of Education Sciences (IES) (Table 16)
Office of Management (OM) (Table 17)
Office of Planning, Evaluation, and Policy Development (OPEDP) (Table 18)
Office of Elementary and Secondary Education (OESE) (Table 19)
Table 13: ED Program – Federal Student Aid
Business Area
Baseline View Performance Gap Target View
Loans At the start of FSA’s Business Transformation effort:
ED’s National Student Loan Data System (NSDLS) nor the other systems were designed for efficient access to reliable student financial aid information.
Many systems were incompatible and lacked data standards and common identifiers.
There was absence of enterprise
Inconsistent data integrity/quality
System Interoperability
Lack of data sharing and exchange
Stand-alone/stove-piped systems
Multiple points of access to FSA data
Multiple views of customer accounts
Use of industry-accepted means of integrating existing data on student loans and grants.
Implementation of a common method that institutions can use to submit student financial aid for Pell Grant and Direct Loan programs.
A comprehensive human capital strategy.
Increased accountability for the integration of Federal Student Aid data through an Information Service Infrastructure
Use of financial information to measure and predict the efficiency of common origination disbursement activities.
Elimination of paper-based (replaced with electronic
document.doc 2/29/08 24

Department of Education
Enterprise Transition Strategy Plan, February 2008
Business Area
Baseline View Performance Gap Target View
architecture.
ED continued to acquire independent systems to support specific student financial aid programs that could not easily share information.
Mounting cost of developing and maintaining stand-alone systems.
recordkeeping capability compliant with applicable statutes and regulations) delivery processes and stakeholder communications.
Creation of a consolidated system of record for institutional trading partners.
Implement a single portal that provides streamlined access to FSA information and services to customers, partners, and employees.
NOTE: Click HERE to view associated IT investment.
Table 14: ED Program – Office of the Chief Financial Officer (OCFO)
Business Area
Baseline View Performance Gap Target View
Grants Management
GAPS controls payments for the Department's programs, including payments for grants and direct loans and other program-related obligations.
GAPS is fully integrated with Financial Management System Software (FMSS) and serves as a subsidiary to the general ledger for program-related obligations, payments, and expenditures.
Integrated Support Services (ISS) supports GAPS infrastructure, contract oversight and internal application testing as part of the EDCAPS environment.
Disparate systems supporting the end-to-end business process of grant.
GAPS does not provide grants performance monitoring after grant is awarded.
Out of date with current technology trends.
Maintain and strengthen financial integrity and management and internal controls.
Full integrations with the Financial Management System Software (FMSS) and will serve as a subsidiary to the general ledger for program-related obligations, payments, and expenditures.
Facilitate improvements within the grant management lifecycle through the use of “enabling” technologies such as workflow management, document management, automatic alerts, notifications and e-signature (compatible with and embedded in an electronic recordkeeping capability compliant with applicable statutes and regulations).
NOTE: Click HERE to view associated IT investment.
document.doc 2/29/08 25

Department of Education
Enterprise Transition Strategy Plan, February 2008
Business Area
Baseline View Performance Gap Target View
Contracts / Acquisition Management
Disparate and decentralized systems for entering, retrieving and viewing Contract/ Acquisition related data.
Duplication of efforts and redundant processes.
Inefficient contracting management controls.
Hardcopy file storage.
Central repository to enter, retrieve and view Acquisition/contract related data.
Greater ability to respond to internal and external information requests. Faster access and dissemination of contract documents. Improved contracting management controls. Decreased need for hardcopy files storage (with an electronic
recordkeeping capability). Improved accuracy and timeliness of payments. Increased user satisfaction, etc.
NOTE: Click HERE to view associated IT investment.
Financial Management
Decentralized systems for entering, retrieving and viewing grant and payment related data.
System inefficiencies.
Poor financial management capability.
Duplication of efforts and redundant processes.
Duplicate data entry efforts.
Limited oversight tracking of internal and external for systems.
Centralized system support for function to enter, retrieve and view grant and payment related data.
Greater ability to respond to internal and external information requests. Faster access and dissemination of contract documents. Decreased need for hardcopy files storage (with an electronic
recordkeeping capability). Improved financial system reporting capabilities. Increased internal controls by minimizing data input points. Improved contracting management controls and project task specific
support (i.e., configuration management, testing, and training support.
NOTE: Click HERE to view associated IT investment.
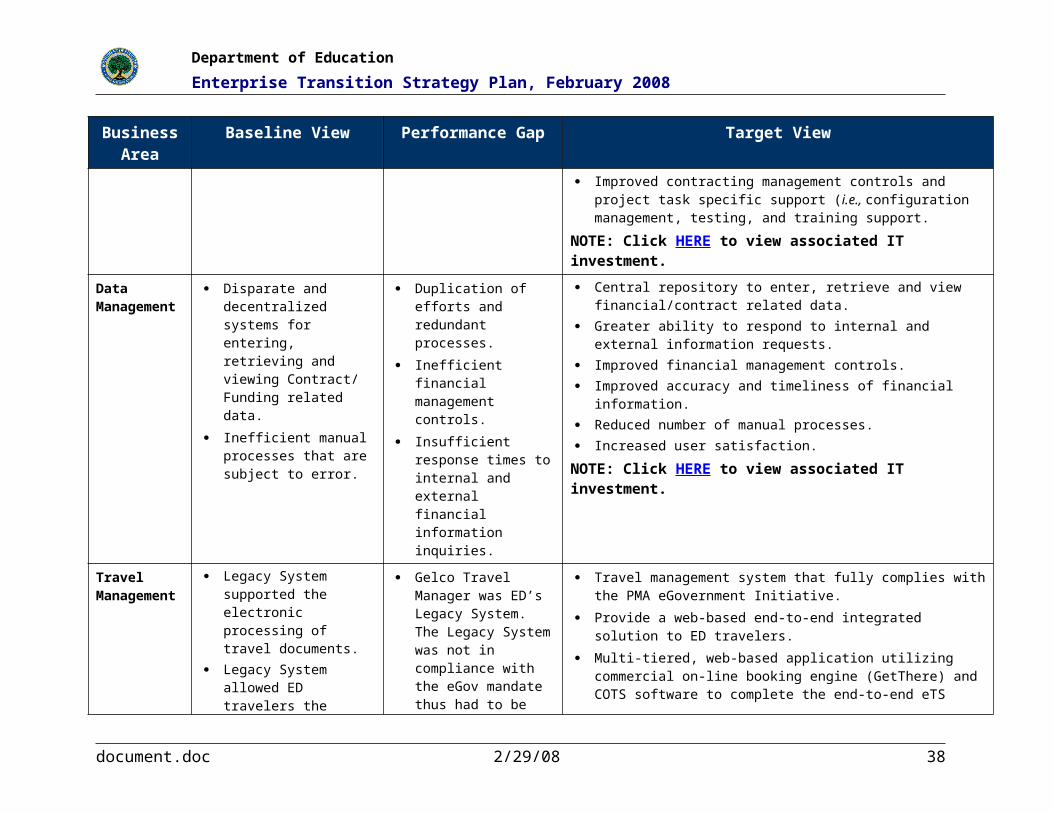
Data Management
Disparate and decentralized systems for entering, retrieving and viewing Contract/ Funding related data.
Inefficient manual processes that are subject to error.
Duplication of efforts and redundant processes.
Inefficient financial management controls.
Insufficient response times to internal and external financial information inquiries.
Central repository to enter, retrieve and view financial/contract related data.
Greater ability to respond to internal and external information requests. Improved financial management controls. Improved accuracy and timeliness of financial information. Reduced number of manual processes. Increased user satisfaction.
NOTE: Click HERE to view associated IT investment.
Travel Management
Legacy System supported the electronic processing of
Gelco Travel Manager was ED’s Legacy System.
Travel management system that fully complies with the PMA
document.doc 2/29/08 26
Department of Education
Enterprise Transition Strategy Plan, February 2008
Business Area
Baseline View Performance Gap Target View
travel documents. Legacy System allowed ED
travelers the ability to create and electronically route travel documents.
Legacy System provided that Electronic document files are electronically integrated to the Department's financial system to create obligation or expenditure transactions through to the payment process.
Integrated Support Services (ISS) are supported by TMS for infrastructure and internal application testing as part of the EDCAPS environment.
The Legacy System was not in compliance with the eGov mandate thus had to be replaced with an eTS system.
eGovernment Initiative.
Provide a web-based end-to-end integrated solution to ED travelers.
Multi-tiered, web-based application utilizing commercial on-line booking engine (GetThere) and COTS software to complete the end-to-end eTS solution.
More efficient and effective document processing.
Allow split disbursement capability.
More timely transmissions and improved accuracy of automated data.
Allow for an integrated On-line booking engine (OBE).
Increased user satisfaction.
NOTE: Click HERE to view associated IT investment.
Table 15: ED Program – Office of the Chief Information Officer (OCIO)
Business Area
Baseline View Performance Gap Target View
IT Infrastructure Management
IT infrastructure services at the Department of Education are supported through a multi-faceted contract (EDNet) that is not effective with other business partners.
Inefficient ED infrastructure services to internal and external stakeholders.
Lack of optimized Performance in ED’s infrastructure operations.
Use of disparate platforms and technologies to support business functions/ applications.
Contractor Owned-Contractor Operated (COCO) Managed IT infrastructure service model that will:
1) Source a contractor owned and contractor operated Managed Services IT Infrastructure that is Performance Based, and Firm Fixed Priced.
2) Improve ED's services to students and customers.
3) Enable ED to become a more effective business partner.
4) Reduce operational risk of ED's operations.
5) Improve the performance of ED's operations and the ability to
document.doc 2/29/08 27

Department of Education
Enterprise Transition Strategy Plan, February 2008
Business Area
Baseline View Performance Gap Target View
measure that performance and establish accountability.
6) Resolve audit findings.
7) Provide common technology platform for business applications such as HSPD-12, IPv6 and others.
NOTE: Click HERE to view associated IT investment.
Knowledge and Data Management
Linking information from supplying systems and performing analysis is too difficult since the information from supplying systems is in isolation.
Disparate sources of data
Improper payments
Inefficient Grant Management processes
Provides a single, centralized source of data.
Provided as a common enabling service that may be leveraged for central reporting for existing and future systems.
Making grants data more readily available for analysis and decision-making.
Eliminate improper payments and reduce funds transferred to Treasury.
NOTE: Click HERE to view associated IT investment.
Security and Identity Management
Inflexible security architecture – not allowing external stakeholders to access Federal data easily and efficiently.
Limited security controls.
Minimal interoperability for secure access with other systems.
Redundant authentication processes.
Lack of alignment with the Federal E-Authentication Initiative.
Inconsistent multiple points of authentication.
Duplication of efforts and redundant processes.
Lack of interoperability/ alignment with the Federal E-Authentication direction.
Adoption of the GSA E-Authentication Initiative – a crosscutting initiative of the e-Government (eGov) component of the President’s Management Agenda (PMA). As part of the e-Authentication Federation and as a Relying Party (RP), the Department may bring into the Federation internet-based systems that haveend users outside the agency’s firewall and requires identity verification of those end users. Once an agency’s system has been E-Authentication (e-Auth) enabled, it will be able to grant access to end users who have an identity credential from one or more of the Federation’s Credential Service Providers (CSPs).
Alignment with the GSA-led E-Authentication Initiative will result in:
Greater flexibility based on a Distributed architecture that will allow citizens and businesses to use non-government issued credentials
Stringent security controls to prevent unauthorized or validated access
Greater ability to conduct secure, easy-to-use and consistent method of authenticating identity
Improved access ensures interoperability with other ED programs
document.doc 2/29/08 28

Department of Education
Enterprise Transition Strategy Plan, February 2008
Business Area
Baseline View Performance Gap Target View
Improve access to conduct federated authentication for electronic user identity credentials from external credential service providers.
NOTE: Click HERE to view associated IT investment.
Table 16: ED Program – Institute of Education Sciences (IES)
Business Area
Baseline View Performance Gap Target View
Portal Management
The NCES Web Portal (deployed since 2004) is used to disseminate comprehensive statistics on the condition and progress of education, at the preschool, elementary, secondary, postsecondary, and adult levels in the United States. This includes the Common Core of Data (CCD) program, which annually collects fiscal and non-fiscal data about public schools, public school districts and state education agencies in the United States.
The current view includes:
Manual statistical and data collection activities.
Delayed response times to internal and external information requests and distribution of data.
Occasional data quality issues.
Lack of integration between student aid and statistical information.
Duplication of efforts and redundant processes for data collection.
Inefficient electronic distribution of information.
Manual processing and analysis of statistical data.
Inefficient data publication processing (resulting in data quality and timeliness issues).
NCES Web Portal Enhancements to address current performance gaps and resulting in:
Faster distribution of information through electronic self-service tools, resulting in:
Greater ability to respond to internal and external information requests.
Improved customer service (Improved access to public information and services as a result of improved navigation, search techniques, and publishing workflow, data dissemination and collection, customer service, and online communities).
Reduced manual operations (Administrative savings due to electronic distribution of information and self-service table generator tools) resulting in improved accuracy and timeliness of survey data.
Seamless integration of student aid and statistical information resulting in improved efficiency.
NOTE: Click HERE to view associated IT investment.
document.doc 2/29/08 29

Department of Education
Enterprise Transition Strategy Plan, February 2008
Business Area
Baseline View Performance Gap Target View
Data Management
Paper-based mail survey, which was keyed into a database and error resolution, was done by analysts.
Excessive time to get the data publicly available after it is reported.
A web-based data collection system to help decrease data entry time, as well as having built-in edits to cut out the use of analysts for error resolution.
NOTE: Click HERE to view associated IT investment.
Documentation Management
Centralized systems exist for management of documentation and controls over secure data for data exchange.
Disparate and decentralized systems still exist for assessment of project data and management of contract staff.
Separate customer management systems used to track and manage customer information and activities.
Inefficient contracting management controls.
Separate systems provide different views of project status and project activities.
No single view of project status for senior managers.
No integrated customer relationship management.
No single repository for communications and notifications of events and major decisions.
Central library of NAEP program documentation accessible for program and contractor staff.
Improved contracting management controls with data visualization and dashboarding.
Better management of web-based applications for integration of contractor activities and to report results to the American Public.
Improved management of communications with the American Public.
Improved communications and notifications amongst contractors and NCES.
Improve the need for a secure environment for Alliance and NCES personnel to exchange information regarding the assessment efforts.
NOTE: Click HERE to view associated IT investment.
Research Management
The ERIC library system provides publications of the Department of Education and core education literature for educators, researchers, and the general user.
The ERIC system is also widely distributed by commercial databases.
Long delays in bringing information online.
Reliance on abstracts and absence of full-text access.
Consistency across the ERIC record.
Limited to published electronic resources.
Paper Based system, no electronic full text.
6 to 9 months to release new content.
Multiple web sites with various designs and functionality.
To provide a comprehensive, easy-to-use, searchable, Internet-based bibliographic and full-text database of education research and information for educators, researchers, and the general public.
To use the Internet to enable citizens to access information and transact business.
Improved access to more education information as full-text articles or digital resources or links to publishers so that individuals can purchase those materials if they choose.
Improved access to education materials dealing with legislation (e.g,. e-Gov initiative).
New content available within 30 days of acquisition.
Single web site with improved functionality.
NOTE: Click HERE to view associated IT investment.
document.doc 2/29/08 30

Department of Education
Enterprise Transition Strategy Plan, February 2008
Business Area
Baseline View Performance Gap Target View
Multiple web sites with different designs, and functionality.
Table 17: ED Program – Office of Management (OM)
Business Area
Baseline View Performance Gap Target View
Facilities and Access Management
EDSTAR is the system at ED that provides access control and positive identity verification (PIV I) as required by HSPD-12 for access to ED facilities (EDSTAR incorporates the HSPD-12 requirements from FY 2006 through FY 2011).
Prior to FY 2004 there was no common identification in existence for Employees and Contractors.
Improve the strategic management of the Department's human capital to secure ED people, facilities and assets.
Implement the PIV I (positive identification and access control to facilities) of HSPD-12 complaint hardware and, security ID badge screening stations.
NOTE: Click HERE to view associated IT investment.
Table 18: ED Program – Office of Planning, Evaluation, and Policy Development (OPEDP)
Business Area
Baseline View Performance Gap Target View
Data and Report Management
Disparate and decentralized systems for entering, retrieving and viewing K-12/ Secondary Education related data.
Duplication of efforts and redundant processes.
Untimely, inconsistent K-12 data across program (Data silos create data inconsistencies across programs).
Inefficient paper-based data collection.
Central repositories to collect, retrieve, and view standardized K-12 data (Directory (contact/descriptive information), Membership (student/staff), Education Units (state, local, school), Programs, and Civil Rights data.
Simplify K-12 data collection process, reducing redundancy of effort and eliminating paper-based collections
Data reporting and analysis more efficient and effective by providing a central source for K–12 education performance data such as No Child Left Behind status.
Provide education information that is “fit for use.”
Disseminate K-12 information to external users, including states, researchers, parents, and other stakeholders.
Decreased need for hardcopy files storage.
document.doc 2/29/08 31

Department of Education
Enterprise Transition Strategy Plan, February 2008
Business Area
Baseline View Performance Gap Target View
More timely data facilitates formula grant payments for certain programs, timely reporting, and data publication
Reduction in OMB data collection requests and approvals.
Enhancement of employee’s work, moving it from a paper form-based process to a focus on business intelligence
Compliance with the Paperwork Reduction Act.
Support the integration and harnessing of the Department’s information assets to build business intelligence.
NOTE: Click HERE to view associated IT investment.
Table 19: ED Program – Office of Elementary and Secondary Education (OESE)
Business Area
Baseline View Performance Gap Target View
Migrant Information Management
Exchange of student records was manual.
State reporting on migratory student information was burdensome and manual.
Process of counting the number of migratory children in states was inefficient and manual – thereby resulting in data quality issues.
Lack of an efficient method to assist States in designing and supporting programs that help migrant students overcome the unique challenges associated with a migratory life in order to succeed in school and to successfully transition to postsecondary education or employment.
Paper-based and time-consuming Data Collection and analysis.
Data quality and reliability.
A system that enables users to obtain and use valid information to facilitate the grant administration, policy development, and evaluation of the Migrant Education Program (MEP).
Automated exchange of migrant student information among States.
The solution will leverage data stored in other Departmental resources (EDEN) in order to ease reporting burden on States.
Automated facilitation of:
Reporting of most migrant data elements needed for CSPR Part I & II. Analysis of schools enrolling migrant children.
Efficient collection (at a minimum) of educational and health-related data on migrant students to facilitate:
Timely enrollment of migrant students. Proper grade/course placement. Accrual of course credits.
NOTE: Click HERE to view associated IT investment.
3.2.2 Required Business Capabilities
document.doc 2/29/08 32

Department of Education
Enterprise Transition Strategy Plan, February 2008
Additionally, ED performed a business capabilities gap analysis to identify required functionality that is needed to achieve the Department’s Future State Vision, per Line of Business. The full results of this analysis are represented as required business capabilities in ED’s Information Resource Management IRM Strategic Plan; the business capabilities requirements (Table 20) are shown below.
Table 20: Business Capabilities Requirements ED’s IRM Strategic Plan
LOB Business Capabilities Requirements Description
Grants Grants Management – Application Find and apply for grants (online)
Collaboration for more efficient application review
Grants Management – Management Financial management – continued control of financial integrity of grants
Grants Management – Monitoring Grantee performance tracking, reporting, and document management
Integrated grants administration and performance
Evaluation Data Warehouse of Education Measures (aligned with Programs)
Ability to define proper measures aligned to Program and mission Strategic Goals
Ability to collaborate across programs to define / reuse performance information
Reduce Data Collection Burden – Standardization, Reuse, Security & Privacy
Common data standards and definition to enable sharing, aggregation, and analysis
Secure data collection
Collaboration for improved support of survey participants
Grants-Evaluation Alignment (evidence-based policies and programs)
Causal relationships between the programs initiatives and the education results
Ability to conduct multi-dimensional data analysis and reporting
Integrated grants administration and performance systems to enable impact assessment
Information Dissemination
Department-wide content, audience, and channel planning and coordination
Customer segmentation – dissemination needs and channel preferences
Cross-POC coordination, scheduling, and content creation
Consistency in web content development and presentation
Traffic monitoring to understand customer patterns and needs
Consistent data definition to promote data exchange
document.doc 2/29/08 33
Department of Education
Enterprise Transition Strategy Plan, February 2008
LOB Business Capabilities Requirements Description
Customer Self-Serve – analysis, reporting, and search
Structured on-line analytical capabilities
Tailored reporting
Improved search capabilities
Improved web page design and navigation
Multi-channel information request receipts and distribution methods
Loans Front-End Integration Improve aid awareness, application, account management and delivery
Single point of access to FSA data
Single view of customer account
Back-End Integration Improve aid program integrity
System modernization and integration
Improve aid servicing
Data Mining and Analysis Facilitate trending, forecasting, and credit risk management
Optimize performance by separating operational and analytical environments
Research Rigorous Research and Statistical analysis (continue)
Common data standards and definitions to enable sharing, aggregation, and analysis
Analytical tools to support multi-dimensional data analysis and reporting
Collaboration for improved support of survey participants
Acquisition and Dissemination of Educational Research Information
Knowledge management
Provide centralized access to published educational research
“What Works Clearinghouse”
Linkage of research findings to program objectives and key education issues (applying of research)
Leverage Research in Evaluation and Program Agenda
Define research agenda aligned to Program and mission Strategic Goals
Cross-utilize research findings and statistical information in program evaluation to further inform program effectiveness
Compliance Risk-Based Methodologies Leverage financial and performance data
Apply risk-based processes, analytical methodologies, and tools into education compliance
Reporting and analytical tools to monitor compliance trends
document.doc 2/29/08 34

Department of Education
Enterprise Transition Strategy Plan, February 2008
LOB Business Capabilities Requirements Description
Proactive Compliance Support proactive and preventive activities with appropriate workflow and case management tools
Monitor compliance trends and areas of historical non-compliance
Leverage mobile tools for field investigators Apply mobile tools and case-worker tools to field audits, inspections and investigation
Administration Provide common knowledge worker productivity tools
Provide a reliable infrastructure environment and common knowledge worker productivity tools (e.g., analytics, collaboration, case/risk management, web access, workflow management)
Financial integration across administration and programmatic areas
Achieve budget and performance integration to link program funding decisions to results
Leverage government-wide e-Gov and LOB initiatives
Standardize and adopt government-wide financial, procurement, and travel management.
Position ED to become a provider of grants servicing capabilities through the Grants Management LOB
document.doc 2/29/08 35

Department of Education
Enterprise Transition Strategy Plan, February 2008
4.0 REFINE AND PRIORITIZE SEGMENTS
As a result of the Performance and Business Capability Gap Analyses, ED refined, prioritized and began development of its Segment Architectures. The refinement and prioritization of the Department’s Segment Architectures was based on the:
Size of program performance gaps;
Common business needs based on required business capabilities;
Business impact;
IT investment expenditures per program;
Number of redundant services.
4.1 Core Mission Segments
ED Lines of Business are included in the Enterprise Architecture as a Core Mission Segment. However, the Department has also segmented its Business and Enterprise Services areas as defined by OMB’s EA Practice Guidance:
Core Mission Area Unique service areas defining the mission or purpose of the agency. Core mission areas are defined by the agency Business Model (BM).
Business Service Common or shared business services supporting the core mission areas. Business services are defined by the agency BM and include the foundational mechanisms and back office services used to achieve the purpose of the agency (e.g., inspections and auditing, program monitoring, human resource management, and financial management).
Enterprise Services (or Common shared IT Services) supporting core mission areas and business services. Enterprise services are defined by the agency Service Model (SM) and include the applications and service components used to achieve the purpose of the agency (e.g., knowledge management, records management, mapping/GIS, business intelligence, and reporting).
The table below lists the number of redundant ED IT projects with similar components, categorized by the Common Enabling Services (defined in Step 3 during the Redundancy and Gap Analysis).
Table 21: Number of Projects with Similar CES Components
Enterprise Services
Common Enabling ServicesNumber of Projects with
Similar Components
Performance and Productivity Services
Collaboration Management 16
Work Management 7
Case Management 10
document.doc 2/29/08 36

Department of Education
Enterprise Transition Strategy Plan, February 2008
Enterprise Services
Common Enabling ServicesNumber of Projects with
Similar Components
Performance Management 18
Knowledge and Data Services
Document/ Record /Content Management 51
Report Management 58
Knowledge Management 58
Data Management 90
Customer and Interface Services
Customer Management 19
Portal Management 32
Mobility Tools 4
Research and Statistics Services
Statistical and Analysis Tools 44
Survey Design Tools 1
Survey Management 15
IT Infrastructure Operations Support 63
Network, Storage, and Computing Platforms 8
Security & Privacy 8
SOA, Enabling Platforms 8
The common enabling services that had the greatest number of associated similar projects were:
1. Knowledge and Data Management
2. Document / Record / Content Management
3. IT Infrastructure/ Operations Support
4. Report Management
5. Portal Management
4.2 IT Spend Analysis
In order to incorporate IT expenditure considerations into the Segment prioritization process, the EA Program Office also developed a comprehensive Spend Analysis per Line of Business and Program Office. Based on the information gathered as part of this Analysis, the EA Program Office was able to determine where primary Lines of Business and Program Offices spending was, the mission priorities of ED’s organizational components, and where Segment Architecture development would be able to incur the greatest cost savings and performance improvement.
document.doc 2/29/08 37
Department of Education
Enterprise Transition Strategy Plan, February 2008
The results of the IT Spend Analysis are illustrated in the graphics below. Additional details can be found in the Department’s IT Investment Portfolio Analysis.
The pie chart to the left indicates that the majority of the Department’s IT expenditures are spent on the:
Loans Line of Business (FSA), and,
Administration Line of Business (primarily OCIO, OCFO, and OM).
The pie chart to the right breaks down average IT expenditures by ED Program Office. This chart demonstrates that IT investments are made primarily by:
FSA (Loans)
Support Offices – including OCIO, OCFO, OM, and OPEPD. OPEPD provides Budget Service for the Department of Education.
As a result of the Redundancy and Gap Analysis and the Department of Education IT Spend Analysis, the EA Program Office prioritized the Department’s segments for completion according to the timeline described in the following table.
Table 22: Segment Type with Status and Projected Completion
Segment Type Segment Name Status
Core Mission Loans Complete/ Authorized in Writing
Grants Complete/Authorized in Writing
Evaluation and Policy Analysis Completed Q1, FY2009
document.doc 2/29/08 38

Department of Education
Enterprise Transition Strategy Plan, February 2008
Segment Type Segment Name Status
Compliance Completed Q1, FY2010
Research Completed Q1, FY2011
Information Dissemination Completed Q1, FY2012
Business Services Budget Formulation and Execution Completed Q4, FY2008
Financial Management Completed Q1, FY2010
Human Resources Management Completed Q1, FY2011
IT Management Completed Q1, FY2012
Operations Management Competed Q1, FY2012
Enterprise Services
Knowledge and Data Services Complete/ Authorized in Writing
IT Infrastructure Services Complete/ Authorized in Writing
Identity Management Completed Q2, FY2009
Performance and Productivity Services Competed Q1, FY2010
Customer and Interface Services Completed Q1, FY2011
Research and Statistics Services Completed Q1, FY2012
document.doc 2/29/08 39

Department of Education
Enterprise Transition Strategy Plan, February 2008
5.0 DEFINE PROGRAMS AND PROJECTS The projects and programs in ED’s EA Transition Strategy were driven by the Department’s Enterprise Architecture and correspond to specific ED Segment Architecture. These projects and programs feed directly into ED’s IT investment management process. Projects are assigned to a program. Where a project has been launched, a project manager who is responsible for budget and execution of the project was assigned. For the purposes of ED’s EA Transition Strategy, a project is addressed as rollup to a program to show accurate dependencies between programs in ED’s sequencing plan.
5.1 Program Description
As defined in PART guidance from OMB, a program is an activity or set of activities intended to help achieve a particular outcome for the public. When making budget or other decisions, the Executive Branch and the Congress may recognize a program for mandated funding allocations. According to OMB’s EA Assessment Framework, the nature of programs varies dramatically across the Federal government.
Within ED’s Enterprise Architecture, the term “program” is used in several different ways as follows:
1. Most of ED’s workforce equates the term program with education-focused initiatives and activities listed on ED’s website at the following link: http://www.ed.gov/programs/find/title/index.html?src=sm.
2. Most of ED’s workforce also uses the term program as a modifier in order to identify Program Offices, which are major organizational components of the Department that directly provide education programs as defined in (1) above. Program Offices are a subset of the Principal Offices shown on ED’s website at the following link: http://www.ed.gov/about/offices/or/index.html?src=ln.
3. Within ED’s EA Transition Strategy, the term program is used to identify EA Transition Programs, which are a set of related activities and/or projects that transition part of ED’s EA from its current state to its target state.
At the Department of Education, this definition is further refined into Business and Technology Transition Programs:
EA Business Transition Programs transition part of ED’s Enterprise Business Architecture from its current state to its target state. ED’s EA Business Transition Programs either sustain or cause changes in ED’s business process components by leveraging enabling information technology. As such, these Programs are dependent on ED’s EA Technology Transition Programs. ED’s EA Business Transition Programs do not correspond directly to ED’s IT investments, but are instead dependent on ED’s IT investments.
document.doc 2/29/08 40

Department of Education
Enterprise Transition Strategy Plan, February 2008
EA Technology Transition Programs transition part of ED’s Enterprise Information Technology (IT) Architecture from its current state to its target state. ED’s EA Technology Transition Programs either sustain or cause changes in ED’s information technology components, which are leveraged into ED’s business processes via ED’s EA Business Transition Programs. As such, ED’s EA Business Transition Programs are dependent on ED’s EA Technology Transition Programs.
5.2 Project Description
According to OMB’s EA Assessment Framework, a project is a discrete, planned effort to achieve a specific goal or result within a brief timeframe. A program manager is accountable for the project as it moves through the investment process and implementation. Interactions between projects should be used to show accurate dependencies between programs; the sequencing plan is not intended to replace ongoing project management or to track agency budgets down to the project level.
Within ED’s EA Transition Strategy, the term project is used to identify EA Transition Projects, which are discrete activities that transition part of ED’s EA from its current state to its target state.
ED’s EA Transition projects are broken down into the following categorizations:
EA Business Transition Projects transition part of ED’s Enterprise Business Architecture from its current state to its target state as part of EA Business Transition Programs. ED’s EA Business Transition Projects cause changes in ED’s business process components by leveraging individual information technology components into the business process. As such, ED’s EA Business Transition Projects are dependent on ED’s EA Technology Transition Programs. These Transition Projects are not part of ED’s EA Technology Programs and as such are not part of ED’s IT investments, but are instead dependent on ED’s IT investments.
EA Technology Transition Projects transition part of ED’s Enterprise Information Technology (IT) Architecture from its current state to its target state as part of EA Technology Transition Programs. ED’s EA Technology Transition Projects cause changes in ED’s information technology components, which are leveraged into ED’s business processes via ED’s EA Business Transition Programs. As such, these Programs are dependent on ED’s EA Technology Transition Projects. ED’s EA Technology Transition Projects are part of EA Technology Transition Programs that correspond directly to ED’s IT investments.
5.3 ED Programs and Projects
5.3.1 ED Projects per Program and Completed Segment Architecture
document.doc 2/29/08 41
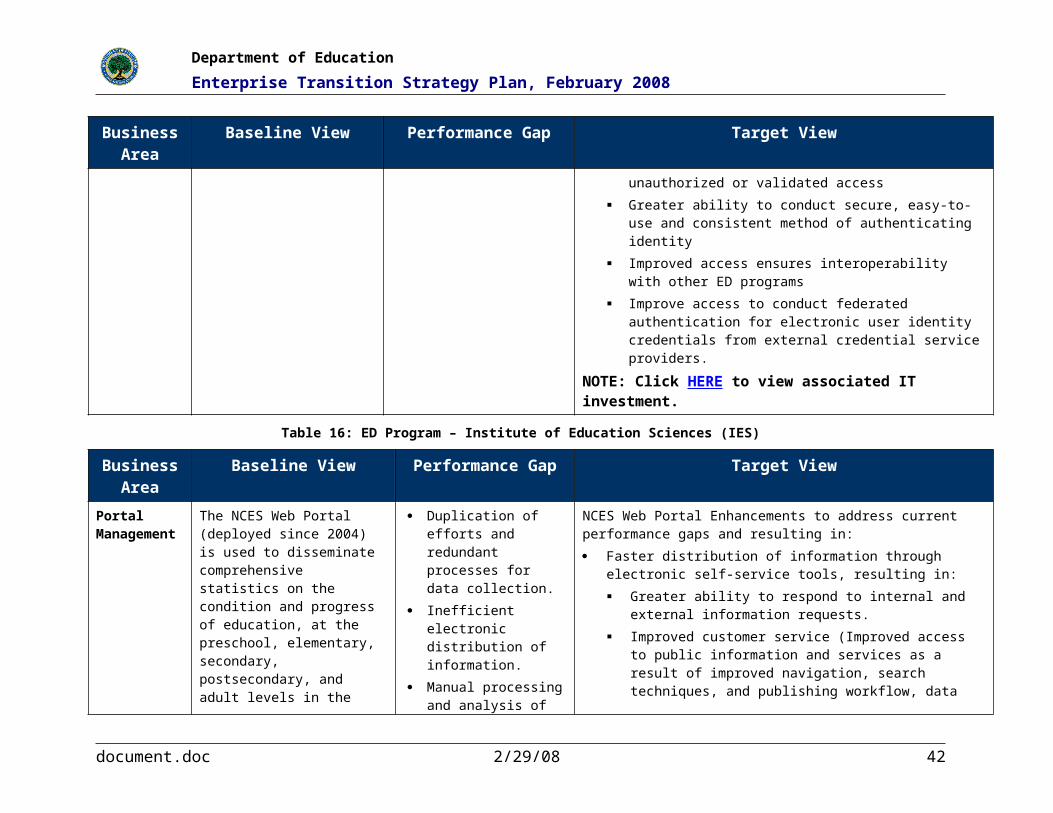
Department of Education
Enterprise Transition Strategy Plan, February 2008
Table 23: Completed Segments by Project Descriptions below represents ED’s Projects and Programs by completed segment architecture.
Table 23: Completed Segments by Project Descriptions
Project Description
Program: FSA
Enterprise Information System
The Enterprise Information System (EIS) is the cornerstone for the modernization of Federal Student Aids service delivery systems. The EIS has morphed from a strategy and visioning initiative into a systems development project. The development work under this initiative has been moved to the ADvance initiative with the exception of the Information Services. The EIS (Information Services) will assist in ensuring a secure, efficient and effective system infrastructure by enabling the integration of Federal Student Aid data through the Information Service infrastructure.
Common Origination and Disbursement (COD)
The COD investment provides a common platform and record for schools to originate and disburse Title IV funds, as well as a common process that addresses both the overlapping and individual needs of the Grants and Direct Loan programs. COD supports the FSA's Financial Management System & the PMA for Financial Performance by the use of financial information to measure, operate and predict the effectiveness and efficiency of COD activities in delivering Direct Loans and Grants to its' customers. COD’s system of controls includes areas as accounting, funds control, payments collections & receivables.
National Student Loan Data System (NSLDS)
NSLDS was mandated by Congress in the Higher Education Act and implemented in 1994. NSLDS aims to collect, store and make available detailed data about TITLE IV aid dispersed and the aid recipients. It aims to simplify and streamline aid delivery processes used by schools, lenders and guarantors throughout the country, replacing paper driven techniques with efficient electronic communications.
ADvance – Aid Delivery (Advance Operations)
ADvance–Aid Delivery is the starting point for students and parents in the financial aid process. Application Processing and Eligibility Determination is the operations part of ADvance—Aid Delivery, which incorporates the functions of application processing and eligibility currently provided through the Central Processing System (CPS). The application functions include Free Application for Federal Student Aid (FAFSA) processing, both paper and web-based; data matching with the Social Security Administration, Veterans Administration, Selective Service, Department of Justice and Department of Homeland Security for eligibility determinations; initiation of PIN numbers for electronic signatures; eligibility notifications to applicants, both paper and web-based; electronic notifications of applicant eligibility to schools and state agencies; customer support for schools and other end-users of FAFSA data and services; and provision of software products and web functionality for use by schools in interfacing with application, origination and disbursement systems, both web and pc-based.
The following describes the functions involved:
Central Processing System
Federal Student Aid Information Center
Federal Student Aid Loan Ombudsman Center
Editorial Services
Image and Data Capture
EDExpress
Ancillary Services
document.doc 2/29/08 42

Department of Education
Enterprise Transition Strategy Plan, February 2008
Project Description
Participation Management
FAA Access
ADvance Person Data Management (PDM)
The ADvance—Person Data Management Program is a key next step in realizing Federal Student Aid’s modernization and integration efforts. This initiative defined the Federal Student Aid Target State Vision (TSV) for the delivery of Federal Student Aid and the sequencing of the TSV. Previously, ADvance’s scope included the development of integrated solutions for the entire front end of the student aid life cycle. The ADvance program has focused its effort around the essential first step in the student aid life cycle and its impact to business functions and needs across phases of the student aid life cycle, namely the creation, maintenance, access, storage and viewing of "person" information. The ADvance will implement key components within the Federal Student Aid Target State Vision. These key components are: the Person Record Management System, PIN Re-engineering, Integrated Student View, and the Operational data Store.
Person Record Management Service (PRMS): The PRMS is a centralized system of record for Person data for Federal Student Aid Application systems.
PIN Re-engineering: Re-engineer the PIN database to make it an enterprise asset that is aligned with our security architecture.
Integrated Student View (ISV): Integrated Student View will create an enterprise service utilizing the enterprise Portal asset and infrastructure to allow for current, consistent, comprehensive and accurate views of student data. Delivering this functionality will leverage recent advancements and implementations of the enabling infrastructure facilitating an enterprise service oriented architecture (SOA).
Operational Data Store: The Operational Data Store (ODS) will be used to store, manage, and access operational data to support Integrated Student View and to facilitate convenient, reliable, and efficient usage of enterprise operational data.
Student Aid Internet Gateway (SAIG)
SAIG is a store and forward mailbox application used by FSA’s customers (post-secondary schools, lenders, guaranty agencies, state agencies, and other electronic trading partners) for sending and receiving Privacy Act data to the Title IV application systems. This information can be used by Federal Student Aid to determine whether the Title IV customer submitted their data prior to the application deadline. The information makes the institution accountable for funding received as a result of processed data via SAIG. The SAIG Portal provides telecommunications support and facilitates data transmission between FSA’s customers and the various Title IV Application Systems.
Federal Student Aid Financial Management System (FSA FMS)
Utilizing Oracle Federal Financials, FMS is the single point of financial information by institution, integrating transactions both from the FSA feeder systems as well as from the Grants Administration and Payment System (GAPS).
FMS consolidates and manages FSA program transactions from FSA's feeder systems (e.g., FFEL, Direct Loan, Pell, LEAP/SLEAP, and Campus-based transactions). The feeders interface functional transactions to FMS where they are translated to the appropriate accounting. It facilitates reconciliation and internal program management and reporting, and large volumes of payment processing. FMS tracks and manages the payment processing for direct loan originations and consolidations by GAPS and processes refunds to borrowers for overpaid loans. Through highly customized extensions, tightly integrated with the Oracle sub-ledgers, FMS processes large volumes of payments to the lender and guarantee agency communities. It receives electronic invoices and advice of fees payable to Education, performs complex custom validations and reasonability checks to minimize erroneous payments, and processes the transactions through Oracle sub-ledgers to generate Treasury payment files and accounting
document.doc 2/29/08 43
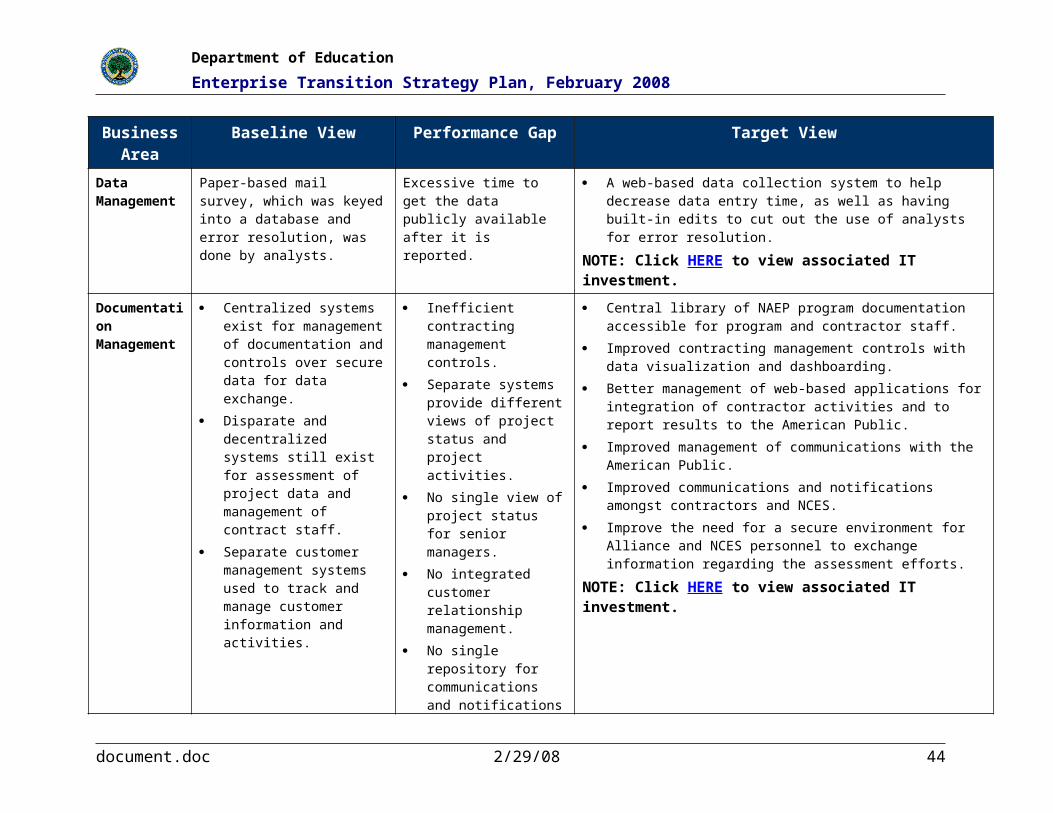
Department of Education
Enterprise Transition Strategy Plan, February 2008
Project Description
transactions. The accounting transactions are, in turn, summarized and sent to the FMSS core financial management system for external financial reporting.
Common Services for Borrowers (CSB)
Essentially compromised of core legacy systems as individual components – modified to improve upon the previous operating efficiencies of totally separate systems. The solution, known as Common Services for Borrowers-Legacy (CSB-Legacy), includes the following 4 components: Direct Loan Servicing System (DLSS), Debt Management and Collections System (DMCS), Direct Loan Consolidation System (DLCS), and Conditional Disability Discharge Tracking System (CDDTS).
The CSB-Legacy solution will focus on system operations and maintenance and will be operated in a steady state environment. Further, it will involve consolidation of multiple, diverse call centers and operations facilities into fewer, more efficient facilities; and redundant functions will be eliminated to the extent possible.
CSB contributes to the fulfillment of service to individuals focused on building easy one-stop shopping creating single points of easy entry to access high quality of governmental services.
Integrated Partner Management (IPM)
Integrated Partner Management (IPM) will become the system of record for institutional trading partners, regardless of the type of its interaction with Federal Student Aid. The IPM initiative, through process reengineering and process automation, will provide, in one solution, improved eligibility, enrollment, and oversight processes used to manage partner entities (i.e., schools, school services, lender services, guarantee agencies, private collection agencies, state agencies, federal agencies, accrediting agencies, auditors, and owners) as they administer Title IV financial aid for students.
Integrated Technical Architecture / Enterprise Application Integration (ITA/EAI)
ITA and EAI/Enterprise Service Bus (ESB) provide an enterprise technical architecture that permits Federal Student Aid (FSA) to manage the development /execution of FSA applications in support of the business strategy. Using ITA and EAI technology, FSA successfully migrated numerous legacy systems and applications to a common platform and common standards.
The ESB is an integration architecture that leverages EAI technologies and implements industry Web services standards. The ESB will provide foundational services for Service-oriented Architectures (SOAs). The ESB will support communication between systems and will support the use of shared services.
Virtual Data Center (VDC)
The VDC serves as the host facility for Federal Student Aid's (FSA) federally mandated systems and the Title IV Delivery Systems that process student financial aid applications (grants, loans, and work-study), providing schools and lenders with eligibility determinations, and support payments from, and repayment to lenders. The facility provides electronic access to these applications over the World Wide Web, providing benefits to the end user including; reduction in application errors, immediate end user confirmation of FAFSA filing requirements completion, and immediate preliminary summary of expected parental financial support.
Federal Student Aid Enterprise Web Portal Strategy (Portals)
The Federal Student Aid Enterprise Portal will provide streamlined access to the organization’s information and services for customers, partners and employees. Federal Student Aid currently maintains 73 plus websites requiring web users to “shop” for data and services. Much time and energy is wasted in accessing systems and manually assembling data into integrated views. The Enterprise Portal will simplify the web presence and align it with business goals such as increasing financial aid awareness, building long term online relationships with students and partners, and achieving proactive service delivery (i.e., pushing data and content to users based on their profile attributes).
The portal will improve the online experience of customers, partners and employees; enhance business productivity by delivering online services and data from multiple systems to satisfy their specific needs; and support improved communications and teamwork. The portal will also
document.doc 2/29/08 44

Department of Education
Enterprise Transition Strategy Plan, February 2008
Project Description
provide business applications with an infrastructure that supports the development and deployment of the portal capabilities across the enterprise and reduces the technology burden on small and large projects.
The Federal Student Aid Enterprise Portal will support internal portal views (employees) and external portal views (students, financial partners, schools) that will evolve over time to meet enterprise needs.
Segment/Program: Grants – OCFO
G5 The G5 investment has been selected and approved by the Office of Management and Budget (OMB) as one of three Centers of Excellence/Shared service providers for the Grants Management Line of Business (GMLoB). This investment provides for the replacement of the ED’s legacy grant management system - the Grant Administration and Payment System (GAPS) and supports the Line of Business consolidation initiative. The shared service model enables ED to provide services to client agencies that will migrate to the ED’s end-to end grant management system.
G5 will control payments for the ED’s programs, including payments for grants and direct loans and other program-related obligations. G5 will be fully integrated with Financial Management System Software (FMSS) and will serve as a subsidiary to the general ledger for program-related obligations, payments, and expenditures. G5 will interface with FMSS at the summary level for funds control and general ledger postings.
Segment/Program: Knowledge and Data Services – OCIO
Data Warehouse
The “EDFacts” data warehouse (EDW) capability enables customers to link information from the supplying systems to perform analysis that would otherwise be too difficult to perform from the supplying system information in isolation. The data warehouse provides a common enabling service that may be leveraged for providing central reporting for existing and future systems.
Segment/Program: ITI – OCIO
EDUCATE The Education Department Utility for Communications, Applications, and Technical Environment (EDUCATE), formerly known as EDNet, is part of the ED’s approach to moving towards a managed services environment in order to optimize the infrastructure, save taxpayer dollars and improve services for both internal and external stakeholders.
Previously, IT infrastructure services at ED were supported through a multi-faceted contract (EDNet) that consists of a fixed price portion and specific vehicles involving both fixed priced projects and time and material activities. The Department has transitioned to a Contractor Owned-Contractor Operated (COCO) Managed IT infrastructure service model.
The COCO Managed IT Infrastructure service model will provide the following Operational Services:
Security & Privacy Operations (SP)
Desktop Services (DS)
document.doc 2/29/08 45
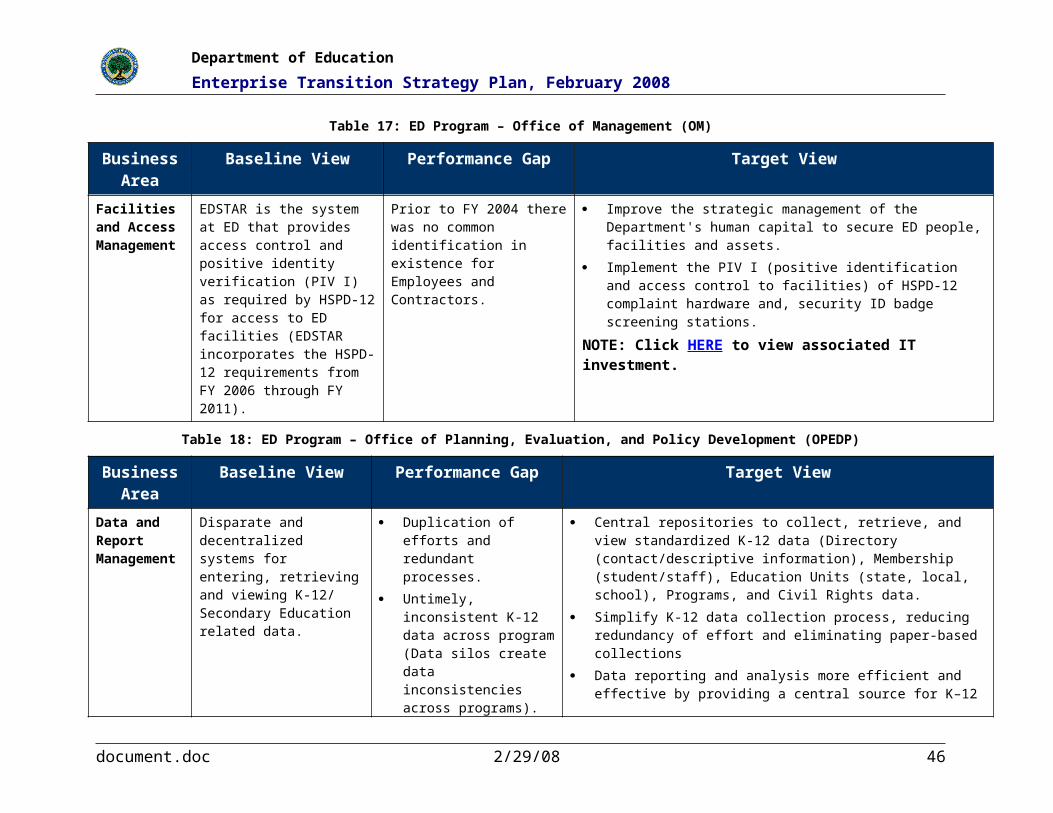
Department of Education
Enterprise Transition Strategy Plan, February 2008
Project Description
Helpdesk Support (HS)
Systems/Data Center Operations (SD)
E-Mail (EM)
Network Services / Telecommunications / Multimedia Services (NS)
Disaster Recovery (DR)
Special Services (SS)
Printer Services (PS)
5.3.2 ED Projects per Program and Segment Architecture
Table 24: Segment and Program by Project Descriptions provides the planned segment architecture:
Table 24: Segment and Program by Project Descriptions
Project Description
Segment/Program: Financial Management – OCFO
CPSS CPSS provides users with a central repository to enter retrieve and view Acquisition/contract related data.
FMSS The Financial Management Support System (FMSS) is the Department of Education's core financial management system. It provides department-wide general ledger, budget execution, payment, receivable, funds control and financial reporting capabilities. The FMSS provides security for application user access, data validation, transaction validation, and funding controls. . It also provides a strong system of internal controls through separation of duties, cross-validation edits of accounting segments and a series of account relationship tests that ensure the integrity of the Department's financial data.
Regulatory financial reports are produced by the FMSS, including the department's financial statements.
ISS Integrated Support Services (ISS) integrates disparate systems (for grants, contracts, purchase orders, travel, and accounting) into a single integrated financial management solution for the Department- EDCAPS. ISS is not a system but a bundle of services that support EDCAPS systems (CPSS, GAPS, FMSS, TMS). ISS services will help ensure that the EDCAPS systems continue to work together as an integrated financial management system as they evolve and improve.
document.doc 2/29/08 46

Department of Education
Enterprise Transition Strategy Plan, February 2008
Project Description
TMS The Travel Management System (TMS) provides a web-based end-to-end integrated solution to ED travelers. The solution enables travel documentation to be completed and processed in an electronic format thus providing a more efficient document flow. The solution also supports EFT payments through split disbursement capability.
This eGov 100% deployed travel system supports the electronic processing of travel documents to support the Department's travel management system. This system allows ED travelers the ability to create and electronically route travel documents. After completion of electronic documents, files are electronically integrated to the Department's financial system to create obligation or expenditure transactions through to the payment process.
Segment/Program: Identity Management – OCIO
E-Authentication
E-Authentication (the Department has established a federation agreement with the General Services Agency for this initiative) minimizes the burden on businesses, public and government users when obtaining services on-line by providing a secure user authentication infrastructure for web-based transactions, eliminating the need for separate processes for the verification of identity and electronic signatures. This initiative enables the E-Authentication functionality to perform federated authentication in which the Department's systems can begin to use electronic user identity credentials from external credential service providers (i.e., schools, financial institutions, etc.).
NCES Web Support
The National Center for Education Statistics (NCES) Web Support project capitalizes on Internet opportunities to expand public access to NCES information and survey data, improve the speed and efficiency of service delivery, and facilitate communication between government and State education officials, as well as citizens. The project supports and continually updates the main NCES website, which is the first statistical or information contact with ED for many researchers and practitioners. The NCES website provides the following services: (a) presents NCES's key survey and publication releases, (b) broadens NCES's reach to more citizens and educators, (c) offers intuitive navigation to constantly updated survey and statistical content, (d) provides accurate and up-to-date information; and, (e) provides a unified entry point for customers seeking national education statistics.
IPEDS The Integrated Postsecondary Education Data System (IPEDS) uses the Internet to enable citizens to penetrate the Federal bureaucracy to access information, via the College Opportunities On-Line system displaying prices and student aid information for parents and students. IPEDS is the core IES/NCES data collection and dissemination project to describe postsecondary education institutions in the U.S. IPEDS is required by the Higher Education Act, as amended. IPEDS uses web-based collection and dissemination software, served by NCES at http://surveys.nces.ed.gov and http://nces.ed.gov/ipeds.
document.doc 2/29/08 47
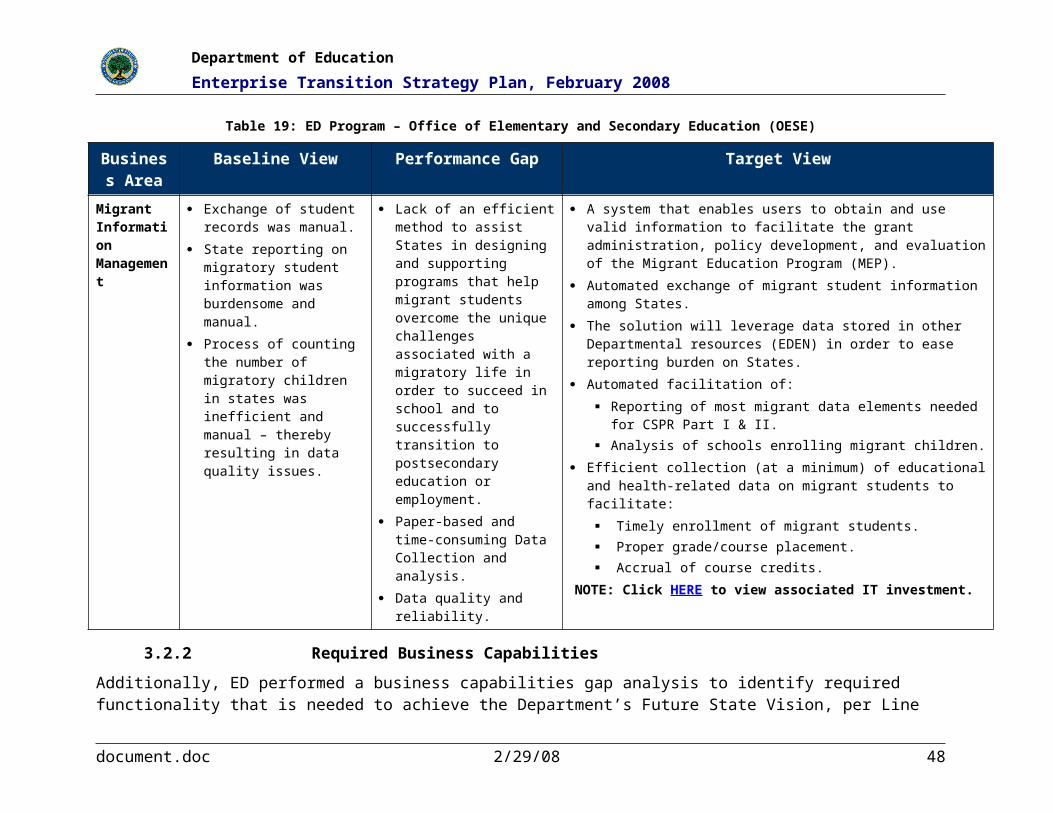
Department of Education
Enterprise Transition Strategy Plan, February 2008
Project Description
NAEP The National Center for Education Statistics (NCES) is the sponsoring entity for the National Assessment of Educational Progress (NAEP) program, a nationwide assessment effort involving multiple contractors responsible for performing the assessment and executing the vision of the assessment from NCES and the National Assessment Governing Board (NAGB).
This Program supports the improvement of students by providing timely assessment data online for parents, teachers, policymakers, and educators involved in establishing curriculum and achievement policies. The NAEP program also provides objective, invaluable research data on the progress of students in core studies, including reading/language arts.
NAEP Network is a set of applications available to NCES, State NAEP coordinators, and NAEP assessment contractors to receive updated information and guidance regarding the current year's assessments and to collaborate with NAEP personnel.
ERIC The mission of ERIC is to provide a comprehensive, easy-to-use, searchable, Internet-based bibliographic and full-text database of education research and information for educators, researchers, and the general public. It is the only system within the Federal Government that provides this service.
The ERIC library includes publications of ED, and many of these publications are helpful to parents as they seek information on increasing students achievement, higher education, rural and urban schools, school counseling and guidance information, and other ERIC topics. The ERIC library is also widely distributed by commercial databases, and the estimated collective total of ERIC search in 2006 was 62 million through appropriate distribution channels.
Segment/Program: Human Resources Management – OM
ID Access Control (EDSTAR)
The goal of ID ACCESS Control System (EDSTAR) is to provide protection of Government owned and leased facilities, protection of employees and contractors and provide controlled access to the ED’s critical infrastructure. This project consolidates multiple access and Identification cards and increases ease of access for employees and contractors and tenant Government agencies housed in Departmental spaces. ESTAR increases efficiency of Federal Clearance process and Personal Identification Standards for HSPD-12.
Segment/Program: Evaluation and Policy Analysis – OPEPD
EDEN (EDFacts)
The Education Data Exchange Network (EDEN) is a centralized, Internet-based system of elementary and secondary education data (K-12) from 52 State education agencies. This data is available for state, local education agency, and school levels and includes demographics, program participation, implementation, and outcomes. EDEN data is used for planning, policy, and management at the federal, state, and local levels. EDEN supports the Elementary and Secondary Education Act, as amended by the No Child Left Behind Act of 2001 (P.L. 107-110).
The EDEN system has three components.
1. EDEN Submission System that collects the bulk of the K-12 data. 2. Survey/online collection capability that collects data that isn't “EDEN-
able.” Generally this data is extended text or one-time data. 3. EDFacts reporting capability. EDFacts provides ad hoc and standard
document.doc 2/29/08 48

Department of Education
Enterprise Transition Strategy Plan, February 2008
Project Descriptionreports for program offices, States, and for the EDEN project management office to manage the EDEN program.
Segment/Program: Information Dissemination – OESE
MSIX The Office of Elementary and Secondary Education (OESE) Office of Migrant Education (OME) is responsible for administering the Migrant Education Program (MEP). OME is mandated in the No Child Left Behind Act, Section 1308(b) to assist the States in developing effective methods for the electronic transfer of student records and in determining the number of migratory children in States. OME established the Migrant Student Information Exchange (MSIX) project to accomplish this mandate.
5.4 Dependencies between Transition Programs and Projects
ED’s EA Transition Strategy maps the dependencies between programs and projects so the effects of budget decisions or slipping schedules can be quickly assessed for impacts on performance milestones and plans to achieve its Target EA vision.
ED’s EA Business Transition Projects, as defined above reflect the dependencies between ED’s EA Business Transition Programs and ED’s EA Technology Transition Programs. For this reason, ED’s EA Business Transition Projects appear in the Sequencing Plans of both the Business and the Information Technology Segment Areas. ED’s EA Business Transition Projects are listed in later in this document.
ED’s EA Technology Transition Projects, as defined above, subdivide EA Technology Transition Programs into phases that correspond to the Department’s Lifecycle Management (LCM) process. Projects are dependent upon the completion of tasks for earlier phases.
Dependencies between the Department’s (non-FSA) projects are illustrated in the following figure (Figure 6). The colored boxes indicate IT investments that are dependent upon other IT investments AND have investments dependent upon them (a many-to-many relationship).
document.doc 2/29/08 49

Department of Education
Enterprise Transition Strategy Plan, February 2008
OCIO
CPSS *
OPEPD
FMSS *
ISS
TMS/eTravel
G5 *
E-Authenticartion
EDEN (EDFacts)
OCFO
Document Management Shared Service
eSignature Policy
EDCAPS
Data Warehouse
Identity Management
EDUCATE(Migration to
Windows Server 2003,Vista, Service Compliance)
Data Warehouse *
CPSS
FMSS
GAPS/ G5
EDEN
IPEDS
CCD
ED I Dependencies ED ProjectsED Projects
Figure 6: ED Non-FSA Projects with Dependencies
Dependencies between FSA projects are illustrated in the following figure (Figure 7: ED FSA Projects with Dependencies). The colored boxes indicate IT investments that are dependent upon other IT investments AND have investments dependent upon them (a many-to-many relationship). Further information on the specified investments or dependencies can be found in the Loans Segment Architecture.
document.doc 2/29/08 50

Department of Education
Enterprise Transition Strategy Plan, February 2008
Figure 7: ED FSA Projects with Dependencies
Dependencies between Department of Education Programs and IT investments are detailed in the following sections.
5.4.1 Project Dependencies per Program and Completed Segment Architecture
The following dependencies (Table 25) are associated with completed Department of Education Segment Architectures, which have been approved in writing by their respective business owners.
Table 25: Segment and Program by Completed Project Dependencies
Project Dependency
Segment/Program: – Loans / FSA
Enterprise Information System
No known dependencies
document.doc 2/29/08 51
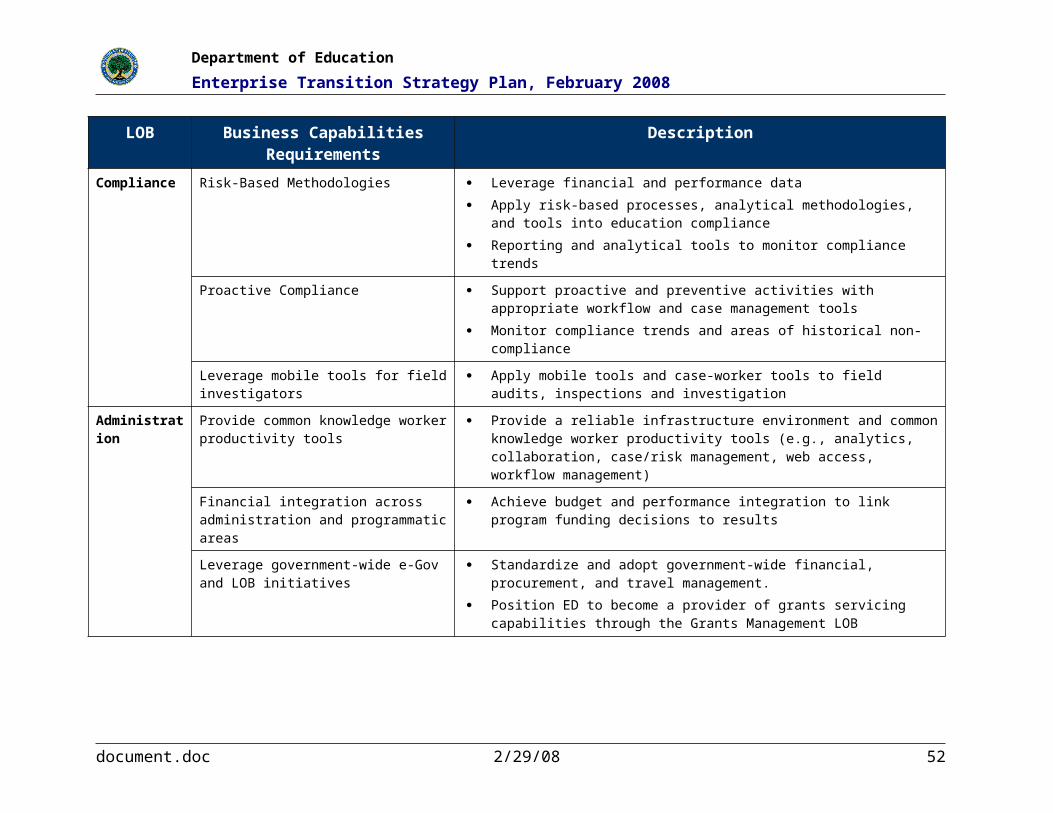
Department of Education
Enterprise Transition Strategy Plan, February 2008
Project Dependency
Common Origination and Disbursement (COD)
Federal Student Aid Handbook Manage FMS Operations – 4.1
Common Services for Borrowers FMS Enhancements – 11.8
National Student Loan Data System (NSLDS)
No known dependencies
ADvance – Aid Delivery (Advance Operations)
Common and Origination and Disbursement (COD) Enhancements 6.0
Advance HERA of 2005
Common Origination and Disbursement Enhancements (COD) 5.0
Advance Person Data Mgmt (Advance PDM)
No known dependencies
Student Aid Internet Gateway (SAIG)
No known dependencies
Federal Student Aid Financial Management System
Virtual Data Center (VDC) Transition
Common Origination and Disbursement (COD) Enhancements 6.0 Advance
Common Services for Borrowers (CSB)
No known dependencies
Integrated Partner Management (IPM)
Portal Strategy and Prototype SEC Standards
Enterprise Architecture
Security Architecture
Identity and Access Management
Data Strategy (IF/SAHM or Enterprise Information System)
Integrated Technical Architecture/ Enterprise Application Integration (ITA/EAI)
Virtual Data Center (VDC) Transition
Virtual Data Center (VDC) No known dependencies
Federal Student Aid Enterprise Web Portal Strategy (Portals)
Virtual Data Center (VDC) Transition
Enterprise Service Bus
G5 (GRANTS) Migration to Vista (provided by EDUCATE)
This IT investment depends on the implementation of a Departmental Document Management Shared Service
Education needs to approve a eSignature Policy and standard by Q3 2009
document.doc 2/29/08 52

Department of Education
Enterprise Transition Strategy Plan, February 2008
Project Dependency
Segment/Program: Grant – OCFO
G5 (GRANTS) Migration to Vista (provided by EDUCATE)
This IT investment depends on the implementation of a Departmental Document Management Shared Service
Education needs to approve a eSignature Policy and standard by Q3 2009
Segment/Program: Knowledge and Data Services – OCIO
Data Warehouse Depends on G5, EDEN, IPEDS, CCD (these are feeder systems).
Segment/Program: ITI – OCIO
EDUCATE EDUCATE is now a Contractor Owned Contractor Operated (COCO) environment with firm and agreed upon SLAs
5.4.2 Project Dependencies per Program & Segment Architecture
The following dependencies (Table 26) are associated with Department of Education Segment Architecture, which will be approved in writing according to the ED’s Segment Prioritization Schedule.
Table 26: Segment and Program by Project Dependencies
document.doc 2/29/08 53

Department of Education
Enterprise Transition Strategy Plan, February 2008
Project Dependency
Segment/Program: Financial Management – OCFO
CPSS Migration to Windows 2003 (provided by EDUCATE)
This IT investment depends on the implementation of a Departmental Document Management Shared Service
Education needs to approve a eSignature Policy and standard by Q3 2009
FMSS Migration to Windows 2003 (provided by EDUCATE)
This IT investment depends on the implementation of a Departmental Document Management Shared Service
Education needs to approve a eSignature Policy and standard by Q3 2009
ISS ISS must rely on the ED network for access to the EDCAPS systems
ISS must rely on OCIO/EDUCATE to configure servers
TMS Migration to Windows 2003 (provided by EDUCATE)
EDUCATE
EDCAPS Applications – CPSS and FMSS
Segment/Program: Identity Management – OCIO
E-Authentication EDUCATE service compliance capability
Continued service and interoperability is dependent upon GSA, OMB and external sources for capability assurance
Successful transition and implementation by POCs within ED to a common framework for identity management
Segment/Program: Research and Statistics Services – IES
NCES Web Support
No known dependencies
IPEDS No known dependencies
NAEP No known dependencies
ERIC No known dependencies
Segment/Program: Human Resources Management – OM
ID Access Control (EDSTAR)
No known dependencies
document.doc 2/29/08 54

Department of Education
Enterprise Transition Strategy Plan, February 2008
Project Dependency
Segment/Program: Evaluation and Policy Analysis – OPEPD
EDEN (EDFacts)
Reporting for Program Offices and other users is dependent on acquisition of data that is fit for use. “Fitness for use” includes data quality attributes such as completeness, timeliness, consistency, criticality of need, etc.
EDEN (EDFacts) operations and maintenance tasks are dependent on each other. Selection of one area not to fund or to delay will cause others to fail, thus the overall program will fail. The multiple areas of EDFacts will be collapsed into one WBS, “Maintenance,” in FY 09 to avoid unneeded detail and confusion about the EDEN (EDFacts) program. Maintenance areas include: Data Definition, Data Infrastructure, Data Quality, Data Acquisition, Data Usage, Knowledge Management, Capability Building, Platform Infrastructure, Partner Customer Support, and EDW O&M
EDEN (EDFacts) is dependent on the EDNet (EDUCATE) and the Data Warehouse. (Currently, EDEN (EDFacts) is supporting O&M for the EDEN-related portion of the Data Warehouse, but not other areas that may be used by other offices.)
Segment/Program: Information Dissemination – OESE
MSIX No known dependencies
5.5 ED Project – CES Linkage
In addition to defining the Department’s Program and Projects, and their associated dependencies, the ED EA Program Office also linked Common Enabling Services (CES’s) to projects, as appropriate. These common services were identified in Step 2 (Refine and Prioritize Develop Segments) of the Departments Transition Strategy Plan Approach.
As projects throughout the Department are developed (throughout its life cycle), the EA Program Office will use the Project-CES Linkage to:
Identify opportunities for service component reuse
Implement new, common business solutions for use throughout the enterprise
This effort will result in significant cost savings cost avoidance for Education.
The Department has already started this effort by implementing a shared Enterprise Data Warehouse and is in the planning stages of a shared Document Management and Collaboration Management solutions.
The ED Project – CES Linkage is provided in the following table (Table 27).
document.doc 2/29/08 55

Department of Education
Enterprise Transition Strategy Plan, February 2008
Table 27: Common Enterprise Service Needed by Program Office and Project
Common Enterprise Service Needed
Currently in Place?
If Yes, Indicate Application/Tool NameIf No, Provide Date the CES is needed
Program Office/Project: OCFO – CPSS
Document/ Content Management
Yes Comprizon.Suite/CCR
Report Management Yes Comprizon.Suite/FPDS-NG
Knowledge Management Yes Comprizon.Suite
Data Management Yes Comprizon.Suite/CCR/FPDS-NG
Customer Management Yes Comprizon.Suite
Portal Management Yes Comprizon.Suite/CCR/FPDS-NG
Program Office/Project: OCFO – FMSS
Document/ Content Management
Yes Oracle 11.5.10
Report Management Yes Cognos
Data Management Yes Oracle 11.5.10
Program Office/Project: OCFO – ISS
Work Management Yes PAWZ
Report Management Yes Cognos, Oracle Discoverer
Data Management Yes Oracle 10g Database
Customer Management Yes Rational: Clearcase, Clearquest, RequisitePro, Rose
Operations Support Yes IBM P-Series Servers, AIX operating system, IBM support services
Network, Storage, and Computing Platforms
Yes IBM SAN, Oracle RAC
Security & Privacy Yes NetBackup, SSH, Tripwire, Verisign, Secure Shell, FindIT
Program Office/Project: OCFO – G5 (GAPS)
Report Management No Q1 2010
Work Management Yes Websphere process server
Collaboration Management No Q1 2009
Document/Content Management
No Q1 2010
Data Management Yes Oracle Q1 2009
Portal Management Yes Websphere Portal
document.doc 2/29/08 56

Department of Education
Enterprise Transition Strategy Plan, February 2008
Common Enterprise Service Needed
Currently in Place?
If Yes, Indicate Application/Tool NameIf No, Provide Date the CES is needed
Network, Storage, and Computing Platforms
Yes IBM Servers
Security & Privacy Yes Tivoli Access Manager and Federated Identity Manager
SOA, Enabling Platforms Yes Websphere
Digital Signatures No Q1 2010
Program Office/Project: IES – NCES Web Support
Survey Design Tools Yes CCD Collection
ALS Collection
Statistical and Analysis Tools Yes BAT
Library Compare Tool
Report Management Yes Build A Table
PDMS
CCD Survey
Library Compare Tool
Program Office/Project: IES – IPEDS
Data Management Yes IPEDS Database
Statistical and Analysis Tools Yes Peer Analysis System
Survey ManagementYes IPEDS Web-based Data Collection
System
Report Management Yes NAEP Integrated Management System
NAEP Data Explorer
Customer Management Yes NAEP Customer Relationship Management Tools
NAEP Network
Statistical and Analysis Tools Yes WebTrends
NAEP Data Explorer
Program Office/Project: IES – ERIC
Document/ Content Management
Yes Documentum and BEA
Portal Management Yes Documentum and BEA
Knowledge Management Yes ERIC Workflow
Statistical and Analysis Tools Yes Web Trends
Customer Management Yes CA Unicenter
document.doc 2/29/08 57

Department of Education
Enterprise Transition Strategy Plan, February 2008
Common Enterprise Service Needed
Currently in Place?
If Yes, Indicate Application/Tool NameIf No, Provide Date the CES is needed
Program Office/Project: OM – ID Access Control (EDSTAR)
Operations Support Yes EDSTAR provides operation support through the control of access to ED facilities and positive Identification verification – the applications are GSA approved NIST approved HSPD-12 components to include smart card technology, PKI certificates, and Windows XP servers).
Security & Privacy Yes Use of Public Key Infrastructure (PKI Certificates as mandated by HSPD-12). Vendor is Verisign, GSA approved provider for PKI. The PKI contract is managed in OCIO-IA and there are additional PKI certificates available on the vehicle for identity management and logical access use.
Program Office/Project: OPEDP – EDEN
Knowledge Management Yes Data Warehouse
No Appian Enterprise 5/2/2008
Report Management Yes Cognos
Data Management Yes Cognos
No Appian 5/2/2008
Collaboration Management No Appian 5/2/2008
Work Management No Appian 5/2/2008
Survey Design tools Yes ResQSoft
No Appian 5/2/2008
Survey Management Yes ResQSoft Getting obsolete
No Appian 5/2/2008
Other Appian and Cognos are good candidates for enterprise use.
[Appian.com] Features Appian Enterprise offers may or may not be acquired for EDFacts.
Program Office/Project: OESE – MSIX
Report Management Yes Cognos Reports
Oracle Reports
Network, Storage, and Computing Platforms
Yes Unix
document.doc 2/29/08 58

Department of Education
Enterprise Transition Strategy Plan, February 2008
Common Enterprise Service Needed
Currently in Place?
If Yes, Indicate Application/Tool NameIf No, Provide Date the CES is needed
Security and Privacy Yes Oracle 11i
Data Management Yes Oracle 11i
Program Office/Project: OCIO – E-Authentication
Customer Management Yes EDUCATE
Mobility Tools Yes EDUCATE
Operations Support Yes EDUCATE
SOA Enabling Platforms Yes Webseal
Program Office/Project: OCIO – Data Warehouse
Document/ Content Management
No Q1 2008
Report Management Yes Cognos Report Net; Cognos Power Play – OLAP
Knowledge Management Yes Cognos
Data Management Yes Oracle
Portal Management Yes Provided by EDUCATE
Program Office/Project: OCIO – EDUCATE
Collaboration Management Yes Microsoft Exchange, Microsoft Outlook
Report Management Yes OPAS, ED-INSIGHT, Atrium Asset Management System (database), SMS, BMC Marimba, CMDB (configuration management database), Asset Management System (AMS)
Document Management Yes EMC’s Documentum
Data Management Yes Oracle
Customer Management Yes OPAS, ED-INSIGHT
Portal Management Yes OPAS, ED-INSIGHT
Statistical and Analysis Tools Yes OPAS, ED-INSIGHT
Network, Storage, and Computing Platforms
Yes PTC/FTC
5.5.1 Using ED’s TSP: CES Investments
document.doc 2/29/08 59

Department of Education
Enterprise Transition Strategy Plan, February 2008
Based upon the ED Project – CES Linkage analysis results, provided in Section 5.5, the following services represent the most common business needs across the Department (in order of priority):
1. Document Management
2. Collaboration Management
3. Report Management
These three services are not currently available to G5 (part of the Grants Management Segment Architecture) but are a critical component of its functionality. Additionally, Data Warehouse requires this service as well.
Although there is not an immediate need for Report Management (specified 9 times) is the most commonly expressed business need for the Department’s major and significant IT projects, followed by:
1. Data Management (specified 8 times)
2. Document Management (specified 5 times)
3. Customer Management (specified 5 times)
4. Knowledge Management (specified 4 times)
5. Portal Management (specified 4 times)
6. Security and Privacy (specified 4 times)
7. Statistical Analysis Tools (specified 4 times)
8. Survey Design Tools (specified 4 times)
Due to business need, the Department will pursue implementation of the following Common Enabling Services (Table 28), hosted and managed on EDUCATE (ED’s IT Infrastructure Initiative):
Table 28: Planned Implementation of CES’s
CES Method of ImplementationPlanned
Implementation Date
Document Management
Capture business requirements from appropriate program office and obtain/implement a common tool that can accommodate common business needs across the Department. The new solution may include the reuse of an existing Program Office solution (i.e., Documentum) if it meets the Department’s requirements. Existing Document Management Solutions that are not architecturally compliant to the Departmental solution will be required to transition accordingly. The new solution will be hosted and managed by EDUCATE according to established Service Level Agreements (SLA’s).
FY2008
Collaboration Management
Capture business requirements from appropriate program office and obtain/implement a common tool that can accommodate common business needs across the Department. The new solution may include the reuse of an existing Program Office solution (i.e., Appian) if it meets the Department’s requirements. Existing Collaboration Management Solutions that are not architecturally compliant to the Departmental solution will be required to transition accordingly. The new solution will be hosted and managed by
FY2009
document.doc 2/29/08 60

Department of Education
Enterprise Transition Strategy Plan, February 2008
CES Method of ImplementationPlanned
Implementation Date
EDUCATE according to established Service Level Agreements (SLA’s).
Report Management
Capture business requirements from appropriate program office and obtain/implement a common tool that can accommodate common business needs across the Department. The new solution will most likely be the reuse of an existing Program Office solution (i.e., Cognos or Oracle) if it meets the Department’s requirements. Existing Report Management Solutions that are not architecturally compliant to the Departmental solution will be required to transition accordingly. The new solution will be hosted and managed by EDUCATE according to established Service Level Agreements (SLA’s).
FY2010
Data Management
The EA Program Office will facilitate the requirements gathering and expansion of the Department’s Data Warehouse to meet Program Office Data Management needs. The Enterprise Data Warehouse is hosted and management by EDUCATE according to established Service Level Agreements (SLA’s).
FY2008 – FY2011
The Common Enabling Service implementation timeline (Table 29) is illustrated below:
Table 29: CES Implementation Timeline
FY2008 FY2009 FY2010 FY2011
Document Management
Collaboration Management
Report Management
Data Management
document.doc 2/29/08 61

Department of Education
Enterprise Transition Strategy Plan, February 2008
6.0 ED TRANSITION SEQUENCING PLAN
6.1 Transition Strategy Plan Timeline Overview
ED’s enterprise sequencing plan provides a Department-wide view of programs and projects across the agency, giving ED’s leadership the visibility to use ED’s EA for Department-wide planning. This enables high-level impact assessment of investment decisions and programmatic changes on ED’s overall plans for moving toward ED’s target EA. The plan is used to quickly assess the impacts of budget cuts, cancelled or delayed projects, or changes to program priorities. The effects of those changes on other projects and programs are then identified and dealt with as needed.
Figure 8 below graphically represents the timeline for the transition strategy plan:
Figure 8: Transition Strategy Plan Timeline
document.doc 2/29/08 62

The graphic below () provides a comprehensive overview of the transition timeline from FY2006 through FY2011, per Life Cycle Management phase, for the projects defined as part of the Department of Education’s Transition Strategy Plan. Life Cycle Stages can be distinguished by color, as described in the “Legend” at the top of the graphic – allowing for a quick overview of a project’s implementation path. The red line in Q2 FY2008 delineates the Department’s current status.
Figure 9: Transition Strategy Lifecycle
The graphic below (Figure 10) provides a comprehensive overview of the transition timeline from FY2007 through FY2011, per Life Cycle Management phase, for the projects defined as part of the Department of Education’s Loans Segment Architecture. Life Cycle Stages can be distinguished by color, as described in the “Legend” at the top of the graphic – allowing for a quick overview of project’s implementation paths. The red line in Q2 FY2008 delineates the Federal Student Aid’s (FSA’s) current status.
document.doc 2/29/08 63
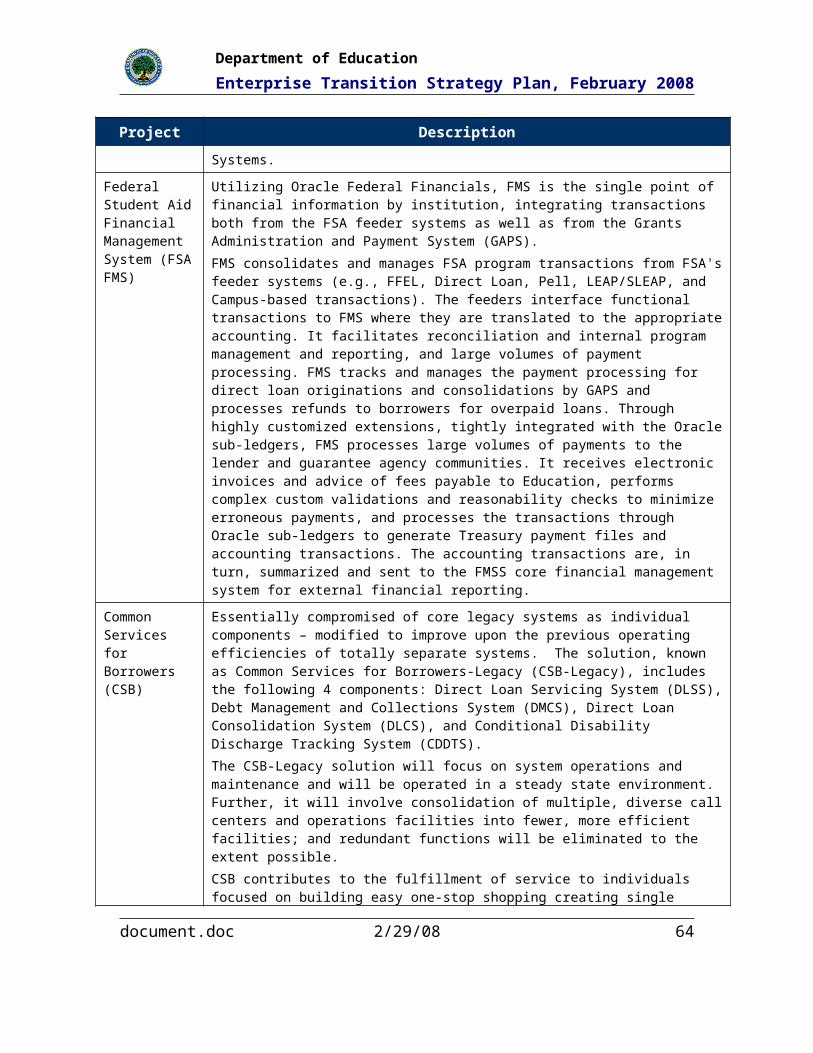
Segment Program Office Investments Q1 Q2 Q3 Q4 Q1 Q2 Q3 Q4 Q1 Q2 Q3 Q4 Q1 Q2 Q3 Q4 Q1 Q2 Q3 Q4 Q1 Q2 Q3 Q4Loans FSA Enterprise Information System (formerly Data Strategy)Loans FSA Common Origination and Disbursement (COD) Loans FSA National Student Loan Data System (NSLDS)Loans FSA ADvance - Aid DeliveryLoans FSA ADvance Person Data Management (Advance PDM)Loans FSA Student Aid Internet Gateway (SAIG)
LoansFSA
Federal Student Aid Financial Management System (FSA FMS)
Loans FSA Common Services for Borrowers (CSB)Integrated Partner Management (IPM)IPM Phase 1 IPM Phase 2Integrated Technical Architecture/Enterprise Application Integration (ITA/EAI)ITA/EAI Phase 1 Implementation: Go Live with SAIG, IFAP & Schools Portal Ops Support, CPS, COD & SAOTW (Advance)ITA/EAI Phase 2 Implementation: Go Live with NSLDS, CSB or the successor Systems
Loans FSA Virtual Data Center (VDC)
LoansFSA
Federal Student Aid Enterprise Web Portal Strategy (Portals)
FY2011FY2006 FY2008FY2007 FY2009 FY2010
Loans
FSALoans
FSA
Legend:
Definition Construction/ Validation Implementation Support/ ImprovementVision
Figure 10: Loans Segment Lifecycle
document.doc 2/29/08 64
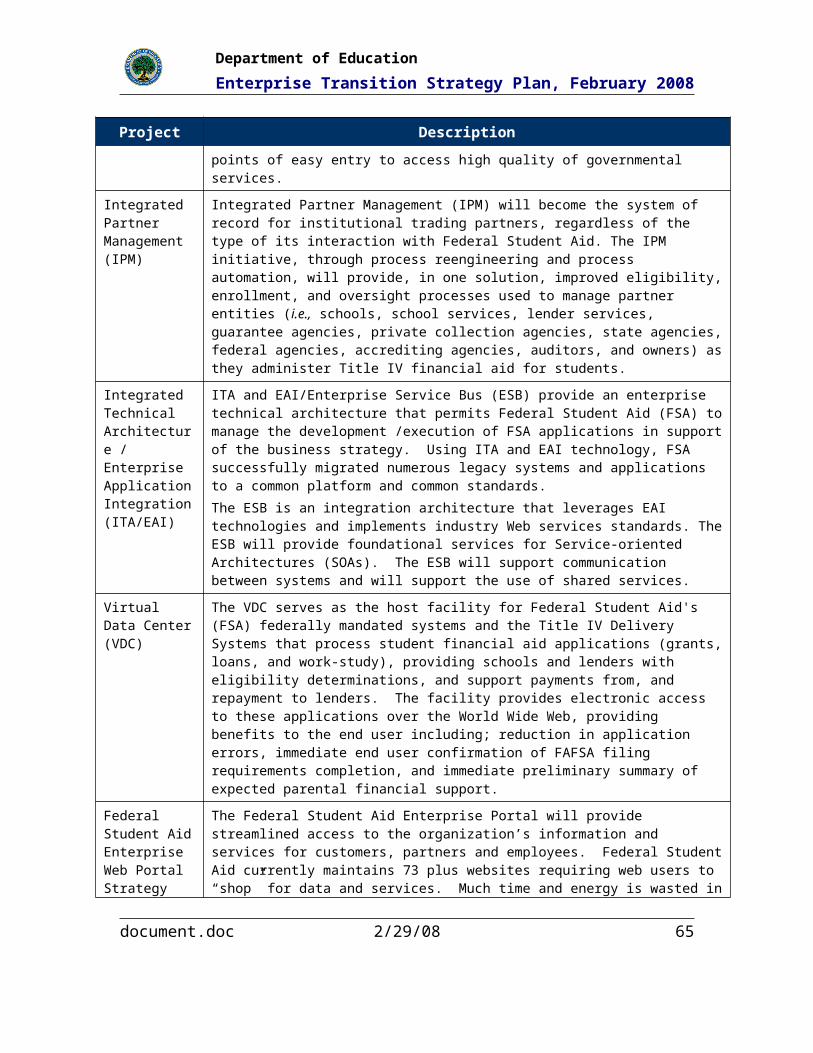
6.1.1 ED Projects Life Cycle Start/End Dates per Completed Segment
The following table (Table 30) provides a detailed start and end dates, per Life Cycle Phase, for projects associated with completed ED Segment Architectures (authorized in writing). These detailed schedules correspond directly to the ED’s Project Timelines.
Table 30: Completed ED Segment Architecture Projects
document.doc 2/29/08 65
ProjectStage Gate
Substage GateStart Date End Date
Segment/Program: Loans – FSA
Enterprise Information System (formerly Data Strategy)
Support and Improvement Q1 2007 On-going
Retirement TBD TBD
Common Origination and Disbursement (COD)
Support and Improvement Q1 2007 On-going
Retirement TBD TBD
National Student Loan Data System (NSLDS)
Support and Improvement Q1 2007 On-going
Retirement TBD TBD
ADvance – Aid Delivery (ADvance Operations)
Support and Improvement Q1 2007 On-going
Retirement TBD TBD
ADvance Person Data Management (PDM)
Definition Q3 2007 Q3 2008
Construction/Validation Q4 2008 Q2 2009
Implementation Q3 2009 Q4 2009
Support and Improvement Q1 2010 On-going
Retirement TBD TBD
Student Aid Internet Gateway (SAIG)
Support and Improvement Q1 2007 On-going
Retirement TBD TBD
Federal Student Aid Financial Management System (FSA FMS)
Support and Improvement Q1 2007 On-going
Retirement TBD TBD
Common Services for Borrowers (CSB)
Support and Improvement Q1 2007 On-going
Retirement TBD TBD
Integrated Partner Management (IPM)
Phase 1 Phase 2 Phase 1 Phase 2
Vision Q1 2007 Q2 2008 Q1 2007 Q2 2008
Definition Q2 2007 Q3 2008 Q4 2007 Q4 2008
Construction/Validation Q1 2008 Q4 2008 Q4 2008 Q1 2009
Implementation Q4 2008 Q1 2009 Q4 2008 Q1 2009
Support and Improvement Q1 2009 Q2 2009 Q3 2009 On-going
Retirement N/A TBD N/A TBD
Integrated Technical Architecture/Enterprise Application Integration (ITA/EAI)
Phase 1 Phase 2 Phase 1 Phase 2
Implementation Q1 2007 Q1 2011 Q1 2008 Q2 2011
Support and Improvement Q2 2009 Q3 2011 On-going On-going
Retirement TBD TBD TBD TBD
document.doc 2/29/08 66

ProjectStage Gate
Substage GateStart Date End Date
Virtual Data Center (VDC) Support and Improvement
Q1 2007 On-going
Retirement TBD TBD
Federal Student Aid Enterprise Web Portal Strategy
Vision Q3 2007 Q3 2007
Definition Q4 2007 Q4 2007
Construction/Validation Q1 2008 Q2 2008
Implementation Q3 2008 Q3 2008
Support and Improvement Q3 2008 On-going
Retirement TBD TBD
Segment/Program: Grants – OCFO
G5 Vision Q1 2007 Q2 2007
Definition Requirements Definition
Q1 2007
Q4 2007
Q4 2008
Q2 2007
Q2 2008
Q1 2009
Design Q1 2007
Q1 2008
Q1 2009
Q2 2007
Q2 2008
Q2 2009
Construction and Validation
Development Q1 2007
Q2 2008
Q1 2009
Q2 2007
Q4 2008
Q3 2009
Testing Q3 2007
Q3 2008
Q3 2009
Q1 2008
Q1 2009
Q1 2010
Implementation Q1 2008
Q1 2009
Q1 2010
Q1 2008
Q1 2009
Q1 2010
Support and Improvement Q1 2008
Q1 2009
Q1 2010
Continuous
Continuous
Continuous
Retirement TBD TBD TBD TBD TBD TBD
Segment/Program: Knowledge and Data Services – OCIO
Data Warehouse Implementation Q1 2006 Q3 2006
Support and Improvement Q4 2006 On-going
Retirement TBD TBD
Segment/Program: ITI – OCIO
EDUCATE Implementation Q1 2008 Q2 2008
Support and Improvement Q2 2008 On-going
Retirement TBD TBD
6.1.2 ED Projects Life Cycle Start/End Dates per Segment
document.doc 2/29/08 67

The following table provides a detailed start and end dates, per Life Cycle Phase, for projects associated with ED Segment Architectures. These detailed schedules correspond directly to the ED’s Project Timelines.
These segments will be detailed and authorized in writing according to the ED’s Segment Architecture Prioritization schedule.
Table 31: Detailed ED Segment Architecture Projects
ProjectStage Gate
Substage GateStart Date End Date
Segment/Program: Financial Management – OCFO
CPSS Implementation Q1 2005 (Web Version)
Q1 2005
Support and Improvement Q1 2005 On-going
Retirement TBD TBD
FMSS Implementation Q3 2002 Q1 2006
Support and Improvement Q1 2006 On-going
Retirement TBD TBD
ISS Implementation -Set up EDCAPS infrastructure
Q2 1997 Q2 1998
Support and Improvement Q2 1998 On-going
Retirement TBD TBD
TMS Implementation Q2 2004 Q4 2006
Support and Improvement Q1 2007 On-going
Retirement TBD Q4 2017
Segment/Program: Identity Management – OCIO
E-Authentication Implementation Q4 2005 Q2 2006
Support and Improvement Q3 2006 On-going
Retirement TBD TBD
Segment/Program: Research and Statistics Services – IES
NCES Web Support Implementation Q3 1998 Q4 1998
Support and Improvement Q1 2005 Q2 2009
Retirement TBD TBD
IPEDS Implementation Q1 2000 Q4 2001
Support and Improvement Q1 2001 On-going
Retirement TBD TBD
NAED Implementation
document.doc 2/29/08 68

ProjectStage Gate
Substage GateStart Date End Date
NAEP Integrated Management System Version 4.0
Q2 2008 Q1 2009
NAEP Web Content Management System Upgrade 2.0
Q1 2009 Q4 2009
NAEP Network Upgrade Version 3.0
Q1 2010 Q4 2010
NAEP CRM Consolidation and Upgrade
Q1 2011 Q4 2011
NAEP Integrated Management System Enhancement Version 5.0
Q1 2012 Q4 2012
Support and Improvement Q1 2008 Q4 2012
Retirement Process Improvement Log
NAEP CRM 1.0 Applications
ADTracker
Q2 2008
Q2 2008
Q2 2008
Q2 2008
Q4 2008
Q4 2008
ERIC Implementation Q2 2004 Q4 2004
Support and Improvement Q1 2005 On-going
Retirement N/A N/A
Segment/Program: Human Resources Management – OM
ID Access Control (EDSTAR) Implementation Q1 2004 Q4 2007
Support and Improvement Q1 2008 On-going
Retirement N/A N/A
Segment/Program: Evaluation and Policy Analysis – OPEDP
EDEN Support and Improvement Q4 2004 On-going
Retirement N/A N/A
Segment/Program: Information Dissemination – OESE
MSIX Implementation Q4 2007 Q4 2007
Support and Improvement Q1 2008 Q4 2012
Retirement TBD TBD
document.doc 2/29/08 69

7.0 IT INVESTMENT MILESTONES
7.1 Implementation Milestones
The Department of Education’s major and significant IT investments have defined specific implementation milestones throughout the course of their respective life cycles. Implementation milestones (associated with specific completion dates) represent:
Individual stages into which a program or project is divided for monitoring and measurement of work performance.
A major scheduled event that indicates the completion of a major stage of the project, leading towards the realization of its Target Architecture.
Implementation milestones result in performance milestones. Performance milestones are quantifiable metrics that are direct, business and results-oriented outcomes of implementation efforts - thereby rationalizing the need/purpose of implementation milestones and defining measurable performance improvements.
The Department actively monitors investment milestones to manage and monitor investments throughout implementation.
7.2 FSA Investment Milestones
Please click here to view Federal Student Aid’s IT Investment Milestones (captured as part of the Loans Segment Architecture).
document.doc 2/29/08 70

Department of Education
Enterprise Transition Strategy Plan, February 2008
7.3 G5 Milestones
The following table (Table 32) defines the milestones for G5 phases, I, II, and III, providing measurement indicators, fiscal year of milestones, baselines, planned improvements, and actual results/completion dates:
Table 32: G5 Milestones
MilestoneType
Measurement IndicatorFiscal Year
BaselinePlanned Improvement to
the BaselineActual Results / Completion
DatesImplementation G5 Phase I Implemented
(Payments)2008 Q1 2008
Performance System Availability 2008 G5 will be available 95% of the time
98% availability Results available Q4 2008
Performance System Availability 2009 G5 will be available 95% of the time
98 availability Results available Q4 2009
Performance System Availability 2010 G5 will be available 95% of the time
Maintain 98% availability Results available Q4 2010
Performance System Availability 2011 G5 will be available 95% of the time
Maintain 98% availability Results available Q4 2011
Performance Timeliness of Hotline issues 2008 Resolved -95% @ 24 hr 98
98% resolved @24 hours Results available Q4 2008
Performance Timeliness of Hotline issues 2009 Resolved -95% @ 24 hr 98
98% resolved @24 hours Results available Q4 2009
Performance Timeliness of Hotline issues 2010 Resolved -95% @ 24 hr 98
Maintain 98% resolved @24 hours
Results available Q4 2010
Performance Timeliness of Hotline issues 2011 Resolved -95% @ 24 hr 98
Maintain 98% resolved @24 hours
Results available Q4 2011
Implementation G5 Phase II Implemented (Planning & Scheduling)
2009 Q1 2009
Performance Percentage of grant applicationssubmitted electronically (for programs participating)
2009 80 Increase to 85% Results available Q4 2009
Performance Percentage of grant 2010 TBD 8/2009 Increase to 90% Results available Q4 2010
document.doc 2/29/08 71
Department of Education
Enterprise Transition Strategy Plan, February 2008
MilestoneType
Measurement IndicatorFiscal Year
BaselinePlanned Improvement to
the BaselineActual Results / Completion
Datesapplicationssubmitted electronically (for programs participating)
Performance Percentage of grant applicationssubmitted electronically (for programs participating)
2011 TBD 8/2010 Increase to 95% Results available Q4 2011
Implementation G5 Phase III Implemented (Post Award)
2010 Q1 2010
Performance e-Signature feature implemented
2010 75% of Grants Award Notifications (GAN’s) will be sent electronically
75% Results available Q4 2010
Performance e-Signature feature implemented
2011 75% of Grants Award Notifications (GAN’s) will be sent electronically
Increase to 80% Results available Q4 2011
7.4 Data Warehouse Milestones
The following table (Table 33) defines the milestones for Data Warehouse, providing measurement indicators, fiscal year of milestones, baselines, planned improvements, and actual results/completion dates:
Table 33: Data Warehouse Milestones
MilestoneType
Measurement IndicatorFiscal Year
BaselinePlanned Improvement
to the BaselineActual Results /
Completion DatesImplementation Implement Data Warehouse
solution2006 Q4 2006
Performance One measurable indicator of improved Grants Management is the reduction in grants funds returned to the Treasury because states have not obligated the funds
2006 166,000,000 160,000,000 160,000,000 Investment retired -- no performance metrics tracked and reported beyond FY06.
document.doc 2/29/08 72
Department of Education
Enterprise Transition Strategy Plan, February 2008
MilestoneType
Measurement IndicatorFiscal Year
BaselinePlanned Improvement
to the BaselineActual Results /
Completion Dateswithin the required timeframes. Unit of Measurement dollars returned to Treasury.
Performance New capabilities launched deliver demonstrable improvements in grants fund usage and compliance. Unit of measurement equals number of capabilities in place.
2006 1 4 4 new capabilities in place (Grants Monitoring Reports, Grants Risk Monitoring Reports, EDEN Profile Reports, and ad hoc Grants Reports). This measure was discontinued for future years.
Performance Number of Program Offices that have benefited from improved knowledge management in the grants and evaluation areas. Unit of Measurement is number of Program Offices.
2006 1 3 3 Investment retired -- no performance metrics tracked and reported beyond FY06.
Performance Interoperability measurement. Unit of measurement is the number of new applications. Number of new capabilities that share common data definitions, data repository (data warehouse) and end user data access and analysis tools.
2006 1 4 4 new applications share data and service components. The Data Warehouse contains EDEN Submission data, GAPS data, CSPR data, and EDEN profile data. EDW realized cost savings of over $600K as a result of merging EDEN reporting with the EDW.
Performance Grants Management: Maintain grants funds returned to the Treasury because states have not obligated the funds within the required timeframes. Unit of Measurement dollars returned to Treasury.
2007 160,000,000 160,000,000 $160,000,000 grants funds were returned to the Treasury (maintain status)
Performance Reducing the number of grantees with high enterprise risk
2007 33.4% 30% 30% of grantees with high
document.doc 2/29/08 73
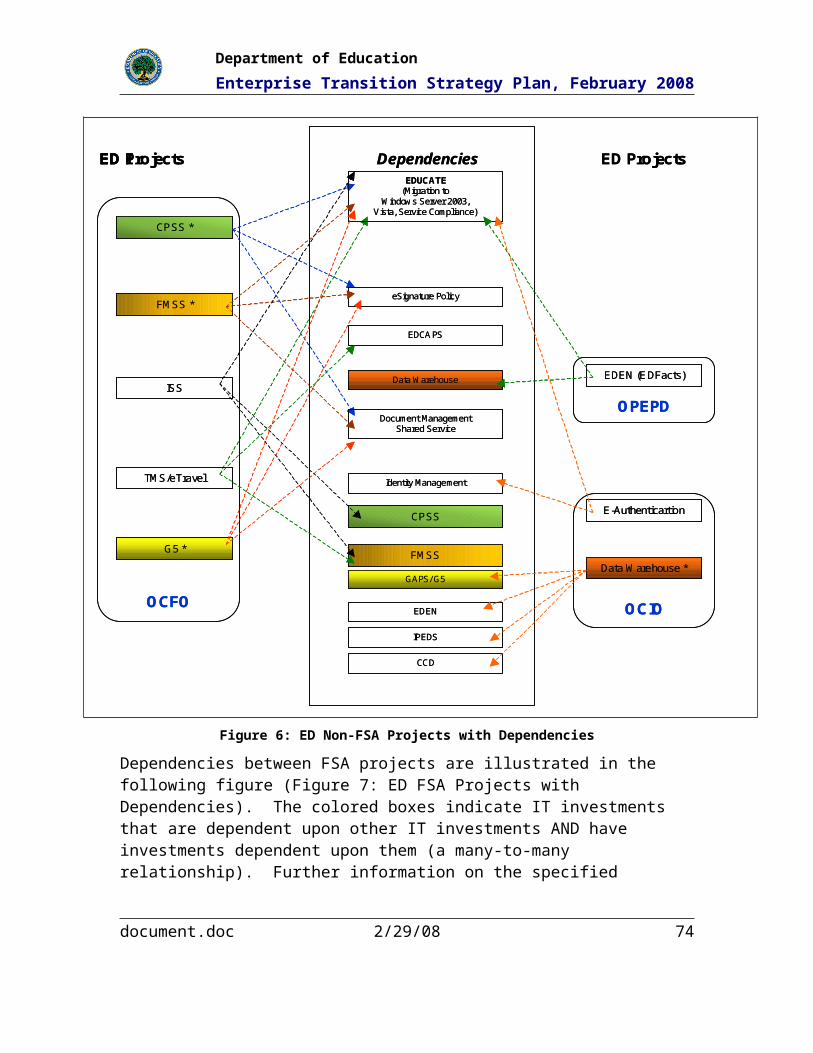
Department of Education
Enterprise Transition Strategy Plan, February 2008
MilestoneType
Measurement IndicatorFiscal Year
BaselinePlanned Improvement
to the BaselineActual Results /
Completion Datesmanagement ratings. Unit of measurement is the percentage of formula grant funds awarded to grantees with high ratings.
enterprise risk (maintained).
Performance Interoperability measurement. Unit of measurement is the number of new applications. Maintain the number of capabilities that share common data definitions, data repository (data warehouse) and end user data access and analysis tools.
2007 4 4 4 applications were maintained to share common data.
Performance Maintain the number of Program Offices that have benefited from improved knowledge management in the grants and evaluation areas. Unit of Measurement is number of Program Offices.
2007 5 5 7 Program Offices that have benefited from improved knowledge management in the grants and evaluation areas.
Performance Grants Management: Maintain grants funds returned to the Treasury because states have not obligated the funds within the required timeframes. Unit of Measurement dollars returned to Treasury.
2008 160,000,000 160,000,000 On-Going
Performance Maintain the number of grantees with high enterprise risk management ratings. Unit of measurement is the percentage of formula grant funds awarded to grantees with high ratings.
2008 30% 30% On-Going
Performance Maintain the number of Program Offices that have benefited from improved knowledge management
2008 7 7 On-Going
document.doc 2/29/08 74
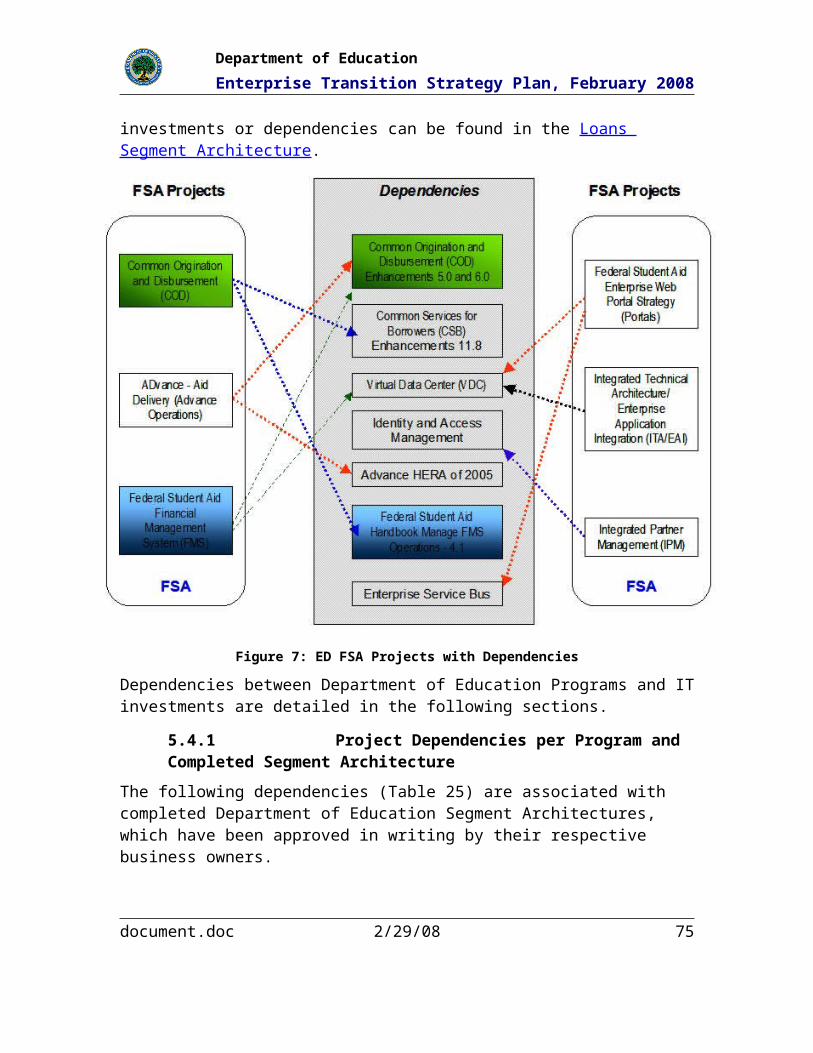
Department of Education
Enterprise Transition Strategy Plan, February 2008
MilestoneType
Measurement IndicatorFiscal Year
BaselinePlanned Improvement
to the BaselineActual Results /
Completion Datesin the grants and evaluation areas. Unit of Measurement is number of Program Offices.
Performance Interoperability measurement. Unit of measurement is the number of new applications. Maintain the number of capabilities that share common data definitions, data repository (data warehouse) and end user data access and analysis tools.
2008 4 4 On-Going
Performance Grants Management: Maintain grants funds returned to the Treasury because states have not obligated the funds within the required timeframes. Unit of Measurement dollars returned to Treasury.
2009 160,000,000 160,000,000 On-Going
Performance Maintain the number of grantees with high enterprise risk management ratings. Unit of measurement is the percentage of formula grant funds awarded to grantees with high ratings.
2009 30% 30% On-Going
Performance Maintain the number of Program Offices that have benefited from improved knowledge management in the grants and evaluation areas. Unit of Measurement is number of Program Offices.
2009 7 7 On-Going
Performance Interoperability measurement. Unit of measurement is the number of new applications. Maintain the number of
2009 4 4 On-Going
document.doc 2/29/08 75

Department of Education
Enterprise Transition Strategy Plan, February 2008
MilestoneType
Measurement IndicatorFiscal Year
BaselinePlanned Improvement
to the BaselineActual Results /
Completion Datescapabilities that share common data definitions, data repository (data warehouse) and end user data access and analysis tools.
7.5 EDUCATE Milestones
The following table (Table 34) defines the milestones for EDUCATE, providing measurement indicators, fiscal year of milestones, baselines, planned improvements, and actual results/completion dates:
Table 34: EDUCATE Milestones
MilestoneType
Measurement IndicatorFiscal Year
BaselinePlanned Improvement
to the BaselineActual Results /
Completion DatesImplementation Perform IT Refresh Rapid
Achievement of N-1 (Hardware)2008 Q4 2008
Performance IT Refresh Rapid Achievement of N-1 (Hardware)
2008 100 % N-1 Maintain 100% N-1 Q4 2008
Implementation Go Live with OPAS processes 2008 Q1 2008
Performance Achieve 100% implementation of the pre-defined CLINs (each CLIN represents a service offered by EDUCATE to the Department of Education, see separate section)
2008 100% Maintain 100% Q1 2008
Desktop Services
Implementation Define Operational Requirements for Anti-virus
2008 Q1 2008
Implementation Complete and confirm detailed Inventory of hardware, software, and user profiles
2008 Q1 2008
Implementation Transition of OS and Office automation to users
2008 Q4 2008
Performance Maintain N-1 versions of OS and 2008 N-1 (XP, Vista, Office 2007) Maintain N-1 (XP, Vista, Q4 2008
document.doc 2/29/08 76

Department of Education
Enterprise Transition Strategy Plan, February 2008
MilestoneType
Measurement IndicatorFiscal Year
BaselinePlanned Improvement
to the BaselineActual Results /
Completion DatesOffice automation to users Office 2007)
Performance DS-1 Move, Change, Add and Removal (MCAR)
2008 Standard ServiceWithout Cabling Requirement: No More than 3 Business DaysWith Cabling Requirement: No More than 10 Business Days
Maintain Standard ServiceWithout Cabling Requirement: No More than 3 Business DaysWith Cabling Requirement: No More than 10 Business Days
On-Going
Help Desk Support Services
Implementation Deployment of Helpdesk Tools 2008 Q1 2008
Implementation Phone Setup 2008 Q1 2008
Implementation Go Live (Service Desk Ready for Operational Readiness Review)
2008 Q1 2008
Performance HD-3 RCA Delivery 2008 99.90% delivered within the agreed upon time
Maintain 99.90 On-Going
Performance HD-1 Disable User Accounts 2008 Less than 1 hour Maintain Less than 1 hour On-Going
Performance HD -2 Maintain User Accounts 2008 Less than 4 hours Maintain Less than 4 hours On-Going
Performance HD-4 First Call Resolution 2008 80% in 5 minutes Maintain 80% in 5 minutes On-Going
Performance HD-5 Call Abandon Rate 2008 Less than or equal to 7% Maintain Less than or equal to 7%
On-Going
Performance HD-6 Average Wait Time 2008 Less than or equal to 30 seconds Maintain Less than or equal to 30 seconds
On-Going
Systems/Data Center Services
Implementation Define Operational Requirements for Intel
2008 Q1 2008
Implementation Design Operations Transition 2008 Q1 2008
document.doc 2/29/08 77

Department of Education
Enterprise Transition Strategy Plan, February 2008
MilestoneType
Measurement IndicatorFiscal Year
BaselinePlanned Improvement
to the BaselineActual Results /
Completion DatesImplementation Intel Ready for Transfer of
Operations2008 Q1 2008
Implementation Define Operational Requirements for UNIX
2008 Q1 2008
Implementation Design Operations Transition 2008 Q1 2008
Implementation UNIX Ready for Transfer of Operations
2008 Q1 2008
Implementation Define Operational Requirements for Storage
2008 Q1 2008
Implementation Design Operations Transition 2008 Q1 2008
Implementation Storage Ready for Transfer of Operations
2008 Q1 2008
Implementation Define Operational Requirements for Database Services
2008 Q1 2008
Implementation Design Operations Transition 2008 Q1 2008
Implementation Database Services Ready for Transfer of Operations
2008 Q1 2008
Implementation Define Operational Requirements for Middleware
2008 Q1 2008
Implementation Design Operations Transition 2008 Q1 2008
Implementation Middleware Ready for Transfer of Operations
2008 Q1 2008
Implementation Define Operational Requirements for Data Center Operations
2008 Q1 2008
Implementation Design Operations Transition 2008 Q1 2008
Implementation Data Center Operations Ready for Transfer of Operations
2008 Q1 2008
Implementation Systems/Data Centers Ready for Transfer of Operations
2008 Q1 2008
Implementation DATA CENTER MIGRATION 2008 Q4 2008
document.doc 2/29/08 78

Department of Education
Enterprise Transition Strategy Plan, February 2008
MilestoneType
Measurement IndicatorFiscal Year
BaselinePlanned Improvement
to the BaselineActual Results /
Completion DatesImplementation Completion of Move Package 1
(dev/test) 2008 Q2 2008
Implementation Completion of Move Package 2 (dev/test)
2008 Q2 2008
Implementation Completion of Move Package 3 (dev/test)
2008 Q2 2008
Implementation Completion of Move Package 4 (production)
2008 Q3 2008
Implementation Completion of Move Package 5 (production)
2008 Q3 2008
Implementation Completion of OXON HILL SITE & CONTENTS DISPOSITION
2008 Q3 2008
Implementation Deployment of Server Updates 2008 On-Going
Implementation SOC Ready for Operations 2008 Q1 2008
Performance Security Ready for Transfer of Operations
2008 100% Maintain 100% Q1 2008
Implementation Define Operational Requirements for Asset Management
2008 Q1 2008
Implementation Asset Management Ready for Transfer of Operations
2008 Q1 2008
Implementation Define Operational Requirements for Service Management
2008 Q1 2008
Implementation Service Management Ready for Transfer of Operations
2008 Q1 2008
Performance ISP Hosting Services Availability 2008 99.6% availability Maintain 99.6% availability
On-Going
Performance ED.gov Services Availability 2008 99.9% availability Maintain 99.9% availability
On-Going
Performance connectED Services Availability 2008 99.6% availability Maintain 99.6% availability
On-Going
document.doc 2/29/08 79

Department of Education
Enterprise Transition Strategy Plan, February 2008
MilestoneType
Measurement IndicatorFiscal Year
BaselinePlanned Improvement
to the BaselineActual Results /
Completion Dates
Email Services
Implementation Design Operations Transition 2008 Q1 2008
Implementation Email Ready for Transfer of Operations
2008 Q1 2008
Performance Email (Electronic Messaging Services Availability)
2008 Availability 99.6% Maintain Availability 99.6%
Q1 2008
Performance Email Backups (Electronic Messaging Services Backups)
2008 100% Maintain 100 % Q1 2008
Network, Telecommunications, and Multimedia Services
Implementation Complete VPN Setup/Testing 2008 Q1 2008
Implementation Design Operations Transition 2008 Q1 2008
Implementation Network Operations Ready for Transfer of Operations
2008 Q1 2008
Performance NS-1 Managed Network Services Availability
2008 Latency 120 ms Maintain Latency 120 ms On-Going
Performance NS-4 Network Services Availability
2008 99.60% Maintain 99.60% On-Going
Performance NS-2 Remote Access and Teleworking Services Availability
2008 Latency 120 ms Maintain Latency 120 ms On-Going
Performance NS-3 Audio/Video/Data Conferencing Services Availability
2008 99.60% Maintain 99.60% On-Going
Performance GN-1 General Services Availability
2008 99.60% Maintain 99.60% On-Going
Performance GN-2 Event Notification 2008 4 levels; Less Than 15min/ 15min/ 12 hrs/ 24 hrs
Maintain 4 levels; Less Than 15min/ 15min/ 12 hrs/ 24 hrs
On-Going
Performance GN-3 Customer Surveys 2008 90% at a 4/5 rating Maintain 90% at a 4/5 rating
On-Going
Performance GN-4 System Backup 2008 100% Maintain 100% On-Going
document.doc 2/29/08 80
Department of Education
Enterprise Transition Strategy Plan, February 2008
MilestoneType
Measurement IndicatorFiscal Year
BaselinePlanned Improvement
to the BaselineActual Results /
Completion DatesPerformance GN-5 Time to Restore 2008 4 levels; 2/4/8/24 hours to
Resolution 99%Maintain 4 levels; 2/4/8/24 hours to Resolution 99%
On-Going
Performance GN-7 Customer Satisfaction Support to Business
2008 90% at a 4/5 rating Maintain 90% at a 4/5 rating
On-Going
Crisis Management, Business Continuity, and Disaster Recovery Services
Implementation Completion of Move Package 6 DISASTER RECOVERY SITE
2008 Q3 2008
Implementation Completion of KENNESAW SITE & CONTENTS DISPOSITION
2008 Q4 2008
Performance Managed DR Services (Hot Services)
2008 100% & immediate Maintain 100% & immediate
Q1 2008
Performance Managed DR Services (Warm Services)
2008 100% @ 8 hours & immediate Maintain 100% @ 8 hours & immediate
Q4 2008
Performance Managed DR Services (Cold Services)
2008 100% @ 72 hours & immediate Maintain 100% @ 72 hours & immediate
Q1 2008
Performance Managed DR Services (Disaster & Recovery Testing)
2008 100% Maintain 100% Q1 2008
Implementation Update and Maintain Current BC and DR plans per Gaps in Gap Analysis
2008 Q1 2008
Implementation Update CM, BC, and DR Plans with New Requirements
2008 Q1 2008
Implementation Crisis Management, Business Continuity and Disaster Recovery Ready for Transfer of Operations
2008 Q1 2008
Performance Incident Response and Problem Management
2008 100% Response within the required time
Maintain 100% On-Going
Implementation Define Operational Requirements for Intrusion Detection and Monitoring
2008 Q1 2008
document.doc 2/29/08 81
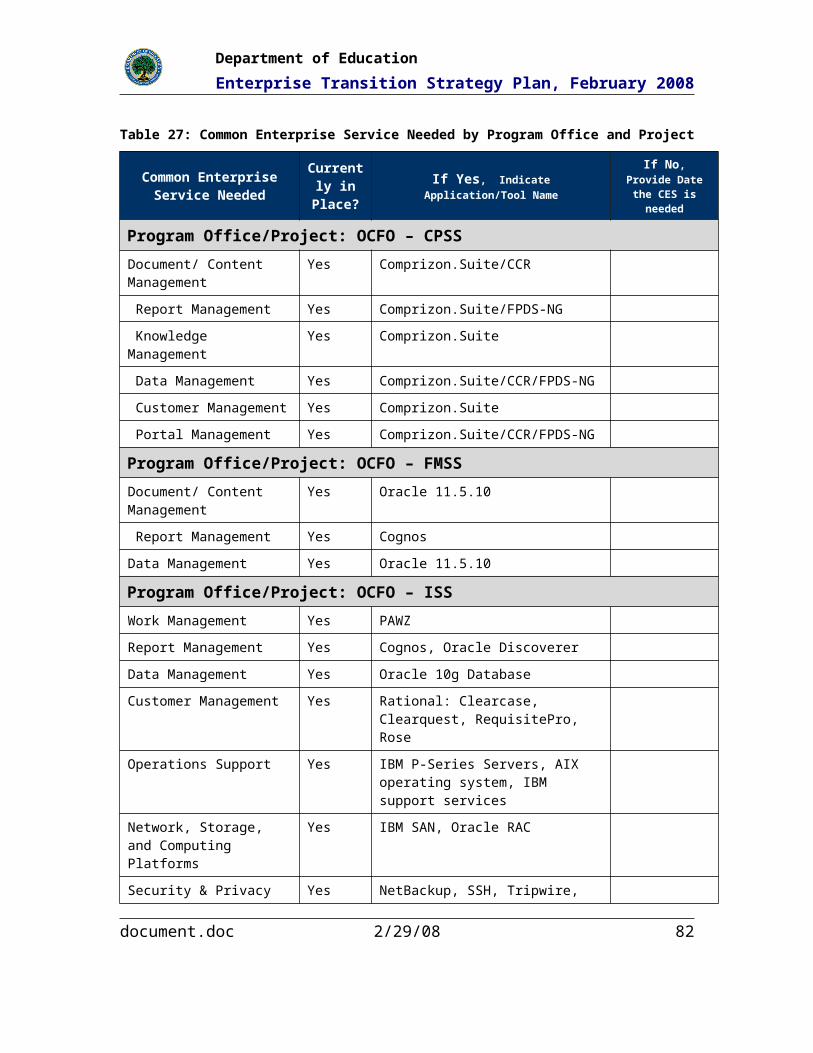
Department of Education
Enterprise Transition Strategy Plan, February 2008
MilestoneType
Measurement IndicatorFiscal Year
BaselinePlanned Improvement
to the BaselineActual Results /
Completion DatesPerformance Intrusion Detection/Protection
Monitoring/Log Analysis2008 99.9% detection & prevention Maintain 99.9% On-Going
Performance Audit and Data Call Support 2008 100% Maintain 100% On-Going
Performance Enterprise Vulnerability Management Service/Analysis/Remediation Recommendations
2008 99.9% successful remediation Maintain 99.9% On-Going
Special Services
Implementation IES Support Ready for Transfer of Operations
2008 Q1 2008
Implementation OIG Support Ready for Transfer of Operations
2008 Q1 2008
Printer Services
Implementation Complete Inventory of printer/fax/scanner/copier devices
2008 Q1 2008
Implementation Printer Services Ready to Assume Operations
2008 Q1 2008
Implementation Define Operational Requirements for Policy-Audit Remediation
2008 Q1 2008
FY2009 – FY2010 EDUCATE OPERATIONS AND MAINTENANCE MILESTONES
Implementation Complete Implementation of EDUCATE and defined Services (CLINs). Begin Operations and Maintenance
2009 Q1 2009
Performance Maintain N-1 versions of OS and Office automation to users
2009 N-1 Maintain N-1 Q4 2009
Performance Maintain IT Refresh Achievement of N-1 (Hardware)
2009 100 % N-1 Maintain 100% N-1 Q4 2009
Performance DS-1 Move, Change, Add and Removal (MCAR)
2009 Standard ServiceWithout Cabling Requirement:
Maintain Standard ServiceWithout Cabling
On-Going
document.doc 2/29/08 82

Department of Education
Enterprise Transition Strategy Plan, February 2008
MilestoneType
Measurement IndicatorFiscal Year
BaselinePlanned Improvement
to the BaselineActual Results /
Completion DatesNo More than 3 Business DaysWith Cabling Requirement: No More than 10 Business Days
Requirement: No More than 3 Business Days; With Cabling Requirement: No More than 10 Business Days
Performance HD-3 RCA Delivery 2009 99.90% delivered within the agreed upon time
Maintain 99.90 On-Going
Performance HD-1 Disable User Accounts 2009 Less than 1 hour Maintain Less than 1 hour On-Going
Performance HD -2 Maintain User Accounts 2009 Less than 4 hours Maintain Less than 4 hours On-Going
Performance HD-4 First Call Resolution 2009 80% in 5 minutes Maintain 80% in 5 minutes On-Going
Performance HD-5 Call Abandon Rate 2009 Less than or equal to 7% Maintain Less than or equal to 7%
On-Going
Performance HD-6 Average Wait Time 2009 Less than or equal to 30 seconds Maintain Less than or equal to 30 seconds
On-Going
Performance Managed DR Services (Hot Services)
2009 100% and immediate Maintain 100% and immediate
Q1 FY2009
Performance Managed DR Services (Warm Services)
2009 100% @ 8 hours & immediate Maintain 100% @ 8 hours & immediate
Q1 FY2009
Performance Managed DR Services (Cold Services)
2009 100% @ 72 hours & immediate Maintain 100% @ 72 hours & immediate
Q1 FY2009
Performance Managed DR Services (Disaster & Recovery Testing)
2009 100% Maintain 100% Q1 FY2009
Performance Deployment of Server Updates 2009 100% Maintain 100 % On-Going
Performance ISP Hosting Services Availability 2009 99.6% availability Maintain 99.6% availability
On-Going
Performance ED.gov Services Availability 2009 99.9% availability Maintain 99.9% availability
On-Going
Performance ConnectED Services Availability 2009 99.6% availability Maintain 99.6% availability
On-Going
Performance Email (Electronic Messaging 2009 Availability 99.6%. Maintain 99.6% Q1 FY2009
document.doc 2/29/08 83

Department of Education
Enterprise Transition Strategy Plan, February 2008
MilestoneType
Measurement IndicatorFiscal Year
BaselinePlanned Improvement
to the BaselineActual Results /
Completion DatesServices Availability) availability
Performance Email Backups (Electronic Messaging Services Backups)
2009 100% Maintain 100 % Q1 FY2009
Performance NS-1 Managed Network Services Availability
2009 Latency 120 ms Maintain Latency 120 ms On-Going
Performance NS-4 Network Services Availability
2009 99.60% Maintain 99.60% On-Going
Performance NS-2 Remote Access and Teleworking Services Availability
2009 Latency 120 ms Maintain Latency 120 ms On-Going
Performance NS-3 Audio/Video/Data Conferencing Services Availability
2009 99.60% Maintain 99.60% On-Going
Performance GN-1 General Services Availability
2009 99.60% Maintain 99.60% On-Going
Performance GN-2 Event Notification 2009 4 levels; Less than 15min/ 15min/ 12 hrs/ 24 hrs
Maintain 4 levels; Less than 15min/ 15min/ 12 hrs/ 24 hrs
On-Going
Performance GN-3 Customer Surveys 2009 90% at a 4/5 rating Maintain 90% at a 4/5 rating
On-Going
Performance GN-4 System Backup 2009 100% Maintain 100% On-Going
Performance GN-5 Time to Restore 2009 4 levels; 2/4/8/24 hours to Resolution 99%
Maintain 4 levels; 2/4/8/24 hours to Resolution 99%
On-Going
Performance GN-7 Customer Satisfaction Support to Business
2009 90% at a 4/5 rating Maintain 90% at a 4/5 rating
On-Going
Performance Incident Response and Problem Management
2009 100% response within the required time
Maintain 100% On-Going
Performance Intrusion Detection/Protection Monitoring/Log Analysis
2009 99.9% detection & prevention Maintain 99.9% On-Going
Performance Audit and Data Call Support 2009 100% Maintain 100% On-Going
Performance Enterprise Vulnerability Management Service/Analysis/Remediation
2009 99.9% successful remediation Maintain 99.9% On-Going
document.doc 2/29/08 84
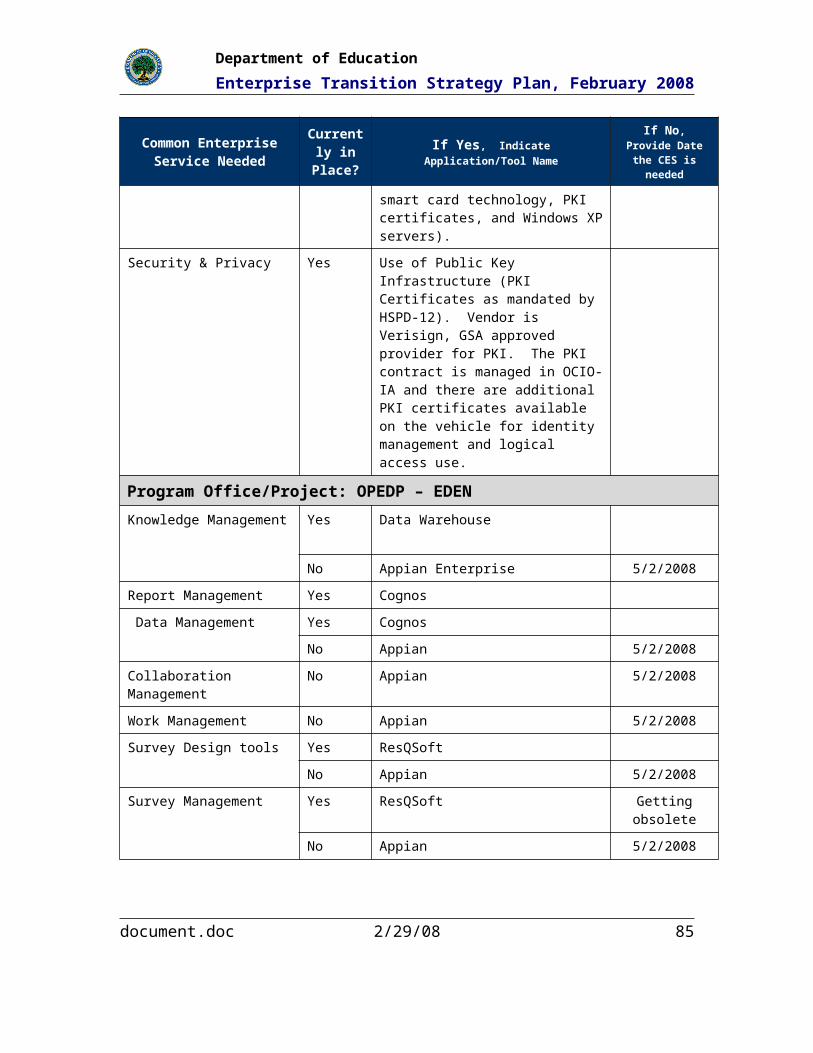
Department of Education
Enterprise Transition Strategy Plan, February 2008
MilestoneType
Measurement IndicatorFiscal Year
BaselinePlanned Improvement
to the BaselineActual Results /
Completion DatesRecommendations
Performance Server Availability During Core Hours
2009 99.00% 99.60% On-Going
Performance Maintain N-1 versions of OS and Office automation to users
2010 N-1 Maintain N-1 Q4 FY2010
Performance Maintain IT Refresh Achievement of N-1 (Hardware)
2010 100 % N-1 Maintain 100% N-1 Q4 FY2010
Performance DS-1 Move, Change, Add and Removal (MCAR)
2010 Standard ServiceWithout cabling requirement: No more than 3 Business Days.With cabling requirement: No more than 10 Business Days.
Maintain Standard ServiceWithout cabling requirement: No more than 3 Business Days.With cabling requirement: No more than 10 Business Days.
On-Going
Performance HD-3 RCA Delivery 2010 99.90% delivered within the agreed upon time
Maintain 99.90 On-Going
Performance HD-1 Disable User Accounts 2010 Less than 1 hour Maintain Less than 1 hour On-Going
Performance HD -2 Maintain User Accounts 2010 Less than 4 hours Maintain Less than 4 hours On-Going
Performance HD-4 First Call Resolution 2010 80% in 5 minutes Maintain 80% in 5 minutes On-Going
Performance HD-5 Call Abandon Rate 2010 Less than or equal to 7% Maintain Less than or equal to 7%
On-Going
Performance HD-6 Average Wait Time 2010 Less than or equal to 30 seconds Maintain Less than or equal to 30 seconds
On-Going
Performance Managed DR Services (Hot Services)
2010 100% and immediate Maintain 100% and immediate
Q1 FY2010
Performance Managed DR Services (Warm Services)
2010 100% @ 8 hours and immediate Maintain 100% @ 8 hours and immediate
Q1 FY2010
Performance Managed DR Services (Cold Services)
2010 100% @ 72 hours and immediate
Maintain 100% @ 72 hours and immediate
Q1 FY2010
Performance Managed DR Services (Disaster & 2010 100% Maintain 100% Q1 FY2010
document.doc 2/29/08 85

Department of Education
Enterprise Transition Strategy Plan, February 2008
MilestoneType
Measurement IndicatorFiscal Year
BaselinePlanned Improvement
to the BaselineActual Results /
Completion DatesRecovery Testing)
Performance Deployment of Server Updates 2010 100% Maintain 100 % On-Going
Performance ISP Hosting Services Availability 2010 Availability 99.6% Maintain 99.6% availability
On-Going
Performance ED.gov Services Availability 2010 Availability 99.6% Maintain 99.9% availability
On-Going
Performance ConnectED Services Availability 2010 Availability 99.6% Maintain 99.6% availability
On-Going
Performance Email (Electronic Messaging Services Availability)
2010 Availability 99.6% Maintain Availability 99.6%
Q1 FY2010
Performance Email Backups (Electronic Messaging Services Backups)
2010 100% Maintain 100 % Q1 FY2010
Performance NS-1 Managed Network Services Availability
2010 Latency 120 ms Maintain Latency 120 ms On-Going
Performance NS-4 Network Services Availability
2010 99.60% Maintain 99.60% On-Going
Performance NS-2 Remote Access and Teleworking Services Availability
2010 Latency 120 ms Maintain Latency 120 ms On-Going
Performance NS-3 Audio/Video/Data Conferencing Services Availability
2010 Availability 99.6% Maintain 99.60% On-Going
Performance GN-1 General Services Availability
2010 Availability 99.6% Maintain 99.60% On-Going
Performance GN-2 Event Notification 2010 4 levels; Less than 15min/ 15min/ 12 hrs/ 24 hrs
Maintain 4 levels; Less than 15min / 15min / 12 hrs / 24 hrs
On-Going
Performance GN-3 Customer Surveys 2010 90% at a 4/5 rating Maintain 90% at a 4/5 rating
On-Going
Performance GN-4 System Backup 2010 100% Maintain 100% ON-GOING
Performance GN-5 Time to Restore 2010 4 levels; 2/4/8/24 hours to Resolution 99%
Maintain 4 levels; 2 / 4 / 8 / 24 hours to Resolution
On-Going
document.doc 2/29/08 86

Department of Education
Enterprise Transition Strategy Plan, February 2008
MilestoneType
Measurement IndicatorFiscal Year
BaselinePlanned Improvement
to the BaselineActual Results /
Completion Dates99%
Performance GN-7 Customer Satisfaction Support to Business
2010 90% at a 4/5 rating Maintain 90% at a 4/5 rating
On-Going
Performance Incident Response and Problem Management
2010 100% response within the required time
Maintain 100% On-Going
Performance Intrusion Detection/Protection Monitoring/Log Analysis
2010 99.9% detection and prevention. Maintain 99.9% On-Going
Performance Audit and Data Call Support 2010 100% Maintain 100% On-Going
Performance Enterprise Vulnerability Management Service/ Analysis/ Remediation Recommendations
2010 99.9% successful remediation. Maintain 99.9% On-Going
Performance Server Availability During Core Hours
2010 99.00% 99.60% On-Going
7.6 CPSS Milestones
The following table (Table 35) defines the milestones for CPSS, providing measurement indicators, fiscal year of milestones, baselines, planned improvements, and actual results/completion dates:
Table 35: CPSS Milestones
MilestoneType
Measurement IndicatorFiscal Year
BaselinePlanned Improvement to
the BaselineActual Results /
Completion DatesImplementation Implementation of CPSS system.
CPSS is currently in the O&M phase, performance metrics through FY 2007 have been achieved
2005 Q1 FY2005
Performance 75% of required reports needed to reconcile data between the Financial System and Procurement System.
2007 85% Maintain a 90% or greater availability of required reports
6/30/07 – est. 90% of the data sent is accurate.
document.doc 2/29/08 87

Department of Education
Enterprise Transition Strategy Plan, February 2008
MilestoneType
Measurement IndicatorFiscal Year
BaselinePlanned Improvement to
the BaselineActual Results /
Completion DatesPerformance 90% of required reports needed to
reconcile data between the Financial System and Procurement System.
2008 87% Maintain a 90% or greater availability of required reports (92% -of reports are available to perform reconciliation between the Financial and Procurement systems)
Results expected Q1 FY2009.
Performance 90% of required reports needed to reconcile data between the Financial System and Procurement System.
2009 Results expected Q1 2009
Maintain a 90% or greater availability of required reports
Results expected Q1 FY2010.
Performance 90% of required reports needed to reconcile data between the Financial System and Procurement System.
2010 Results expected Q1 2010
Maintain a 90% or greater availability of required reports
Results expected Q1 FY2011
Performance 90% of required reports needed to reconcile data between the Financial System and Procurement System.
2011 Results expected Q1 2011
Maintain a 90% or greater availability of required reports
Results expected Q1 FY2012
Implementation Implement Enhancement of Electronic proposals
2008 Q1 FY2008
Performance 55% of proposals will be submitted on the Procurement Website
2008 60% 65% of proposals will be submitted on the Procurement Website.
Results expected Q1 FY2009
Performance 65% of proposals submitted on the Procurement Website
2009 Results expected Q1 2009
Maintain 65% of proposals will be submitted on the Procurement Website
Results expected Q1 FY2010
Performance 65% of proposals submitted on the Procurement Website
2010 Results expected Q1 2010
Maintain 65% of proposals will be submitted on the Procurement Website.
Results expected Q1 FY2011
Performance 65% of proposals submitted on the Procurement Website
2011 Results expected Q1 2011
Maintain 65% of proposals will be submitted on the Procurement Website.
Results expected Q1 FY2012
Performance Transactions sent to the financial system have the correct Transaction Code associated with them.
2007 95% Maintain a 95% or greater Q3 FY2007 – 95% or greater of transactions are assigned the correct Transaction Code.
document.doc 2/29/08 88
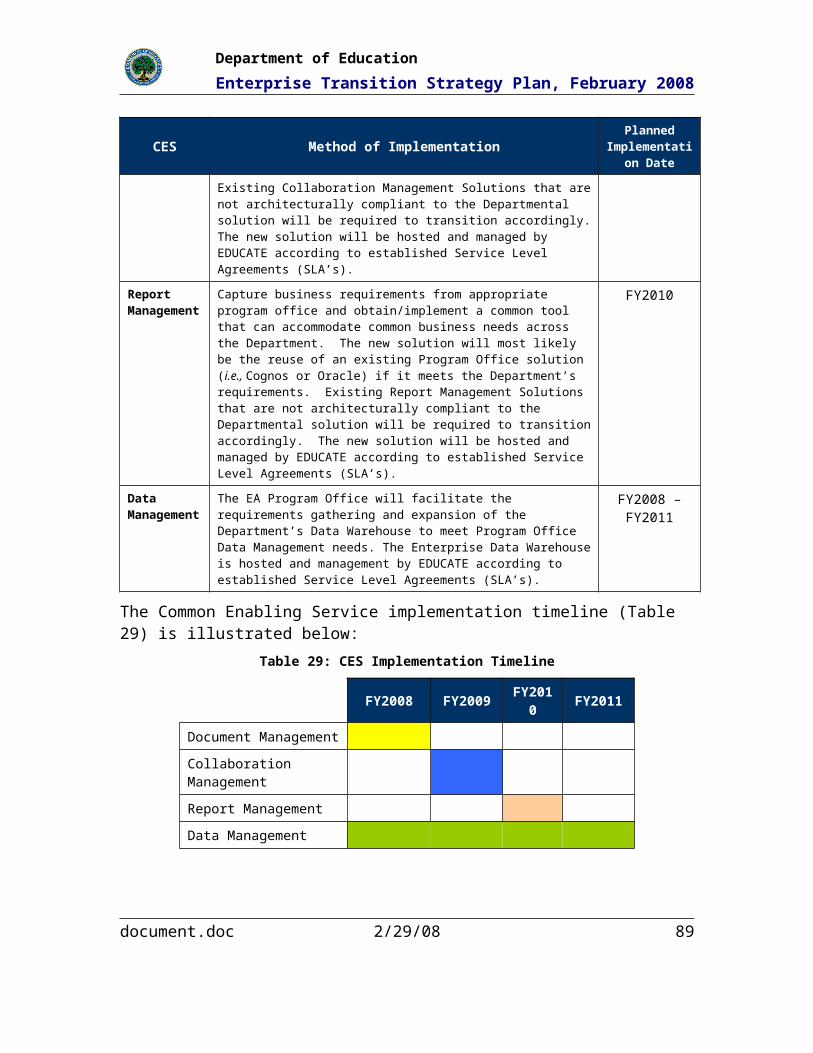
Department of Education
Enterprise Transition Strategy Plan, February 2008
MilestoneType
Measurement IndicatorFiscal Year
BaselinePlanned Improvement to
the BaselineActual Results /
Completion DatesPerformance Transactions sent to financial system
with correct Transaction Code2008 95% Maintain a 95% or greater On-Going
Performance Transactions sent to financial system with correct Transaction Code.
2009 95% Maintain a 95% or greater On-Going
Performance Transactions sent to financial system with correct Transaction Code.
2010 95% Maintain a 95% or greater On-Going
Performance Transactions sent to financial system with correct Transaction Code.
2011 95% Maintain a 95% or greater On-Going
Implementation Implement Enhancement to allow electronic deliverable submission.
2008 Q1 FY2008
Performance E-deliverable module is available for submission of proposals.
2008 System not currently available
Module available 98% of the time for submission of deliverables.
Results expected Q1 FY2009
Performance System is available for submission of proposals.
2009 TBD Maintain Module availability 98% of the time for submission of deliverables.
Results expected Q1 FY2010
Performance System is available for submission of proposals.
2010 TBD Maintain Module availability 98% of the time for submission of deliverables.
Results expected Q1 FY2011
Performance System is available for submission of proposals.
2011 TBD Maintain Module availability 98% of the time for submission of deliverables.
Results expected Q1 FY2012
7.7 FMSS MilestonesThe following table (Table 36) defines the milestones for FMSS, providing measurement indicators, fiscal year of milestones, baselines, planned improvements, and actual results/completion dates:
Table 36: FMSS Milestones
MilestoneType
Measurement IndicatorFiscal Year
BaselinePlanned Improvement
to the BaselineActual Results / Completion
DatesImplementation Implement FMSS solution 2006 Q1 2007
document.doc 2/29/08 89
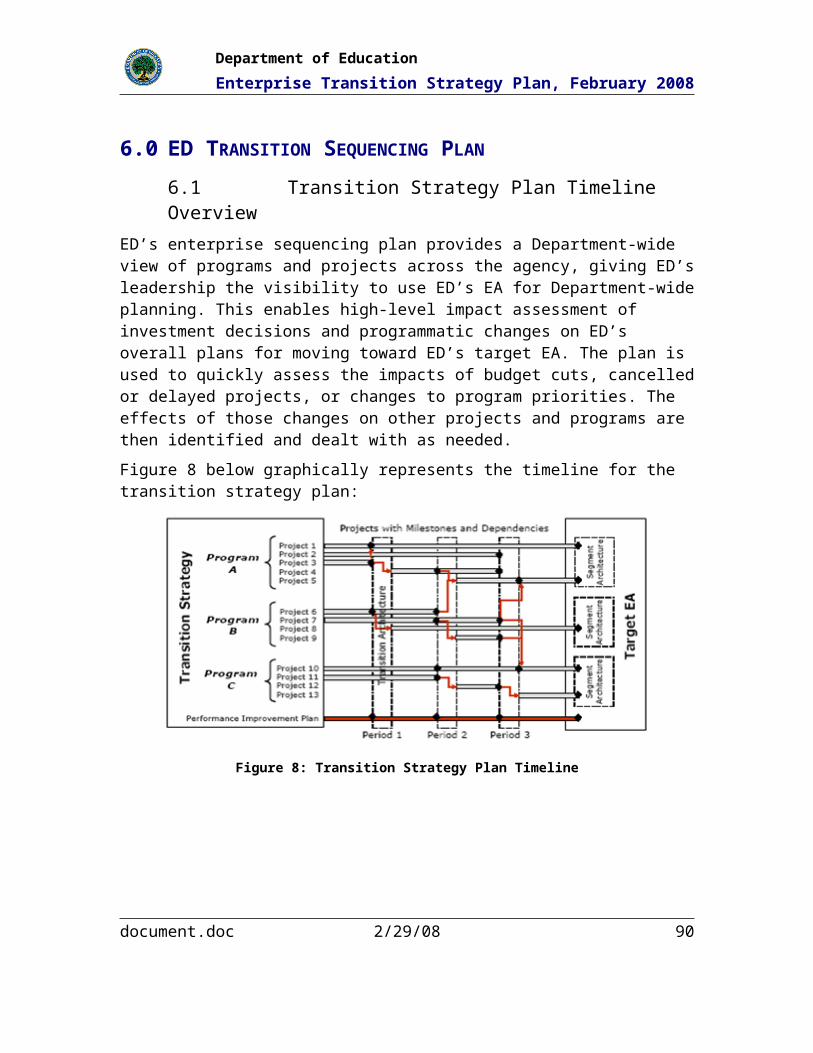
Department of Education
Enterprise Transition Strategy Plan, February 2008
MilestoneType
Measurement IndicatorFiscal Year
BaselinePlanned Improvement
to the BaselineActual Results / Completion
DatesPerformance 10% or less of Teamtrack items
are FMSS related.2007 10% of Teamtrack items
are FMSS related.8-9% of Teamtrack items are FMSS related.
Through the forth quarter of FY 2007 the Help Desk Tickets related to the FMSS were within the target parameter at < 9%.
Performance Less than 10% of Teamtrack items are FMSS related.
2008 8-9% of Teamtrack issues are FMSS related.
7-8% of Teamtrack issues are FMSS related.
Results will be available on a quarterly basis during FY2008.
Performance Less than 10% of Teamtrack items are FMSS related.
2009 8-9% of Teamtrack issues are FMSS related.
6-7% of Teamtrack issues are FMSS related.
Results will be available on a quarterly basis during FY2009.
Performance Less than 10% of Help Desk items are FMSS related.
2010 8-9% of Help Desk issues are FMSS related.
6-7% of Help Desk issues are FMSS related.
Results will be available quarterly during FY2010.
Performance Less than 10% of Help Desk items are FMSS related.
2011 8-9% of Help Desk issues are FMSS related.
6-7% of Help Desk issues are FMSS related.
Results will be available quarterly during FY2011.
Performance FMSS receives an unqualified audit opinion by independent auditors on FY 2007 annual financial statements.
2007 Unqualified opinion on the FY2006 financial statements.
Maintain unqualified opinion.
The Department received a clean audit opinion on the FY2007 department-wide annual financial statements produced by the FMSS.
Performance FMSS receives an unqualified audit opinion by independent auditors on FY 2008 annual financial statements.
2008 Unqualified audit opinion on previous year's financial statements.
Maintain unqualified opinions on financial statements.
Results are expected to be available November 2008.
Performance FMSS receives an unqualified audit opinion by independent auditors on FY 2009 annual financial statements.
2009 Unqualified audit opinion on previous year's financial statements.
Maintain unqualified opinions on financial statements.
Results are expected to be available November 2009.
Performance FMSS receives an unqualified audit opinion by independent auditors on FY 2010 annual financial statements.
2010 Unqualified audit opinion on previous year's financial statements.
Maintain unqualified opinions on financial statements.
Results are expected to be available November 2010
Performance FMSS receives an unqualified audit opinion by independent auditors on FY 2011 annual financial statements.
2011 Unqualified audit opinion on previous year's financial statements.
Maintain unqualified opinions on financial statements.
Results are expected to be available November 2011
document.doc 2/29/08 90

Department of Education
Enterprise Transition Strategy Plan, February 2008
MilestoneType
Measurement IndicatorFiscal Year
BaselinePlanned Improvement
to the BaselineActual Results / Completion
DatesPerformance Ability to produce financial
statements on a quarterly basis (4 times per year).
2007 Financial statements are produced quarterly.
Financial statements will be produced quarterly.
The fiscal year 2007 quarterly financial statements were successfully generated by the FMSS per the requirement.
Performance Ability to produce financial statements on a quarterly basis (4 times per year).
2008 Financial statements are produced quarterly
Quarterly financial statements will be produced by the FMSS during FY2008 (4 times per year).
Results will be available quarterly during FY2008.
Performance Ability to produce financial statements on a quarterly basis (4 times per year).
2009 Financial statements are produced quarterly
Quarterly financial statements will be produced by the FMSS during FY2009 (4 times per year).
Results will be available quarterly during FY2009.
Performance Ability to produce financial statements on a quarterly basis (4 times per year).
2010 Financial statements are produced quarterly
Quarterly financial statements will be produced by the FMSS during FY2010 (4 times per year).
Results will be available quarterly during FY2010.
Performance Ability to produce financial statements on a quarterly basis (4 times per year).
2011 Financial statements are produced quarterly
Quarterly financial statements will be produced by the FMSS during FY2011 (4 times per year).
Results will be available quarterly during FY2011.
Performance A Green rating on the annual OMB Stoplight Scorecard System.
2007 Green rating on scorecard system.
Maintain Green rating. The FMSS received a Green rating on the scorecard for 2007
Performance FMSS receives a Green rating on the OMB scorecard.
2008 FMSS has scored Green in previous years
FMSS will maintain Green rating.
Results will be available June 2008
Performance FMSS receives a Green rating on the OMB scorecard.
2009 FMSS has scored Green in previous years
FMSS will maintain Green rating.
Results will be available June 2009.
Performance FMSS receives a Green rating on the OMB scorecard.
2010 FMSS has scored Green in previous years
FMSS will maintain Green rating.
Results will be available June 2010.
Performance FMSS receives a Green rating on the OMB scorecard.
2011 FMSS has scored Green in previous years
FMSS will maintain Green rating.
Results will be available June 2011.
Performance 100% of risks in the Risk Log are reviewed monthly or
2007 100% of risks reviewed either monthly or
Maintain 100% review of risks both monthly and
As of the fourth quarter of FY2007, 100% of scheduled risk
document.doc 2/29/08 91
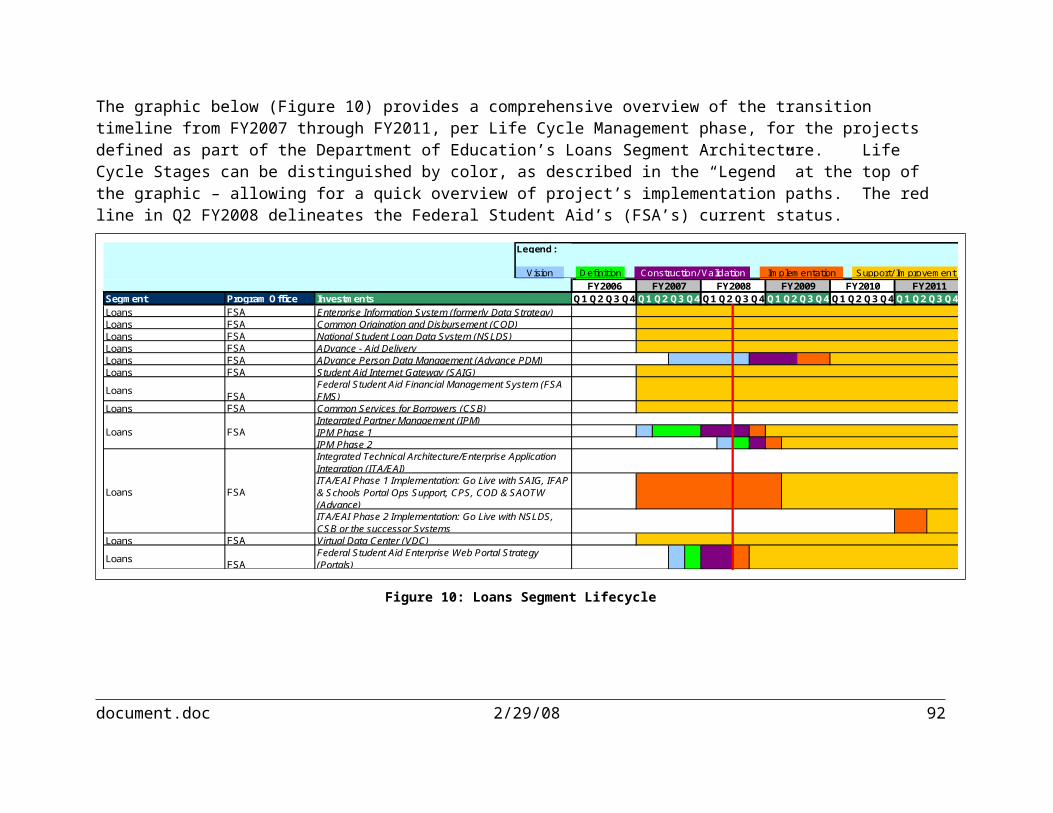
Department of Education
Enterprise Transition Strategy Plan, February 2008
MilestoneType
Measurement IndicatorFiscal Year
BaselinePlanned Improvement
to the BaselineActual Results / Completion
Datesquarterly, as indicated for risks, by the Project Management Team.
quarterly. quarterly. reviews were held by the Project Management Team.
Performance 100% of risks associated with the FMSS are reviewed monthly by the Project Manager.
2008 100% of risks reviewed by the Project Manager.
Continue reviewing FMSS risks monthly.
Results will be available monthly during FY2008
Performance 100% of risks associated with the FMSS are reviewed monthly by the Project Manager.
2009 100% of risks reviewed by the Project Manager.
Continue reviewing FMSS risks monthly.
Results will be available monthly during FY2009.
Performance 100% of risks associated with the FMSS are reviewed monthly by the Project Manager.
2010 100% of risks reviewed by the Project Manager.
Continue reviewing FMSS risks monthly.
Results will be available monthly during FY2010.
Performance 100% of risks associated with the FMSS are reviewed monthly by the Project Manager.
2011 100% of risks reviewed by the Project Manager.
Continue reviewing FMSS risks monthly.
Results will be available monthly during FY2011.
Performance Percentage of time system available is 98% or greater.
2007 FMSS available 98% of time.
Maintain 98% or greater availability of the FMSS.
Through the fourth quarter of FY 2007, the FMSS was available 99% of the planned scheduled availability.
Performance Percentage of time FMSS available is 98% or greater.
2008 FMSS available 98% or better.
Maintain 98% availability of the FMSS during FY2008.
Results will be available quarterly during FY2008.
Performance Percentage of time FMSS available is 98% or greater.
2009 FMSS available 98% or better.
Maintain 98% availability of the FMSS during FY2009.
Results will be available quarterly during FY2009.
Performance Percentage of time FMSS available is 98% or greater.
2010 FMSS available 98% or better.
Maintain 98% availability of the FMSS during FY2010.
Results will be available quarterly during FY2010.
Performance Percentage of time FMSS available is 98% or greater.
2011 FMSS available 98% or better.
Maintain 98% availability of the FMSS during FY2011.
Results will be available quarterly during FY2011.
7.8 ISS Milestones
The following table (Table 37) defines the milestones for ISS, providing measurement indicators, fiscal year of milestones, baselines, planned improvements, and actual results/completion dates:
document.doc 2/29/08 92
Department of Education
Enterprise Transition Strategy Plan, February 2008
Table 37: ISS Milestones
MilestoneType
Measurement IndicatorFiscal Year
BaselinePlanned Improvement
to the BaselineActual Results / Completion
DatesImplementation Implemented ISS solution 1998 **Solution is currently in O&M, no additional
enhancements are planned and performance metrics have been met through 2007.
Q4 1998
Performance Monthly customer service survey results.
2007 Score of 4 out of 5 Increase to 4. 5 out of 5. 4.2
Performance Monthly customer service survey results.
2008 Score 4.2 out of 5. Increase to 4.5 out of 5. Results available 11/2008.
Performance Monthly customer service survey results.
2009 TBD 11/2007. Increase to 4.5 out of 5. Results available 11/2009.
Performance Monthly customer service survey results.
2010 TBD 11/2008. Increase to 4.5 out of 5. Results available 11/2010.
Performance Monthly customer service survey.
2011 TBD 11/2009. Increase to 4.5 out of 5. Results available 11/2011.
Performance Percentage of grant applications submitted electronically (for programs participating).
2007 74% Increase to 80% 78%
Performance Percentage of grant applications submitted electronically (for programs participating).
2008 78% Increase to 80% Results available 8/2008.
Performance Percentage of grant applications submitted electronically (for programs participating).
2009 TBD 8/2008. Increase to 85% Results available 8/2009.
Performance Percentage of grant applications submitted electronically (for programs participating).
2010 TBD 8/2009. Increase to 90% Results available 8/2010.
Performance Percentage of grant applications submitted electronically (for programs participating).
2011 TBD 8/2010. Increase to 95% Results available 8/2011.
Performance Clean audit opinion 2007 Clean audit Maintain clean audit. Results available 12/2007.
Performance Clean audit opinion 2008 TBD 12/2007. Maintain clean audit. Results available 12/2008.
document.doc 2/29/08 93

Department of Education
Enterprise Transition Strategy Plan, February 2008
MilestoneType
Measurement IndicatorFiscal Year
BaselinePlanned Improvement
to the BaselineActual Results / Completion
DatesPerformance Clean audit opinion 2009 TBD 12/2008. Maintain clean audit. Results available 12/2009.
Performance Clean audit opinion 2010 TBD 12/2009. Maintain clean audit. Results available 12/2010.
Performance Clean audit opinion 2011 TBD 12/2010. Maintain clean audit. Results available 12/2011.
Performance Percentage of time EDCAPS platform is available to customers during regular operating hours
2007 99% Increase to 99.5% 99.10%
Performance Percentage of time EDCAPS platform is available to customers during regular operating hours
2008 99.10% Increase to 99.5% Results available 8/2008.
Performance Percentage of time EDCAPS platform is available to customers during regular operating hours
2009 TBD 8/2008. Increase to 99.5% Results available 8/2009.
Performance Percentage of time EDCAPS platform is available to customers during regular operating hours
2010 TBD 8/2009 Maintain 99.5% Results available 8/2010
Performance Percentage of time EDCAPS platform is available to customers during regular operating hours
2011 TBD 8/2010 Maintain 99.5% Results available 8/2011
document.doc 2/29/08 94

Department of Education
Enterprise Transition Strategy Plan, February 2008
7.9 TMS Milestones
The following table (Table 38) defines the milestones for TMS, providing measurement indicators, fiscal year of milestones, baselines, planned improvements, and actual results/completion dates:
Table 38: TMS Milestones
MilestoneType Measurement Indicator
Fiscal
YearBaseline
Planned Improvement to the Baseline
Actual Results / Completion Dates
Implementation TMS System Implemented 2007 Q1 2007
Performance Help Desk Support 2007 Maintain 50% End-User Traveler Issues resolved within one hour.
75% End-User Traveler Issues resolved within one hour
As of 9/30/07, 99% of end-user travel issues were resolved with the EDCAPS Help Desk. Those that could not be resolved by Help Desk Staff or Functional Team were referred to the vendor's Help Desk for resolution.
Performance Help Desk Support 2008 Maintain 75% End-User Traveler Issues resolved within one hour.
80% End-User Traveler Issues resolved within one hour
Results expected December 2008.
Performance Help Desk Support 2009 Maintain 75% End-User Traveler issues resolved within one hour.
Maintain 80% end-user traveler issues resolved within one hour
Results expected December 2009.
Performance Help Desk Support 2010 Maintain 75% End-User Traveler issues resolved within one hour.
Maintain 80% end-user traveler issues resolved within one hour
Results expected December 2010.
Performance Help Desk Support 2011 Maintain 75% End-User Traveler issues resolved within one hour.
Maintain 80% end-user traveler issues resolved within one hour
Results expected December 2011.
Performance Reduced Travel Ticket Transactions Fees
2007 Maintain 50% usage of on-line booking engine.
Maintain 70% usage of on-line booking engine
As of 9/30/07, 70% usage of on-line booking by ED staff to secure travel reservations.
Performance Reduced Travel Ticket Transactions Fees
2008 Maintain 70% adoption rate of on-line booking engine.
Maintain 75% usage of on-line booking engine
Results expected December 2008.
document.doc 2/29/08 95

Department of Education
Enterprise Transition Strategy Plan, February 2008
MilestoneType Measurement Indicator
Fiscal
YearBaseline
Planned Improvement to the Baseline
Actual Results / Completion Dates
Performance Reduced Travel Ticket Transactions Fees
2009 Maintain 70% usage of on-line booking engine.
Maintain 75% usage of on-line booking engine
Results expected December 2009.
Performance Reduced Travel Ticket Transaction Fees
2010 Maintain 70% usage of on-line booking engine.
Maintain 75% usage of on-line booking engine
Results expected December 2010.
Performance Reduced Travel Ticket Transaction Fees
2011 Maintain 70% usage of on-line booking engine.
Maintain 75% usage of on-line booking engine
Results expected December 2011.
Performance Interface Failures 2007 Maintain 26 interface failures preventing documents from processing in the general ledger.
Maintain less than 18 per year.
As of 9/30/07, 6 interface failures have resulted. Resolution of file failure were addressed and resolved within 24 hours as outlined in the SLAs.
Performance Interface Failures 2008 Maintain 18 interface failures preventing documents from processing in the general ledger.
Maintain less than 15 per year.
Results expected December 2008.
Performance Interface Failures 2009 Maintain 18 interface failures preventing documents from processing in the general ledger.
Maintain less than 15 per year.
Results expected December 2009.
Performance Interface Failures 2010 Maintain 18 interface failures preventing documents from processing in the general ledger.
Maintain less than 15 per year.
Results expected December 2010.
Performance Interface Failures 2011 Maintain 18 interfaces failures preventing documents from processing in the general ledger.
Maintain less than 15 per year.
Results expected December 2011
Performance Travel Document Processing 2007 Maintain 3-4 days for Reduce processing to 2-3 As of 9/30/07, travel files were
document.doc 2/29/08 96

Department of Education
Enterprise Transition Strategy Plan, February 2008
MilestoneType Measurement Indicator
Fiscal
YearBaseline
Planned Improvement to the Baseline
Actual Results / Completion Dates
travel document processing.
days. processed timely and payment were made within 24 hours of successful file processing.
Performance Travel Document Processing 2008 Maintain 2-3 days for travel document processing.
Reduce processing to 1-2 days.
Results expected December 2007.
Performance Travel Document Processing 2009 Maintain 2-3 days for travel document processing.
Maintain reduction of Processing to 1-2 days.
Results expected December 2008.
Performance Travel Document Processing 2010 Maintain 2-3 days for travel document processing.
Maintain reduction of processing to 1-2 days.
Results expected December 2009.
Performance Travel Document Processing 2011 Maintain 2-3 days for travel document processing.
Maintain reduction of processing to 1-2 days.
Results expected December 2010.
Performance System Downtime 2007 Maintain 20 system reboots due to hung applications.
Reduce to 14. As of 9/30/07, ED requested no system reboots to the vendor. System availability is monitored by GSA. Scheduled maintenance was performed as required.
Performance System Downtime 2008 Maintain 14 system reboots due to hung applications.
Reduce to 10. Results expected December 2007.
Performance System Downtime 2009 Maintain 10 system reboots due to hung applications.
Maintain reduction to 10 Results expected December 2008.
Performance System Downtime 2010 Maintain 10 system reboots due to hung applications.
Maintain reduction to 10 Results expected December 2009.
Performance System Downtime 2011 Maintain 10 system reboots due to hung applications.
Maintain reduction to 10 Results expected December 2010.
document.doc 2/29/08 97

Department of Education
Enterprise Transition Strategy Plan, February 2008
7.10 E-Authentication Milestones
The following table (Table 39) defines the milestones for e-Authentication, providing measurement indicators, fiscal year of milestones, baselines, planned improvements, and actual results/completion dates:
Table 39: E-Authentication Milestones
MilestoneType Measurement Indicator
Fiscal
YearBaseline
Planned Improvement to the Baseline
Actual Results / Completion Dates
Implementation E-Authentication Infrastructure implemented
2006 Q3 FY2006
Performance Integrate Systems with the E-Authentication Infrastructure. Number of System integrated to the E-Authentication Infrastructure.
2006 0 1 1, Q3 FY2006
Performance Integrate Systems with the E-Authentication Infrastructure. Number of System integrated to the E-Authentication Infrastructure.
2007 1 2 2, Q4 FY2007
Performance Integrate Systems with the E-Authentication Infrastructure. Number of System integrated to the E-Authentication Infrastructure.
2008 3 6 Actual results will be available as of September 2008.
Performance Percentage time that the E-Authentication Infrastructure is available excluding scheduled maintenance.
2006 0 98% 98%, Q3 FY2006
Performance Maintain percentage of time that the E-Authentication Infrastructure is available excluding scheduled maintenance.
2007 98% 98% 98%, Q4 FY2007
Performance Maintain percentage of time that 2008 98% 98% Actual results will be available as
document.doc 2/29/08 98
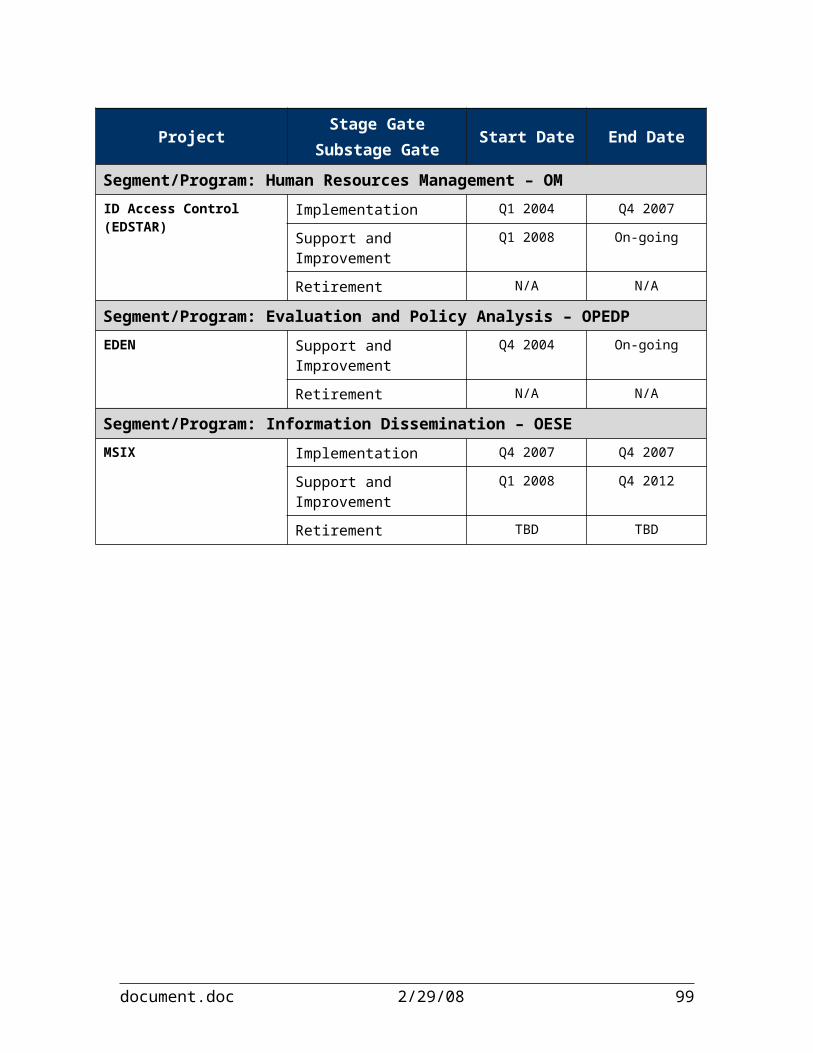
Department of Education
Enterprise Transition Strategy Plan, February 2008
MilestoneType Measurement Indicator
Fiscal
YearBaseline
Planned Improvement to the Baseline
Actual Results / Completion Dates
the E-Authentication Infrastructure that is available excluding scheduled maintenance.
of September 2008.
Performance Maintain percentage of time that the E-Authentication Infrastructure that is available excluding scheduled maintenance.
2009 98% 98% Actual results will be available as of 9/2009.
Performance Service availability. 2006 99% 99% 99%, Q3 FY2006
Performance Maintain optimal Service availability.
2007 99% 99% 99%, Q4 FY2007
Performance Maintain optimal Service availability.
2008 99% 99% Actual results will be available as of September 2008.
Performance Maintain optimal Service availability.
2009 99% 99% Actual results will be available as of September 2009.
Performance Response time to initiate knowledge transfer of E-Authentication knowledge upon request (in business days).
2006 0 5 5 days, Q3 FY2006
Performance Number of days from request to Account creation and Password Resets.
2007 7 0 0, Q4 FY2007
Performance Percentage of problems related to the E-Authentication infrastructure. Percentage of problem resolution.
2007 0 80% 80%, Q4 FY2007
Performance Percentage of problems resolved that related to the E-Authentication infrastructure. Percentage of problem resolution.
2008 80% 85% Actual results will be available as of September 2008.
document.doc 2/29/08 99

Department of Education
Enterprise Transition Strategy Plan, February 2008
MilestoneType Measurement Indicator
Fiscal
YearBaseline
Planned Improvement to the Baseline
Actual Results / Completion Dates
Performance Number of unauthorized user accesses found during audits and system scans.
2007 0 0 0, Q4 FY2007
Performance Number of verified, major system vulnerabilities found during audits and system scans.
2008 0 0 Actual results will be available as of September 2008.
Implementation Integrate FSA applications into E-Authentication service.
2008 Q4 FY2008
Performance Integrate 1 FSA application ( eCampus Based application) into the Federal Student Aid E-Authentication service.
2008 0 1 Q4 FY2008
Performance Completion of assessment, risk evaluation, preliminary population determination and sequence plan for three additional Federal Student Aid systems.
2008 1 4 Q2 FY2008
Performance Completion of assessment, risk evaluation, preliminary population determination and sequence plan for three additional Federal Student Aid systems.
2008 4 7 Q3 FY2008
Performance Completion of assessment, risk evaluation, preliminary population determination and sequence plan for three additional Federal Student Aid systems
2008 7 10 Q4 FY2008
document.doc 2/29/08 100
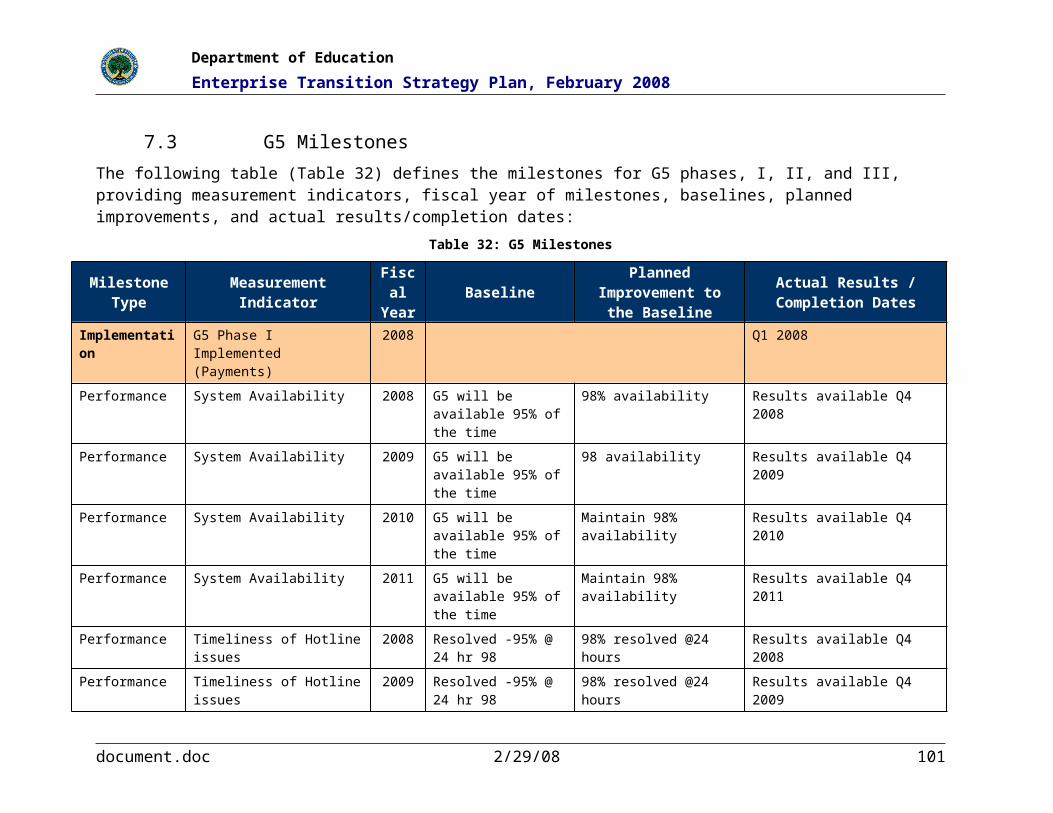
Department of Education
Enterprise Transition Strategy Plan, February 2008
7.11 NCES Web Milestones
The following table (Table 40) defines the milestones for NCES Web, providing measurement indicators, fiscal year of milestones, baselines, planned improvements, and actual results/completion dates:
Table 40: NCES Web Milestones
MilestoneType
Measurement IndicatorFiscal Year
BaselinePlanned Improvement
to the BaselineActual Results / Completion
Dates
Implementation CCD Web Implementation (Web Usage to BAT)
2007 Q4, 2007
Performance Increase the average number of unique user sessions per month.
2007 26K (As of 9/30/06) 27.5K 26.5K (As of March 31, 2007)
Performance Increase the average number of unique user sessions per month.
2008 26.5K 30K Q4 FY2008
Performance Web usage to BAT. Increase the average number of unique user sessions per month.
2009 30K 32.5K Q4 FY2009
Performance Decreased CCD Collection System (used by states to transmit collection data to NCES) data processing time. This is calculated by Benchmark file “import time + processing time in minutes.
2007 60 20 18 (as of March 31, 2007)
Performance Decreased CCD Collection System (used by states to transmit collection data to NCES) data processing time. This is calculated by Benchmark file “import time + processing time in minutes.
2008 18 15 Q4 FY2008
Performance Decreased CCD Collection System (used by states to transmit collection data to NCES) data processing time. This is calculated by Benchmark
2009 15 12 Q4 FY2009
document.doc 2/29/08 101

Department of Education
Enterprise Transition Strategy Plan, February 2008
MilestoneType
Measurement IndicatorFiscal Year
BaselinePlanned Improvement
to the BaselineActual Results / Completion
Datesfile “import time + processing time in minutes.
Implementation ESLSD database consolidations phase two. Continue expansion of metadata layer of the ESLSD DB
2007 Q4 FY2007
Performance Number of NCES Web Applications (total of 8) incorpor-ating reusable metadata items.
2007 4 6 6 - Q4 FY2007
Performance Number of NCES Web Applications (total of 8) incorpor-ating reusable metadata items.
2008 6 8 Q4 FY2008
Implementation ALS Collection Application production migration and operation.
2007 Q4 FY2007
Performance Prepare the ALS collection application 2 weeks earlier than the previous year.
2007 October 15th October 1st Collection date changed by NCES to Nov 22. Application testing was completed on Nov 13, 2007.
Performance Prepare the ALS collection application 2 weeks earlier than the previous year.
2008 October 15th October 1st Q4 FY2008
Performance Prepare the ALS collection application 2 weeks earlier than the previous year.
2009 October 1st September 15th Q4 FY2009
Performance State Library (STLa) survey online collection application – reduced number of reported defects by 50% from same period last year
2007 6 3 0 – as of March 31, 2007
Performance State Library (STLa) survey 2008 0 0 Q4 FY2008
document.doc 2/29/08 102

Department of Education
Enterprise Transition Strategy Plan, February 2008
MilestoneType
Measurement IndicatorFiscal Year
BaselinePlanned Improvement
to the BaselineActual Results / Completion
Datesonline collection application –maintain 0 reported defects.
Performance State Library (STLa) survey online collection application –maintain 0 reported defects.
2009 0 0 Q4 FY2009
7.12 IPEDS Milestones
The following table (Table 41) defines the milestones for IPEDS, providing measurement indicators, fiscal year of milestones, baselines, planned improvements, and actual results/completion dates:
Table 41: IPEDS Milestones
MilestoneType
Measurement IndicatorFiscal Year
BaselinePlanned Improvement to
the BaselineActual Results /
Completion DatesImplementation Implemented IPEDS solution 2000 ** Solution is currently in O&M, no additional
enhancements are planned and performance metrics have been met through 2007.
Q4, 2000
Performance Percentage of customers reporting they are satisfied with IPEDS.
2007 85% Maintain/improve percentage of satisfied customers.
Q4, 2007 - The NCES Customer Survey included items on IPEDS respondents’ satisfaction. Over 88 percent of respondents were satisfied or very satisfied with IPEDS systems, including the Help Desk responsiveness.
Performance Percentage of customers reporting they are satisfied with IPEDS.
2008 88% Maintain/improve percentage of satisfied customers.
Data not available until Fall 2008.
Performance Percentage of customers reporting they are satisfied with IPEDS.
2009 Actual data will used from 2008 above
Maintain/improve percentage of satisfied customers.
Data not available until Fall 2009.
Performance Maintain 95 percent response rate.
2007 95 percent Maintain or improve at least 95% response rate.
Q4 FY2007 – Rsponse rates met or exceeded goals
document.doc 2/29/08 103
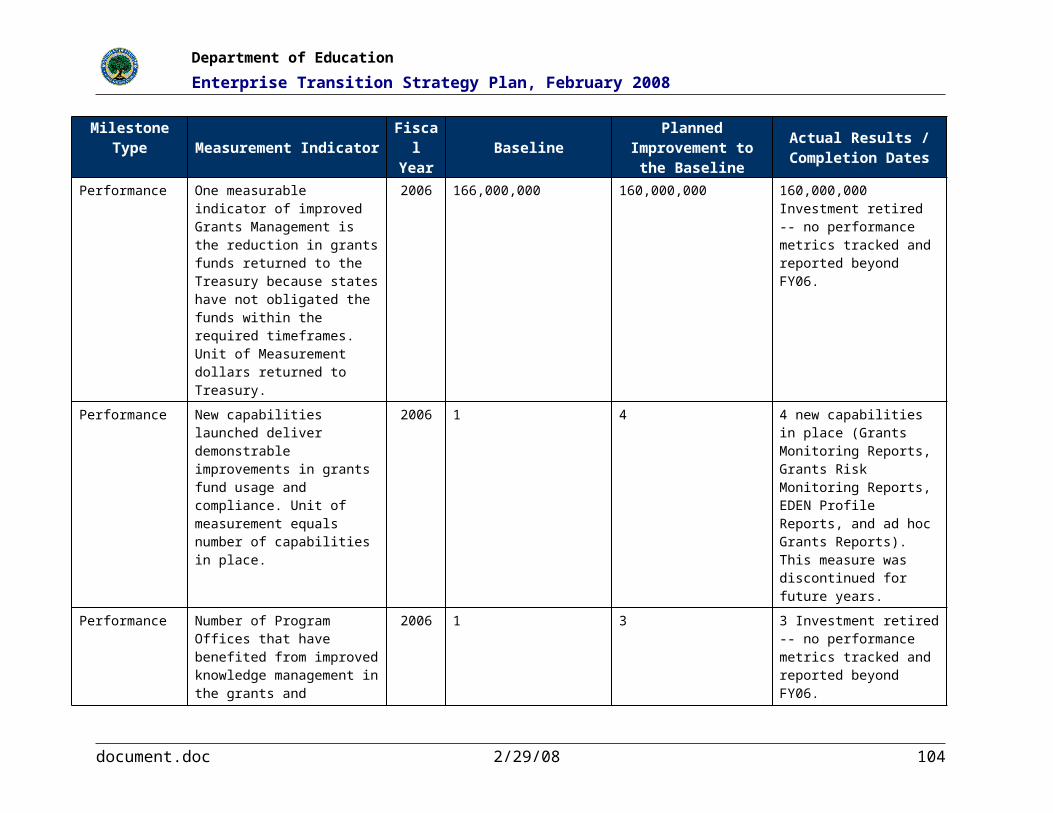
Department of Education
Enterprise Transition Strategy Plan, February 2008
MilestoneType
Measurement IndicatorFiscal Year
BaselinePlanned Improvement to
the BaselineActual Results /
Completion DatesPerformance Maintain 95 percent response
rate.2008 95 percent Maintain or improve at least
95% response rate.Final response rates will be available approximately in July 2008.
Performance Maintain 95 percent response rate.
2009 95 percent Maintain or improve at least 95% response rate.
Final response rates will be available approximately in July 2009.
Performance Data transfer time from collection to dissemination.
2007 6 months Goal is to get data from collection to dissemination within 6 months.
Information on this will be available in late-2008.
Performance Help Desk response time 2007 Less than 5 minutes The goal is to maintain or to improve Help Desk response time.
In FY2007, it took an average of 5 minutes, 24 seconds per call.
Performance Help Desk response time 2008 Less than 5 minutes The goal is to maintain or to improve Help Desk response time.
Data on this will be available approximately in June 2008.
Performance Help Desk response time 2009 Less than 5 minutes The goal is to maintain or to improve Help Desk response time.
Data on this will be available approximately in June 2009.
Performance Days delay in opening 2007 Less than 10 days Maintain/improve number of days that opening is delayed.
For Fall 2007, there was a one day delay in opening.
Performance Days delay in opening 2008 Less than 10 days Maintain/improve number of days that opening is delayed.
This information will be available by October 1, 2008.
Performance Days delay in opening 2009 Less than 10 days Maintain/improve number of days that opening is delayed.
This information will be available by October 1, 2009.
7.13 NAEP MilestonesThe following table (Table 42) defines the milestones for NAEP, providing measurement indicators, fiscal year of milestones, baselines, planned improvements, and actual results/completion dates:
document.doc 2/29/08 104

Department of Education
Enterprise Transition Strategy Plan, February 2008
Table 42: NAEP Milestones
Milestone
TypeMeasurement Indicator
Fiscal Year
BaselinePlanned Improvement to
the BaselineActual Results/Completion
Dates
Implementation Implementation of the NAEP system.NAEP is documented as a mixed life cycle investment(Due to planned enhancements reflected below as implementation milestones).
2008 Q1 FY2008
Implementation FY09 NAEP Public Site Redesign to implement new site design and information architecture.
2008 Q4 FY2008
Implementation FY09 Public Site Redesign to take feedback from user logs and focus groups to refine/update site redesign.
2009 Q4 FY2009
Implementation Upgrade to NAEP Network to the latest SharePoint version to implement new collaborative features and increased workflow capabilities
2010 Q4 FY2010
Implementation Upgrade to NAEP CRM applications to lead to a consolidation and integration of the NAEP CRM applications. This will result in a single set of application code and data to report dashboard components to managers.
2011 Q4 FY2011
Performance Average visitors to Integrated Management System per day to be measured by number of unique users (unique IP addresses) to the IMS as measured in user logs.
2007 60 visitors 85 visitors 65, Q1 FY2007
Performance Average visitors to Integrated Management System per day to be measured by number of unique users (unique IP addresses) to the IMS as measured in user logs.
2008 65 visitors 85 visitors TBD Q1 FY2008
Performance Average visitors to Integrated Management System per day to be measured by number of unique users (unique IP addresses) to the
2009 85 visitors 95 visitors TBD Q1 FY2009
document.doc 2/29/08 105
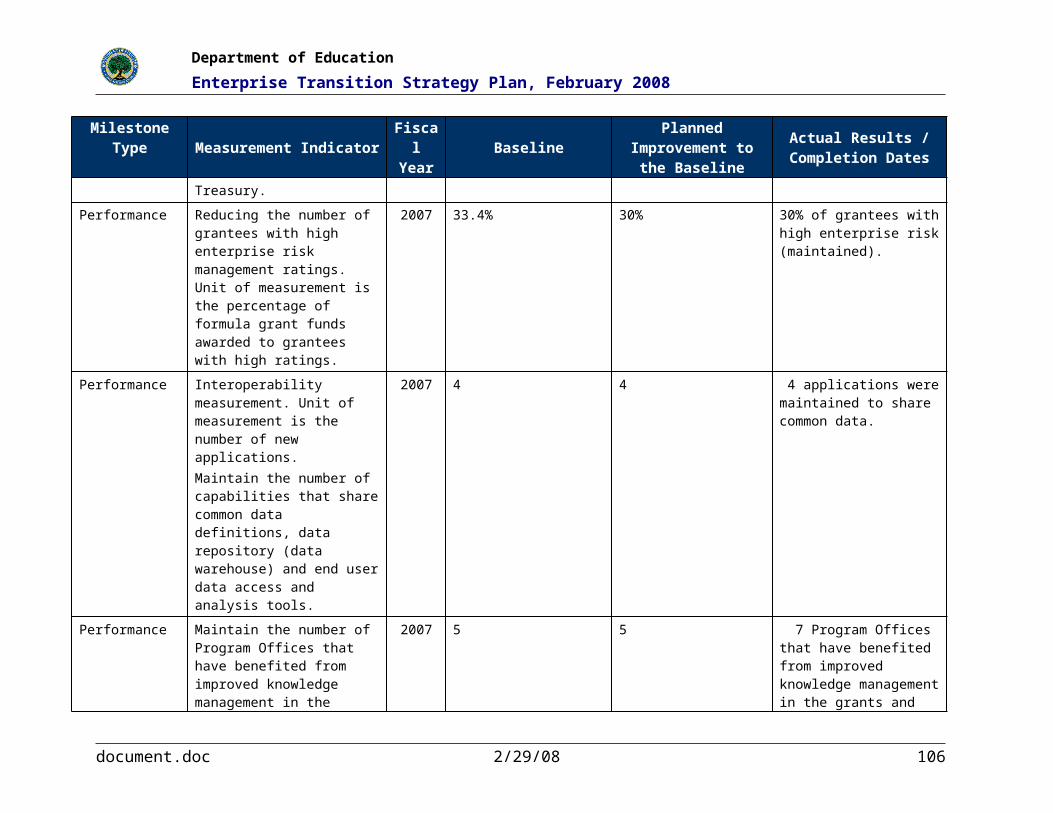
Department of Education
Enterprise Transition Strategy Plan, February 2008
Milestone
TypeMeasurement Indicator
Fiscal Year
BaselinePlanned Improvement to
the BaselineActual Results/Completion
Dates
IMS as measured in user logs.
Performance Average visitors to Integrated Management System per day to be measured by number of unique users (unique IP addresses) to the IMS as measured in user logs.
2010 95 visitors 110 visitors TBD Q1 2010
Performance Average visitors to Integrated Management System per day to be measured by number of unique users (unique IP addresses) to the IMS as measured in user logs.
2011 110 visitors 120 visitors TBD Q1 FY2011
Performance Average visitors to Integrated Management System per day to be measured by number of unique users (unique IP addresses) to the IMS as measured in user logs.
2012 120 visitors 120 visitors TBD Q1 FY2012
Performance Percentage of NAEP data users who are satisfied or very satisfied with NAEP products. This information will be provided as part of the NAEP Web Contractor's Award Fee Evaluation.
2007 75 100% 100 – Q1 FY2007
Performance Percentage of NAEP data users who are satisfied or very satisfied with NAEP products. This information will be provided as part of the NAEP Web Contractor's Award Fee Evaluation.
2008 100 Maintain 100% TBD, Q1 FY2008
Performance Percentage of NAEP data users who are satisfied or very satisfied with NAEP products. This information will be provided as part of the NAEP Web Contractor's Award Fee Evaluation.
2009 100 Maintain 100% TBD, Q1 FY2009
Performance Percentage of NAEP data users who are satisfied or very satisfied with NAEP products. This information will be provided as part of the NAEP Web Contractor's Award Fee Evaluation.
2010 100 Maintain 100% TBD, Q1 FY2010
document.doc 2/29/08 106

Department of Education
Enterprise Transition Strategy Plan, February 2008
Milestone
TypeMeasurement Indicator
Fiscal Year
BaselinePlanned Improvement to
the BaselineActual Results/Completion
Dates
Performance Percentage of NAEP data users who are satisfied or very satisfied with NAEP products. This information will be provided as part of the NAEP Web Contractor's Award Fee Evaluation.
2011 100 Maintain 100% TBD, Q1 FY2011
Performance Percentage of NAEP data users who are satisfied or very satisfied with NAEP products. This information will be provided as part of the NAEP Web Contractor's Award Fee Evaluation.
2012 100 Maintain 100% TBD, Q1 FY2012
Performance Average number of page requests per month on NAEP web site
2007 45,000 55,000 300,000 – Q1 FY2007
Performance Average number of page requests per month on NAEP web site as measured by total page requests from the NAEP public web site.
2008 300,000 350,000 TBD, Q1 FY2008
Performance Average number of page requests per month on NAEP web site as measured by total page requests from the NAEP public web site.
2009 350, 000 375,00 TBD, Q1 FY2009
Performance Average number of page requests per month on NAEP web site as measured by total page requests from the NAEP public web site.
2010 375,000 385,000 TBD, Q1 FY2010
Performance Average number of page requests per month on NAEP web site as measured by total page requests from the NAEP public web site.
2011 385,000 400,000 TBD, Q1 FY2011
Performance Average number of page requests per month on NAEP web site as measured by total page requests from the NAEP public web site.
2012 400,000 410,000 TBD Q1 FY2012
Performance Content Management System (CMS) and Q1 10 20 20
document.doc 2/29/08 107

Department of Education
Enterprise Transition Strategy Plan, February 2008
Milestone
TypeMeasurement Indicator
Fiscal Year
BaselinePlanned Improvement to
the BaselineActual Results/Completion
Dates
ADTracker content items increase with additional use, to be measured in number of published pages and content items contained within the CMS/ADTracker.
2007
Implementation ADTracker/WebCMS Integration results in removal of ADTracker as a stand-alone tracking system
2008 Q1 FY2008
Performance Removal of ADTracker as a stand-alone tracking system
2008 N/A Retire ADTracker as a stand-alone tracking system
Q1 FY2008
Performance Content Management System (CMS) and ADTracker content items increase with additional use, to be measured in number of published pages and content items contained within the CMS/ADTracker.
Q1 2008
10 20 TBD, Q1 FY2008
Implementation WebCMS system is upgraded to a new system with more advanced workflow and latest supported language. Table creation embedded into system
2009 Q4 FY2009
Performance Content Management System (CMS) and ADTracker content items increase with additional use, to be measured in number of published pages and content items contained within the CMS/ADTracker.
2009 12 18 TBD, Q1 FY2009
Performance Content Management System (CMS) and ADTracker content items increase with additional use, to be measured in number of published pages and content items contained within the CMS/ADTracker.
2010 18 24 TBD, Q1 FY2010
Performance Content Management System (CMS) and ADTracker content items increase with additional use, to be measured in number of published pages and content items contained within the CMS/ADTracker.
2011 24 30 TBD, Q1 FY2011
document.doc 2/29/08 108

Department of Education
Enterprise Transition Strategy Plan, February 2008
Milestone
TypeMeasurement Indicator
Fiscal Year
BaselinePlanned Improvement to
the BaselineActual Results/Completion
Dates
Performance Content Management System (CMS) and ADTracker content items increase with additional use, to be measured in number of published pages and content items contained within the CMS/ADTracker.
2012 30 36 TBD, Q1 FY2012
Performance Percentage of time NAEP web site is available to be measured using up-time logs and access times recorded at host.
2007 94 97 96 – Q1 FY2007
Performance Percentage of time NAEP web site is available to be measured using up-time logs and access times recorded at host as hours available per month.
2008 96 99 TBD, Q1 FY2008
Performance Percentage of time NAEP web site is available to be measured using up-time logs and access times recorded at host as hours available per month.
2009 96 99 TBD, Q1 FY2009
Performance Percentage of time NAEP web site is available to be measured using up-time logs and access times recorded at host as hours available per month.
2010 96 99 TBD, Q1 FY2010
Performance Percentage of time NAEP web site is available to be measured using up-time logs and access times recorded at host as hours available per month.
2011 96 99 TBD, Q1 FY2011
Performance Percentage of time NAEP web site is available to be measured using up-time logs and access times recorded at host as hours available per month.
2012 96 99 TBD, Q1 FY2012
Implementation Integrated Management System is upgraded to version 3.5 to include dashboard reporting and improved search capability
2008 Q1 2009
Performance Integrated Management System (IMS) content items increase with additional use
2009 10 20 TBD, Q1 FY2009
document.doc 2/29/08 109
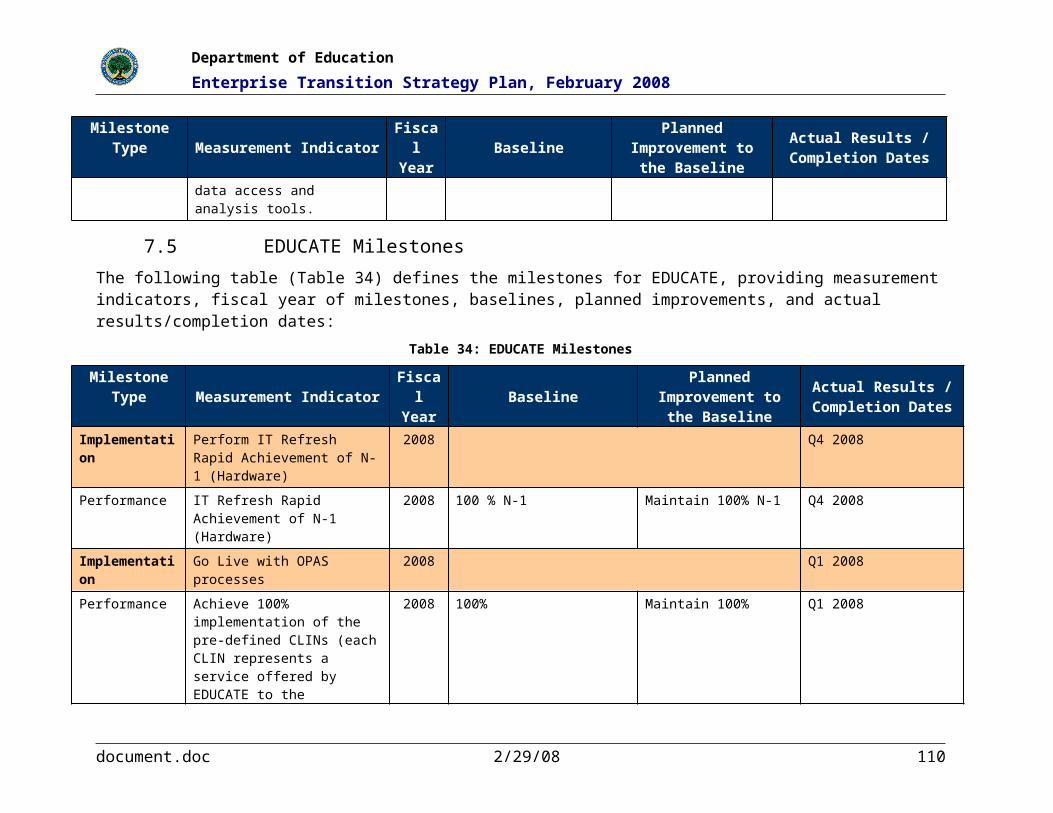
Department of Education
Enterprise Transition Strategy Plan, February 2008
Milestone
TypeMeasurement Indicator
Fiscal Year
BaselinePlanned Improvement to
the BaselineActual Results/Completion
Dates
to be measured in number of published pages and content items contained within the IMS.
Performance Integrated Management System (IMS) content items increase with additional use to be measured in number of published pages and content items contained within the IMS.
2010 10 20 TBD, Q1 FY2010
Performance Integrated Management System (IMS) content items increase with additional use to be measured in number of published pages and content items contained within the IMS.
2011 10 20 TBD, Q1 FY2011
7.14 ERIC Milestones
The following table (Table 43) defines the milestones for ERIC, providing measurement indicators, fiscal year of milestones, baselines, planned improvements, and actual results/completion dates:
Table 43: ERIC Milestones
MilestoneType Measurement Indicator
Fiscal
YearBaseline
Planned Improvement to the Baseline
Actual Results / Completion Dates
Implementation Implemented ERIC.ED.GOV web site
2004 Q4 FY2004
Performance Customer satisfaction rate with Web site.
2006 A customer satisfaction survey was not competed prior to FY 2005, so it is not possible to identify a customer satisfaction baseline at this time. The survey will be conducted in FY 2005 and will serve as the baseline for the project.
Maintain at least a 70% customer satisfaction rating (this performance goals is based on industry best practices as identified by the American Customer Satisfaction Index for Web sites).
For December 2006, the customer satisfaction score was 68 based on 601 respondents to the survey.
document.doc 2/29/08 110

Department of Education
Enterprise Transition Strategy Plan, February 2008
MilestoneType Measurement Indicator
Fiscal
YearBaseline
Planned Improvement to the Baseline
Actual Results / Completion Dates
Performance Percentage of new content in areas of information mandated by legislation available to the public.
2007 Only a limited degree of full text material was available to the public at the end of FY 2004.
95% of full text material will be available to the public in FY 2006.
A project initiated to digitize the back file of about 339,000 full text documents. Once copyright permission is obtained from the authors, the ERIC web site will post additional documents for which permission to disseminate has been granted. At the end of Q4 2007 an additional 54,000 full text materials were released to the user community.
Performance Average amount of time to enter a journal into the database after publication.
2007 6 to 9 months was the average amount of time to enter a journal into the database after publication during FY 2004.
1 month Measured Q2 2007: The average cycle time from date of acquisition to publication on the ERIC web site was less than 30 days for both journal and non-journal materials.
Performance Percentage of time the online system (website, database, and search engine) is available to the public.
2007 98% This baseline is only based on one month of data - September 2004.
99% Measured Q2 2007, the website and database were up 99.69% of time.
Performance Customer satisfaction rate with Web site.
2008 A customer satisfaction survey was not competed prior to FY 2005, so it is not possible to identify a customer satisfaction baseline at this time. The survey will be conducted in FY 2005 and will serve as the baseline for the project.
Maintain at least a 70.05% customer satisfaction rating (this performance goals is based on industry best practices as identified by the American Customer Satisfaction Index for Web sites).
December 2008
document.doc 2/29/08 111

Department of Education
Enterprise Transition Strategy Plan, February 2008
MilestoneType Measurement Indicator
Fiscal
YearBaseline
Planned Improvement to the Baseline
Actual Results / Completion Dates
Performance Percentage of new content in areas of information mandated by legislation available to the public.
2008 Only a limited degree of full text material was available to the public at the end of FY2004.
100% of full text material will be available to the public in FY 2006.
December 2008
Performance Average amount of time to enter a journal into the database after publication.
2008 6 to 9 months was the average amount of time to enter a journal into the database after publication during FY2004.
3 weeks December 2008
Performance Percentage of time the online system (website, database, and search engine) is available to the public.
2008 98% This baseline is only based on one month of data - September 2004.
99.50% December 2008
Performance Customer satisfaction rate with Web site.
2009 A customer satisfaction survey was not competed prior to FY 2005, so it is not possible to identify a customer satisfaction baseline at this time. The survey will be conducted in FY2005 and will serve as the baseline for the project.
Maintain at least a 70.05% customer satisfaction rating (this performance goals is based on industry best practices as identified by the American Customer Satisfaction Index for Web sites).
December 2009
Performance Percentage of new content in areas of information mandated by legislation available to the public.
2009 Only a limited degree of full text material was available to the public at the end of FY2004.
100% of full text material will be available to the public in FY 2006.
December 2009
Performance Average amount of time to enter a journal into the database after publication.
2009 6 to 9 months was the average amount of time to enter a journal into the database after publication during FY2004.
3 weeks December 2009
Performance Percentage of time the online system (website, database, and search engine) is available to the public.
2009 98% This baseline is only based on one month of data – September 2004.
99.50% December 2009
document.doc 2/29/08 112
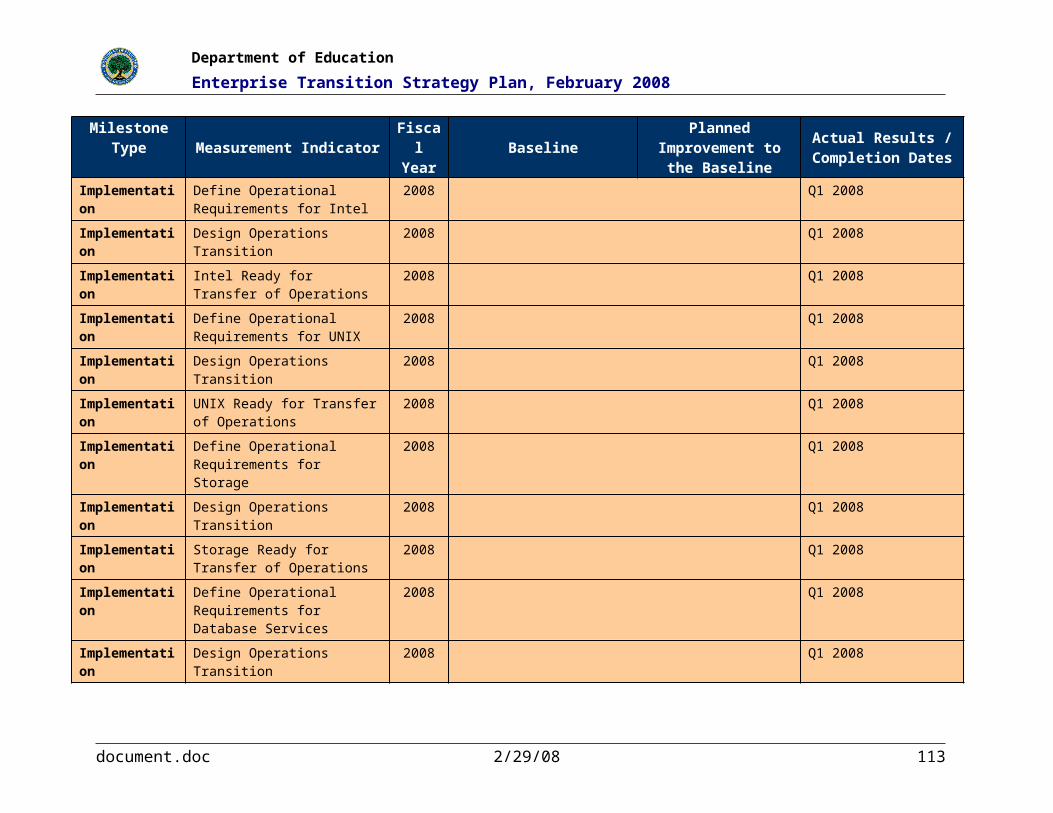
Department of Education
Enterprise Transition Strategy Plan, February 2008
MilestoneType Measurement Indicator
Fiscal
YearBaseline
Planned Improvement to the Baseline
Actual Results / Completion Dates
Performance Customer satisfaction rate with Web site.
2010 A customer satisfaction survey was not competed prior to FY2005, so it is not possible to identify a customer satisfaction baseline at this time. The survey will be conducted in FY2005 and will serve as the baseline for the project.
Maintain at least a 70.05% customer satisfaction rating (this performance goals is based on industry best practices as identified by the American Customer Satisfaction Index for Web sites).
December 2010
Performance Percentage of new content in areas of information mandated by legislation available to the public.
2010 Only a limited degree of full text material was available to the public at the end of FY2004.
100% of full text material will be available to the public in FY 2006.
December 2010
Performance Average amount of time to enter a journal into the database after publication.
2010 6 to 9 months was the average amount of time to enter a journal into the database after publication during FY2004.
3 weeks December 2010
Performance Percentage of time the online system (website, database, and search engine) is available to the public.
2010 98% This baseline is only based on one month of data – September 2004.
99.50% December 2010
Performance Customer satisfaction rate with Web site.
2011 A customer satisfaction survey was not competed prior to FY2005, so it is not possible to identify a customer satisfaction baseline at this time. The survey will be conducted in FY2005 and will serve as the baseline for the project.
Maintain at least a 70.05% customer satisfaction rating (this performance goals is based on industry best practices as identified by the American Customer Satisfaction Index for Web sites).
December 2011
Performance Percentage of new content in areas of information mandated by legislation available to the public.
2011 Only a limited degree of full text material was available to the public at
100% of full text material will be available to the public in FY2006.
December 2011
document.doc 2/29/08 113
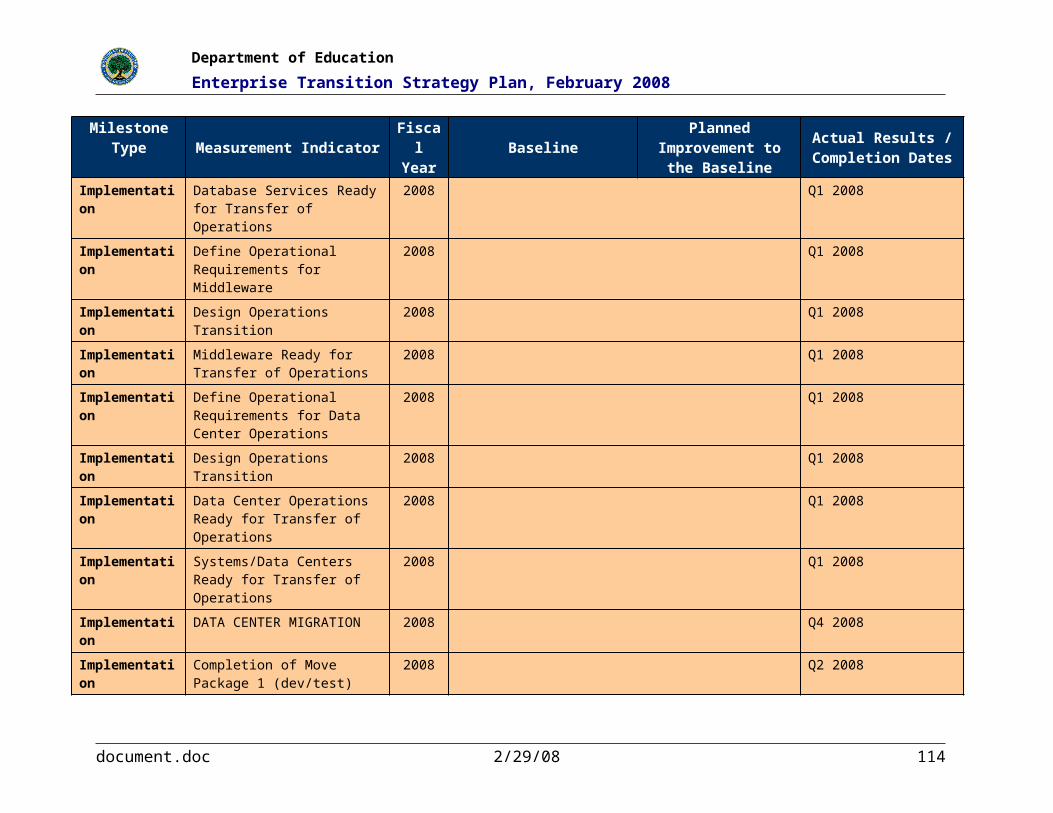
Department of Education
Enterprise Transition Strategy Plan, February 2008
MilestoneType Measurement Indicator
Fiscal
YearBaseline
Planned Improvement to the Baseline
Actual Results / Completion Dates
the end of FY2004.
Performance Average amount of time to enter a journal into the database after publication.
2011 6-to-9 months was the average amount of time to enter a journal into the database after publication during FY2004.
3 weeks December 2011
Performance Percentage of time the online system (website, database, and search engine) is available to the public.
2011 98%; This baseline is only based on one month of data – September 2004.
99.50% December 2011
7.15 ID Access Control (EDSTAR) Milestones
The following table (Table 44) defines the milestones for ID Access Control (EDSTAR), providing measurement indicators, fiscal year of milestones, baselines, planned improvements, and actual results/completion dates:
Table 44: ID Access Control (EDSTAR) Milestones
MilestoneType Measurement Indicator
Fiscal
YearBaseline
Planned Improvement to the Baseline
Actual Results / Completion Dates
Implementation
Implementation of ID Access Control (EDSTAR).The system is in full production (started in Q4 2007); performance metrics through FY2007 have been achieved.
2004 Q4 FY2007
Performance Department of Education (ED) staff and contractors processed for PIV I.
2007 30% 50% 80% completed by Q1 FY2008
Performance Department of Education Staff and Contractors issued HSPD-12 compliant ID cards/badges.
2008 50% 75% by Q3100% by Q4
TBD
Performance Issuance of HSPD-12 compliant ID cards/badges within 90 calendar days
2009 75% 25% to have 100% compliance by end of fiscal year
TBD, Q1 FY2009
document.doc 2/29/08 114

Department of Education
Enterprise Transition Strategy Plan, February 2008
MilestoneType Measurement Indicator
Fiscal
YearBaseline
Planned Improvement to the Baseline
Actual Results / Completion Dates
of new employee and/or contractor entrance on duty
Performance Issuance of HSPD-12 compliant ID cards/badges within 90 calendar days of new employee and/or contractor entrance on duty.
2010 100% Maintain 100% TBD, Q1 FY2010
Performance Issuance of HSPD-12 compliant ID cards/badges within 90 calendar days of new employee and/or contractor entrance on duty.
2011 100% Maintain 100% TBD, Q1 FY2011
Performance Number of security breaches in Department buildings.
2007 0 Maintain 0 Q4 FY2007, 0 security breaches
Performance Number of security breaches in Department Buildings.
2008 0 Maintain 0 Results Q4 FY2008
Performance Number of security breaches in Department Buildings.
2009 0 Maintain 0 Results Q4 FY2009
Performance Number of security breaches in Department Buildings.
2010 0 Maintain 0 Results Q4 FY2010
Performance Number of security breaches in Department Buildings.
2011 0 Maintain 0 Results Q4 FY2011
Performance Percentage of time the security system is available.
2007 100% availability Maintain 100% 100% – Q1 FY2007
Performance Percentage of time security system is available.
2008 100% availability Maintain 100% Results Q4 FY2008
Performance Percentage of time security system is available.
2009 100% Maintain 100% Results Q4 2009
Performance Percentage of time security system is available.
2010 100% Maintain 100% Results Q4 2010
Performance Percentage of time security system is available.
2011 100% Maintain 100% Results Q4 2011
document.doc 2/29/08 115

Department of Education
Enterprise Transition Strategy Plan, February 2008
MilestoneType Measurement Indicator
Fiscal
YearBaseline
Planned Improvement to the Baseline
Actual Results / Completion Dates
Performance Upgraded card readers and access control systems for HSPD-12 compliant ID cards/badges.
2008 70% 30% to reach 100% 70% completed as of Q2 FY2008100% by Q4 FY2008
Performance Maintenance and operation of HSPD-12 compliant hardware (enrollment stations, readers, etc.).
2009 70% 100% Results Q4 FY2009
Performance Maintenance and operation of HSPD-12 compliant hardware (readers, etc.).
2010 100% Maintain 100% Results Q4 FY2010
Performance Maintenance and operation of HSPD-12 compliant hardware (readers, etc.).
2011 100% Maintain 100% Results Q4 FY2011
7.16 EDEN Milestones
The following table (Table 45) defines the milestones for EDEN, providing measurement indicators, fiscal year of milestones, baselines, planned improvements, and actual results/completion dates:
Table 45: EDEN Milestones
MilestoneType
Measurement IndicatorFiscal Year
BaselinePlanned Improvement
to the BaselineActual Results / Completion
Dates
Implementation Implement EDEN and Go Live 2007 Q4 FY2007
Performance Average score on year-end annual partner satisfaction survey.
2008 FY2006 Partner Satisfaction Survey Score.
Maintain or improve on score of better than very satisfied.
To be determined by survey conducted by third party after end of FY2007.(Note: This survey requires OMB clearance, as well as approval from other offices in ED, so data collection can be delayed to another quarter).
Performance Average score on year-end annual partner satisfaction survey.
2009 FY2007 Partner Satisfaction Survey Score
Maintain or improve on score of better than very satisfied
TBD, Q2 FY2009
Performance Average score on year-end 2010 FY2007 Partner Satisfaction Maintain or improve on TBD, Q2 FY2010
document.doc 2/29/08 116

Department of Education
Enterprise Transition Strategy Plan, February 2008
MilestoneType
Measurement IndicatorFiscal Year
BaselinePlanned Improvement
to the BaselineActual Results / Completion
Dates
annual partner satisfaction survey.
Survey Score score of better than very satisfied
Performance Average speed to answer inbound calls from SEA partners during hours of operation. (Data is collected daily and reported at the end of each week.)
2007 As of October 20, 2006, 4 seconds.
Maintain 4 seconds or better
4 seconds – 8/10/2007
Performance Average speed to answer inbound calls from State partners during hours of operation.
2008 July 2007, 5 seconds within queue.
20 seconds to answer the phone
Q4, 2008 (Metrics are collected weekly and reported monthly by the 15th.) As of 1/20/2008: 7 seconds
Performance Average speed to answer inbound calls from State partners during hours of operation.
2009 To be determined based on prior year results.
Minimum of 50% of calls in queue within 60 seconds, others (voice mail) within 5 minutes.
Q4 FY2009 (Metrics are collected weekly and reported monthly by the 15th.)
Performance Average speed to answer inbound calls from State partners during hours of operation.
2010 To be determined based on prior year results.
Minimum of 50% of calls in queue within 60 seconds, others (voice mail) within 5 minutes.
Q4 FY2010 (Metrics are collected weekly and reported monthly by the 15th.)
Performance EDEN Knowledge Management compliance with ED's policies, directives, and federal acts and statutes that govern records management.
2007 Baseline established for 10/1/2005 to 3/31/2006: 93.5%
100% compliant. Due to contract change, data will be available April and September
96% – April 2007
Performance EDEN Knowledge Management compliance with ED's policies, directives, and federal acts and statutes that govern records management.
2008 96% Compliance 100% compliant Q4 FY2008
Performance EDEN Knowledge Management compliance with ED's policies,
2009 100% Compliance Maintain 100% Compliance
TBD, Q4 FY2009
document.doc 2/29/08 117

Department of Education
Enterprise Transition Strategy Plan, February 2008
MilestoneType
Measurement IndicatorFiscal Year
BaselinePlanned Improvement
to the BaselineActual Results / Completion
Dates
directives, and federal acts and statutes that govern records management.
Performance EDEN Knowledge Management compliance with ED's policies, directives, and federal acts and statutes that govern records management.
2010 100% Compliance Maintain 100% Compliance
TBD, Q4 FY2010
Performance Reduction in State Education Agency data transmission problems [LEAD003].
2008 The current running average for October 1 through July 31, 2007 is 51.32% success rate in transmissions for states. (The baseline will be the average for the entire fiscal year, but can't be completed until after September 30.)
Improvement of 5% annual average success rate over prior fiscal year.
Q4 FY2008 (A running average is reported monthly through the end of the prior month. (Report LEAD003 is available online with user selected time period that can run through the current day and time.)
Performance Reduction in State Education Agency data transmission problems [LEAD003].
2009 To be determined based on prior year results.
Improvement of 5% annual average success rate over prior fiscal year.
Q4 FY2009 (A running average is reported monthly through the end of the prior month. (Report LEAD003 is available online with user selected time period that can run through the current day and time.)
Performance Reduction in State Education Agency data transmission problems [LEAD003]
2010 To be determined based on prior year results.
Improvement of 5% annual average success rate over prior fiscal year.
Q4 FY2010 (A running average is reported monthly through the end of the prior month. (Report LEAD003 is available online with user selected time period that can run through the current day and time.)
Performance Percentage of critical trouble tickets closed or with an action plan to fix in three days.
2008 95% were closed or had an action plan within 3 days for FY 2007
Maintain or improve upon 95% closure/plan rate.
Q4 FY2008 (Metrics are collected monthly and reported monthly by the 15th)
document.doc 2/29/08 118
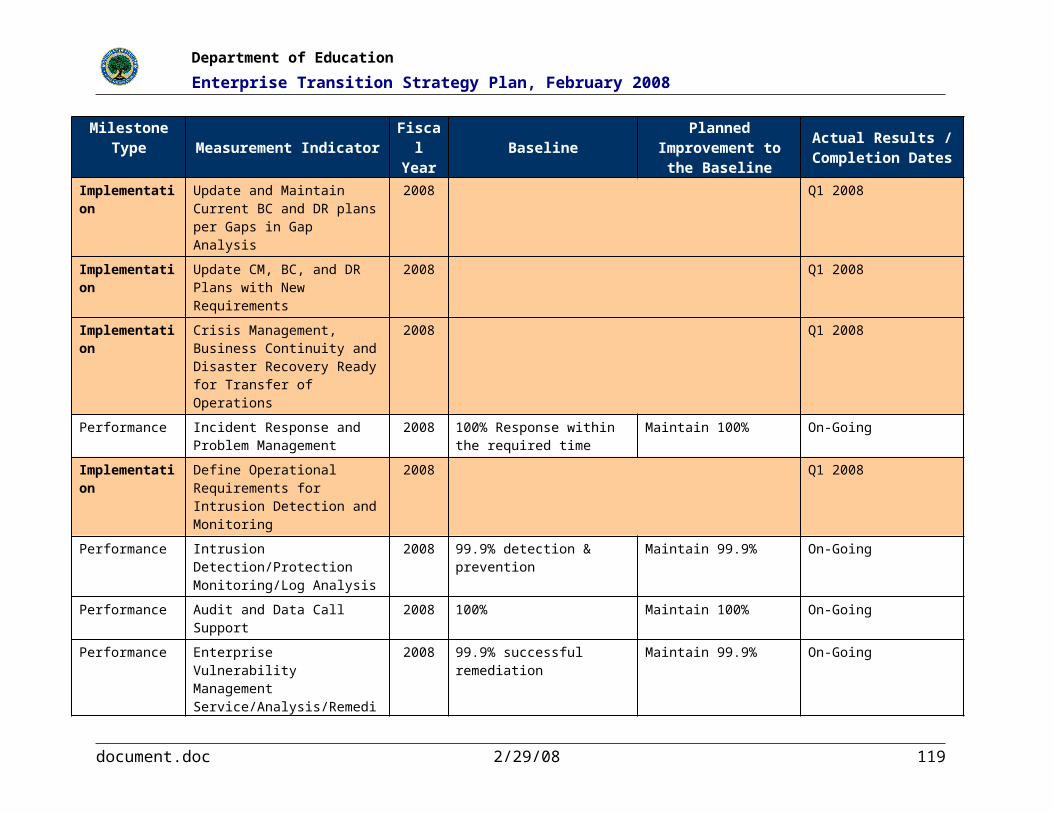
Department of Education
Enterprise Transition Strategy Plan, February 2008
MilestoneType
Measurement IndicatorFiscal Year
BaselinePlanned Improvement
to the BaselineActual Results / Completion
Dates
Performance Percentage of critical trouble tickets closed or with an action plan to fix in three days.
2009 To be determined based on prior year results.
Maintain or improve upon 95% closure/plan rate.
Q4 FY2009 (Metrics are collected monthly and reported monthly by the 15th)
Performance Percentage of critical trouble tickets closed or with an action plan to fix in three days.
2010 To be determined based on prior year results.
Maintain or improve upon 95% closure/plan rate.
Q4 FY2010 (Metrics are collected monthly and reported monthly by the 15th)
Performance Aggregate state capability for submissions by school year (SY) [LEAD006]
2007 In FY 2006, capabilities were: SY 03-04: 67%; SY 04-05: 73%; SY 05-06: 83%
3% over prior SY SY 06-07: 92%, as of 8/21/2007.
Performance Percent states submitting only through EDEN by collection. (Collection due dates and certification are determined by Program Offices.)
2007 10/06 CRDC 100%; July 2006: 1810-0614: 100%; 1820-0517: 46.2%; 1820-0043:46.2%; 1820-0521: 12.6%
100% for collections by 11/1/2007, excluding 2-year extension exceptions approved by the Secretary.
1820-0043, 65.4%; 1820-0517, 61.5%; 1820-0521, 63.5%. EASIE collection 100%. Title III Biennial Report 100%. CCD 100% – as of July 07:
Implementation Produce a data mart for administration of the EDFacts program by PIMS (responsible for administering the EDFacts program) providing the capability to create unlimited ad hoc reports.
2009 Q4 FY2009
Performance EDFacts reports response time from a cross-section of reports.
2009 To be determined based on prior year results.
Not to exceed 30 seconds average response time across reports.
Q4 FY2009 (Results to be reported by the 15th of each month)
Performance EDFacts reports response time from a cross-section of reports.
2010 To be determined based on prior year results.
Not to exceed 30 seconds average response time across reports.
Q4 FY2010 (Results to be reported by the 15th of each month)
7.17 MSIX Milestones
The following table (Table 46) defines the milestones for MSIX, providing measurement indicators, fiscal year of milestones, baselines, planned improvements, and actual results/completion dates:
document.doc 2/29/08 119

Department of Education
Enterprise Transition Strategy Plan, February 2008
Table 46: MSIX Milestones
MilestoneType
Measurement IndicatorFiscal Year
BaselinePlanned Improvement
to the BaselineActual Results/Completion
Dates
Implementation Nationwide Deployment 2007 Q4 FY2007
Performance Percentage of states that can track migrant student data via MSIX.
2007 0% 25% Based on the 9 states that participated in the pilots, 100% could track student data during the pilot period. The system will not be fully operational until the end of September 2007.
Performance Average number of days for SEAs to report migrant student data to MSIX.
2008 7 days 4 days Actual results will be reported at the end of FY2008.
Performance Average number of hours for the Department to produce nationwide migrant child counts.
2007 160 hours 2 hours Actual results will be available for reporting after implementation FY2008.
Performance Average number of hours per SEA to produce statewide migrant child counts.
2008 30 Hours 22.5 Hours Actual Results will be reported at the end of FY2008.
Performance Average number of hours per SEA to produce statewide migrant child counts.
2009 22.5 Hours 19 Hours Actual results will be reported at the end of FY2009.
Performance Average number of hours per SEA to produce statewide migrant child counts.
2010 19 Hours 16 Hours Actual results will be reported at the end of FY2010.
Performance Average number of hours per SEA to produce statewide migrant child counts.
2011 16 Hours 13 Hours Actual results will be reported at the end of FY2011.
Performance Percentage of States with improved data reliability, quality and standardization.
2007 25% 50% Q4 2007 – 50% of states have improved data quality due to the special assistance the MSIX team provides to states to improve their data transmission capabilities.
Performance Percentage of States with improved 2008 50% 100% Actual results will be reported
document.doc 2/29/08 120
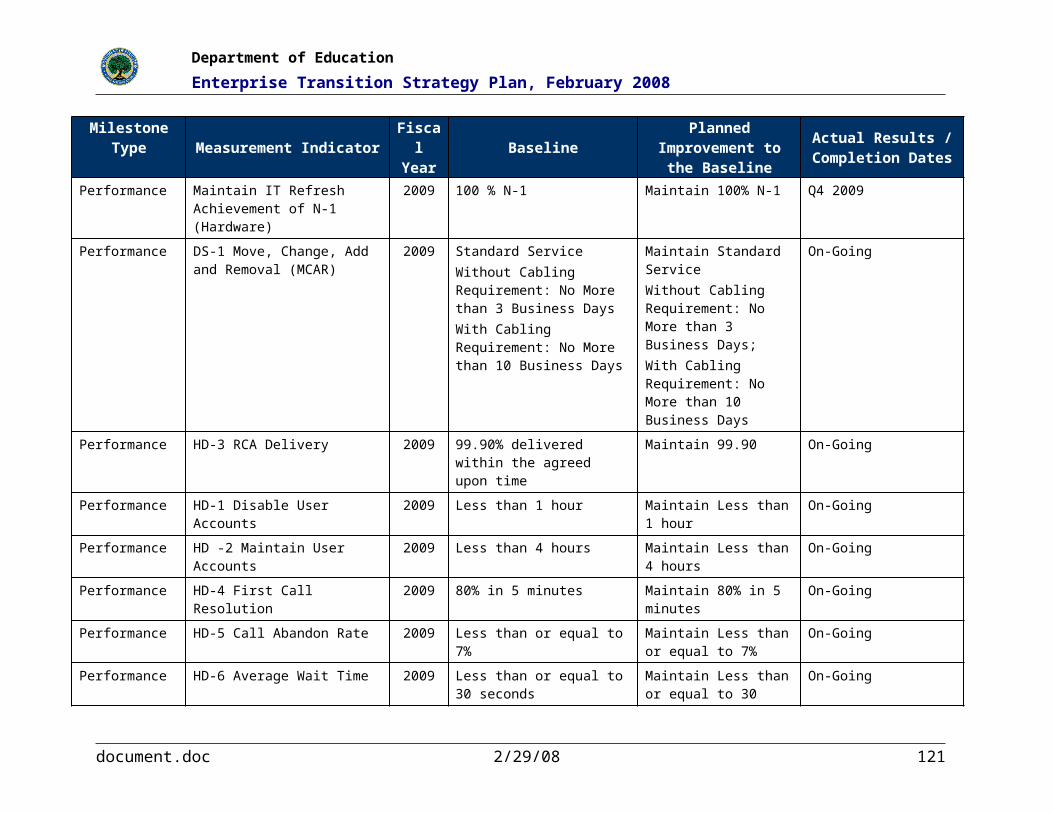
Department of Education
Enterprise Transition Strategy Plan, February 2008
MilestoneType
Measurement IndicatorFiscal Year
BaselinePlanned Improvement
to the BaselineActual Results/Completion
Dates
data reliability, quality and standardization
at the end of FY08.
Performance Number of states using the same data standards to achieve improved data reliability, quality, and standardization.
2007 0 States 8 States Q4 2007 - 25 states have improved data quality due to the special assistance the MSIX team provides to states to improve their data transmission capabilities.
Performance Number of states using the same data standards to achieve improved data reliability, quality, and standardization.
2008 25 States 30 States Actual results will be reported at the end of FY08.
Performance Number of states reporting improved data reliability, quality, and standardization from MSIX.
2009 0 States 25 States Actual results will be reported at the end of FY09.
Performance Number of states reporting improving data reliability, quality, and standardization from MSIX.
2010 25 States 35 States Actual results will be reported at the end of FY10.
Performance Number of states reporting improving data reliability, quality, and standardization from MSIX
2011 35 States 45 States Actual results will be reported at the end of FY11.
Performance Percentage of MSIX Help Desk Issues that are resolved.
2008 0% 100% Actual results will be reported at the end of FY08.
Performance Percentage of MSIX Help Desk Issues that are resolved.
2009 100% Maintain 100% Actual results will be reported at the end of FY09.
Performance Percentage of MSIX Help Desk Issues that are resolved.
2010 100% Maintain 100% Actual results will be reported at the end of FY10.
Performance Percentage of MSIX Help Desk Issues that are resolved.
2011 100% Maintain 100% Actual results will be reported at the end of FY11.
Performance Percentage of help desk problems that are resolved in one business day.
2009 0% 50% Actual results will be reported at the end of FY09.
Performance Percentage of help desk problems 2010 50% 75% Actual results will be reported
document.doc 2/29/08 121

Department of Education
Enterprise Transition Strategy Plan, February 2008
MilestoneType
Measurement IndicatorFiscal Year
BaselinePlanned Improvement
to the BaselineActual Results/Completion
Dates
that are resolved in one business day. at the end of FY10.
Performance Percentage of help desk problems that are resolved in one business day.
2011 75% 90% Actual results will be reported at the end of FY11.
Performance System Uptime is 99.5% after deployment of MSIX except for periods of routine maintenance.
2009 99.5% Availability 99.5% Availability Actual results will be reported at the end of FY09.
Performance System Uptime is 99.5% after deployment of MSIX except for periods of routine maintenance.
2010 99.5% Availability 99.5% Availability Actual results will be reported at the end of FY10.
Performance System Uptime is 99.5% after deployment of MSIX except for periods of routine maintenance.
2011 99.5% Availability 99.5% Availability Actual results will be reported at the end of FY11.
Performance The number of States that reported results for reading proficiency of elementary school migrant students.
2008 45 47 Actual results will be reported at the end of FY08.
Performance The number of States that reported results for reading proficiency of middle school migrant students.
2008 45 47 Actual results will be reported at the end of FY08.
Performance The number of States that reported results for mathematics proficiency of elementary school migrant students.
2008 45 47 Actual results will be reported at the end of FY08.
Performance The number of States that reported results for mathematics proficiency of middle school migrant students.
2008 45 47 Actual results will be reported at the end of FY08.
Performance The number of States meeting an annually set performance target in reading at the elementary school level for migrant students.
2008 20 22 Actual results will be reported at the end of FY08.
Performance The number of States meeting an annually set performance target in reading at the middle school level for migrant students.
2008 21 23 Actual results will be reported at the end of FY08.
document.doc 2/29/08 122
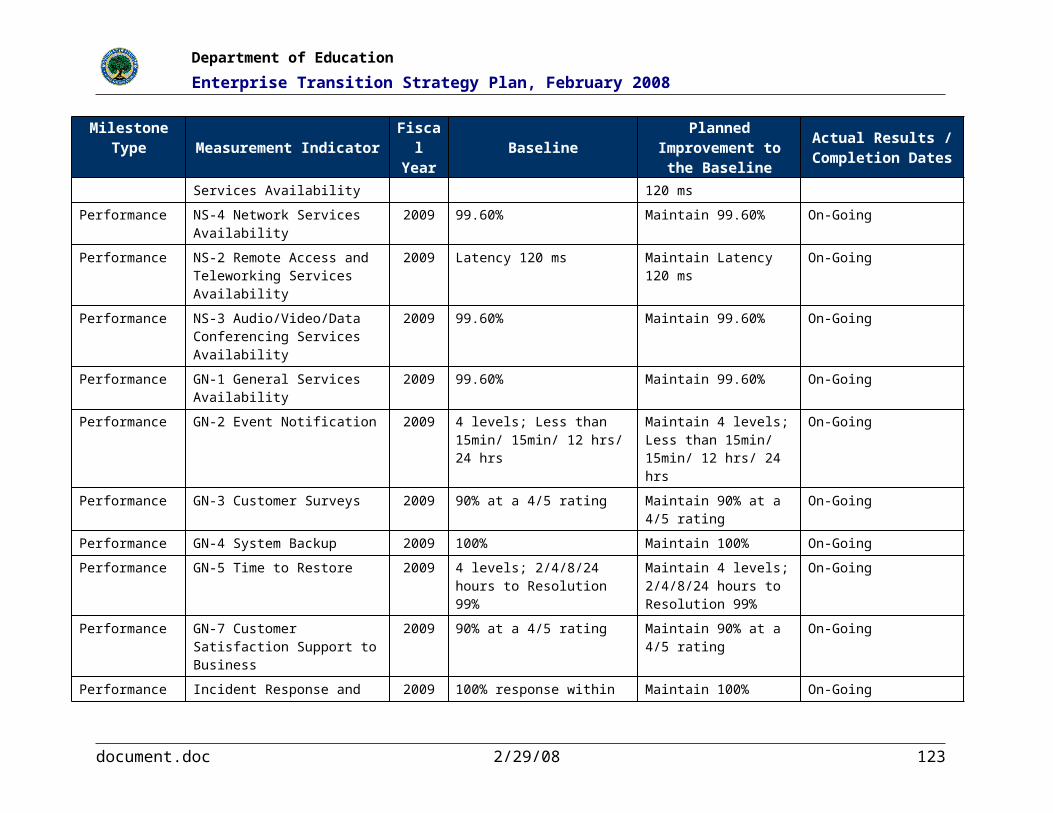
Department of Education
Enterprise Transition Strategy Plan, February 2008
MilestoneType
Measurement IndicatorFiscal Year
BaselinePlanned Improvement
to the BaselineActual Results/Completion
Dates
Performance The number of States meeting an annually set performance target in mathematics at the elementary school level for migrant students.
2008 24 26 Actual results will be reported at the end of FY08.
Performance The number of States meeting an annually set performance target in mathematics at the middle school level for migrant students.
2008 18 20 Actual results will be reported at the end of FY08.
7.18 ED eGov Alignment Milestones
This section provides an overview of the Department of Education’s alignment and incorporation of Federal eGov Initiatives and status, including specific status information and upcoming milestones (where appropriate). The following table (Table 47) describes the ED eGov Alignment Milestones and key next steps:
Table 47: ED eGov Alignment Milestones
PortfolioE-Gov
InitiativeED’s Investment
Alignment Status
Key Next Steps
G2C GovBenefits ADvance – Aid Delivery In progress Establish process to enter and maintain benefit eligibility programs on GovBenefits.gov (2Q06).
E-Loans ADvance – Aid Delivery Completed Ensure loan programs are accurately reflected on GovLoans Gateway.
G2B E-Rulemaking TBD TBD Convert paper-based docket processing to FDMS (3Q06). Migrate public comment system to E-Rulemaking (3Q06).
Federal Asset Sales
TBD TBD Consolidate / Migrate personal and real property reuse and disposal process to FAS (4Q06).
USA Services TBD TBD Identify Tier 1contact channels (email and toll free) and volume (1Q06).
Business Gateway
TBD TBD Provide report to OMB and Business Gateway identifying rules/regulations and related forms, and plain language guides that are not already contained in an existing on-line business compliance system (2Q06).
document.doc 2/29/08 123

Department of Education
Enterprise Transition Strategy Plan, February 2008
PortfolioE-Gov
InitiativeED’s Investment
Alignment Status
Key Next Steps
G2G Geospatial One-Stop
NCES Web Support Completed NCES continue to participate in the planning activities for posting metadata for geospatial data acquisitions in the GeoData.
Disaster Management
EDUCATE (EDNet) Completed Implement Common Alert Protocol (CAP) (4Q05). Implement Disaster Management Interoperability Services (DMIS) within identified Emergency Operations Center (EOC) (4Q05).
Grants.gov Grants Administration Payment System (GAPS) Peer Review Module FIPSE Dissemination and Grants Database GPOS Website
Completed Achieved 100% of discretionary application packages on Grants.gov as of Q2 FY2007.
IEE E-Training Interactive Job Aid TLN Technical Support
In Progress Migrate agency-specific Learning Management Systems to one of the 3 E-Training service providers (GoLearn, FasTrac, NTIS).
Recruitment One-Stop
HR Web Recruiting Completed Create interface to post and to receive information from USAJOBS.
EHRI ED currently outsources HR shared services to DOI/NBC.
Completed Adopt eOPF data standards (4Q07). Complete interfaces (4Q06). Complete workforce tools (4Q06). Provide Payroll Data File to EHRI (3Q06).
E-Travel Travel Management System Completed Integrate ED’s Travel Management Center with the eTS vendor (4Q06). Process travel vouchers through eTS vendor (4Q06). Decommission legacy system (2Q07). Enterprise-wide end-to-end e-Gov Travel solution went live on October 2, 2006.
Integrated Acquisition Environment
Contracts and Purchasing Support System (CPSS)
Completed Ongoing monitoring
document.doc 2/29/08 124
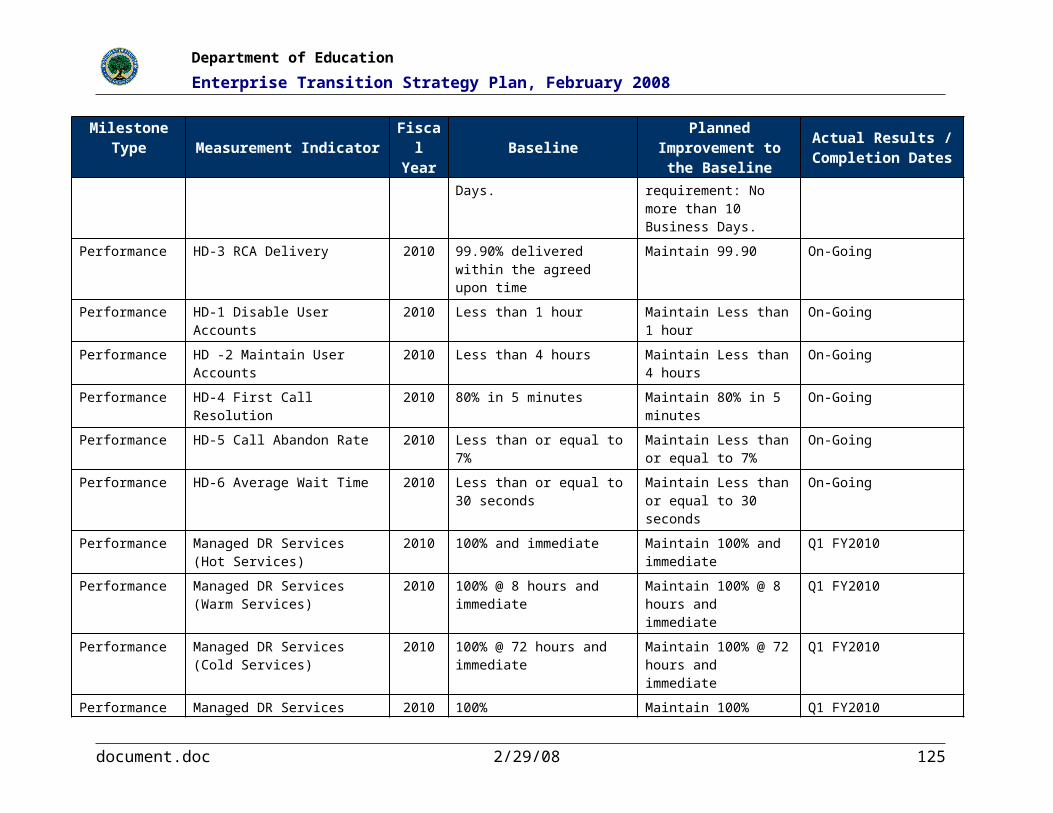
Department of Education
Enterprise Transition Strategy Plan, February 2008
PortfolioE-Gov
InitiativeED’s Investment
Alignment Status
Key Next Steps
E-Authentication E-Authentication
E-Authentication In Progress Implement E-Authentication service for FSA systems (2Q07). Implement e-Campus-based application into E-Authentication service for FSA systems (2Q08).
document.doc 2/29/08 125
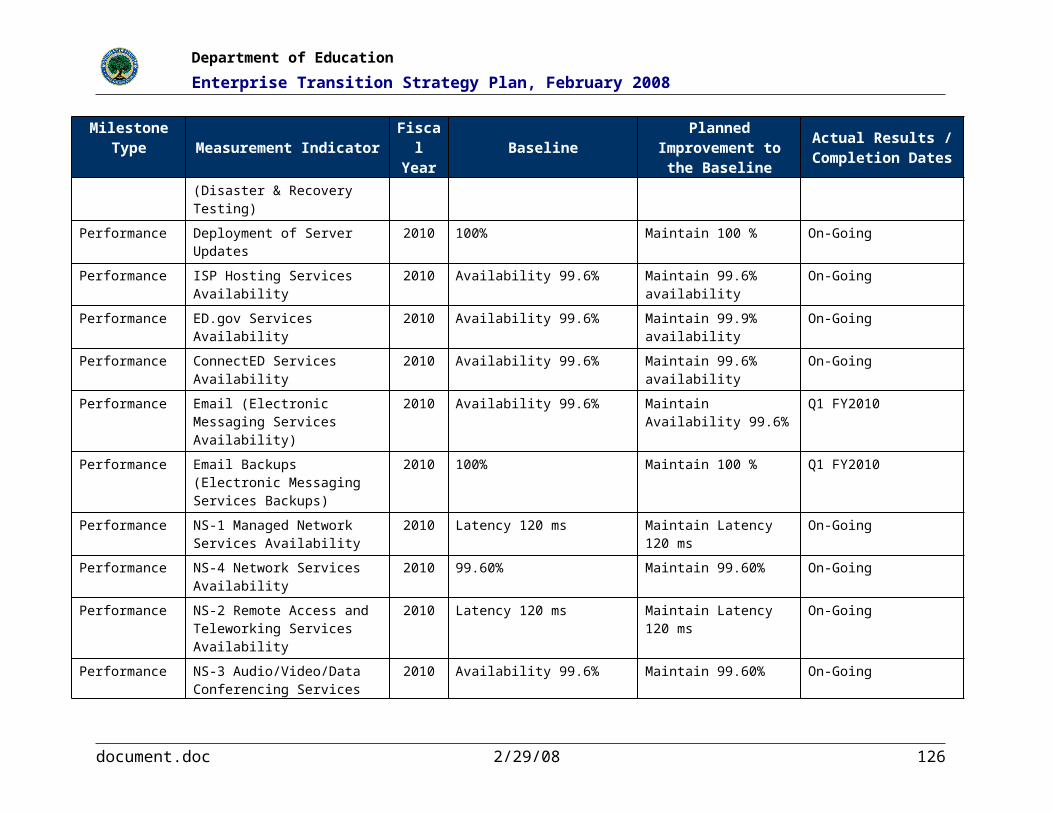
Department of Education
Enterprise Transition Strategy Plan, February 2008
7.18.1 Federal Transition Framework (FTF)
The Department of Education is actively incorporating the Federal Transition Framework (FTF), which encourages agencies to identify opportunities for reuse and collaboration for cross-agency Initiatives. ED is actively working to align relevant programs/initiatives to this Framework through its Enterprise Architecture Program.
The Department of Education is actively using the Federal Transition Framework to:
Determine the applicability and scope of cross-agency initiatives to ED.
Update the ED EA Program Plan to incorporate tasks to develop or update agency enterprise architecture work products.
Update the ED target enterprise architecture to reflect cross-agency initiatives.
Conduct gap analysis between current and target architecture to identify gaps in the current implementation of cross-agency initiatives.
Update the ED EA Transition Strategy to incorporate tasks, activities and milestones to close gaps between current and target architecture.
ED has reviewed the recently released Federal Transition Framework by OMB to identify gaps in cross-agency initiatives that are applicable to mission of the ED. Currently, the ED Target Enterprise Architecture includes the following cross-agency Initiatives and incorporates their business, data, service, technical, and performance components:
E-Travel
Grants Management Line of Business – the Department of Education will be a shared service provider
Grants.gov
HSPD-12
Human Resources Line of Business
Internet Protocol Version 6 (IPv6)
IT Infrastructure Optimization Line of Business
Financial Management Line of Business
Budget Formulation and Execution Line of Business – Managed by the Department of Education
E-Authentication
Geospatial One-Stop
Information Systems Security Line of Business
Additionally, the Department has incorporated the Transition Strategy and Timeline of eGov Initiatives into the ED Transition Strategy Plan.
The Department’s Enterprise Architecture Program will continue to work with ED agencies and business owners to align their IT investments to the cross-agency initiatives described in the FTF Service Catalog. This realignment will comply with the common structure developed to provide a common structure for the organization of cross-agency Initiative.
document.doc 2/29/08 126

Department of Education
Enterprise Transition Strategy Plan, February 2008
Figure 11 below graphically represents the structure of the Federal Transition Framework (FTF) Catalog:
Figure 11: Federal Transition Framework (FTF) Catalog Structure
document.doc 2/29/08 127

Department of Education
Enterprise Transition Strategy Plan, February 2008
8.0 MAJOR IT INVESTMENT RISK ASSESSMENT ANALYSIS ED IT Investments have identified risks and associated mitigation strategies. This information is continuously monitored and updated, and addressed cost, IT, performance, and dependencies.
Federal Student Aid is addressing risk in the following two ways (from FY2010 Investments and beyond):
1. Risk Management is being standardized across Federal Student Aid projects and investment, with the initiation of a multi-year Enterprise Risk Management initiative,
2. Federal Student Aid is adding new modules to its Enterprise Management Support System to automate and standardize the preparation of FY2010 Investments and to manage risks and mitigation strategies for investments. These new modules are currently expected to be deployed in mid-March 2008 and are consistent with the new Federal Student Aid Enterprise Risk Management initiative and Project Management Office guidelines.
A comprehensive listing of individual ED IT investment risks and mitigation strategies are provided in the table below (Table 48):
Table 48: ED IT Investment Risks and Mitigation Strategies
Area of Risk Description Strategy for Mitigation
IT Investment: CPSS
Reliability of Systems System might not be scaleable to meet increased traffic.
Test run the system for peak load handling capability before implementation
Life-Cycle Costs Inadequate funding in FY2009 will delay implementation of Phase III.
Adjust project timeline/ resource needs to reflect allocated amount.
IT Investment: FMSS
Reliability of Systems System might not be scaleable to meet increased traffic.
Test run the system for peak load handling capability before implementation.
Life-Cycle Costs Inadequate funding in FY2009 will delay implementation of Phase III.
Adjust project timeline/ resource needs to reflect allocated amount.
document.doc 2/29/08 128

Department of Education
Enterprise Transition Strategy Plan, February 2008
Area of Risk Description Strategy for Mitigation
IT Investment: NCES Web Support
Data / Info NCES data is the linchpin of the NCES website. Providing comprehensive and intuitive access is critical. The data contained within web-based data dissemination systems must be thoroughly reviewed before being publicly available to ensure consistent and accurate data dissemination.
Rleases are thoroughly reviewed by contractor subject matter experts. These releases then undergo a formal reviewed and approval by government subject matter experts and the NCES webmaster prior to production release.
Data / Info / Security Restricted use data sets must be protected and applications must minimize the risk of unauthorized use.
No restricted datasets are available online. Application releases go through a security audit as part of its NCES web standards review.
Technology
Data / Info
Overall systems engineering is not the responsibility of this contract. However the support of production applications is. Risk of application errors and incorrect data collection and dissemination exist in applications supported.
As part of the contractors CMMI Level 3 development process, applications are unit tested, system tested and independently verified prior to production release. Subsequent testing and bug reports are addressed at the highest priority and closely coordinated with NCES’s server engineering team.
Technology Technical problems/failures with applications and their ability to provide planned and desired technical functionality.
Significant application testing mitigates risk and CMMI QA processes. When possible, application data are compared to existing print publications.
Reliability of Systems / Security
Vulnerability of systems, websites, information and networks; risk of intrusions and connectivity to other systems; risk associated with the misuse (criminal/ fraudulent) of information.
Data in dissemination systems managed by this contract are public use data sets and data are publicly available.
Organizational and Change Management
Objectives of the project could possibly be not clearly linked to program needs, to the agency’s overall strategies, and to government-wide policies and standards.
Tasks within this contract are dictated and managed by applicable program managers. Tasks are reviewed on a monthly basis both at the program and financial level to ensure continued viability and conformity to department and program strategy, policy and standards.
Reliability of Systems System might not be scaleable to meet increased traffic.
Mitigation Strategy: Test run the system for peak load handling capability before implementation.
Life-Cycle Costs Inadequate funding in FY2009 will delay implementation of Phase III.
Adjust project timeline/ resource needs to reflect allocated amount.
document.doc 2/29/08 129

Department of Education
Enterprise Transition Strategy Plan, February 2008
Area of Risk Description Strategy for Mitigation
IT Investment: CPSS
Reliability of Systems Equipment move out of ED Data Center may cause major disruption of EDCAPS services.
Accept risk and do an impact assessment and plan for change once risk occurs
IT Investment: IPEDS
Reliability of Systems System might not be able to meet increased server traffic during peak periods.
Looking into staggering due dates to spread out usage over a longer time period
Data / Info There is a possibility of more data items being added to the IPEDS data collection.
Try to anticipate changes and have a long lead-time for implementation.
IT Investment: NAEP
Reliability of Systems System might not be scaleable to meet increased traffic.
Test run the system for peak load handling capability before implementation.
Life-Cycle Costs Inadequate funding in FY2009 will delay implementation of required development and support for FY2009 NAEP Reading and Math assessment activities.
Adjust project timeline/ resource needs to reflect allocated amount
Technology Technology changes may impact current development efforts and result in unanticipated errors with applications.
Monitor current technology trends and update testing lab to evaluate impacts of changes on current development.
IT Investment: TMS
Reliability of Systems System might not be scaleable to meet increased traffic.
Test run the system for peak load handling capability before implementation.
Life-Cycle Costs Inadequate funding in FY2009and future budget years will impact the operation and maintenance of the system.
Prepare strong business case to support funding requests.
Organizational and Change Management
E2 system is not accepted by ED staff.
On-going Training on E2 to ensure staff understanding and functionality of application.
Dependencies and Interoperability Between This and Other Investments
E2 system is not hosted by ED therefore, immediate resolution for system issues will not be handled timely
SLAs will be used to measure performance.
E2 is a multi-agency system. Fixes, enhancements and builds may not adequately be tested before release to Production.
SLAs will be used to measure performance.
document.doc 2/29/08 130

Department of Education
Enterprise Transition Strategy Plan, February 2008
Area of Risk Description Strategy for Mitigation
IT Investment: ERIC
Reliability of Systems System might not be scaleable to meet increased traffic.
Monitor system utilization and add additional hardware to handle the increase in volume.
Technology Bandwidth might not be scalable to meet increased traffic.
Monitor bandwidth utilization and add additional capacity to handle the increase in volume.
IT Investment: EDEN (EDFacts)
Dependencies and Interoperability Between This and Other Investments
If EDEN (EDFacts) does not complete reporting capabilities needed by Program Offices and other users, the program will not succeed.
This risk is currently being mitigated by the capabilities being provided through 2.2.1.3.2 Construct Metadata Tool, 2.2.1.4.2 Construct EDFacts.
Data / Info If EDEN (EDFacts) does not acquire adequate K-12 data, through merging of Department collections and by an acceptable percentage of submissions from State Education Agencies, EDFacts reporting will not be useful to Program Offices and other users, and the program will not succeed.
This risk is being mitigated in three steps.
1) Issued regulations require mandatory submission through EDEN (EDFacts);
2) Mitigated by merging additional data collections into EDEN, 2.2.1.5 EDEN-CCD Merger, 2.2.2.1 Indian ED Survey, 2.2.2.2 EASIE, 2.3.11.1.1 Conduct CSPR & T3, 2.3.11.1.3 CSPR SY 06-07;
3) Use of a transition plan by states to focus on providing prioritized data to ensure the most important information is provided first.
IT Investment: MSIX
Life-Cycle Costs States may not have the resources and/or technical needs to support the preparation of their technical interfaces.
MSIX will secure additional funding to assist the states with preparing their technical interfaces.
Project Resources Demand on ED Management Resources.
Efficient planning and scheduling to achieve productivity with limited resources. Implementation of COTS will ensure that contract services are available to support the MSIX Project.
Technology Reliance on technical interfaces with other systems.
MSIX Pilots and National Rollout will demonstrate the functionality between MSIX and the state migrant information systems.
Risk of Creating a Monopoly For Future Procurements
Reliance on sunsetting technologies to implement MSIX can prevent the system from meeting its future requirements.
Outsourcing services including a hosting environment and use of COTS will help to mitigate this potential issue.
document.doc 2/29/08 131

Department of Education
Enterprise Transition Strategy Plan, February 2008
Area of Risk Description Strategy for Mitigation
Technology Use of new, untested technology to provide MSIX Solution.
MSIX System must be approved by the ED PIRWG and new and/or untested technologies must be tested during the ED Security C&A Process.
Data/Info Incomplete or inaccurate data or data are misused. This would result in an increased burden on migrant community for data collection.
Information collection notice should be posted online along with the details associated with the minimum data elements (MDEs).
Life-Cycle Costs Lifecycle cost estimates are inaccurate due to inaccurate IGCE, ineffective planning, or project scope creep.
There should be a change control process to monitor and govern and authorize project changes. CCB Activities were implemented during April 2007.
Reliability of Systems MSIX Standard Maintenance Window conflicts with the state data upload window, which could result in data being lost or not transmitted from states to MSIX.
The MSIX Project Team should address maintenance windows and clarify for the states when maintenance is being done so there will be no conflicts.
Surety (Asset Protection) Considerations
Impact of loss, damage or theft ad the adequacy of physical protection, continuity of operations, and disaster recovery plans.
Execute a contract for backup facility for MSIX. C&A will ensure that backup facility operations are taken into account as a part of the security process.
Reliability of Systems/Security
Vulnerability of system to intrusions and connectivity to other systems.
Ensure that MSIX successfully completes the C&A Process and that MSIX Project Team Members have the appropriate security clearances
Risk of Creating a Monopoly For Future Procurements
Dependence on a single vendor or product can lead to government being reliant on a specific vendor/product.
MSIX is designed around a COTS Solution with minimal customization so that ED should be able to acquire future contract services to support the MSIX System.
Technology Technical problems with products that affect the ability to provide planned functionality.
The project should use pilots and prototypes to demonstrate the future functionality of the MSIX System. Two pilots were planned and implemented for MSIX.
Business Turnover of key contractor personnel.
Contractor should provide advanced notice to ED regarding key personnel replacement and their staffing plan and Personnel Roster should be updated when staff members change. This should be forwarded to ED when changes are made.
document.doc 2/29/08 132

Department of Education
Enterprise Transition Strategy Plan, February 2008
Area of Risk Description Strategy for Mitigation
IT Investment: G5
Reliability of Systems EDUCATE data center move may cause disruption to development schedule because of system unavailability.
Accept risk and do an impact assessment and plan for change once risk occurs.
Network or system outages in the development, testing, production or training environments will affect Integration Contractor’s ability to meet project milestones.
Accept risk and do an impact assessment and plan for change once risk occurs.
IT Investment: E-Authentication
Security Changes in OMB/GSA security focus, guidance and fees could adversely impact existing and planned authentication guidelines, requirements, and implementation plans.
Continued analysis of authentication and security policy changes and decisions as part of the developmental process rather than being a recipient of it. Uniform framework and technical policies across ED to preclude multiple sources of risk and inconsistency.
Reliability of Systems EDUCATE vehicle capabilities and ability to ensure that interoperable standards and technical capabilities are in place, kept current with government wide needs and enable flexible integration of constituency required or regulatory authentication standards. Lack of credential acceptance and uniform policies may impact, delay or make inoperable various key systems across ED.
Integrate EDUCATE team into process and provide framework and Concept of Operations to contractor for this vehicle to ensure that requirements are defined and enabled by the EDUCATE contractor.
IT Investment: Data Warehouse
Reliability of Systems System might not be scaleable to meet increased traffic.
Research should an enhancement be needed for additional users added.
Life-Cycle Costs Availability of future funding to continue operations and maintenance.
EDW will be transitioned to EDUCATE, which will provide hosting and management services. EDUCATE is fully funded.
document.doc 2/29/08 133

Department of Education
Enterprise Transition Strategy Plan, February 2008
9.0 IPV6 TRANSITION STRATEGY AND MILESTONES
OMB has directed the Department to implement Internet Protocol Version 6 (IPv6) within its core network backbone infrastructure by June 2008. On November 18, 2007, the U.S. Department of Education (ED) successfully fulfilled the requirements of OMB Memorandum M-05-22. In conjunction with contractor, vendor, and service provider personnel, the U.S. Department of Education (ED) successfully exchanged IPv6 traffic across the network core and with an external partner. The results of these demonstrations are documented in “U.S. Department of Education (ED) IPv6 Demonstration Plan and Results” which is consistent with the requirements of the CIO Council Demonstration Plan.
The following figure (Figure 12) shows a high level architecture of the Education Network.
Figure 12: ED’s High-level Network Architecture
The CIO Council plan states that:
“For the purposes of the IPv6 transition, the core network (a.k.a., backbone network) is the set of network transport devices (routers, switches) that provide the highest level of traffic aggregation in the network, and thus at the highest level of hierarchy in the network.”
document.doc 2/29/08 134

Department of Education
Enterprise Transition Strategy Plan, February 2008
The Department of Education has defined that the Gigabit Ethernet LAN located in the Education Data Center (EDC) as the Agency “core network” for the purpose of the IPv6 demonstrations. Specifically, the Department of Education has added IPv6 addressing to VLAN 11. VLAN 11 spans two Cisco 6513 multi-layer switches within the data center. VLAN 11 will include the three Windows XP workstations used as the demonstration test points.
Sprint acted as the external partner for the demonstration. The Sprint IPv6 Internet will be used as the external network. Sprint will use the sprintv6.net webserver as the external test point. The Department of Education demonstration architecture is illustrated in Figure 13 below.
Figure 13: ED’s Demonstration Architecture
Further details and demonstration results can be found in the U.S Department of Education’s IPv6 Demonstration Plan and Results document attached with this submission.
Implementing IPv6 represents a strategic opportunity for the Department to provide improved services with greater efficiency. IPv6 is an enabling technology that can be used to support a number of the Department’s business capability requirements, which in turn are aligned with the Department’s Strategic Goals.
document.doc 2/29/08 135
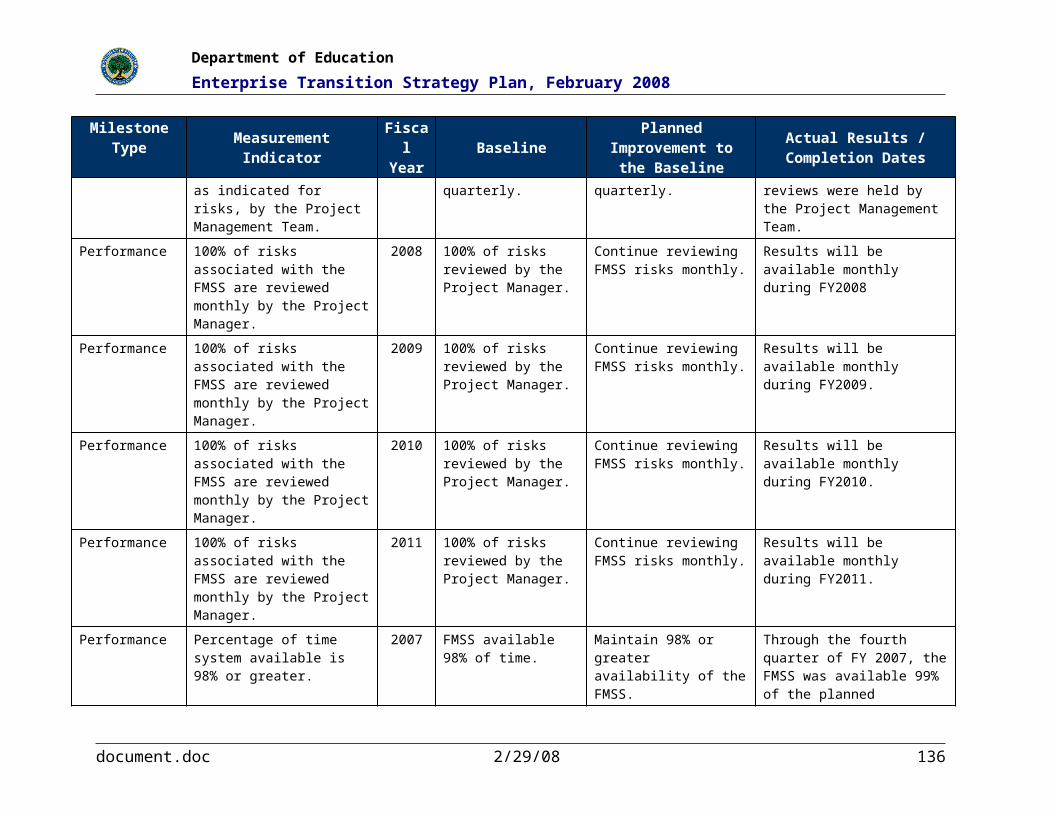
Department of Education
Enterprise Transition Strategy Plan, February 2008
The following table (Table 49) summarizes the key features of IPv6 and the Department business capabilities supported by these features:
Table 49: IPv6 Features and Supported Business Capabilities Requirements in LOBs
IPv6 Feature SupportedBusiness Capabilities Requirements Description
A larger address space
IPv6 provides a virtually limitless address space thereby overcoming limitations of the current IPv4-based infrastructure. ED has the opportunity to network-enable new types of IT assets, such as remote sensors, handheld computing devices, mobile phones, and other devices with individual and unique IP addresses. This will enable direct end-to-end connectivity between IP-enabled devices and systems.
Information Dissemination LOB
Information Clearinghouse
Data storage management and network facilities
Administration LOBIT-business alignment and IT support and EA governance
Common enabling services
Administration LOBFacilities and security services
Efficient, reliable facility services
Safe and secure workplace
Asset tracking
More robust mechanisms for prioritizing data traffic
These mechanisms provide a more reliable infrastructure for bandwidth-intensive applications such as streaming video, voice over IP, near-real time collaboration, and others.
Grants LOBWorkflow-enabled collaborative grants planning
Collaborative planning within program offices
Grants LOBCollaborative review, etc.
Location independent reviews
Evaluation LOB
Evidence-based planning
Collaboration across programs to define / reuse performance information
Evaluation LOB
Consolidated data collection
Collaboration tools to enable survey / data collection support to survey participants
Administration LOBIT-business alignment and IT support and EA governance
Common enabling services
document.doc 2/29/08 136

Department of Education
Enterprise Transition Strategy Plan, February 2008
IPv6 Feature SupportedBusiness Capabilities Requirements Description
Auto-configuration
Allows devices to automatically configure themselves and join networks without requiring centralized servers to manage them. Mobility support built into IPv6 will enable devices to remain connected even while roaming across great physical distances and multiple networks. These capabilities will enable flexible, decentralized, “plug and play” networking that will decrease administration requirements and provide continuous connectivity.
Compliance LOBCase management and workflow tracking.
Apply mobile tools and caseworker tools to field audits, inspections and investigation.
Administration LOBIT-business alignment and IT support and EA governance.
Common enabling services.
End-to-end security
IPv6 incorporates (and requires) end-to-end security for IP traffic directly within the network layer, simplifying and strengthening network security.
Evaluation LOBConsolidated data collection.
Secure, multi-channel data exchange between ED and data sources (web, paper, etc.).
Research LOBComprehensive data collection, sharing and analysis.
Data exchange between ED and data sources through multiple secure channels.
Administration LOBIT-business alignment and IT support and EA governance.
Common enabling services.
document.doc 2/29/08 137

Department of Education
Enterprise Transition Strategy Plan, February 2008
Given that the Internet Protocol is core to the Department’s IT infrastructure, beginning in February 2006, OMB has been using the Enterprise Architecture Assessment Framework to evaluate the Department’s IPv6 transition planning and progress, IP device inventory completeness, and impact analysis thoroughness. The images below (Figure 14 and Figure 15) illustrate the Department’s high-level IPv6 Transition Strategy.
Figure 14: High-level IPv6 Transition Strategy
document.doc 2/29/08 138

Department of Education
Enterprise Transition Strategy Plan, February 2008
Jun 05 Sep 05 Dec 05 Mar 06 Jun 06 Sep 06 Dec 06 Mar 07 Jun 07 Sep 07 Dec 07 Mar 08 Jun 08
Due by November 15, 2005: (1) Assign an official to lead and coordinate agency planning (2) Inventory of backbone network infrastructure devices for each of ED’s IT investments (3) Initiate impact analysis and inventory of all other hardware and software
Due by February 28, 2005: ED’s IPv6 Transition Plan and progress report on inventory and impact analysis submitted as part of ED’s Enterprise Architecture
Due by June 30, 2006: (1) Inventory of all software and hardware per investment (2) Impact analysis of fiscal and operational risks
Due by June 30, 2008: (1) ED’s backbone network infrastructure must be using IPv6, and all ED networks must interface with ED’s backbone infrastructure (2) All applications and product features developed / acquired after July 2005 are either IPv6 compliant or have a migration path and commitment to upgrad e to IPv6 1
Effective Immediately: Any new IP product or system developed, acquired, or produced must interoperate with both IPv6 and IPv4 systems and products, and h ave available contractor/ vendor IPv6 tech support for development, implementation, and fi elded project management
Source: Memorandum issued by Karen Evans to Agency CIOs on August 2, 2005 entitled “Transition Planning for Internet Pr otocol Version 6 (IPV6)”
Figure 15: Department’s IPv6 Transition Strategy1
9.1 IPv6 Milestone Update
ED’s IPv6 Transition is integrated into ED’s EA Transition Strategy. Specifically, ED’s EA Transition is represented as an EA Technical Transition Program in ED’s IT Infrastructure Services Sequencing Plan and follows from ED’s IPv6 Transition Strategy. Milestones for ED’s IPv6 Transition Plan are identified in (Table 50) below:
Table 50: IPv6 Transition Plan Milestones
Qtr Milestone
FY2006
Q1
Incorporate IPv6 capability requirements into ED’s IT acquisition process (Complete)
Assign an official to lead and coordinate IPv6 agency planning (Complete) LEVEL 1 PRACTICE
Complete inventory network backbone infrastructure devices affected by IPv6 (Complete) LEVEL 2 PRACTICE
Begin IPv6 impact and risk analysis and inventory of non-backbone devices impacted by IPv6 (Complete)
Q2
Incorporate elements of ED’s IPv6 transition into ED’s IRM Strategic Plan, Enterprise Architecture, and EA Transition Strategy. (Complete) LEVEL 3 PRACTICE
Submit a progress report on ED’s IPv6 impact and risk analysis and inventory of non-backbone devices impacted by IPv6 (Complete)
1 Source: OMB Memorandum M-05-22 “Transition Planning for Internet Protocol Version 6”
document.doc 2/29/08 139

Department of Education
Enterprise Transition Strategy Plan, February 2008
Qtr Milestone
Q3
Complete IPv6 impact and risk analysis (Complete) LEVEL 4 PRACTICE
Complete inventory of non-backbone infrastructure devices impacted by IPv6 (Complete) LEVEL 4 PRACTICE
Begin IPv6 Testing and Engineering Project Sub-Phase (Complete; sub-phase is in progress)
Q4 Begin IPv6 technical training (Complete; training will continue throughout the entire lifecycle) LEVEL 5 PRACTICE
FY2007
Q1Incorporate IPv6 into ED’s Information Security Plan (Complete; document is under agency-wide review due to other security related matters)
Q2 Demonstrate Readiness LEVEL 5 PRACTICE:
Identify current network infrastructure and topology (Complete; see Section 1.3 of IPv6 Transition Strategy v2.2)
Identify service providers (for Core Network) (Complete; Sprint is the Internet Service provider)
Existing Core Networks Identified (Complete; see Section 1.3 of IPv6 Transition Strategy v2.2)
Transition Mechanism Selected (Complete; see Section 1.4 of IPv6 Transition Strategy v2.2)
Request IPv6 Address Space (Complete and RECEIVED; see Section 1.8 of IPv6 Transition Strategy v2.2)
Determination of IPv6 Capability of Existing Network Devices (Complete; see details of inventory submissions)
Identification of Applications to be Migrated to IPv6 (Complete; see Section 1.12 of IPv6 Transition Strategy v2.2)
Q3
Submit Design for Core (Complete; see Section 1.12 of IPv6 Transition Strategy v2.2 and ED Demonstration Plan)
Validation of Transition Scenario(s) (Complete; see ED Demonstration Plan document under separate cover)
Q4 Submit Pilot / Test Plan (Complete; see ED Test Plan document under separate cover)
FY2008
Q1Complete Equipment Upgrades / Replacements, as needed (Completed; numerous System Change Request (SCR) approved by Change Control Review Board (CCRB) are complete.)
Q2 Report Results of Pilots / Tests (Completed October 18, 2007; see ED Test Plan document under separate cover)
Q3Perform IPv6 Capability Demonstrations (Completed November 18, 2007; see ED Demonstration Plan document under separate cover)
document.doc 2/29/08 140