Introduction to the Unified Modeling Languagecommunity.wvu.edu/~hhammar//rts/adv rts/UML...
21
A technical discussion of UML 06/11/03 Introduction to the Unified Modeling Language Terry Quatrani, UML Evangelist
Transcript of Introduction to the Unified Modeling Languagecommunity.wvu.edu/~hhammar//rts/adv rts/UML...

A technical discussion of UML06/11/03
Introduction tothe Unified Modeling Language
Terry Quatrani, UML Evangelist

If you’re a complete UML beginner, then consider this as UML 101, a basic introduction to the notational elements of the UML. This article was first published on the Rational Developer Network after presentation at the RUC 2001.
Before joining Rational, in 1993, I worked for another well-known technology company, only there I was using OMT (the methodology developed by Jim Rumbaugh and company). Then I became a Technical Representative at Rational, and went from using OMT and rectangles, to using the Booch methodology and clouds. Back then, Rational only had 300 employees, and the UML was just a glimmer in the eyes of those who would go on to be known as “the Three Amigos.” So I guess I date myself a bit by saying that I was doing OO development before UML came along, but that admission does give me a certain amount of credibility to talk to you about UML, don’t you think? The Importance of Modeling When my son was 13, my husband and I thought he should have some space of his own. So we called in Leon the handyman and sat around the kitchen table. “What do you want?” he asked. Simple…a few closets, some electrical outlets, a cable hookup. Leon went off and remodeled the basement, and life was good. That is until winter came along and poor Michael comes upstairs and says, “Mom, I’m cold.” You see, we hadn’t thought about putting heat in the basement. So we decided to put in a gas fireplace. However, we don’t have natural gas where I live, so we had to get a propane tank. Unfortunately, the only place it would fit was over in one corner, with all the storage in the other corner, and everything else in a third corner. The result is that you can’t sit in my basement and see the TV and the fireplace at the same time. If we’d done some planning, we would have been able to design a room that was much more functional and comfortable. Now in this instance we made some mistakes, but it wasn’t a serious disaster. Think about building a skyscraper, though. No one would dream of a major construction project without thorough blueprints. That’s blueprints plural, because it’s important to not only have one plan of the skyscraper – you need to have multiple plans. The electrician needs a view to show where the wiring goes. The plumber needs another plan so he doesn’t put a sink in the elevator. And the carpenters need to know where to put this expensive crown molding in the CEO’s office. Different workers need different views of what they’re trying to build. And that’s what we’re doing with software. That different view is what we mean when we talk about the logical view, the use case view, the component view, and the deployment view – all the different views of the application under construction. So whose view should you model? Well, everybody involved in the project lifecycle is going to do some sort of modeling; they just might be doing different things. The business modeler will model different requirements than the application modeler will, but they are all creating a view that is important to their world of the application. And the language they use to do this is the Unified Modeling Language.

The easiest answer to that question is a quote:
“The UML is the standard language for specifying, visualizing, constructing, and documenting all
the artifacts of a software system.”
The more complex answer requires a short history lesson, because the UML is really a synthesis of several notations by Grady Booch, Jim Rumbaugh, Ivar Jacobson and many others.
Figure 1: How it all began
Back in the late 80s, when I started modeling, there were many different methodologies. And each methodology had its own notations. The problem was that if different people were using different notations, somewhere along the line somebody had to do a translation. A lot of times, one symbol meant one thing in one notation, and something totally different in another notation. In 1991, everybody started coming out with books. Grady Booch came out with his first edition. Ivar Jacobson came out with his, and Jim Rumbaugh came out with his OMT methodology. Each book had its strengths as well as its weaknesses. OMT was really strong in analysis, but weaker in design. The Booch methodology was stronger in design and weaker in analysis. And Ivar Jacobson’s Objectory was really good with user experience, which neither Booch nor OMT really took into consideration back then.
What is UML?

Then, in 1993, a funny thing happened. Grady came out with the second edition of his first book; it still had the good design, but some of the good analysis stuff from OMT had started creeping into his methodology. And actors and use cases from Ivar were in there as well. And Jim was writing a series of articles for the Journal of Object Oriented Programming that people referred to as OMT 2, which still had the good analysis work, plus some of Grady’s good designs, and … you guessed it … all of a sudden actors and use cases were added into OMT 2. That was the beginning of the informal unification of methodology. And it came as something of a relief, because it really had been a method war. Imagine a group of engineers sitting around debating is it a rectangle? Is it a cloud? People doing development had a lot of fights over this type of thing. Jim Rumbaugh joined Rational in 1994, and we locked him and Grady in a room together, told them to work together and come up with a methodology, and didn’t let them out until October of 1995. That year, at OOPSLA, they introduced the Unified Method, which would become the UML. At that time, the Unified Method was both the language and the process that went along with it. 1 Once Ivar joined Rational, we threw him into the room, gave them another couple of years to collaborate (during which they decided to separate the language from the process), and in 1997 submitted the Unified Modeling Language to the Object Management Group (OMG) for standardization. Now, contrary to popular belief, Rational does not own the UML, although we continue to work on it. The UML belongs to the OMG. If you go to the OMG Web site, you can download the PDF version, which I keep on my laptop because it’s a great reference. And speaking of reference, I think it’s time we started exploring the UML, don’t you? Activity Diagrams The logical place to start walking through some of the UML diagrams is by looking at activity diagrams.
1 Ever heard the term “The Three Amigos?” This was the night that name was given to Grady, Jim, and Ivar. On the same night the Unified Method debuted, it was announced that Rational had acquired Objectory and that Ivar Jacobson was now part of Rational. Grady walked into that meeting with a t-shirt reading “The Three Amigos,” gave one to Jim and Ivar and the rest is history.

Figure 2: Activity diagram Activity diagrams show the flow of control. As illustrated in Figure 2, you can see activities represented as rounded rectangles. Activities are typically action states – states that transition automatically to the next state after the action is complete. The filled in circle represents the start of the activity diagram – where the flow of control starts. Transitions shown as arrows show how you move from activity to activity. Synchronization bars show how activities happen in parallel. I can guard a transition that says “I want you to go to this activity only if this condition is true,” and I can show you where it stops. Now if you’re a certain age, you’ll probably look at this activity diagram and think, “hmm…that looks like a flow chart.” And that’s exactly what it is, except I’m not doing it down at the programming level. Typically, I use an activity diagram fairly early on in my analysis and design process to show business workflow. I’ll also use them to show where each of my use cases might be in an activity to illustrate what use case has to happen. I also use activity diagrams to show how things flow between my use cases. But one of the great things about the UML is its versatility.2 So while I use activity diagrams at the beginning of the lifecycle, others can use them in a different phase entirely. I’ve seen people use activity diagrams down at the design level where they had a very complicated set of 2 Someone once said to me about the UML is that “it’s not a revolution, it’s an evolution.” And it’s true, it’s taken all the 20 plus years of software development experience and all the good practices we’ve learned to be combined into this notation. And, like any evolution, along the way you learn what works best in a variety of situations.

algorithms for a particular class. And many people use them to show the flow between the methods of a class.
Figure 3: Swimlanes One of the things I can show with activity diagrams is swimlanes. One of the best ways to use swimlanes and activity diagrams is to show ownership. It clearly illustrates to all parties what individual or group is responsible for what activity. Use Case Diagrams The next diagram to look at is the use case diagram. These I create by first looking at my actors. An actor is someone or something that is external to the system, but that is going to interact with the system. Actors are represented as stick figures.

Figure 4: Actors The example that I worked up for this introduction to UML is a little model of a course registration system. So in this instance, the first thing I would do when starting my analysis process is to ask, “who is going to interact with this system?” For the course registration model, I have a registrar, a professor, and a student. I also have an external billing system. This billing system also qualifies as an actor. (See, an actor doesn’t have to be a person – it’s anything that interacts with the system but is outside of the system.) A use case is a sequence of related transactions performed by an actor in the system in a dialog. Or, to put it in English, a use case is a chunk of functionality. And here’s the key: it is not a software module – it is something that provides value to the actor. Use cases are shown as ovals, and the easiest way to find them is to look at each of your actors and ask yourself why do they want to use the system. In my case, my registrar is going to maintain the curriculum, my professor is going to request a roster, my student maintains the schedule, and my billing system receives the billing information. So I create my use cases by looking at it from the customer point of view and asking, “so, mister system actor, why do you want to use the system? What value does this system provide to you?” The next step, once you’ve identified how your actors will be interacting with the system, is do document your use cases. Each use case needs to be documented with the flow of events, and this is done from the actor’s point of view. It should detail what the system must provide to the actor when the use case is executed. Typically it will show things like how the use case starts and finishes. What things does that use case have to do? You’ll have the normal flow of events (what I call the “happy days” scenario), where everything works. Then you’ll get the abnormal flow of events, the “rainy day” scenario. What happens when the system doesn’t work? I’ve found by documenting my flow of events that I always start with the happy days scenario.

Take as an example, walking up to an automated teller machine. You walk up to the ATM and insert your card. It asks for your PIN number. You enter it, and you are asked what you would like to do. You say “I want some money.” It asks where the money should be taken from. You tell it to take it from your checking account. It asks how much. You say $100.00. Then magic happens….it gives you $100.00. Then it asks if you want another transaction. You say no. It gives you your card back, gives you a receipt, and the transaction is over. That’s the happy day scenario. Second scenario. You go up to the ATM, insert your card, and enter your PIN. The ATM tells you it’s the wrong PIN. You enter your number again. Again you are told that the PIN is incorrect. You repeat once more, with the same results. What happens? The ATM eats your card. That’s what I mean by an alternate scenario. One of the most important things to capture is these high level alternate scenarios and get your customer to agree with them. You’re not going to capture every “what if.” If you try to document every possibility you’ll be documenting forever. But there are certain things you want to capture such as, in this instance, if you enter the wrong PIN three times in a row, the bank keeps your card. And by documenting this early in the system, you can get agreement with the customer (in this case the bank who runs the ATM) that you are handling risks appropriately In the curriculum flow of events, the use case is as follows: It begins when the Registrar logs onto the Registration System and enters his/her password. The system verifies that the password is valid (E-1) and prompts the Registrar to select the current semester or a future semester (E-2). The Registrar enters the desired semester. The system prompts the professor to select the desired activity: add, delete, review, or quit.
If the activity selected is “add”, the S-1: Add a Course subflow is performed. If the activity selected is “delete”, the S-2: Delete a Course subflow is performed. If the activity selected is “review”, the S-3: Review Curriculum subflow is performed. If the activity selected is “quit”, the use case ends.
In my course registration example, for instance, you can see that there are a lot of “if X then Y” workflows. That’s where you want your customer to help you out. Getting agreement early means your customer understands these scenarios and says “yes, this is what we want.” Use cases are a great way to ensure that what you’re building is really what the customer wants, because they show the actors, the use cases, and the relationships between them.

Figure 5: Use case diagram
So we have a great diagram that graphically shows me what? The answer is simple – it is a great diagram that shows a good overview of the system. It shows what is outside the system (actors) and the functionality that the system must provide (use cases). If there is a legacy system you need to take into consideration, here’s where you deal with it. Forcing me to work with these types of interfaces very early in the project means that I won’t be faced with the prospect of waiting until coding starts to figure out how I’m going to talk to that black box that I can’t change. One more thing you should know about use cases is the use case realization. This is the “how” of the use case. It’s usually a bucket that contains three different types of diagrams: sequence diagrams, collaboration diagrams, and a class diagram that we call a view of participating classes. Use case realizations are basically a way of grouping together a number of artifacts relating to the design of a use case. Sequence Diagrams Sequence diagrams show object interactions arranged in a time sequence. I can use the flow of events to determine what objects and interactions I will need to accomplish the functionality specified by the flow of events.

Figure 6: Sequence diagram Figure 6 shows how a student successfully gets added to a course. The student (let’s call him Joe) fills in some information and submits the form. The form then talks to the manager and says “add Joe to Math 101.” The manager tells Math 101 that it has to add a student. Math 101 says to Section 1 “are you open?” In this case, Section 1 replies that they are open, so Math 101 tells section 1 to add this student. Again, sequence diagrams are great tools in the beginning because they show you and your customer step-by-step what has to happen. From an analysis point of view, I’ve found over the years that sequence diagrams are very powerful in helping me drive requirements; especially requirements that are hard to find. User interface requirements, for instance, are notorious because you always seem to get requirements that are just not testable. A common UI requirement like this is “this system shall be user-friendly.” How many of you have met a friendly computer? One of the benefits of these types of diagrams is that every line coming from an actor that represents a person, tells you that something in your UI has to provide a capability needed by that person. In other words, you can use sequence diagrams to drive out testable user interface requirements. Sequence diagrams are, therefore, good for showing what’s going on, for driving out requirements, and for working with customers. That usually leads to the question, though, of how many do you need to create? My answer is, “until you do enough.” You’re going to find out when you do sequence diagrams that you reach a point where you’re not finding any new objects, not finding any new messages, and that you’re typing the same thing over and over. In the example of Joe joining Math 101, we learn that the process would be the same if Joe wanted to join History 101. So, rule of thumb, do a sequence diagram for every basic flow of every use case. Do a sequence diagram for high-level, risky scenarios, and that should be enough. That’s how many sequence diagrams I do. Collaboration Diagrams
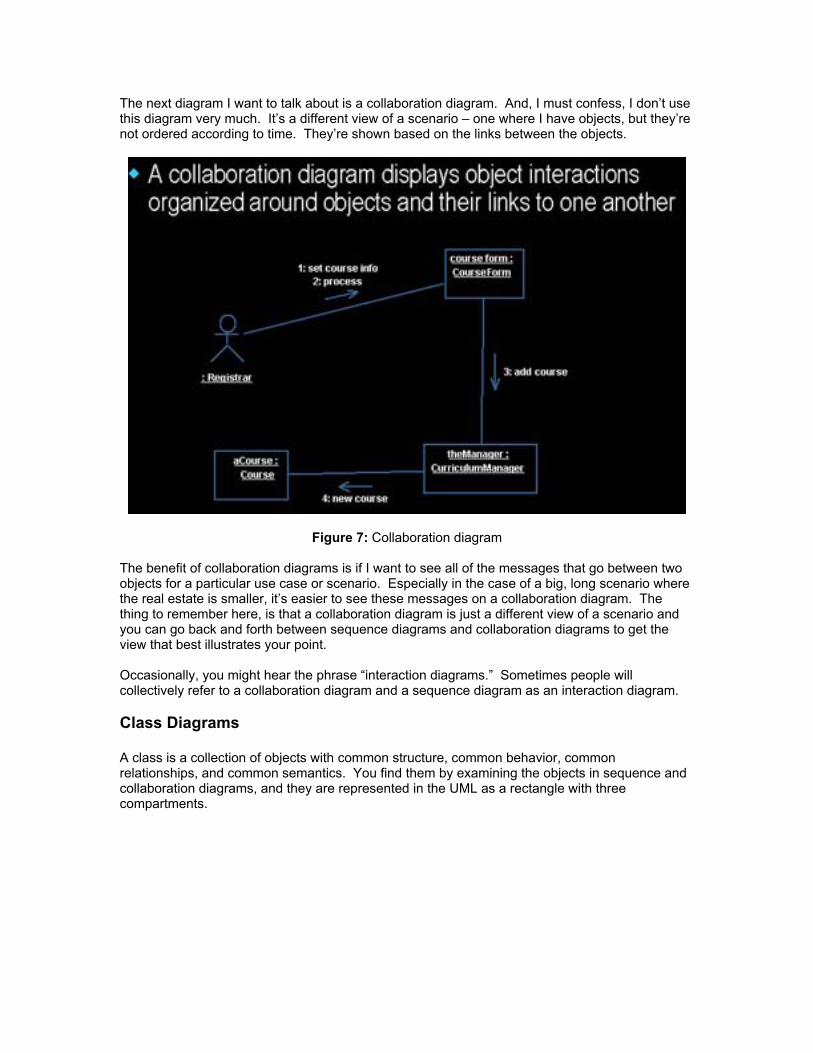
The next diagram I want to talk about is a collaboration diagram. And, I must confess, I don’t use this diagram very much. It’s a different view of a scenario – one where I have objects, but they’re not ordered according to time. They’re shown based on the links between the objects.
Figure 7: Collaboration diagram The benefit of collaboration diagrams is if I want to see all of the messages that go between two objects for a particular use case or scenario. Especially in the case of a big, long scenario where the real estate is smaller, it’s easier to see these messages on a collaboration diagram. The thing to remember here, is that a collaboration diagram is just a different view of a scenario and you can go back and forth between sequence diagrams and collaboration diagrams to get the view that best illustrates your point. Occasionally, you might hear the phrase “interaction diagrams.” Sometimes people will collectively refer to a collaboration diagram and a sequence diagram as an interaction diagram. Class Diagrams A class is a collection of objects with common structure, common behavior, common relationships, and common semantics. You find them by examining the objects in sequence and collaboration diagrams, and they are represented in the UML as a rectangle with three compartments.

Figure 8: Classes The first compartment shows the class name, the second shows its structure (attributes), and the third shows its behavior (operations). These compartments can be suppressed, however, so that you can see just the name, just the name and the attributes, or all three. One thing you should also know is that it’s important, when naming classes, to use the vocabulary of the domain and pick a standard. For this instance, my classes are all singular nouns that begin with a capital letter. You may choose to do it differently, and that doesn’t matter. What does matter is that before your project you pick a standard and stick with it so that everything is consistent across the project. Class Diagrams show you the static nature of your system. These diagrams show the existence of classes and their relationships in the logical view of a system. You will have many class diagrams in a model. The UML modeling elements found in class diagrams include:
Classes and their structure and behavior. Association, aggregation, dependency, and inheritance relationships. Multiplicity and navigation indicators Role names.
Take a look at Figure 9. This diagram shows operations (behavior): what an object in that class can do. I find my operations by looking at my interactions diagrams.

Figure 9: Operations Here I’m saying that I need to be able to ask the registration manager to add a student to Math 101. That’s going to translate into an operation called “addCourse.” The structure of a class is represented by its attributes. So how do I find my attributes? By talking to domain experts. By looking at my requirements. In my example, I learn that each course offering has a number, a location, and a time. This translates out to three attributes.

Figure 10: Classes and their attributes
Relationships Relationships represent a communication path between objects There are three types of UML relationships: Association, Aggregation, and Dependency. Association – a bi-directional connection between classes. An association says “I can send you a message because if I’m associated with you, I know that you’re there.” (Represented in the UML as a line connecting the related classes.) Aggregation – a stronger form where the relationship is between a whole and its parts. An aggregation tells my developer that there’s a strong coupling between those object classes. (Represented in the UML as a line connecting the related classes with a diamond next to the class representing the whole.) Dependency – a weaker form showing the relationship between a client and a supplier where the client does not have semantic knowledge of the supplier. A dependency says “I need your services, but I don’t know that you exist.” (Represented in the UML as a dashed line pointing from the client to the supplier.) To find relationships, once again, I go back to my sequence diagram. If two objects need to “talk”, there must be a means to do so (i.e., a relationship between their classes). I typically start out and make everything an association. As I’m doing more analysis, I might find I have an aggregation because I’m going to have to take care of a parent-child relationship. When I get into the design phase, I find out that I might not need an association because somebody else is going to pass that object into one of my methods – so I make it a dependency.
Figure 11: Relationships

In Figure 11 you see these relationships. As association says the Professor can talk to the Course Offering, and the Course Offering can talk to the Professor. Messages can be initiated and data can flow from any direction. Aggregation is shown by having the diamond toward the whole – in this case a Course is made up of Course Offerings. The reason for this aggregation would be to tell my developers that if they get rid of this Course, they’ll probably have to do something special with the Course Offerings. Dependencies are shown as a dashed line. It’s saying that the registration manager depends upon the Schedule Algorithm to do something. The Schedule Algorithm is either a parameter to one of the methods or is declared locally by one of the Methods of the Registration Manager. Multiplicity and Navigation Multiplicity defines how many objects participate in a relationship. It is the number of instances of one class related to one instance of the other class. For each association and aggregation, there are two multiplicity decisions to make: one for each end of the relationship. Multiplicity is represented as a number and a * is used to represent a multiplicity of many.
Figure 12: Multiplicity and navigation One Professor Object is related to zero-to-four Course Offering Objects. One Course Offering Object is related to exactly one Professor Object. I use this to look at and ensure that this handles my requirements. Can I be a Course Offering and be team-taught by a bunch of professors? No, because this says I can only have one professor. Can I be a professor and be on sabbatical? Yes, because this says I have a zero as possible course load. I use multiplicity quite often to help me start capturing and implementing my business rules. If you have, for example, a business rule that says you must have at least 3 students and no more than 10 for a course to be offered in a semester, these multiplicity numbers tell me I’ve incorporated that business rule into this plan.

Navigation is shown by an arrow, and although associations and aggregations are bi-directional by default, it is often desirable to restrict navigation to one direction. When navigation is restricted, an arrowhead is added to indicate the navigational direction. One of the things I do during the analysis and design phases is look at what I want to be uni-directional. By putting the arrow into this diagram, I say that the Registration Manager can send a message to the Course, because it knows the Course exists. But the Course has no idea that the Registration Manager exists, so the Course cannot initiate a message. Now data can flow between them; for instance the Registration Manager can ask the Course if it’s open and the Course can say that it is. But only the Registration Manager can start that conversation. Obviously the goal here is to get as many arrows as you can by the time you’ve finished designing, because it’s a much easier system to maintain. Inheritance Inheritance is the relationship between a superclass and a subclass. It shows uniqueness and commonality, and allows me to add new behavior as I’m moving along but not changing the susperclass.
Figure 13: Inheritance Inheritance is shown with a triangle. This shows that the Professor is a Registration User, as is the Student. Now, a word of warning. Inheritance is useful, however, the goal is not to use as much inheritance as your system will allow. I’ve seen some really brutal systems where they had inheritance 17-levels deep. If they changed one thing, it became a disaster. So the rule of thumb is to use inheritance only when you truly do have an inheritance situation. State Transition Diagrams A state transition diagram shows the life history of a given class. It shows the events that cause a transition from one state to another, and the actions that result from a state change.

Figure 14: State transition diagram I use state transition diagrams for object classes that typically have a lot of dynamic behavior. The button is on … the button is off; I’m not going to do a state chart for it. But object classes that have a lot of dynamic behavior, I’m probably going to have to look into the states of the objects. I start by showing a state, which is a rounded triangle. I can have start states, and I can have stop states, which are shown as bulls eyes. I can also have transitions between states, or guard transitions (things that happen when only when a condition is true), or things that happen when I’m inside the state. I look at this diagram and see the state transition diagram for a course offering. It starts in the initialization state, and I stay in that state until I get an “add student” message. When I get that message, I set my count of student to zero and I transition to the Open state. You’ll see in Figure 14 that I have an entry, and the reason why it’s there is that I have two ways of getting into that state. It says that no matter how you come into the state, I want you to register the student. When I exit that state, the count changes to keep track of the number of students in the course. I can keep adding students until I get to 10, and then I go to the Close state. Once the course is finalized, I transition to the stop state. No matter where I am then, if I get the Cancel Event transition, I notify my students and then transition to the stop state. For object classes that have a lot of dynamic behavior, it’s well worth it to do a state diagram to get a handle on everything that has to happen. Ask yourself what happens when I get a message? What do I do when I get the message? What messages to I have to send? A lot of those messages become operations of the object class, as in this example where add a student is an operation. A lot of these actions, like setting the count, incrementing the count, checking the count, these all become private operations of that particular object class and a state diagram is where I see that. How do you know if you have a dynamic object class? Once again, go back to the sequence diagrams. If you have an object class that’s on a lot of sequence diagrams and it’s getting and sending a lot of messages, that’s a good indication it’s a fairly dynamic object class and it should probably have a state chart for it. Also for aggregations, where you have the whole of its parts, I

do a state chart for every aggregate whole. I do this mostly because that aggregate whole is often responsible for managing the messaging, which makes it dynamic. Component diagrams Of course no system can be built without taking into account the physical world. That’s where component diagrams come in. They are used to illustrate the organizations and dependencies among software components, including source code components, run time components, or an executable component. Components are shows as a large rectangle with two smaller rectangles on the side, as seen in Figure 15.
Figure 15: Components Those round things represent interfaces (often called lollipop notation). In this case, they show that the Register.exe is dependent upon interfaces to both the Course.dll and the People.dll. That means if these interfaces change, it will impact the Register.exe. I know that there’s this rule when you’re building interfaces that says “thou shall not change the interface.” But does anybody actually work where that rule is enforced? This diagram tells us what interfaces are used by what executables, so if the interface changes you know where the impacts may occur. Deployment Diagrams When it comes time to think about deploying the system, deployment diagrams are crucial because they show the processors on your system and the connections between them. They also visualize the distribution of components across the enterprise. It’s a visual way of knowing what executables are running on my processors

Figure 16: Deployment diagram Extending UML The last thing I want to stress about the UML is that it can be extended. When they built the UML, they very wisely realized that there was no way they could create a notation that could please all of the people all of the time. So they gave us the concept of a stereotype. A stereotype says I can take a basic modeling element and give it more meaning. Stereotypes may be used to classify and extend associations, inheritance relationships, classes, and components.

Figure 17: Web stereotype example Figure 17 shows the diagram of our Web stereotypes. A Web page typically has stuff that runs on the server and stuff that runs on the client. If you’re building Web-based applications, what’s running on the client and the server is of vital importance. So we have a whole set of stereotypes that show that. The little wheels represent things that run on the server. So just by looking at this one diagram I can see what runs on the server, what runs on the client, and what business objects they have to deal with. So that’s what I call UML 101. Obviously it’s not all of UML, in fact there’s a thousand pages to the UML spec. But it’s a starting point. And for those of you who want to know more, I can make a few recommendations about where to go. Visual Modeling with Rational Rose 2002 and UML, by Terry Quatrani. Yes, it’s my own book, but I think it’s a good source of information, even if I do say so myself. Basically I walk you through a process of using the Rational Unified Process, Rational Rose, and UML. UML Distilled, by Martin Fowler. This is an excellent book explaining UML diagrams and the notations behind it. UML Explained, by Kendall Scott. – As the title suggests, Kendall does a good job of introducing key UML concepts and describing their uses. There are also the UML books by the amigos. The Unified Modeling Language User Guide and The Unified Modeling Language Reference Manual.

IBM software integrated solutionsIBM Rational supports a wealth of other offerings from IBM software. IBMsoftware solutions can give you the power to achieve your priority businessand IT goals.
• DB2® software helps you leverage information with solutions for dataenablement, data management, and data distribution.
• Lotus® software helps your staff be productive with solutions forauthoring, managing, communicating, and sharing knowledge.
• Tivoli® software helps you manage the technology that runs your e-business infrastructure.
• WebSphere® software helps you extend your existing business-criticalprocesses to the Web.
• Rational® software helps you improve your software developmentcapability with tools, services, and best practices.
Rational software from IBMRational software from IBM helps organizations create business value byimproving their software development capability. The Rational softwaredevelopment platform integrates software engineering best practices, tools,and services. With it, organizations thrive in an on demand world by beingmore responsive, resilient, and focused. Rational's standards-based, cross-platform solution helps software development teams create and extendbusiness applications, embedded systems and software products. Ninety-eight of the Fortune 100 rely on Rational tools to build better software,faster. Additional information is available at www.rational.com andwww.therationaledge.com, the monthly e-zine for the Rational community.
Rational is a wholly owned subsidiary ofIBM Corp. (c) Copyright RationalSoftware Corporation, 2003. All rightsreserved.
IBM CorporationSoftware GroupRoute 100Somers, NY 10589U.S.A.
Printed in the United States of America01-03 All Rights Reserved.Made in the U.S.A.
IBM the IBM logo, DB2, Lotus, Tivoliand WebSphere are trademarks ofInternational Business MachinesCorporation in the United States, othercountries, or both.
Rational, and the Rational Logo aretrademarks or registered trademarks ofRational Software Corporation in theUnited States, other countries or both.
Microsoft and Windows NT areregistered trademarks of MicrosoftCorporationin the United States, othercountries, or both.
Java and all Java-based trademarks aretrademarks of Sun Microsystems, Inc. inthe United States, other countries, orboth.
ActionMedia, LANDesk, MMX, Pentiumand ProShare are trademarks of IntelCorporation in the United States, othercountries, or both.
UNIX is a trademark of The Open Groupin the United States, other countries orboth.
Other company, product or servicenames may be trademarks or servicemarks of others.
The IBM home page on the Internet canbe found at ibm.com