Introduction to the Standardized Infection Ratio...
16
1 Introduction to the Standardized Infection Ratio (SIR) Hani Nasrallah, MPH I have no relevant financial relationships to disclose. 2 Learning Objectives •Define a Standardized Infection Ratio (SIR) •Describe SIR calculation •Describe advantages/disadvantages of an SIR •Extract SIR reports from the National Healthcare Safety Network (NHSN) •Interpret SIR reports •Interpret a 95% confidence interval 3
Transcript of Introduction to the Standardized Infection Ratio...

1
Introduction to the Standardized Infection Ratio
(SIR)
Hani Nasrallah, MPHI have no relevant financial relationships to disclose.
2
Learning Objectives
•Define a Standardized Infection Ratio (SIR) •Describe SIR calculation•Describe advantages/disadvantages of an SIR•Extract SIR reports from the National Healthcare Safety Network (NHSN)•Interpret SIR reports•Interpret a 95% confidence interval
3

What is an SIR?
It is a standardized ratio that compares the ‘observed’ number of healthcare-associated infections (HAI) in a given healthcare setting to an ‘expected’ number of HAI
SIR= Observed Infections (O)Expected Infections (E)
Source: Your Guide to the Standardized Infection Ratio (SIR). http://www.cdc.gov/nhsn/PDFs/Newsletters/NHSN_NL_OCT_2010SE_final.pdf 4
What are Observed (O) Infections?
• Observed is the actual number of HAI in your healthcare setting
• For example:– Using NHSN guidelines, 5 central line-
associated blood stream infections (CLABSIs) were observed in the Medical Intensive Care Unit (MICU) in June 2011
5
What are Expected (E) Infections?
• Predicted HAI in your healthcare facility using baseline data from the standard population during the period 2006-2008
• Varies for CLABSI and Surgical Site Infections (SSIs)– CLABSI based on the number of central line days– SSI based on multiple risk factors
• If Expected HAI (E) < 1, no SIR will be calculated
6

How Do You Interpret an SIR?
• An SIR > 1 indicates that more HAI were observed than expected
• An SIR < 1 indicates that fewer HAI were observed than expected
• An SIR = 1 indicates that same number of HAI were observed as were expected
7
How Do You Interpret an SIR?
• An SIR of 1.5 is 50% higher than expected
• An SIR of 0.6 is 40% lower than expected
• An SIR of 2.5 is 150% higher than expected
• An SIR of 0.97 is 3% lower than expected
8
Learning Objectives
•Define a Standardized Infection Ratio (SIR)
••Describe SIR calculationDescribe SIR calculation•Describe advantages/disadvantages of an SIR•Extract SIR reports from the National Healthcare Safety Network (NHSN)•Interpret SIR reports•Interpret a 95% confidence interval
9
How is an SIR Calculated for CLABSI?
• SIR= Observed CLABSI (O)Expected CLABSI (E)
• Observed CLABSI is the actual number of HAI for your location of interest
10
How is an SIR Calculated for CLABSI?
Type of Location
# of CLABSI
# of Central Line (CL)
Days
NHSN Baseline
Rate
Expected # of CLABSI
SIR (O/E)
Medical Intensive Care
Unit (MICU)5 500 2.0 1 5/1=5.0
Surgical Intensive Care
Unit (SICU)0 250 4.0 1 0/1=0.0
Pediatric Intensive Care
Unit (PICU)1 250 2.0 .5 ---
Total 6 1000 --- 2.5 6/2.5=2.4
Key Point•The SIR allows you to make comparisons across multiple units
Time Period: January – June 2011
11
How is an SIR Calculated for CLABSI?
Type of Location
# of CLABSI
# of Central
Line (CL) Days
NHSN Baseline
Rate
Expected # of
CLABSI
SIR (O/E)
MICU 5 500 2.0 1 5/1=5.0
Key Points• During this time period, 5 CLABSIs were identified in the MICU• Based on the 2006-2008 baseline data, 1 CLABSI was expected• The results in an SIR for this unit of 5.0. This can be interpreted as saying ‘this unit had 400% more infections than expected’
(500*2)/1000=1
Time Period: January – June 2011
12

How is an SIR Calculated for CLABSI?
Type of Location
# of CLABSI
# of Central
Line (CL) Days
NHSN Baseline
Rate
Expected # of
CLABSI
SIR (O/E)
PICU 1 250 2.0 .5 ---
Key Points• During this time period, 1 CLABSI was identified in the PICU• Based on the 2006-2008 baseline data, 0.5 were expected• Since the number of HAI is < 1, no SIR is calculated
(250*2)/1000=0.5
Time Period: January – June 2011
13
How is an SIR Calculated for CLABSI?
Type of location
# of CLABSI
# of CL days
NHSN baseline
rate
Expected # of
CLABSI
SIR (O/E)
MICU 5 500 2.0 1 5/1=5.0
SICU 0 250 4.0 1 0/1=0.0
PICU 1 250 2.0 .5 ---
Total 6 1000 --- 2.5 6/2.5=2.4
Key Points• You can compare different units (ex. MICU and PICU)• You can aggregate all units to get an overall facility SIR• The facility SIR is 2.4. This can be interpreted as saying ‘this facility had 140% more
infections than expected’
Time Period: January – June 2011
14
How is an SIR Calculated for SSI?
• SIR= Observed SSI (O)Expected SSI (E)
• Observed SSI is the number of HAI for your procedure of interest (eg. abdominal hysterectomy, colon)
15

How are Expected SSI Calculated?
• Uses a logistic regression model from the standard population during the period 2006-2008
• Assigns a probability of infection to each procedure
• NHSN performs these calculations
16
Logistic Regression Model
• Flexible model that allows for a more precise way of risk adjusting
• Example:– For abdominal hysterectomies, HAI risk factors
include:• Patient age • American Society of Anesthesiologists (ASA) score• Procedure duration• Endoscope• Number of beds
17
Sample SSI SIR CalculationPatient Age Duration ASA Medical SSI Probability of
School Aff. SSI 1 40 117 4 Y 0 0.050 2 53 95 2 N 0 0.004 3 30 107 2 Y 1 0.033 . . . . . . . . . . . . . . . . . . . . .
100 37 128 4 Y 1 0.050 TOTAL Observed (O) Expected (E)
3 2.91 SIR= O/E =3/2.91 = 1.03
Source: Your Guide to the Standardized Infection Ratio (SIR). http://www.cdc.gov/nhsn/PDFs/Newsletters/NHSN_NL_OCT_2010SE_final.pdf
Key Points• Expected number of HAI are based on probabilities of infection• During this time period, 3 SSI were observed for this facility• Based on the NHSN 2006-2008 baseline data, 2.91 infections were expected• This results in an SIR for the facility of 1.03. ‘this facility had 3% more infections than expected’
18

Learning Objectives
•Define a Standardized Infection Ratio (SIR) •Describe SIR calculation
••Describe advantages/disadvantages of an SIRDescribe advantages/disadvantages of an SIR•Extract SIR reports from the National Healthcare Safety Network (NHSN)•Interpret SIR reports•Interpret a 95% confidence interval
19
Using SIRAdvantages and Disadvantages
• Advantages– Better method of risk adjusting– Easily compare healthcare setting locations
on measures such as CLABSI and SSI– Easy measure to interpret
• Disadvantages– CDC recommends at least 6 months of data
to allow for a precise measurement
20
Learning Objectives
•Define a Standardized Infection Ratio (SIR) •Describe SIR calculation•Describe advantages/disadvantages of an SIR
••Extract SIR reports from the National Extract SIR reports from the National Healthcare Safety Network (NHSN)Healthcare Safety Network (NHSN)
••Interpret SIR reportsInterpret SIR reports•Interpret a 95% confidence interval
21

Extracting SIR Data from NHSN
22
Extracting CLABSI SIR Data
23
Extracting CLABSI SIR Data
24

Extracting CLABSI SIR Data
Select Modify
25
Extracting CLABSI SIR Data
26
Extracting CLABSI SIR Data
Only use half year (SummaryYH) or full year (SummaryYr). Then click ‘Run’
27
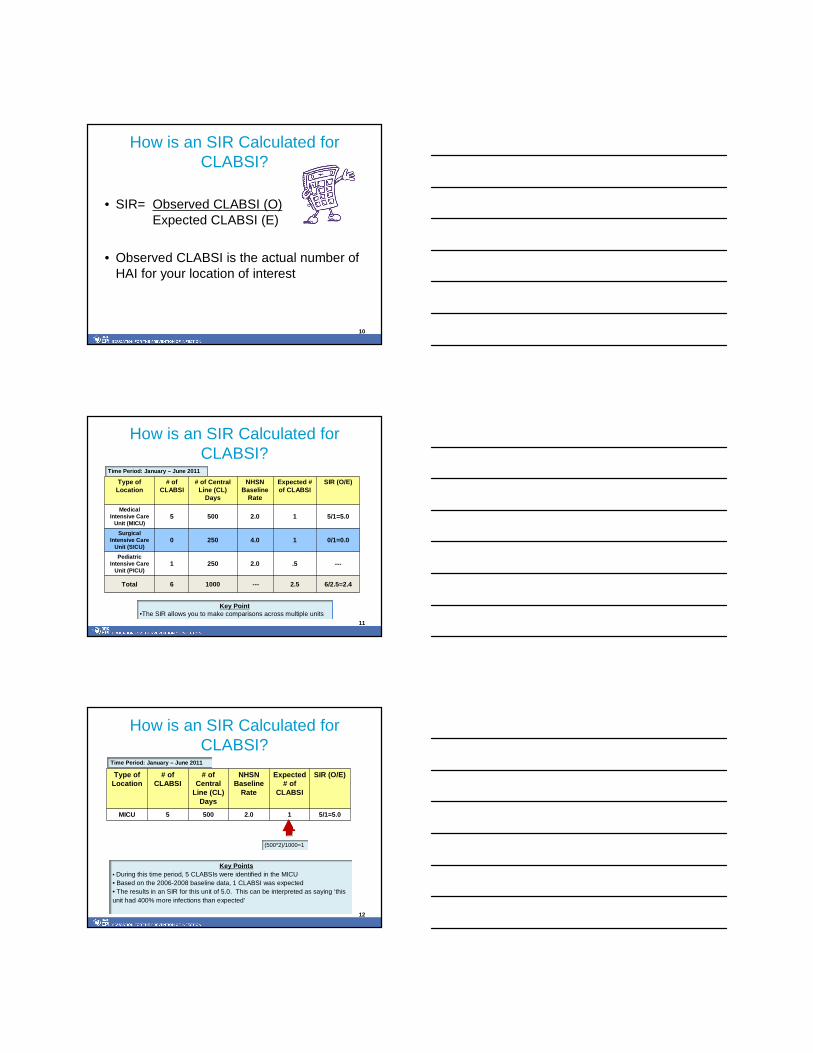
Sample CLABSI Output
summaryYr infCount numExp numCLDays SIR SIR_pval SIR95CI
2011 15 22.17 8343 0.68 0.02 0.35, 0.94
Key Points•Output using the SummaryYr option•An SIR of 0.68 signifies this hospital had 32% fewer HAI than expected
28
Sample CLABSI Output
Key Points•Output using the SummaryYH option. •2011H1 represents January – June 2011 •2011H2 represents July – Dec 2011•For 2011H1 this hospital had an SIR of 0.48 which signifies it had 52% fewer HAI than expected
summaryYH infCount numExp numCLDays SIR SIR_pval SIR95CI
2011H1 5 10.52 4123 0.48 0.03 0.27, 0.76
2011H2 10 11.65 4220 0.86 0.41 0.56, 1.42
29
Extracting SSI SIR Data from NHSN
30

Extracting SSI SIR Data from NHSN
31
Extracting SSI SIR Data from NHSN
Select Modify
32
Extracting SSI SIR Data from NHSN
This combination will give you half year increments
33

Sample SSI SIR Output
Key Points•Output using the SummaryYH option•2011H1 SIR of 0.50 signifies this hospital had 50% fewer infections than expected•2011H2 SIR of 0.70 signifies this hospital had 30% fewer infections than expected
summaryYH procCount infCountAll numExpAll SIRAll SIRAll_pval SIRAll95CI
2011H1 1731 12 24.15 0.50 0.004 0.36, 0.89
2011H2 1640 15 21.43 0.70 0.23 0.588, 1.229
34
Learning Objectives
•Define a Standardized Infection Ratio (SIR) •Describe SIR calculation•Describe advantages/disadvantages of an SIR•Extract SIR reports from the National Healthcare Safety Network (NHSN)•Interpret SIR reports
••Interpret a 95% confidence intervalInterpret a 95% confidence interval
35
P Value
• P value is a probability that your results are statistically significant
• P value < 0.05 shows statistical significance – p value of 0.02 is statistically significant– p value of 0.14 is not statistically significant
36
What is a Confidence Interval?
• Estimated range of values which is likely to include an unknown parameter estimate (e.g. SIR)
• There is always variability in data so the confidence interval tries to capture this variability
37
What is a Confidence Interval?
• You can think of a confidence interval as a margin of error (e.g. political polls)
• The range of the interval is dependent on the number of observations– More observations = narrower interval– Fewer observations = wider interval
38
Interpreting a 95% Confidence Interval
• In relation to SIRs, a confidence interval that spans 1 (e.g. 0.5, 1.50.5, 1.5) is not statistically significant
• A confidence interval that does not span 1 (e.g. 0.2, 0.80.2, 0.8) is statistically significant
39

Sample SIR and Confidence Interval Table
Procedure SIR 95% CI
Heart Transplant 1 0.3, 2.5
Fusion 1.2 0.4, 1.7
Colon 1.5 1.2, 1.8
Cardiac 0.5 0.2, 0.7
Key Points• SIR for Heart Transplant and Fusion procedures is not statistically significant• SIR for Colon and Cardiac procedures is statistically significant
40
Examples of 95% Confidence Intervals
0 1 2 3 4 5
95% Confidence Intervals
Cardiac
Colon
Fusion
Heart Transplant
.
■
■
■
■
41
Interpreting a 95% Confidence Interval
summaryYr procCount infCountAll numExpAll SIRAll SIRAll_pval SIRAll95CI
2011 4205 40 29.42 1.36 0.008 1.102, 1.496
Interpretation:
Key Point• We are 95% confident that the true SIR lies in the range 1.102 to 1.496
42

Interpreting Statistical Significance
CLABSIICU Type Observed
InfectionsExpected Infections
CL Days SIR SIR p-Value
95% Confidence
Interval
Interpretation
MICU 5 8.53 853 0.59 0.085 0.35, 1.20Not
statistically significant
PICU 1 0.852 125 ** ** **
Expected Infections < 1
so no SIR calculated
Key Point• For the MICU, we are 95% confident that the true SIR lies in the range 0.35 to 1.20
43
Interpreting Statistical Significance
SSIProcedure
TypeObserved Infections
Expected Infections
Number of Procedures
SIR SIR p-value
95% Confidence
Interval
Interpretation
Colon 6 12.14 5025 0.49 0.002 0.35 - 0.76 Statistically significant
Abdominal Hysterectomy 5 0.852 801 ** ** **
Expected Infections < 1
so no SIR calculated
Key Point• For colons, we are 95% confident that the true SIR lies in the range 0.35 to 0.76
44
Summary
• CDC recommends using SIR to report HAI
• At least 6 months of data is recommended to calculate an SIR
• SIR is a better method of risk adjusting
• Need at least 1 ‘expected’ HAI in order to generate an SIR
• 95% confidence interval shows the statistical significance of your SIR with a range of values
45

Helpful Links
Where can I find more information? • For a guide to the Standardized Infection Ratio (SIR) please visit:
http://www.cdc.gov/nhsn/PDFs/Newsletters/NHSN_NL_OCT_2010SE_final.pdf
• For in-depth Analysis Training, please visit: http://www.cdc.gov/nhsn/training.html
• For a Basic Analysis Quick Tips guide, please visit: http://www.cdc.gov/nhsn/PDFs/AnalysisBasics.pdf
46
47