Introduction to Statically Indeterminate ...gebland/CE 382/CE 382 PDF Lecture Slides/CE 38… ·...
60
Introduction to Statically Indeterminate Analysis Indeterminate Analysis S pport reactions and internal Support reactions and internal forces of statically determinate structures can be determined structures can be determined using only the equations of equilibrium. However, the analysis of statically indeter- minate structures requires additional equations based on additional equations based on the geometry of deformation of the structure. 1 the structure.
Transcript of Introduction to Statically Indeterminate ...gebland/CE 382/CE 382 PDF Lecture Slides/CE 38… ·...

Introduction to Statically Indeterminate AnalysisIndeterminate Analysis
S pport reactions and internalSupport reactions and internal forces of statically determinatestructures can be determinedstructures can be determined using only the equations of equilibrium. However, the analysis of statically indeter-minate structures requires additional equations based onadditional equations based on the geometry of deformation of the structure.
1
the structure.

Addi i l i fAdditional equations come from compatibility relationships, which ensure continuity ofwhich ensure continuity of displacements throughout the structure. The remaining gequations are constructed from member constitutive equations, i l ti hi b ti.e., relationships between stresses and strains and the integration of these equationsintegration of these equations over the cross section.
2

Design of an indeterminate t t i i d t istructure is carried out in an
iterative manner, whereby the (relative) sizes of the structural(relative) sizes of the structural members are initially assumed and used to analyze the structure. Based on the computed results (displacements and internal
b f ) th bmember forces), the member sizes are adjusted to meet governing design criteria Thisgoverning design criteria. This iteration process continues until the member sizes based on the results of an analysis are close to those assumed for that analysis.
3

Another consequence of statically indeterminatestatically indeterminate structures is that the relative variation of member sizes influences the magnitudes of the forces that the member will experience Stated inwill experience. Stated in another way, stiffness (large member size and/or high e be s e a d/o gmodulus materials) attracts force.
Despite these difficulties with statically indeterminate structures, an overwhelming majority of structures being b ilt t d t ti ll
4
built today are statically indeterminate.

Advantages Statically I d t i t St tIndeterminate Structures
5

Statically indeterminate structures typically result insmaller stresses and greater tiff ( ll d fl ti )
6
stiffness (smaller deflections) as illustrated for this beam.

Determinate beam is nstableDeterminate beam is unstable if middle support is removed or knocked off!
7
or knocked off!

Staticall indeterminateStatically indeterminate structures introduce redundancy, which may insure that failure inwhich may insure that failure in one part of the structure will not result in catastrophic or collapse
8failure of the structure.

Disadvantages of St ti ll I d t i tStatically Indeterminate
Structures
9

Statically indeterminate structure is self strained due to supportis self-strained due to support settlement, which produces stresses, as illustrated above.
10
st esses, as ust ated abo e

Statically indeterminate struc-tures are also self-strained due to temperature changes and f b i ti
11
fabrication errors.

Indeterminate Structures: I fl LiInfluence Lines
Influence lines for statically yindeterminate structures provide the same information as influence lines for statically determinate structures, i.e. it represents the magnitude of arepresents the magnitude of a response function at a particular location on the pstructure as a unit load moves across the structure.
12

Our goals in this chapter are:1.To become familiar with the
shape of influence lines for the t ti d i t lsupport reactions and internal
forces in continuous beams and framesand frames.
2.To develop an ability to sketch the appropriate shape ofthe appropriate shape of influence functions for indeterminate beams and frames.
3.To establish how to position distributed live loads on continuous structures to maximize response function
13
maximize response function values.

Qualitative Influence Li f St ti ll I dLines for Statically Inde-
terminate Structures: Muller Breslau’s PrincipleMuller-Breslau’s Principle
In many practical applications, it is usually sufficient to draw only the qualitative influence lines to d id h t l th lidecide where to place the live loads to maximize the response functions of interest Thefunctions of interest. The Muller-Breslau Principle pro-vides a convenient mechanism to construct the qualitative influence lines, which is stated as
14
as:

The influence line for a force (or moment) response function is ) pgiven by the deflected shape of the released structure by
i th di l tremoving the displacement constraint corresponding to the response function of interestresponse function of interest from the original structure and giving a unit displacement (or g g p (rotation) at the location and in the direction of the response f tifunction.
15

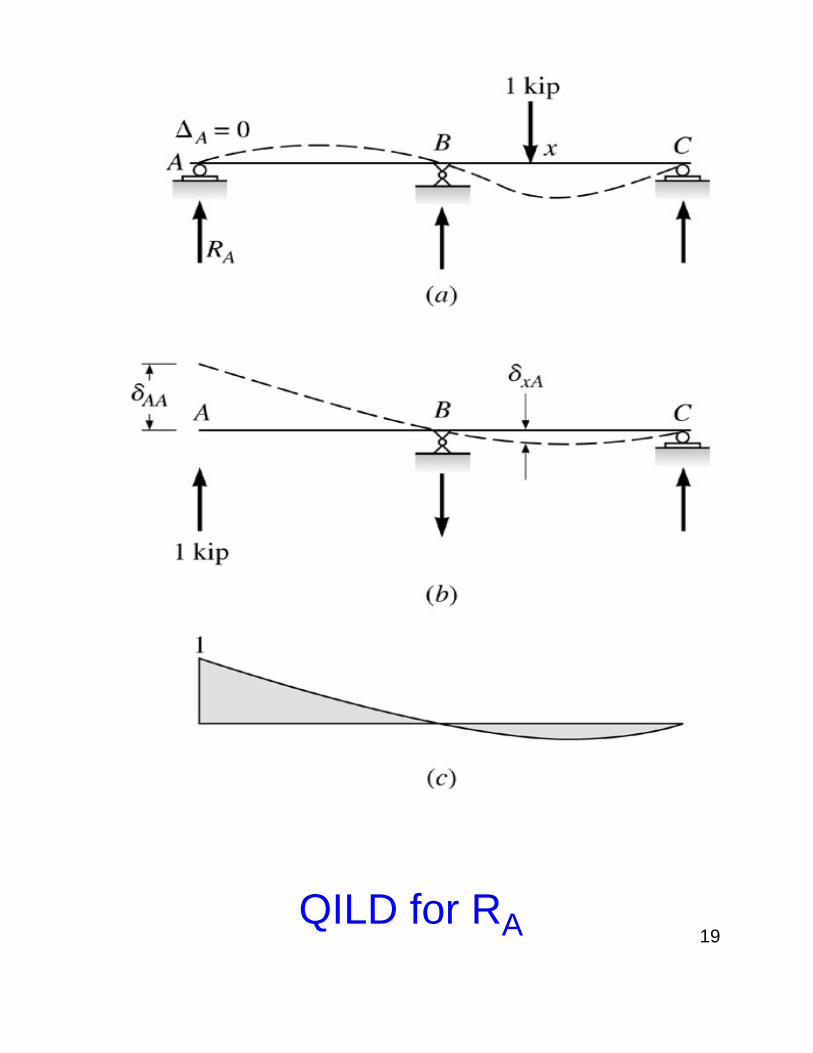
Procedure for constructing qualitative influence lines for indeterminate structures is: (1)
f th t t thremove from the structure the restraint corresponding to the response function of interest (2)response function of interest, (2)apply a unit displacement or rotation to the released structure at the release in the desired response function direction, and (3) dra the q alitati e deflected(3) draw the qualitative deflected shape of the released structure consistent with all remainingconsistent with all remaining support and continuity conditions.
16

Notice that this procedure is pidentical to the one discussed for statically determinate structures.
However, unlike statically determinate structures, the influence lines for statically indeterminate structures are t picall c r edtypically curved.
Placement of the live loads to maximize the desired response function is obtained from the qualitative ILD.
17

Uniformly distributed live yloads are placed over the positive areas of the ILD to maximize the drawn response function values. Because the influence line ordinates tend toinfluence line ordinates tend to diminish rapidly with distance from the response function plocation, live loads placed more than three span lengths away
b i d O h lican be ignored. Once the live load pattern is known, an indeterminate analysis of theindeterminate analysis of the structure can be performed to determine the maximum value of
18the response function.
19QILD for RA
20QILD’s for RC and VB

QILD’s for (MC)-, (MD)+ and RF
21
( D) a d F

Live Load Pattern to Maximize Forces in Multistory BuildingsBuilding codes specify that members of multistory buildings be designed to support a uniformly distributed live load as well as the deadlive load as well as the dead load of the structure. Dead and live loads are normallyand live loads are normally considered separately since the dead load is fixed in position whereas the live load must be varied to maximize a particular force at each section
22
particular force at each section of the structure. Such

maximum forces are typically produced by patterned loading.
Qualitative Influence Lines:1 Introduce appropriate unit1. Introduce appropriate unit
displacement at the desired response function location.p
2. Sketch the displacement diagram along the beam or g gcolumn line (axial force in column) appropriate for the
it di l t dunit displacement and assume zero axial deformation
23
deformation.

3. Axial column force (do not consider axial force in beams):
(a) Sketch the beam line qualitative displacement diagrams.
(b) Sketch the column line ( )qualitative displacement diagrams maintaining equality f th ti tof the connection geometry
before and after deformation.
24

4. Beam force:(a) Sketch the beam line qualitative displacement q pdiagram for which the release has been introduced.(b) Sketch all column line qualitative displacement diagrams maintainingdiagrams maintaining connection geometry before and after deformation Startand after deformation. Start the column line qualitative displacement diagrams from the beam line diagram of (a).
25

(c) Sketch remaining beam ( ) gline qualitative displacementdiagrams maintaining con-nection geometry before andafter deformation.
26

27
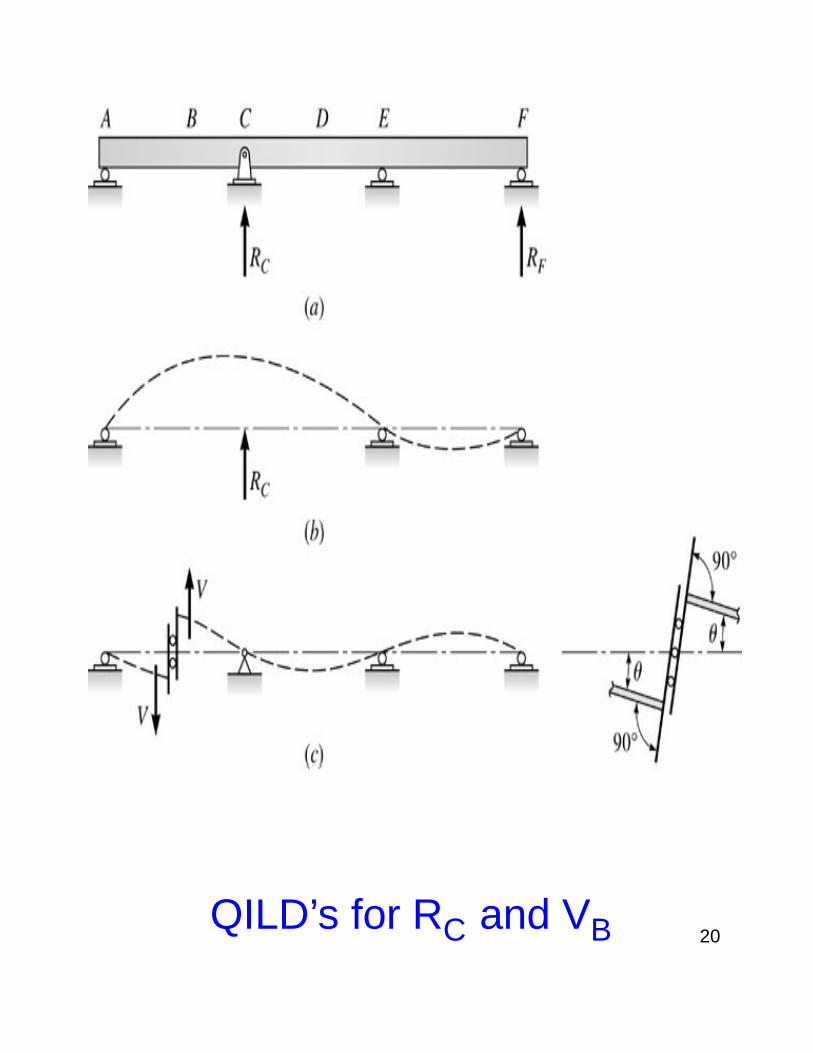
Vertical Reaction F
Load Pattern to Maximize F
Column Moment Load Pattern to28
Column Moment M
Load Pattern to Maximize M

QILD and Load Pattern for Center Beam Moment M
29

M
QILD and Load Pattern for End Beam Moment M
Expanded Detail pfor Beam End Moment
30

Envelope Curves
Design engineers often use i fl li t t t hinfluence lines to construct shear and moment envelope curves for continuous beams in buildings orcontinuous beams in buildings or for bridge girders. An envelope curve defines the extreme boundary values of shear or bending moment along the beam d t iti l l t fdue to critical placements of design live loads. For example, consider a three-spanconsider a three span continuous beam.
31

Qualitative influence lines for Qpositive moments are given, shear influence lines are presented later. Based on the qualitative influence lines, critical live load placement can belive load placement can be determined and a structural analysis computer program can y p p gbe used to calculate the member end shear and moment values f h d d l d d hfor the dead load case and the critical live load cases.
32

a b c ed
1 2 3 4
Three-Span Continuous BeamThree Span Continuous Beam
a b c ed
1 2 3 41 2 3 4
QILD for (Ma)+
a b c ed
1 2 3 4
QILD for (Mb)+
33
QILD for (Mb)

a b c ed
1 2 3 4
QILD for (M )+QILD for (Mc)
a b c ed
1 2 3 41 2 3 4
QILD for (Md)+
a b c ed
d
1 2 3 4
QILD for (M )+34
QILD for (Me)+

a b c ed
1 2 3 4
Critical Live Load Placementfor (M )+for (Ma)
a b c ed
1 2 3 4
Critical Live Load Placementfor (Ma)-
35

a b c ed
1 2 3 4
Critical Live Load Placementfor (M )+for (Mb)
a b c ed
1 2 3 4
Critical Live Load Placementfor (Mb)-
36

a b c ed
1 2 3 4
Critical Live Load Placementfor (M )+for (Mc)
a b c ed
1 2 3 4
Critical Live Load Placementfor (Mc)-
37

a b c ed
1 2 3 4
Critical Live Load Placementfor (M )+for (Md)
a b c ed
1 2 3 4
Critical Live Load Placementfor (Md)-
38

a b c ed
1 2 3 4
Critical Live Load Placementfor (M )+for (Me)
a b c ed
1 2 3 4
Critical Live Load Placementfor (Me)-
39

Calculate the moment envelope curve for the three-span continuous beam.
a b c ed
1 2 3 4L L L
L = 20’ = 240”E = 3 000 ksiE = 3,000 ksiA = 60 in2
I = 500 in4I 500 inwDL = 1.2 k/ft – dead loadw = 4 8 k/ft live load
40
wLL = 4.8 k/ft – live load

Shear and Moment Equations for a Loaded Span
qMi M
xiV
Mie
Vie = Vi – q xi
ViVie
ie i q i
Mie = -Mi + Vi xi – 0.5q (xi)2
Shear and Moment Equations for an Unloaded Span (set q = 0 in equations above)(set q = 0 in equations above)
Vie = Vi
41Mie = -Mi + Vi xi

Load CaseswDL
a b c ed
1 2 3 4LC11 2 3 4
wLL wLL
LC1
a b c ed
1 2 3 4LC21 2 3 4
wLL
LC2
a b c ed
1 2 3 4LC342
1 2 3 4LC3
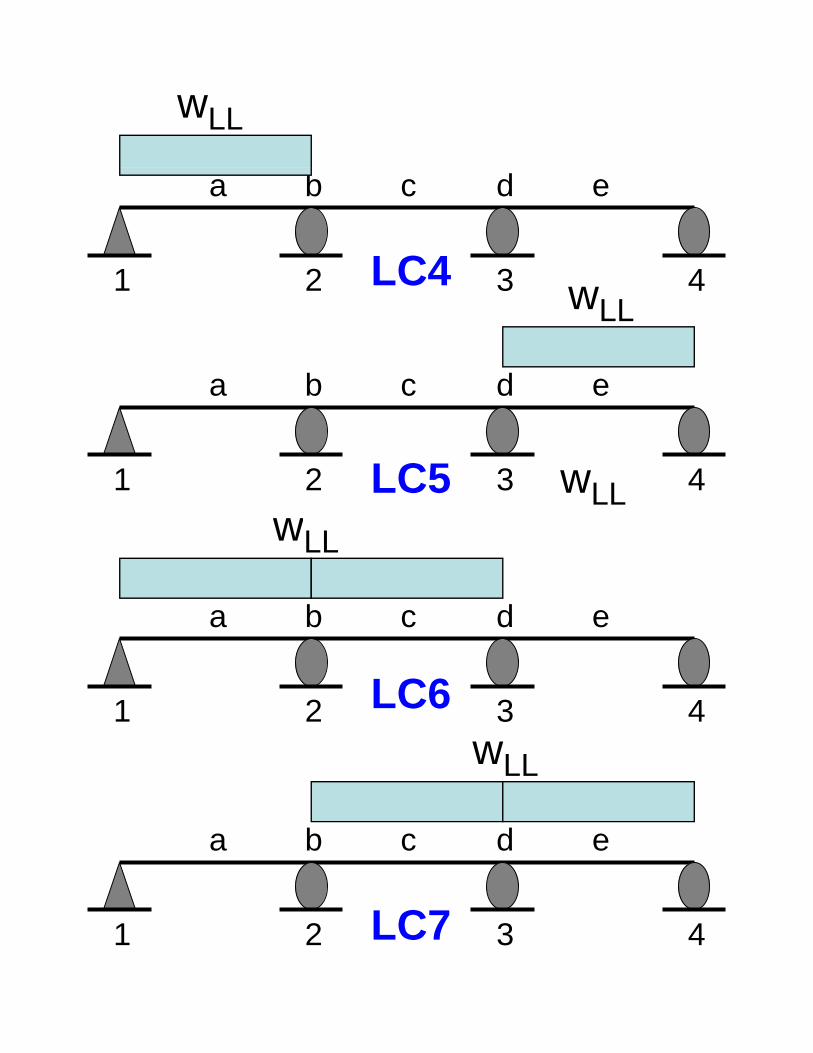
wLL
a b c ed
1 2 3 4LC4
a b c ed
1 2 3 4wLL
1 2 3 4w
wLLLC5
a b c ed
wLL
1 2 3 4wLL
LC6
a b c ed
LL
431 2 3 4LC7

A summary of the results from ythe statically indeterminate beam analysis for each of the seven load cases are given in your class notes.
----- RESULTS FOR LOAD SET: 1 ***** M E M B E R F O R C E S *****
MEMBER AXIAL SHEAR BENDINGMEMBER NODE FORCE FORCE MOMENT
(kip) (kip) (ft-k)
1 1 0.00 9.60 0.002 -0.00 14.40 -48.00
2 2 0 00 12 00 48 002 2 0.00 12.00 48.003 -0.00 12.00 -48.00
3 3 0.00 14.40 48.00
44
4 -0.00 9.60 0.00

The equations for the internal shear and bending moments for each span and each load case are:
Load Case 1
V12 = 9.6 – 1.2x112 1M12 = 9.6x1 – 0.6(x1)2
V23 = 12 – 1.2x2V23 12 1.2x2M23 = -48 + 12x2 – 0.6(x2)2
V = 14 4 – 1 2xV34 = 14.4 – 1.2x3M34 = -48 + 14.4x3 – 0.6(x3)2
45

Load Case 2
V 43 2 4 8V12 = 43.2 – 4.8x1M12 = 43.2x1 – 2.4(x1)2
V23 = 0M23 = -96
V34 = 52.8 – 4.8x3M34 = -96 + 52.8x3 – 2.4(x3)2
Load Case 3
V = -4 8V12 = -4.8 M12 = -4.8x1
V = 48 4 8xV23 = 48 – 4.8x2M23 = -96 + 48x2 – 2.4(x2)2
V 4 846
V34 = 4.8M34 = -96 + 4.8x3

Load Case 4
V 41 6 4 8V12 = 41.6 – 4.8x1M12 = 41.6x1 – 2.4(x1)2
V23 = 8M23 = -128 + 8x2
V34 = -1.60M34 = 32 - 1.6x3
Load Case 5
V = 1 6V12 = 1.6M12 = 1.6x1
V = 8V23 = -8M23 = 32 - 8x2
V 54 4 4 847
V34 = 54.4 – 4.8x3M34 = -128 + 54.4x3 – 2.4(x3)2

Load Case 6
V12 = 36.8 – 4.8x1M12 = 36.8x1 – 2.4(x1)2
V23 = 56 – 4.8x2M23 = -224 + 56x2 – 2.4(x2)2
V34 = 3.2M34 = -64 + 3.2x3
Load Case 7
V = -3 2V12 = -3.2M12 = -3.2x1
V = 40 4 8xV23 = 40 – 4.8x2M23 = -64 + 40x2 – 2.4(x2)2
V 59 2 4 848
V34 = 59.2 – 4.8x3M34 = -224 + 59.2x3 – 2.4(x3)2

Bending Moment Diagram LC1
49

50

51

52

53
Live Load E-Mom (+) Live Load E-Mom (-)

A spreadsheet program listing is included in your class notes thatincluded in your class notes that gives the moment values along the span lengths and is used to p ggraph the moment envelope curves.
In the spreadsheet:
Li L d E M ( )Live Load E-Mom (+)= max (LC2 through LC7)
Live Load E-Mom (-)Live Load E-Mom (-)= min (LC2 through LC7)
Total Load E Mom (+) = LC1Total Load E-Mom (+) = LC1+ Live Load E-Mom (+)
Total Load E-Mom (-) = LC154
ota oad o ( ) C+ Live Load E-Mom (-)

55
Total Load E-Mom (+) Total Load E-Mom (-)

Construction of the shear l f ll thenvelope curve follows the same
procedure. However, just as is the case with a bending momentthe case with a bending moment envelope, a complete analysis should also load increasing/ decreasing fractions of the span where shear is being considered.
56

a b c ed
1
a b c ed
1 2 3 4
QILD (V1)+
a b c ed
1 2 3 41 2 3 4-1
QILD (V2L)+
1
a b c ed
1
1 2 3 4
QILD (V2R)+
57
QILD (V2 )

a b c ed
1 2 3 4-1 QILD (V3
L)+QILD (V3 )
b d
1
a b c ed
1 2 3 4
QILD (V3R)+
a b c ed
1 2 3 4-1
QILD (V4)+
58
( 4)

Shear ILD Notation:Superscript L = just to the left of p p j
the subscript pointSuperscript R = just to the right p p j g
of the subscript point
To obtain the negative shear qualitative influence line dia-
i l fli th dgrams simply flip the drawn positive qualitative influence line diagramsdiagrams.
59

In practice the construction of theIn practice, the construction of the exact shear envelope is usually unnecessary since an approximate envelope obtained by connecting the maximum possible shear at the reactions ith the ma im mreactions with the maximum possible value at the center of the spans is sufficiently accurate Ofspans is sufficiently accurate. Of course, the dead load shear must be added to the live load shear envelope.
60