
Introduction to SparkR
25
-
Upload
ankara-big-data-meetup -
Category
Data & Analytics
-
view
230 -
download
0
Transcript of Introduction to SparkR
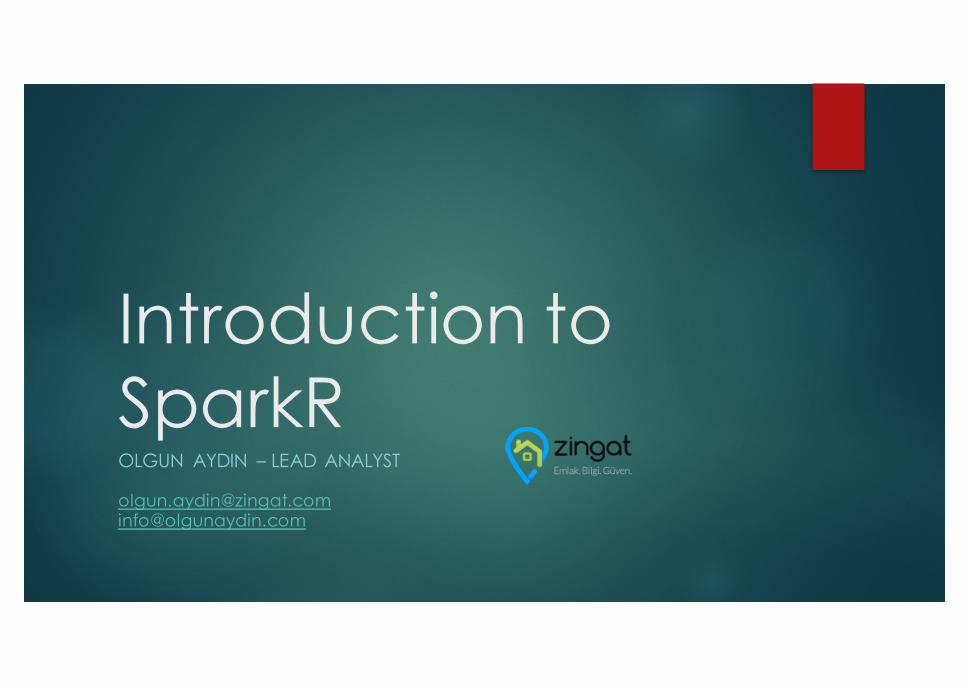
Outline
u Installation and Creating a SparkContext
u Getting Data
u SQL queries in SparkR
u DataFrames
u Application Examples
u Correlation Analysisu Time Series Analysis
u K-Means
Power of
u Fast
u Powerful
u Scalable
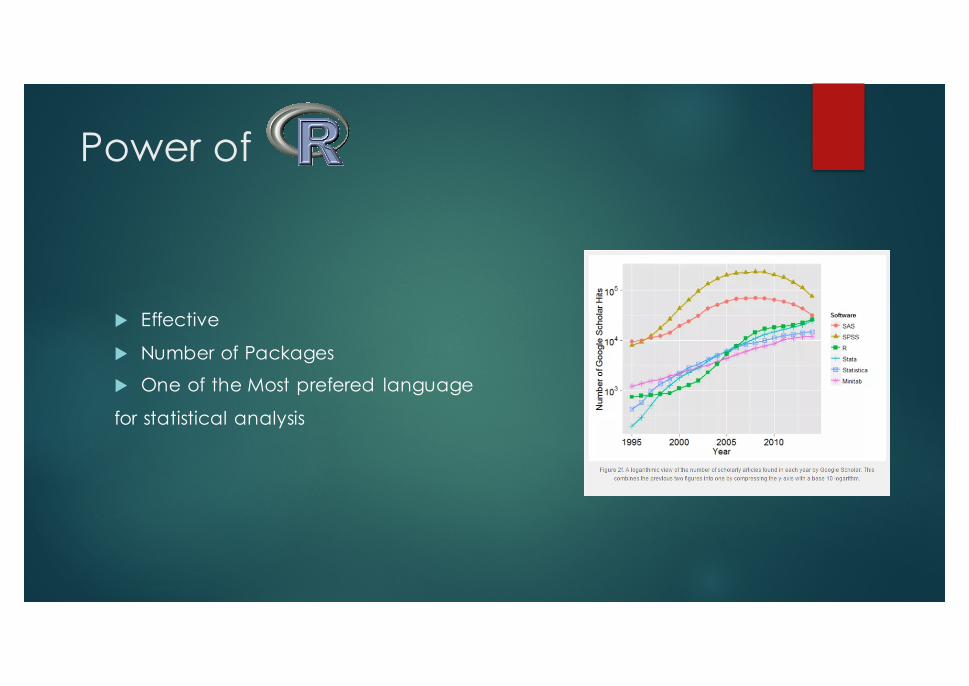
Power of
u Effective
u Number of Packages
u One of the Most prefered language
for statistical analysis
Power of
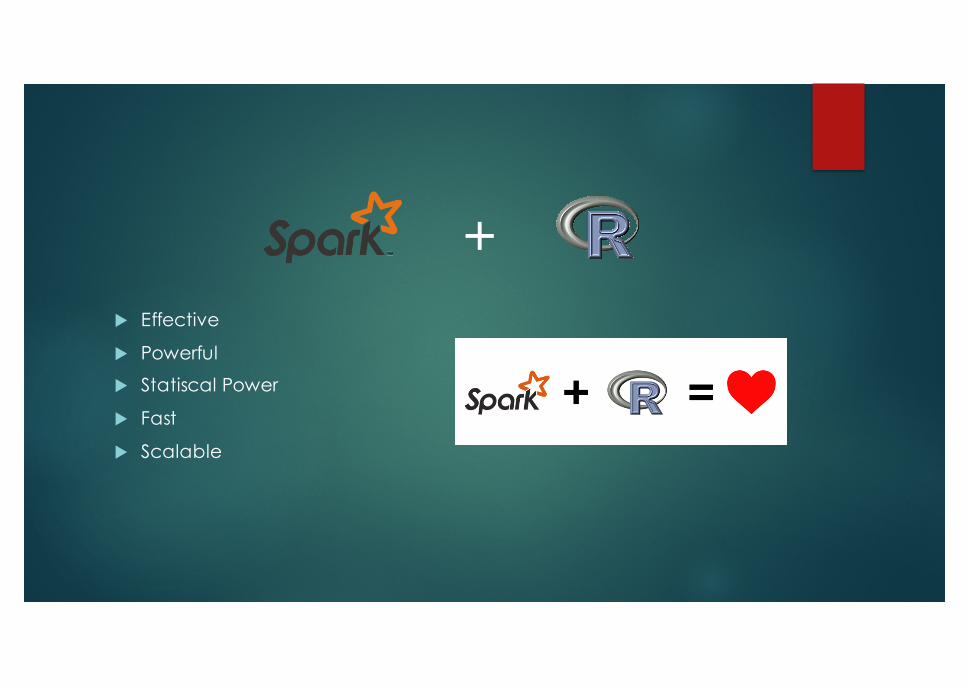
u Effective
u Powerful
u Statiscal Power
u Fast
u Scalable
+
u SparkR, an R package that provides a frontend to Apache Spark and uses Spark’s distributed computation engine to enable large scale data analysis from the R Shell.
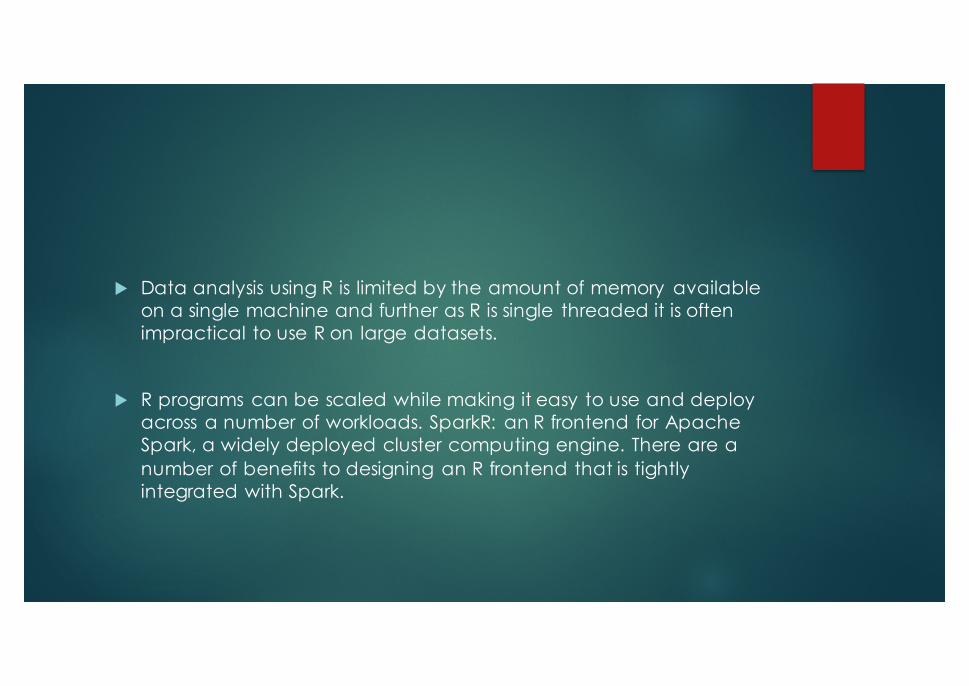
u Data analysis using R is limited by the amount of memory available on a single machine and further as R is single threaded it is often impractical to use R on large datasets.
u R programs can be scaled while making it easy to use and deploy across a number of workloads. SparkR: an R frontend for Apache Spark, a widely deployed cluster computing engine. There are a number of benefits to designing an R frontend that is tightly integrated with Spark.
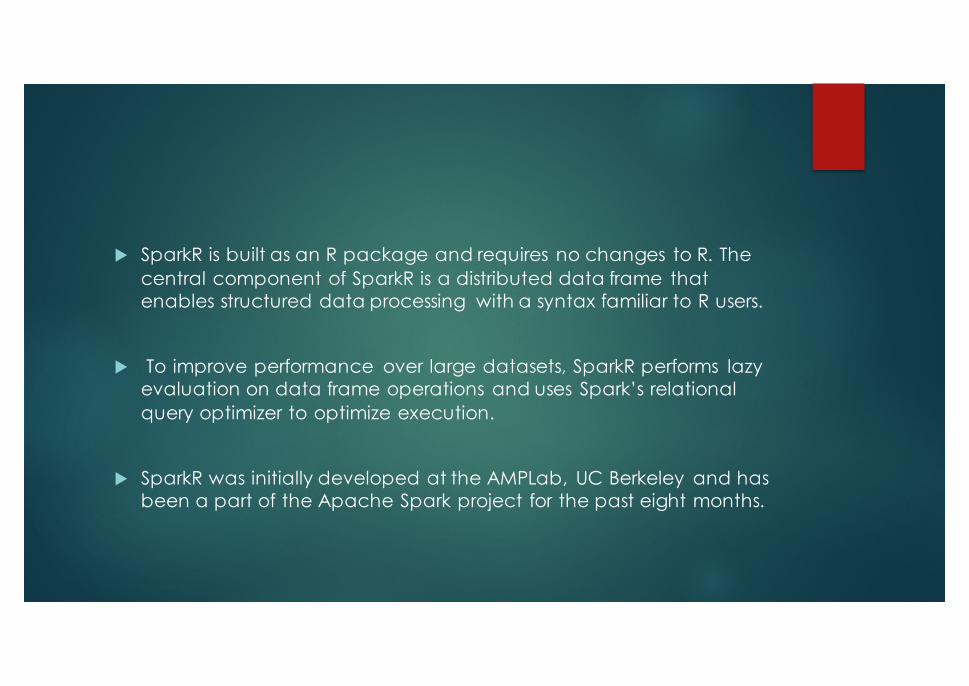
u SparkR is built as an R package and requires no changes to R. The central component of SparkR is a distributed data frame that enables structured data processing with a syntax familiar to R users.
u To improve performance over large datasets, SparkR performs lazy evaluation on data frame operations and uses Spark’s relational query optimizer to optimize execution.
u SparkR was initially developed at the AMPLab, UC Berkeley and has been a part of the Apache Spark project for the past eight months.
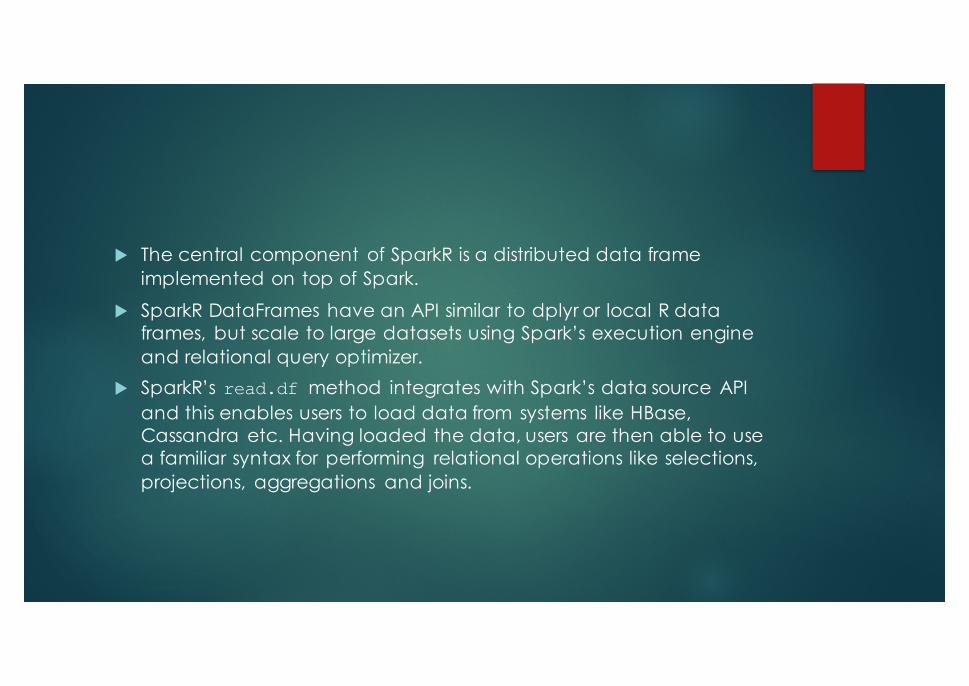
u The central component of SparkR is a distributed data frame implemented on top of Spark.
u SparkR DataFrames have an API similar to dplyr or local R data frames, but scale to large datasets using Spark’s execution engine and relational query optimizer.
u SparkR’s read.df method integrates with Spark’s data source API and this enables users to load data from systems like HBase, Cassandra etc. Having loaded the data, users are then able to use a familiar syntax for performing relational operations like selections, projections, aggregations and joins.
u Further, SparkR supports more than 100 pre-defined functions on DataFrames including string manipulation methods, statistical functions and date-time operations. Users can also execute SQL queries directly on SparkR DataFrames using the sql command. SparkR also makes it easy for users to chain commands using existing R libraries.
u Finally, SparkR DataFrames can be converted to a local R data frame using the collect operator and this is useful for the big data, small learning scenarios described earlier
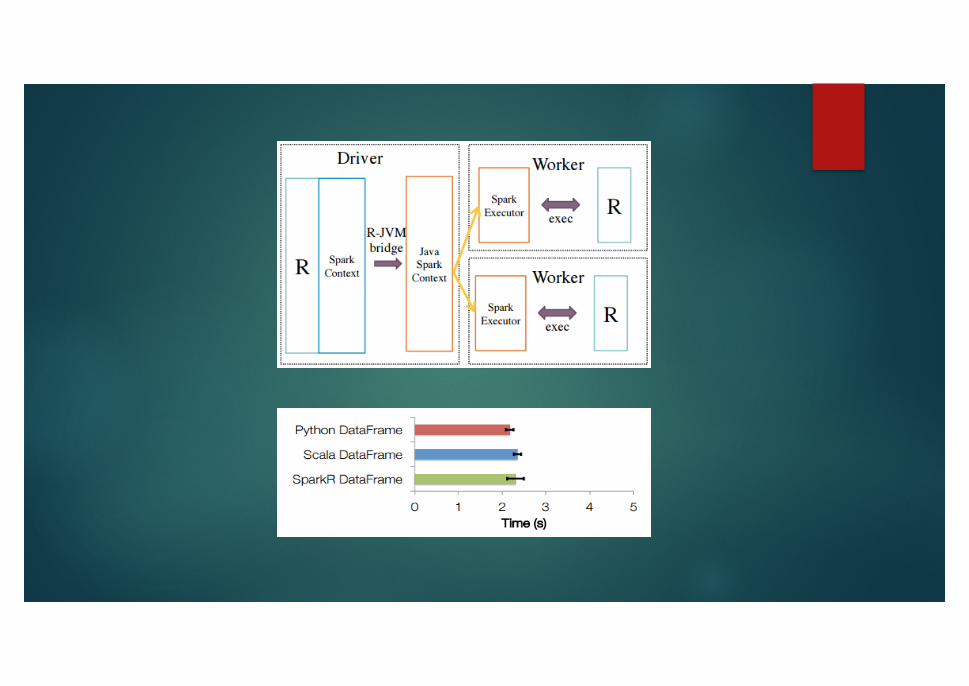
u SparkR’s architecture consists of two main components an R to JVM binding on the driver that allows R programs to submit jobs to a Spark cluster and support for running R on the Spark executors.
Installation and Creating a SparkContext
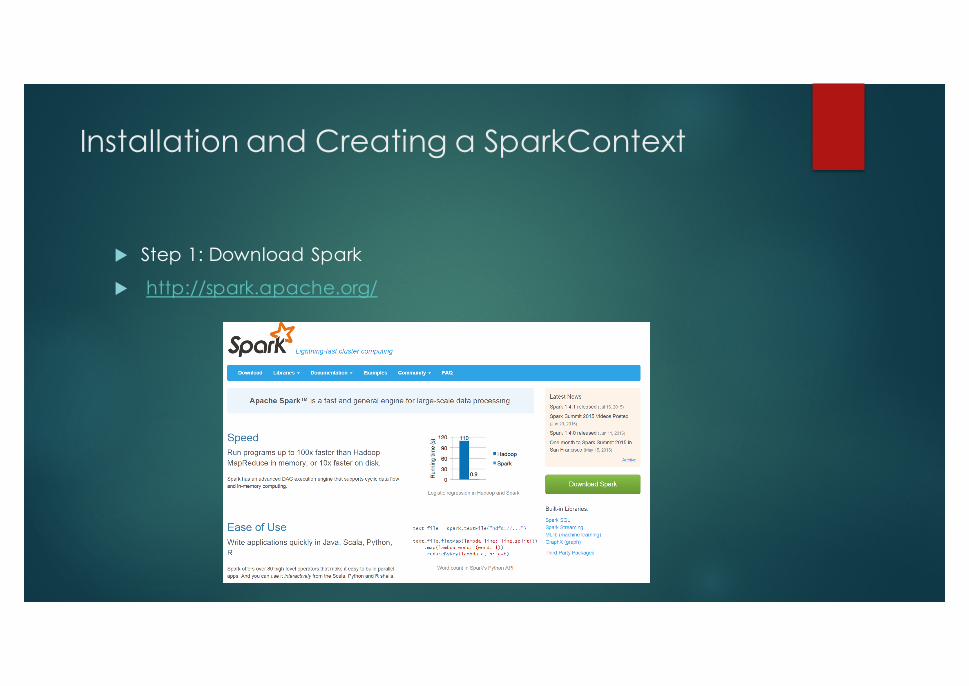
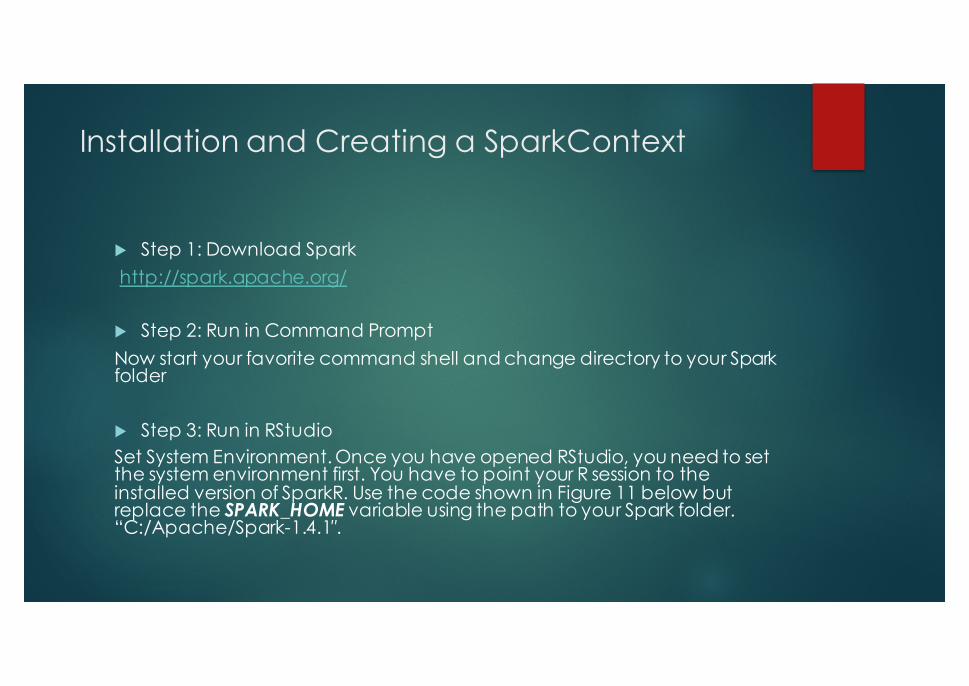
u Step 1: Download Spark
u http://spark.apache.org/
Installation and Creating a SparkContext
u Step 1: Download Sparkhttp://spark.apache.org/
u Step 2: Run in Command PromptNow start your favorite command shell and change directory to your Spark folder
u Step 3: Run in RStudioSet System Environment. Once you have opened RStudio, you need to set the system environment first. You have to point your R session to the installed version of SparkR. Use the code shown in Figure 11 below but replace the SPARK_HOME variable using the path to your Spark folder. “C:/Apache/Spark-1.4.1″.
Installation and Creating a SparkContext
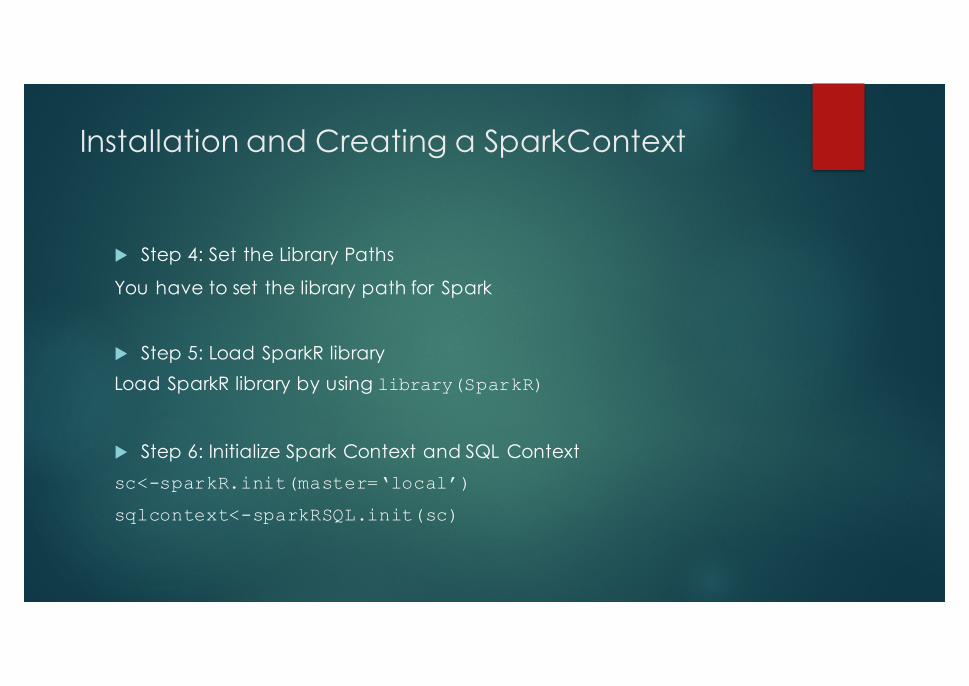
u Step 4: Set the Library Paths
You have to set the library path for Spark
u Step 5: Load SparkR libraryLoad SparkR library by using library(SparkR)
u Step 6: Initialize Spark Context and SQL Contextsc<-sparkR.init(master=‘local’)
sqlcontext<-sparkRSQL.init(sc)
Getting Data
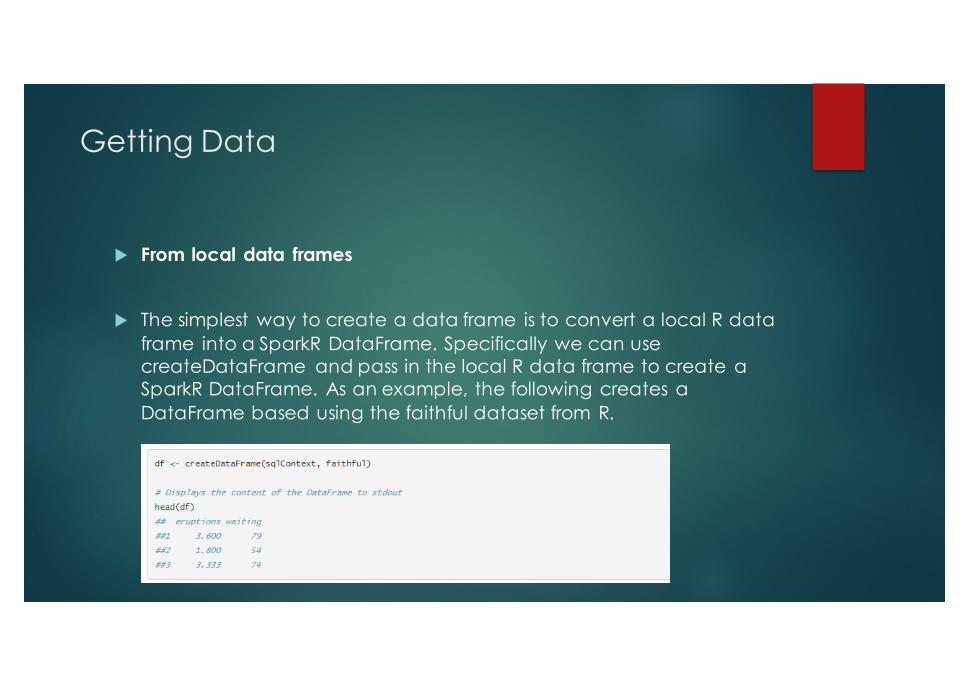
u From local data frames
u The simplest way to create a data frame is to convert a local R data frame into a SparkR DataFrame. Specifically we can use createDataFrame and pass in the local R data frame to create a SparkR DataFrame. As an example, the following creates a DataFrame based using the faithful dataset from R.
Getting Data
u From Data Sourcesu SparkR supports operating on a variety of data sources through the
DataFrame interface. This section describes the general methods for loading and saving data using Data Sources. You can check the Spark SQL programming guide for more specific options that are available for the built-in data sources.
u The general method for creating DataFrames from data sources is read.df.
u This method takes in the SQLContext, the path for the file to load and the type of data source.
u SparkR supports reading JSON and Parquet files natively and through Spark Packages you can find data source connectors for popular file formats like CSV and Avro.
Getting Data
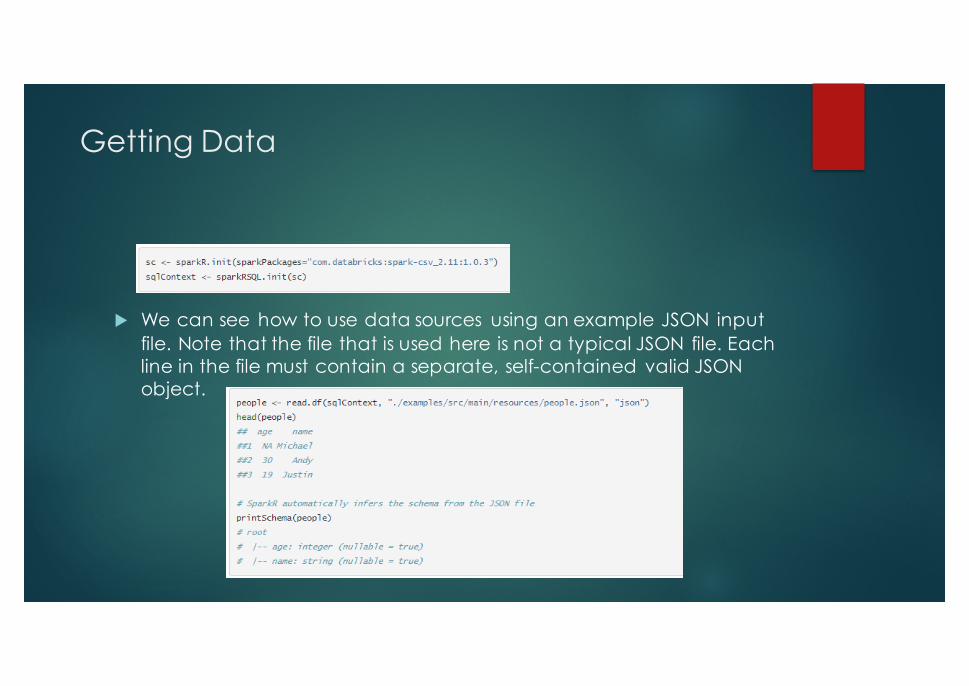
u We can see how to use data sources using an example JSON input file. Note that the file that is used here is not a typical JSON file. Each line in the file must contain a separate, self-contained valid JSON object.
Getting Data
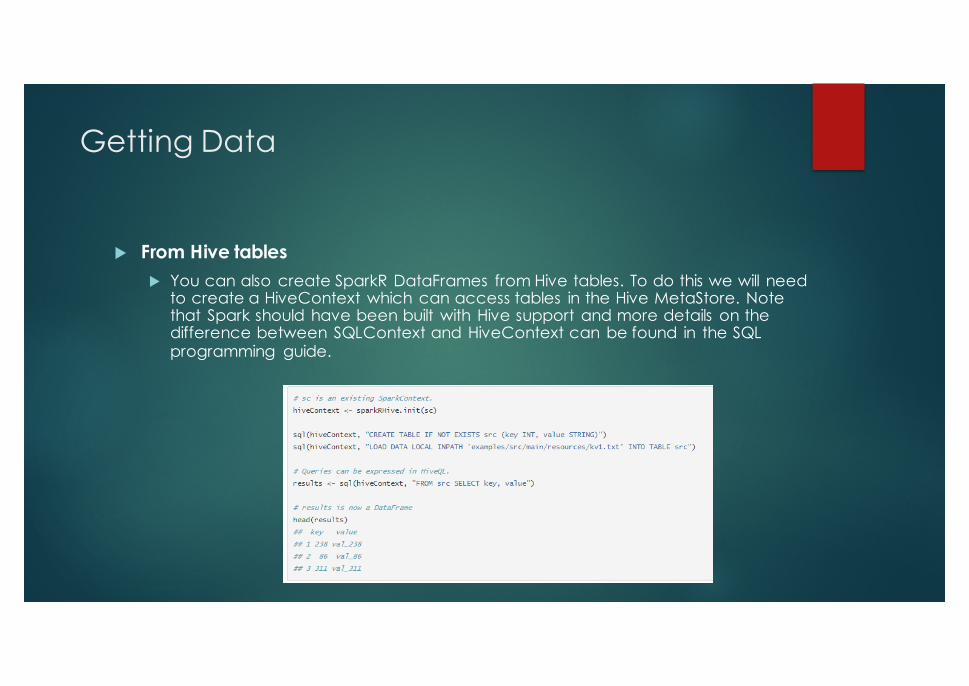
u From Hive tablesu You can also create SparkR DataFrames from Hive tables. To do this we will need
to create a HiveContext which can access tables in the Hive MetaStore. Note that Spark should have been built with Hive support and more details on the difference between SQLContext and HiveContext can be found in the SQL programming guide.
SQL queries in SparkR
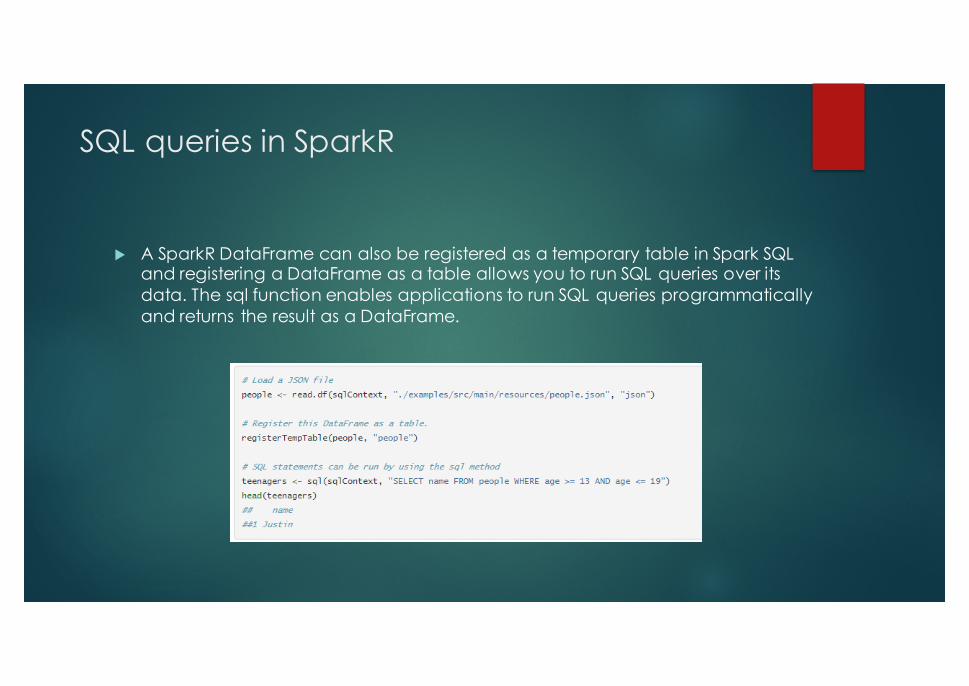
u A SparkR DataFrame can also be registered as a temporary table in Spark SQL and registering a DataFrame as a table allows you to run SQL queries over its data. The sql function enables applications to run SQL queries programmatically and returns the result as a DataFrame.
DataFrames
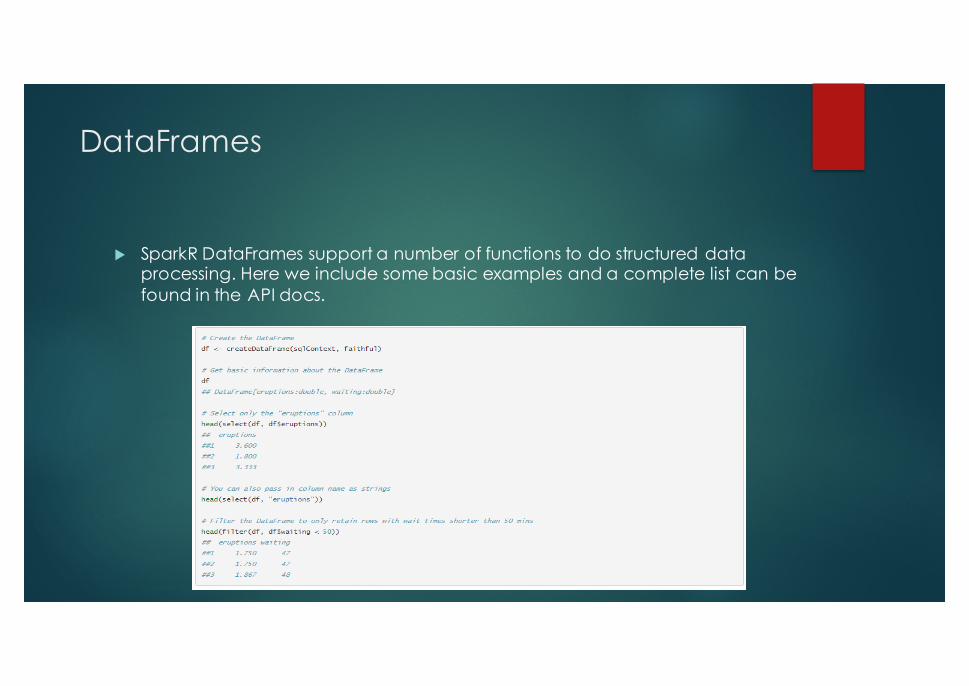
u SparkR DataFrames support a number of functions to do structured data processing. Here we include some basic examples and a complete list can be found in the API docs.
DataFrames
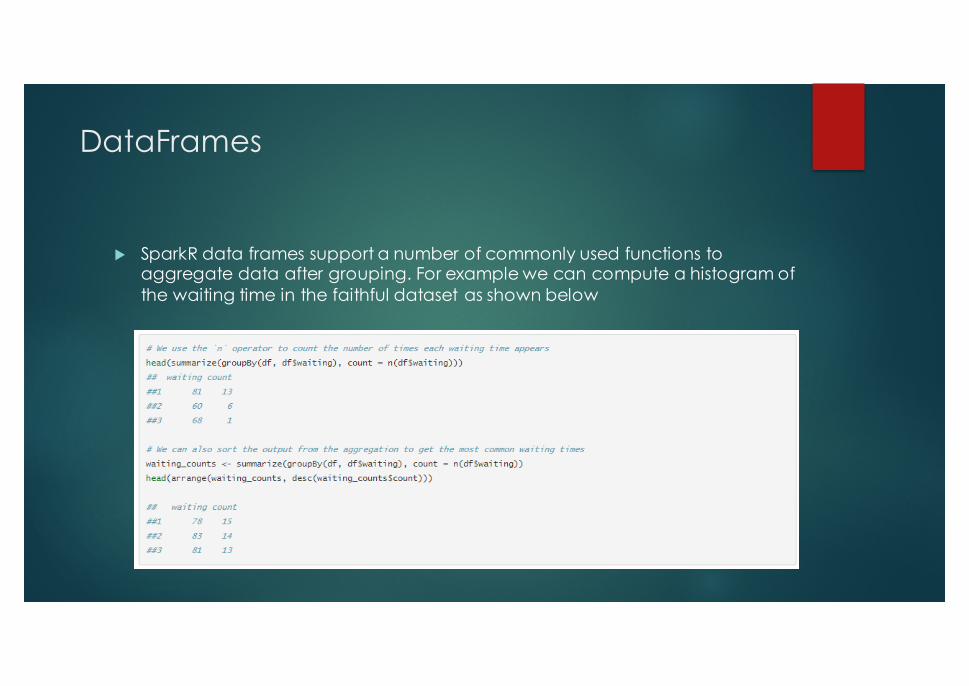
u SparkR data frames support a number of commonly used functions to aggregate data after grouping. For example we can compute a histogram of the waiting time in the faithful dataset as shown below
DataFrames
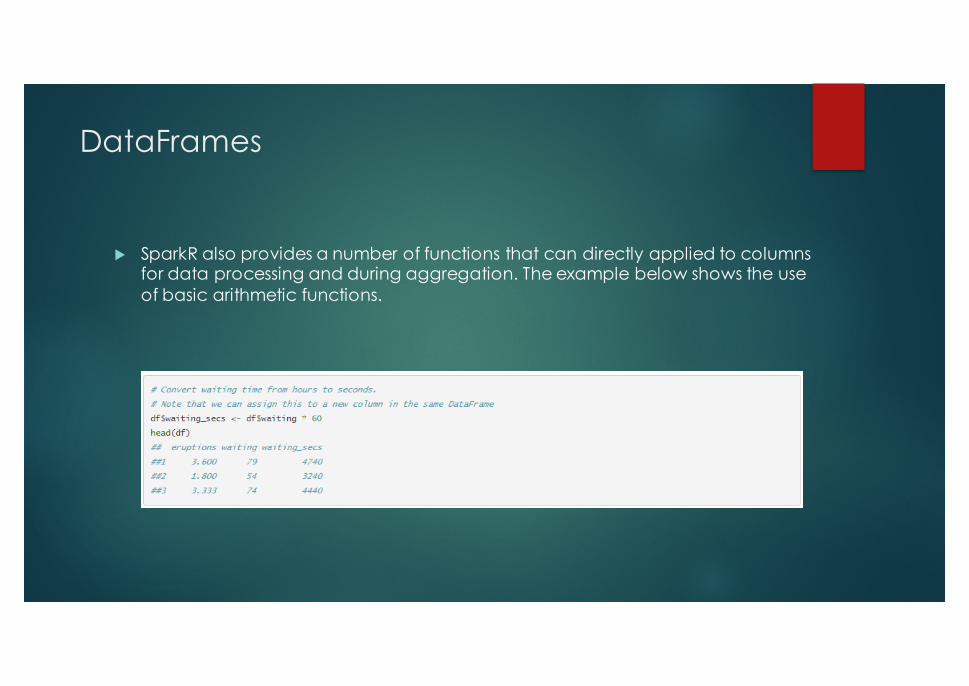
u SparkR also provides a number of functions that can directly applied to columns for data processing and during aggregation. The example below shows the use of basic arithmetic functions.
Application
u http://www.transtats.bts.gov/Tables.asp?DB_ID=120