Introduction to Social Network Analysis s with Pajekmrvar.fdv.uni-lj.si/sola/dr/slideseng1.pdf ·...
63
A. Mrvar: Social Network Analysis 1 ✬ ✫ ✩ ✪ Introduction to Social Network Analysis with Pajek Andrej Mrvar Faculty of Social Sciences Ljubljana Postgraduate study - 3rd cycle ▲ ▲ ❙ ▲ ● ▲ ❙ ▲ ▲ ☛✖
Transcript of Introduction to Social Network Analysis s with Pajekmrvar.fdv.uni-lj.si/sola/dr/slideseng1.pdf ·...
A. Mrvar: Social Network Analysis 1'
&
$
%
Introduction toSocial Network Analysiswith Pajek
Andrej MrvarFaculty of Social SciencesLjubljana
Postgraduate study - 3rd cycle
s s y s l s y ss * 6
A. Mrvar: Social Network Analysis 2'
&
$
%
IntroductionLet U = {X1, X2, . . . , Xn} be a finite set of units. Connections amongunits are described using one or more binary relations Rt ⊆ U× U, t =
1, . . . , r, which determine a network N = (U, R1, R2, . . . , Rr).
Example: A relation can represent friendship, negative relation, kinshiprelation (. . .is a child of. . ., . . .is a daughter of . . ., . . .is married to. . .),citations. . .
In the following we will use mostly one relation R.
XiRXj is read as:unit Xi is in relation R with unit Xj .
Example: if R corresponds to relation ’liking’, then XiRXj , means thatperson Xi likes person Xj .
s s y s l s y ss * 6

A. Mrvar: Social Network Analysis 3'
&
$
%
Relations can have additional properties:
• reflexive relation: ∀x ∈ U : xRx
• irreflexive relation: ∀x ∈ U : ¬xRx
• symmetric relation: ∀x, y ∈ U : (xRy ⇒ yRx) (marriage)
• asymmetric relation: ∀x, y ∈ U : ¬(xRy ∧ yRx) (is a son of)
• antisymmetric relation: ∀x, y ∈ U : (xRy ∧ yRx⇒ x = y)
• transitive relation: ∀x, y, z ∈ U : (xRy ∧ yRz ⇒ xRz)
• intransitive relation: ∀x, y, z ∈ U : (xRy ∧ yRz ⇒ ¬xRz)
• comparable relation: ∀x, y ∈ U : (x 6= y ⇒ xRy ∨ yRx)
• strictly comparable relation: ∀x, y ∈ U : (xRy ∨ yRx)
• partial ordering: a reflexive, antisymmetric and transitive relation;
• equivalence relation: a reflexive, symmetric and transitive relation.
s s y s l s y ss * 6
A. Mrvar: Social Network Analysis 4'
&
$
%
A network defined using relation R can be represented in different ways:
• Representation using corresponding binary matrixR = [rij ]n×n, where
rij =
{1 XiRXj
0 otherwise
Sometimes rij is a real number, expressing the strength of relation R betweenunits Xi in Xj .
• list of neighboursA network can be described by specifying the list of all other units with whichthe unit is in relation.
• description by a graph G = (V,L) where V is set of vertices and L set of(directed or undirected) lines. Vertices represent units of a network, linesrepresent the relation. A graph is usually represented by a picture: vertices aredrawn as small circles, directed lines are drawn as arcs and undirected lines asedges connecting the corresponding two vertices.
s s y s l s y ss * 6
A. Mrvar: Social Network Analysis 5'
&
$
%
XiRXj ⇒ there exists directed line from unit Xi to Xj in correspond-ing graph. Vertex Xi is called initial, vertex Xj is called terminalvertex.
A line whose initial and terminal vertices are the same is called a loop.
If directed lines between two vertices exist in both directions, they aresometimes replaced by a single undirected line.
Sometimes we do the opposite: an undirected line is replaced by twodirected lines in opposite directions.
We will denote the number of vertices in a graph with n, and numberof directed lines with m.
s s y s l s y ss * 6

A. Mrvar: Social Network Analysis 6'
&
$
%
1 2 3 4 5
1 0 1 0 1 1
2 0 0 1 0 0
3 1 0 0 1 0
4 0 0 0 0 1
5 1 0 0 0 0
Arcslist
1: 2 4 5
2: 3
3: 1 4
4: 5
5: 1
1
2
3
4
5
s s y s l s y ss * 6
A. Mrvar: Social Network Analysis 7'
&
$
%
Types of networks• undirected network – the relation is symmetric – all lines are undirected –
edges, L = E.
• directed network – the relation is not symmetric – all lines are directed – arcs,L = A.
• mixed network – both arcs and edges exist in a corresponding graph –L = A ∪ E.
• two-mode networkA two-mode network consists of two sets of units (e. g. people and events),relation connects the two sets, e. g. participation of people in social events.
s s y s l s y ss * 6
A. Mrvar: Social Network Analysis 8'
&
$
%
Small and large networks
Networks with some 10 units and lines are called small networks, while networkswith some 1000 units and lines are called large networks.
Dense and sparse networks
A network is called sparse if the number of lines in the corresponding graph is ofthe same order as the number of vertices (n ≈ km). Large networks that are sparsecan still be efficiently analysed with some algorithms. In real life we often find verylarge but sparse networks.
In general, the number of lines can be much higher than the number of vertices.Such networks are called dense.
If every unit is connected to every other unit the number of lines is n2 (number ofelements in matrix).
If every unit is connected to every other unit except to itself (graph without loops),the number of lines is n(n− 1) (number of elements in matrix without diagonal).
s s y s l s y ss * 6
A. Mrvar: Social Network Analysis 9'
&
$
%
According to that the density of a network can be defined:
For networks with loops:
Density1 =m
n2
For networks without loops:
Density2 =m
n(n− 1)
If at most one line can exist among any two vertices the density is a real numberbetween 0 and 1.
Density of a network is one of the measures by which we can compare differentnetworks.
s s y s l s y ss * 6

A. Mrvar: Social Network Analysis 10'
&
$
%
Example of large networks• social networks
– connections among people (friendship);
– relation among political parties;
– trade among organizations, countries;
– genealogies;
– citation networks;
– computer networks (local networks, Internet, links among home pages);
– telephone calls;
• flow charts in computer science;
• Petri nets;
• organic molecule in chemistry;
• connections among words in text;
• transportation networks (airlines, streets, electric networks. . . ).
s s y s l s y ss * 6
A. Mrvar: Social Network Analysis 11'
&
$
%
PajekPajek is a program package for Windows 32 and64, which enables analyses of large networks. Pro-gram is freely available at:http://mrvar.fdv.uni-lj.si/pajek/
de Nooy, Mrvar, Batagelj (2018):Exploratory Social Network Analysis with Pajek:Revised and Expanded Edition for Updated Software.Third Edition.Cambridge University Press, New York.
s s y s l s y ss * 6

A. Mrvar: Social Network Analysis 12'
&
$
%
Analyses in Pajek are performed using six data structures:
1. network,
2. partition,
3. cluster,
4. permutation,
5. vector,
6. hierarchy.
s s y s l s y ss * 6

A. Mrvar: Social Network Analysis 13'
&
$
%
Main goals in designing PajekThe main goals in the design of Pajek are:
• to support abstraction by (recursive) decomposition of a large network intoseveral smaller networks that can be treated further using more sophisticatedmethods;
• to provide the user with some powerful visualization tools;
• to implement a selection of efficient (subquadratic) algorithms for analysis oflarge networks.
s s y s l s y ss * 6

A. Mrvar: Social Network Analysis 14'
&
$
%s s y s l s y ss * 6

A. Mrvar: Social Network Analysis 15'
&
$
%
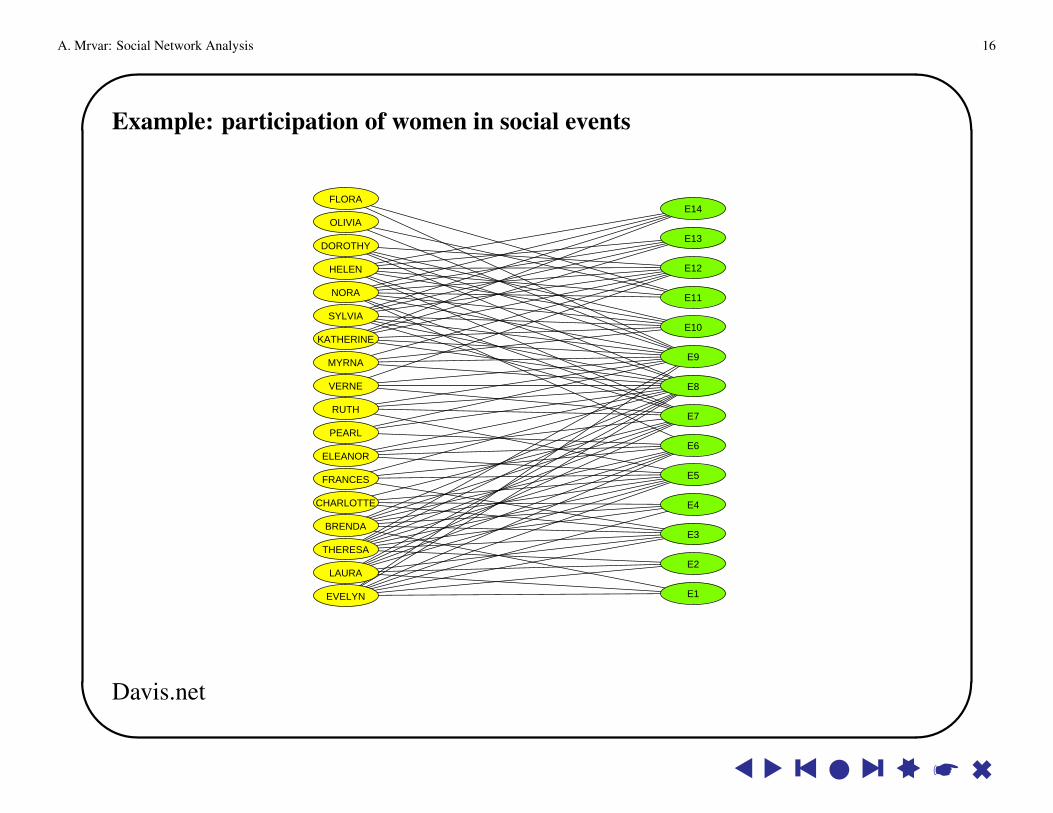
Two-mode networksA two-mode network consists of two sets of units (e. g. people and events), relationconnects the two sets, e. g. participation of people in social events.
There exist several two-mode networks:
• Membership in institutions - people, institutions, is a member, e.g. directorsand commissioners on the boards of corporations.
• Voting for suggestions - polititians, suggestions, votes for.
• ’Buying articles in the shop’, where first set consists of consumers, the secondof articles, the connection tells which article was bought by a consumer.
• Readers and magazines.
• Citation network, where first set consists of authors,the second set consists of articles/papers,connection is a relation author cites a paper.
• Co-autorship networks - authors, papers, is a (co)author.
A corresponding graph is called bipartite graph – lines connect only vertices fromone to vertices from another set – inside sets there are no connections.
s s y s l s y ss * 6
A. Mrvar: Social Network Analysis 16'
&
$
%
Example: participation of women in social events
EVELYN
LAURA
THERESA
BRENDA
CHARLOTTE
FRANCES
ELEANOR
PEARL
RUTH
VERNE
MYRNA
KATHERINE
SYLVIA
NORA
HELEN
DOROTHY
OLIVIA
FLORA
E1
E2
E3
E4
E5
E6
E7
E8
E9
E10
E11
E12
E13
E14
Davis.net
s s y s l s y ss * 6
A. Mrvar: Social Network Analysis 17'
&
$
%
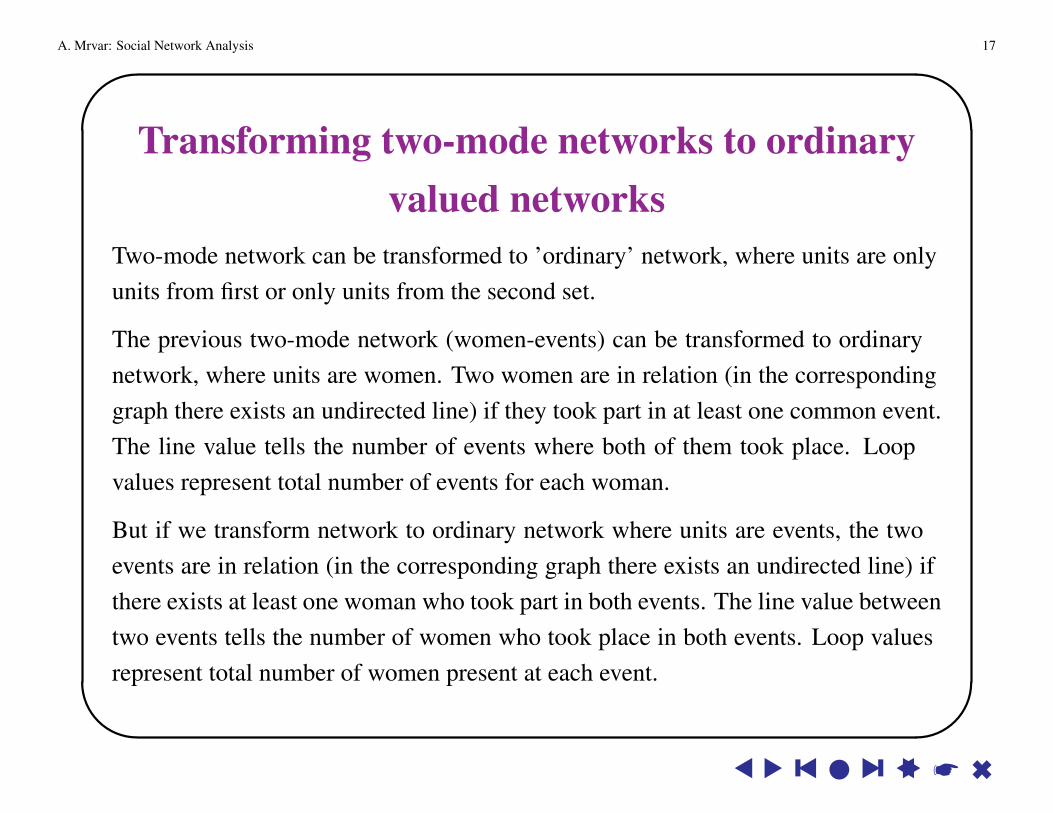
Transforming two-mode networks to ordinaryvalued networks
Two-mode network can be transformed to ’ordinary’ network, where units are onlyunits from first or only units from the second set.
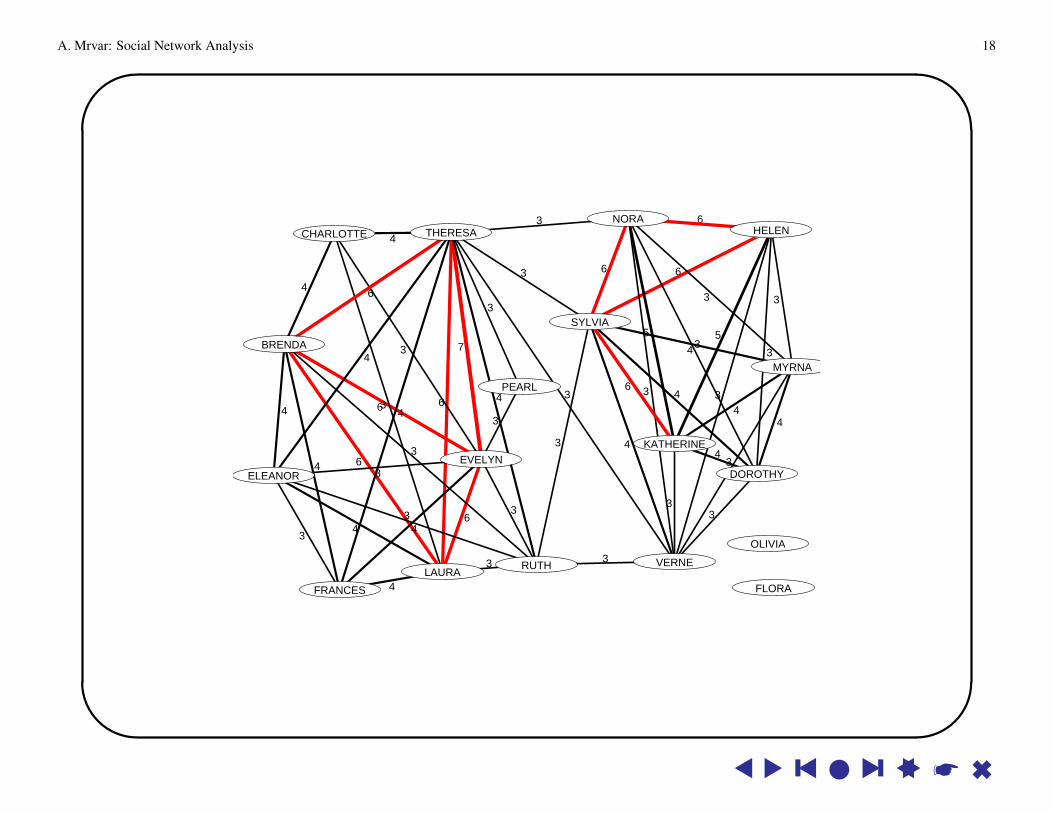
The previous two-mode network (women-events) can be transformed to ordinarynetwork, where units are women. Two women are in relation (in the correspondinggraph there exists an undirected line) if they took part in at least one common event.The line value tells the number of events where both of them took place. Loopvalues represent total number of events for each woman.
But if we transform network to ordinary network where units are events, the twoevents are in relation (in the corresponding graph there exists an undirected line) ifthere exists at least one woman who took part in both events. The line value betweentwo events tells the number of women who took place in both events. Loop valuesrepresent total number of women present at each event.
s s y s l s y ss * 6
A. Mrvar: Social Network Analysis 18'
&
$
%
6
6
6
7
6
4
4
4
4
3
3
6
4
4
3
3
4
3
3
3
4
4
4
3
3
3
3
3
6
6
3
3
3
3 4
3
6
3
4
4
4
3
3
3
4
4
3
6
5
3
53
EVELYN
LAURA
THERESA
BRENDA
CHARLOTTE
FRANCES
ELEANOR
PEARL
RUTH VERNE
MYRNA
KATHERINE
SYLVIA
NORAHELEN
DOROTHY
OLIVIA
FLORA
s s y s l s y ss * 6
A. Mrvar: Social Network Analysis 19'
&
$
%
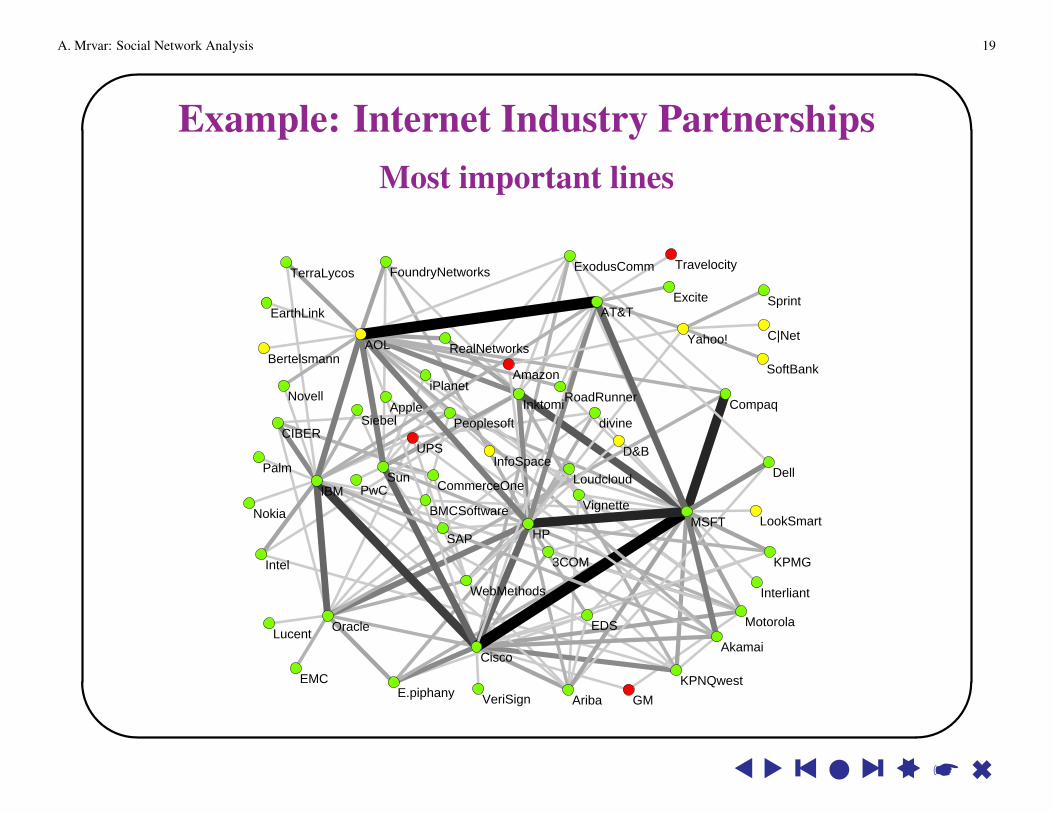
Example: Internet Industry PartnershipsMost important lines
AOL
AT&T
MSFT
Yahoo!
SunIBM
LookSmart
RealNetworks
Excite
TerraLycos
Apple
EarthLink
Amazon
Dell
RoadRunnerCompaq
HP
EMC
Novell
AkamaiCisco
KPMG
EDS
Sprint
Oracle
InfoSpace
VeriSign
Inktomi
Intel
C|Net
SoftBank
Travelocity
iPlanet
Ariba
3COM
PalmCommerceOne
Nokia
Bertelsmann
Motorola
PwC
Peoplesoft
ExodusComm
Loudcloud
Lucent
SAP
Siebel
KPNQwest
Vignette
Interliant
BMCSoftware
E.piphany
WebMethods
CIBER
FoundryNetworks
divine
GM
UPS D&B
s s y s l s y ss * 6
A. Mrvar: Social Network Analysis 20'
&
$
%
Example: The Edinburgh Associative Thesaurus• The Edinburgh Associative Thesaurus (EAT) is a set of word association norms
showing the counts of word association as collected from students.
• It is a big network – 23219 vertices (words) and 325624 directed lines.
s s y s l s y ss * 6
A. Mrvar: Social Network Analysis 21'
&
$
%
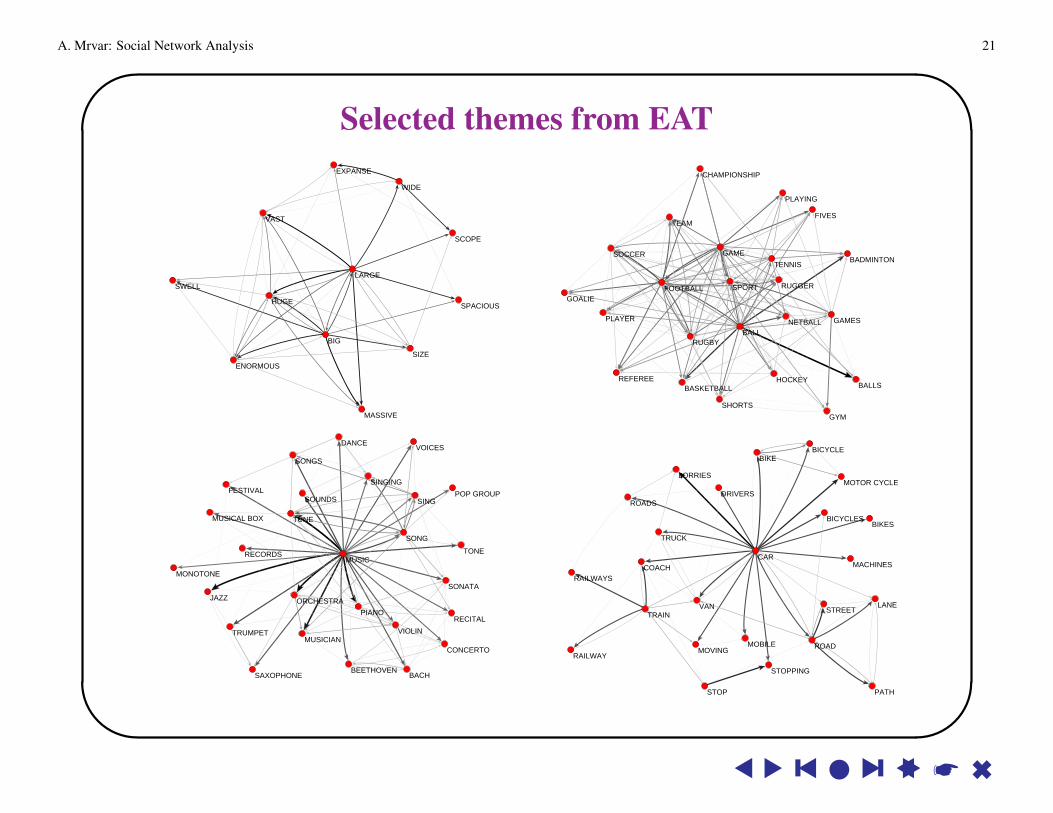
Selected themes from EAT
BIG
ENORMOUS
EXPANSE
HUGE
LARGE
MASSIVE
SCOPE
SIZE
SPACIOUS
SWELL
VAST
WIDE
BADMINTON
BALL
BALLSBASKETBALL
CHAMPIONSHIP
FIVES
FOOTBALL
GAME
GAMES
GOALIE
GYM
HOCKEY
NETBALLPLAYER
PLAYING
REFEREE
RUGBY
RUGGER
SHORTS
SOCCER
SPORT
TEAM
TENNIS
BACHBEETHOVEN
CONCERTO
DANCE
FESTIVAL
JAZZ
MONOTONE
MUSIC
MUSICAL BOX
MUSICIAN
ORCHESTRA
PIANO
POP GROUP
RECITAL
RECORDS
SAXOPHONE
SING
SINGING
SONATA
SONG
SONGS
SOUNDS
TONE
TRUMPET
TUNE
VIOLIN
VOICES BICYCLE
BICYCLES
BIKE
BIKES
CAR
COACH
DRIVERS
LANE
LORRIES
MACHINES
MOBILE
MOTOR CYCLE
MOVING
PATH
RAILWAY
RAILWAYS
ROAD
ROADS
STOP
STOPPING
STREETTRAIN
TRUCK
VAN
s s y s l s y ss * 6
A. Mrvar: Social Network Analysis 22'
&
$
%
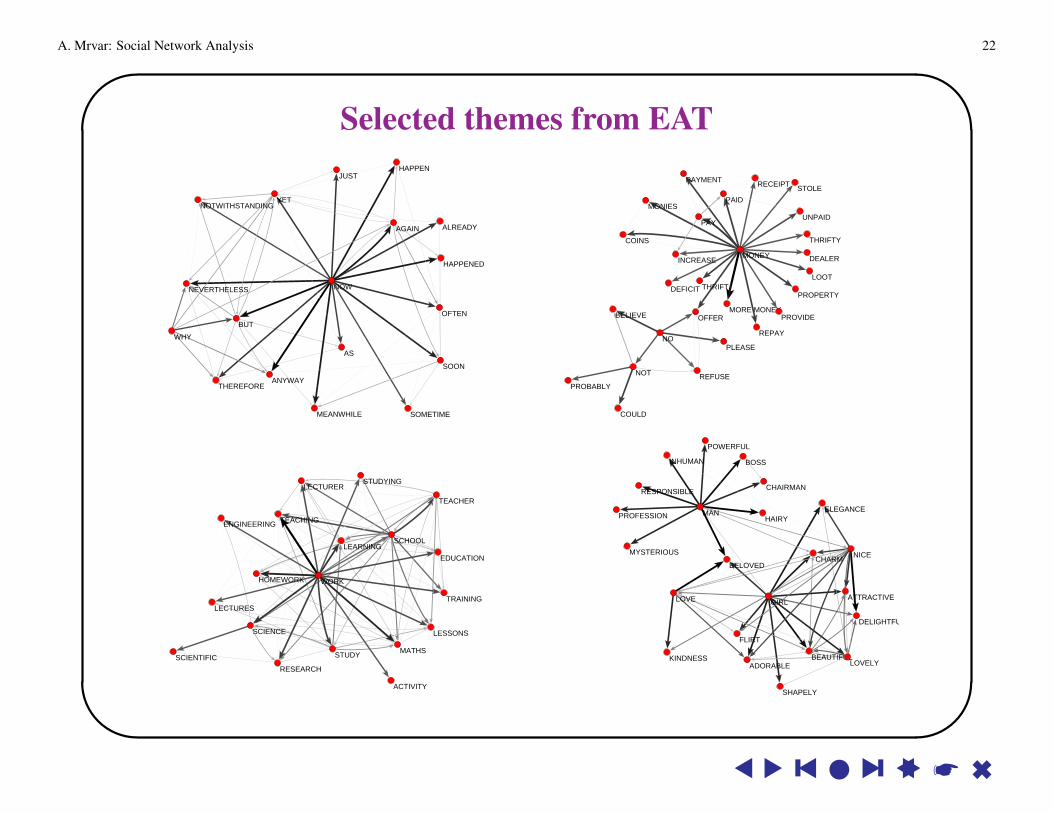
Selected themes from EAT
AGAIN ALREADY
ANYWAY
AS
BUT
HAPPEN
HAPPENED
JUST
MEANWHILE
NEVERTHELESS
NOTWITHSTANDING
NOW
OFTEN
SOMETIME
SOON
THEREFORE
WHY
YET
BELIEVE
COINS
COULD
DEALER
DEFICIT
INCREASE
LOOT
MONEY
MONIES
MORE MONEY
NO
NOT
OFFER
PAID
PAY
PAYMENT
PLEASE
PROBABLY
PROPERTY
PROVIDE
RECEIPT
REFUSE
REPAY
STOLE
THRIFT
THRIFTY
UNPAID
ACTIVITY
EDUCATION
ENGINEERING
HOMEWORK
LEARNING
LECTURER
LECTURES
LESSONS
MATHS
RESEARCH
SCHOOL
SCIENCE
SCIENTIFIC STUDY
STUDYING
TEACHER
TEACHING
TRAINING
WORK
ADORABLE
ATTRACTIVE
BEAUTIFUL
BELOVED
BOSS
CHAIRMAN
CHARM
DELIGHTFUL
ELEGANCE
FLIRT
GIRL
HAIRY
INHUMAN
KINDNESS
LOVE
LOVELY
MAN
MYSTERIOUS NICE
POWERFUL
PROFESSION
RESPONSIBLE
SHAPELY
s s y s l s y ss * 6
A. Mrvar: Social Network Analysis 23'
&
$
%
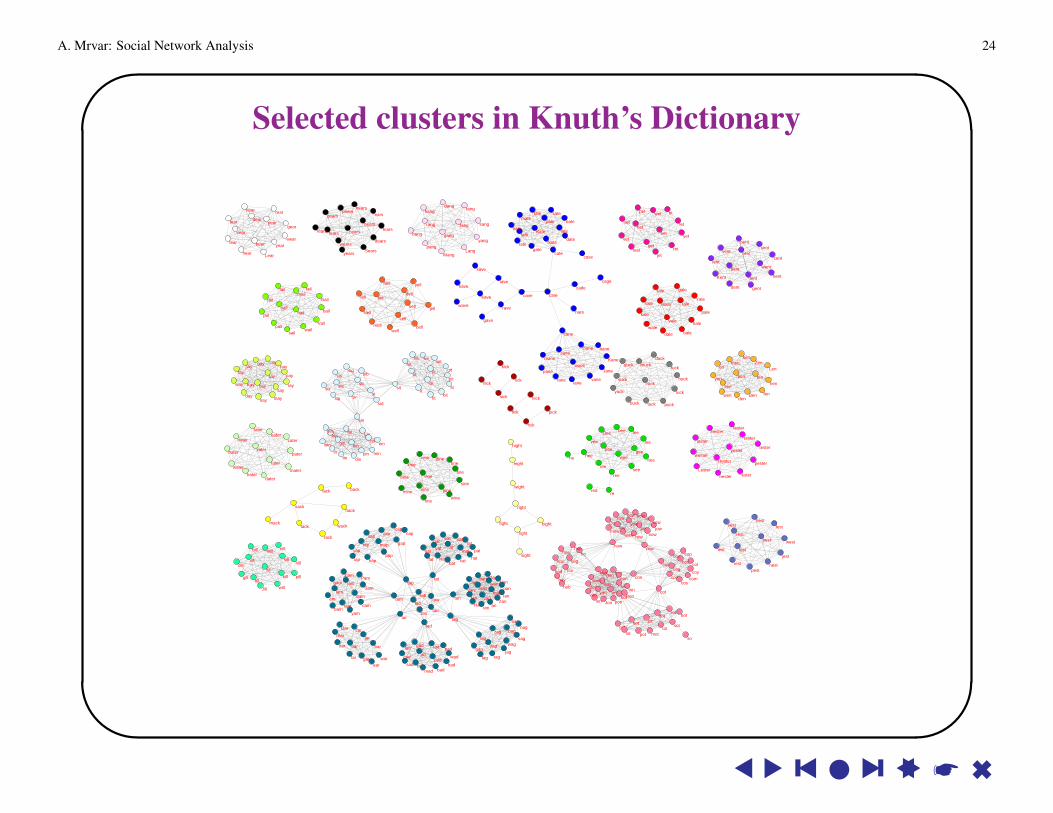
Example: The Knuth’s English DictionaryA large network can be generated from words of dictionary. Two words areconnected using an undirected line if we can reach one from the other by
• changing a single character (e. g., work – word)
• adding / removing a single character (e. g., ever – fever).
Knuth’s dictionary was used. There exist 52,652 words having 2 to 8 characters. Theobtained network has 89,038 edges. The network is sparse: density is 0.0000642.
s s y s l s y ss * 6
A. Mrvar: Social Network Analysis 24'
&
$
%
Selected clusters in Knuth’s Dictionary
back
bail
bale
bane
bang
bate
bear
bell
bent
best
bill
bine
buck
cade
cage
cane
care
casecate
cave
cell
cent
dale
Dane
dang
date
dear
dell
dent
dill
dine
duck
ears
eave
eine
fail
fane
fang
fate
fear
fell
fest
fill
fine
fuck
Gail
gale
gang
gate
gave
gear
gent
gill
guck
hack
hail
hale
hang
hare
hate
have
hear
hell
hent
hest
hick
hill
huck
jail
Jane
jell
jest
Jill
kale
Kane
Kate
Kent
kick
kill
kine
lack
lane
Lang
late
lave
Learlent
lest
lick
line
luck
mack
male
mane
mate
mell
mill
mine
muck
nail
Nate
near
Nell
nest
nick
nill
nine
pail
pale
pane
pang
patepear
pent
pest
pick
pill
pine
puck
rack
railrale
rang
rate
rave
rear
rent
rest
rick
rill
ruck
sack
sail
sale
sane
sang
sate
save
sear
sell
sent
sick
sill
sine
suck
tack
tail tale
tangtate
tear
tell
tent
test
tick
till
tine
tuck
Vail vale
vane
vent
vest
vine
wack
wail wale
wane
Wang
wave
wear
well
went
west
will
wine
Yale
yangyear
yell
yuck
zest
bater
bears
bight
cater
dater
dears
eater
eight
ester
fears
fight
gears
hater
hears
hight
later
light
mater
nears
oater
pater
pears
rater
rears
right
Sears
sight
tater
tears
water
wears
wight
years
besterfester
Hester
jester
Lester
nester
pester
rester
tester
westeryester
ad
am
an
at
en
et
he
ho
in
it
on
ow
re
si
so
bad
bag
bam
ban
bar
bat
bay
bee
Ben
bet
bin
bit
bon
bot
bow
cad
cam
can
cap
car
cat
cay
cit
cob
cod
cogcol
comcon
coo
cop
cos
cot
cow
cox
coy
dad
dag
dam
Dan
Dar
day
Dee
den
din
don
dot
Dow
ear
eat
ein
eon
fad
fag
fan
far
fat
fay
fee
fen
fin
fit
gadgag
gam
gap
gar
gat
gay
gee
get
gin
git
gon
got
had
hag
ham
Han
haphat
hay
hee
hen
hit
hob
hoc
hod
hoe
hog
hoi hon
hop
hot
how
hoy
Ianion
jag
jam Jan
jar
jay
jet
Jon
jot
jow
Kay
ken
kin
kit
lad
lag
lam
lap
lay
lee
Len
let
Lin
lit
lot
low
mad
man
map
mar
mat
may
men
met
min
mot
mow
nag
Nan
nap
Nat
nay
nee
net
nit
non
not
now
oar
oat
pad
Pam
pan
pap
par
pat
pay
pee
pen
pet
pin
pit
pon
pot
pow
rad
rag
ram ran
rap rat
ray
red
ree
ret
rin
rit
Ron
rot
row
sad
sag
Sam San
sapsat
say
see
sen
set
sib
sic
sid
sie
sig
sin
sip sir
sis
sitsix
son
sot
sow
tab
tad
tag
tam tantao
tap
tar
tat
tau
taw
tax
tee
ten
tin
tit
ton
tot
tow
van
vat
vee
vet
von
vow
wad
wag
wan
war
way
wee
wen
wet
win
wit
won
wow
yam
yap
yen
yet
yin
yon
yow
zag
Zan
zap
Zen
s s y s l s y ss * 6
A. Mrvar: Social Network Analysis 25'
&
$
%
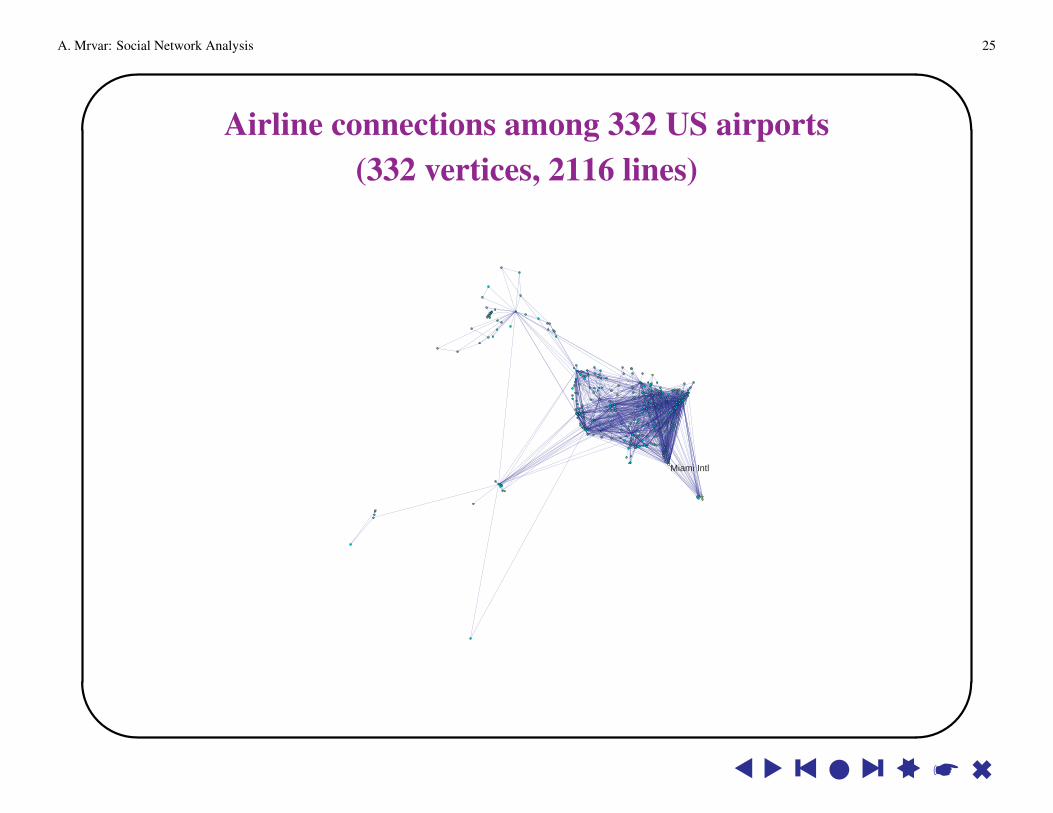
Airline connections among 332 US airports(332 vertices, 2116 lines)
Miami Intl
s s y s l s y ss * 6
A. Mrvar: Social Network Analysis 26'
&
$
%
Paths in a graphIn a directed graph:
• A sequence of vertices (v1, v2, . . . , vk) is called a walk if
(vi, vi+1) ∈ A, i = 1 . . . k − 1
(consequent vertices must be connected with arcs).
• A sequence of vertices (v1, v2, . . . , vk) is called a chain if
(vi, vi+1) ∈ A or (vi+1, vi) ∈ A, i = 1 . . . k − 1
(consequent vertices must be connected, direction of lines is not important).
• A walk is elementary if all its vertices, except maybe initial and terminal, aredifferent. We will call an elementary walk a path.
• A walk is simple if all its lines are different.
• If v1 = vk, the walk is called a closed walk or circuit (the walk starts and endsin the same vertex).
• A cycle is a closed walk of at least three vertices in which all lines are distinct
s s y s l s y ss * 6
A. Mrvar: Social Network Analysis 27'
&
$
%
and all vertices except the initial and terminal are distinct.
• The chain starting and ending in the same vertex is called a closed chain.
• If v1 = vk and k = 1, the circuit is called a loop (a connection of a vertex toitself).
• The length of a path is k − 1 (the number of lines traveled).
• There can exist several paths between two vertices. The most interesting is theshortest path (all shortest paths).
If a relation means telling news the shortest path will tell the shortest route ofinformation traveling between two persons. – e. g., if all shortest paths frompeople to a selected person are short the selected person is well or quicklyinformed.
In the case of a relation was in contact to, the shortest path tells the mostprobable way of passing an infection. In this case shortest paths are notwelcome.
• The length of the longest shortest path in a graph is called its diameter.
s s y s l s y ss * 6
A. Mrvar: Social Network Analysis 28'
&
$
%
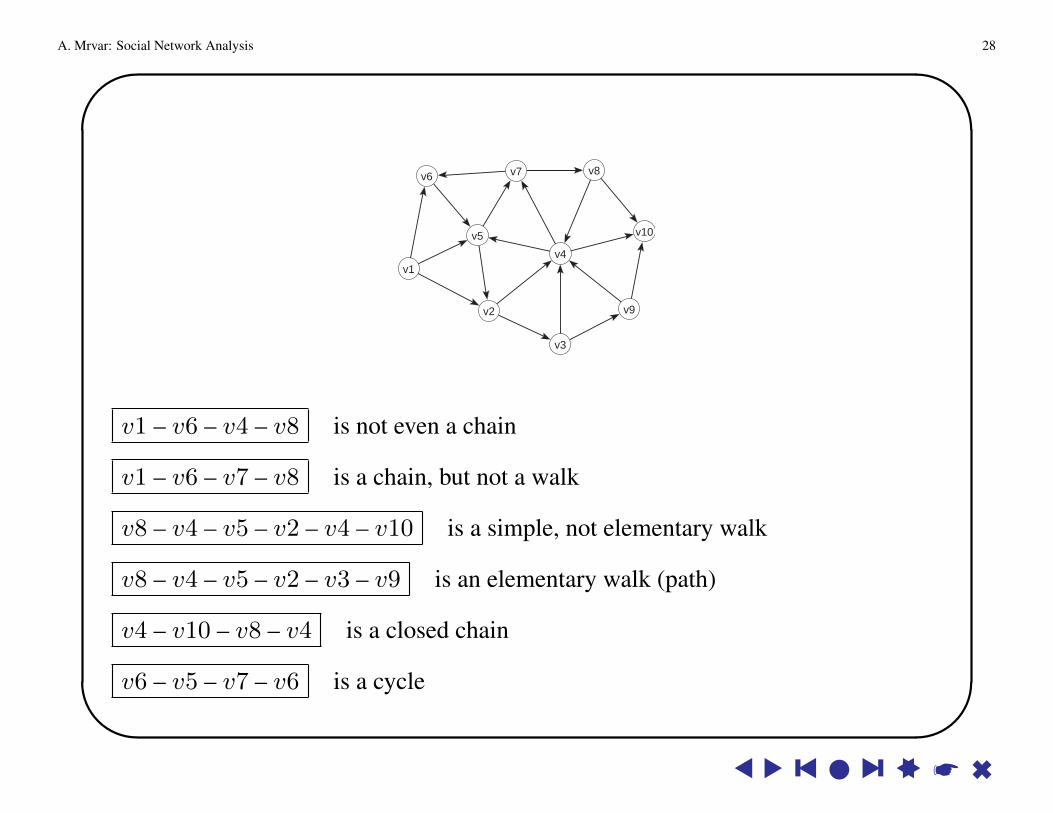
v1
v2
v3
v4
v5
v6 v7 v8
v9
v10
v1 – v6 – v4 – v8 is not even a chain
v1 – v6 – v7 – v8 is a chain, but not a walk
v8 – v4 – v5 – v2 – v4 – v10 is a simple, not elementary walk
v8 – v4 – v5 – v2 – v3 – v9 is an elementary walk (path)
v4 – v10 – v8 – v4 is a closed chain
v6 – v5 – v7 – v6 is a cycle
s s y s l s y ss * 6
A. Mrvar: Social Network Analysis 29'
&
$
%
v1 – v2 – v3 – v9 – v10 is a path between v1 and v10, but not the shortest path(length 4).
The shortest path is: v1 – v2 – v4 – v10 (length 3).
The diameter is 5: v7 – v6 – v5 – v2 – v3 – v9
s s y s l s y ss * 6
A. Mrvar: Social Network Analysis 30'
&
$
%
Some interesting resultsNetworks with a very large number of vertices can have quite short shortest pathsamong vertices.
For example:
• The average length of shortest path of the WWW, with over 800 millionvertices, is around 19.
Albert, R., Jeong, H., and Barabasi, A.-L. (1999):
Diameter of the World-Wide Web. Nature, 401, 130-131.
http://www.nd.edu/˜alb/Publication06/062 Diameter of the world wide
web/Diameter of the world wide web.pdf
• Social networks (whom do you know) with over six billion individualsare believed to have a average length of shortest path around six.
Milgram, S. (1967): The small-world problem.Psychol. Today, 2, 60-67.
s s y s l s y ss * 6
A. Mrvar: Social Network Analysis 31'
&
$
%
ComponentsThree types of components will be defined: strong, weak and biconnected.
A subset of vertices in a network is called a strongly connected component if(taking directions of lines into account) from every vertex of the subset we can reachevery other vertex belonging to the same subset.
If direction of lines is not important (where we consider the network to beundirected), such a subset is called a weakly connected component.
Example: Let the vertices of network correspond to buildings in the city, and linesto streets that connect the buildings. Some streets are ordinary (undirected lines),some are one way only (directed lines).
All buildings that can be reached from one to another using the car, belong to thesame strongly connected component (we must take one way streets into account).
All buildings that can be reached from one to another by walking, belong to thesame weakly connected component (one way streets are no restriction).
s s y s l s y ss * 6
A. Mrvar: Social Network Analysis 32'
&
$
%
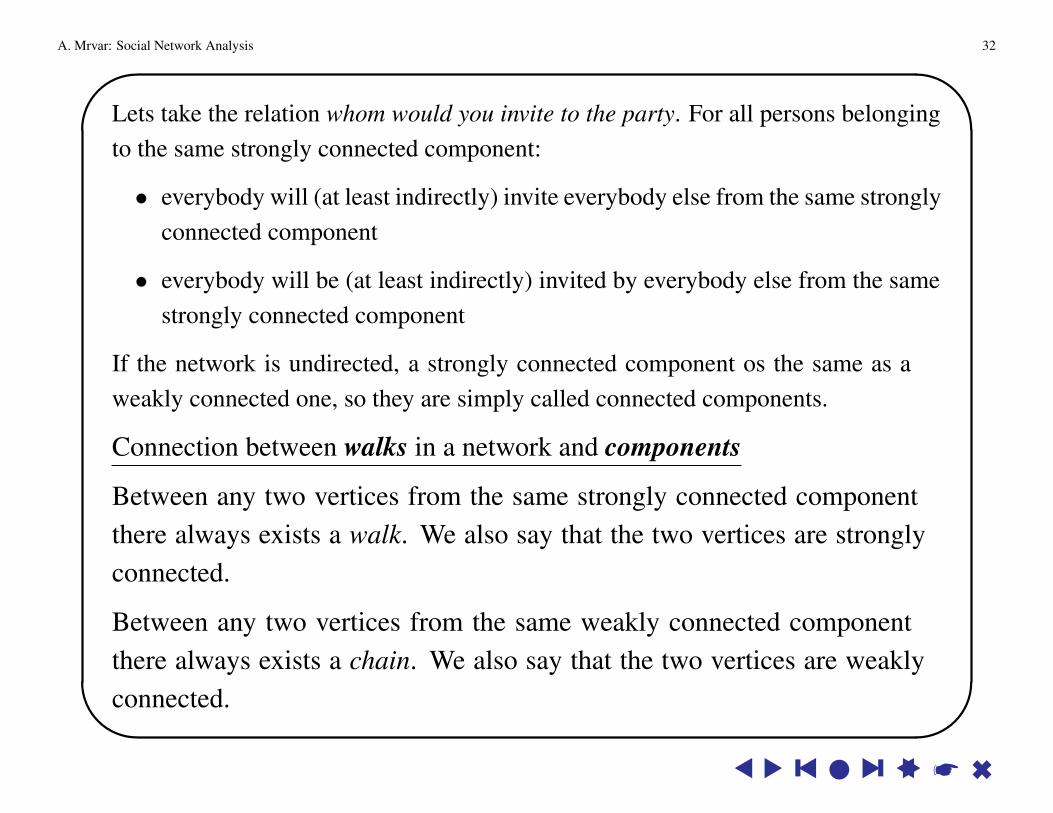
Lets take the relation whom would you invite to the party. For all persons belongingto the same strongly connected component:
• everybody will (at least indirectly) invite everybody else from the same stronglyconnected component
• everybody will be (at least indirectly) invited by everybody else from the samestrongly connected component
If the network is undirected, a strongly connected component os the same as aweakly connected one, so they are simply called connected components.
Connection between walks in a network and components
Between any two vertices from the same strongly connected componentthere always exists a walk. We also say that the two vertices are stronglyconnected.
Between any two vertices from the same weakly connected componentthere always exists a chain. We also say that the two vertices are weaklyconnected.
s s y s l s y ss * 6
A. Mrvar: Social Network Analysis 33'
&
$
%
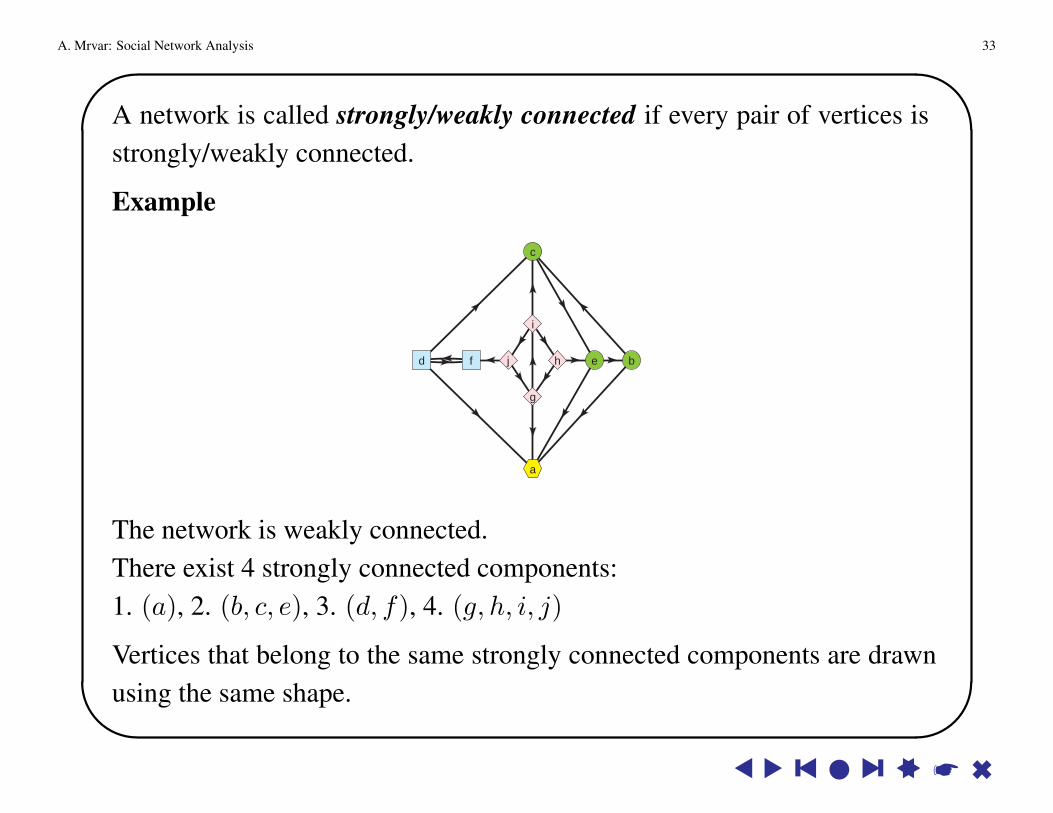
A network is called strongly/weakly connected if every pair of vertices isstrongly/weakly connected.
Example
a
b
c
ed f
g
h
i
j
The network is weakly connected.There exist 4 strongly connected components:1. (a), 2. (b, c, e), 3. (d, f), 4. (g, h, i, j)
Vertices that belong to the same strongly connected components are drawnusing the same shape.
s s y s l s y ss * 6
A. Mrvar: Social Network Analysis 34'
&
$
%
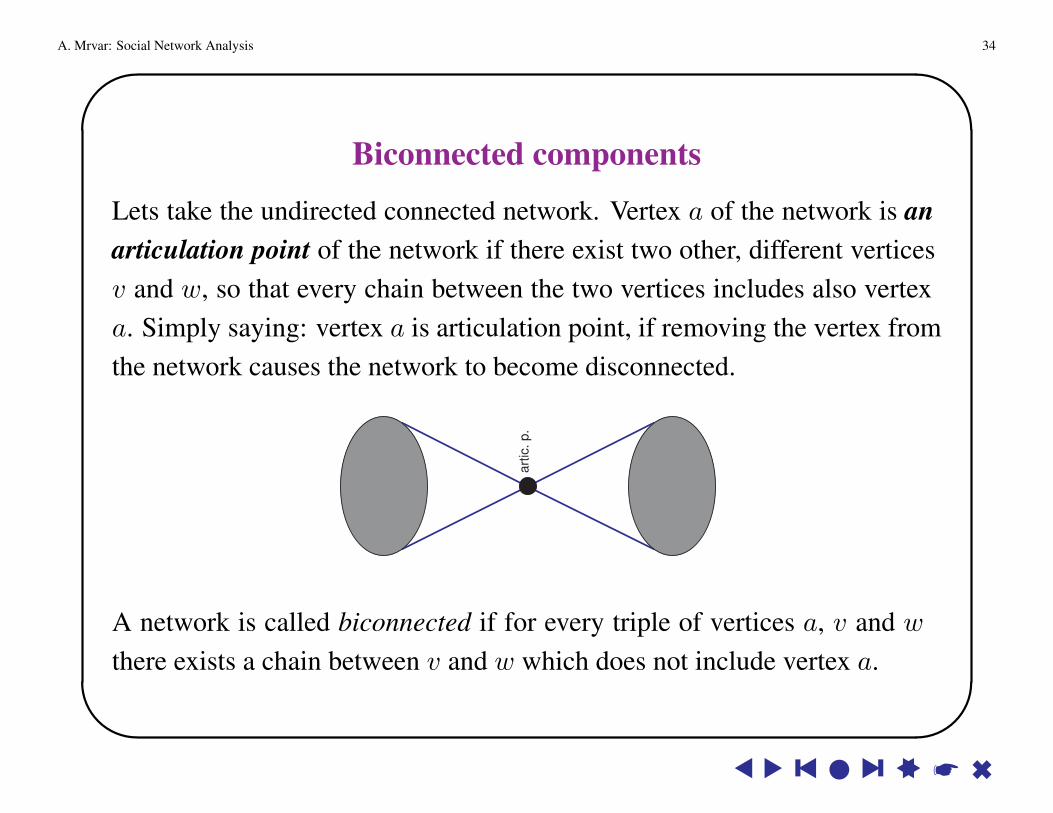
Biconnected components
Lets take the undirected connected network. Vertex a of the network is anarticulation point of the network if there exist two other, different verticesv and w, so that every chain between the two vertices includes also vertexa. Simply saying: vertex a is articulation point, if removing the vertex fromthe network causes the network to become disconnected.
art
ic.
p.
A network is called biconnected if for every triple of vertices a, v and w
there exists a chain between v and w which does not include vertex a.
s s y s l s y ss * 6
A. Mrvar: Social Network Analysis 35'
&
$
%
Example
a
b
c
d
e
f
g
h
i
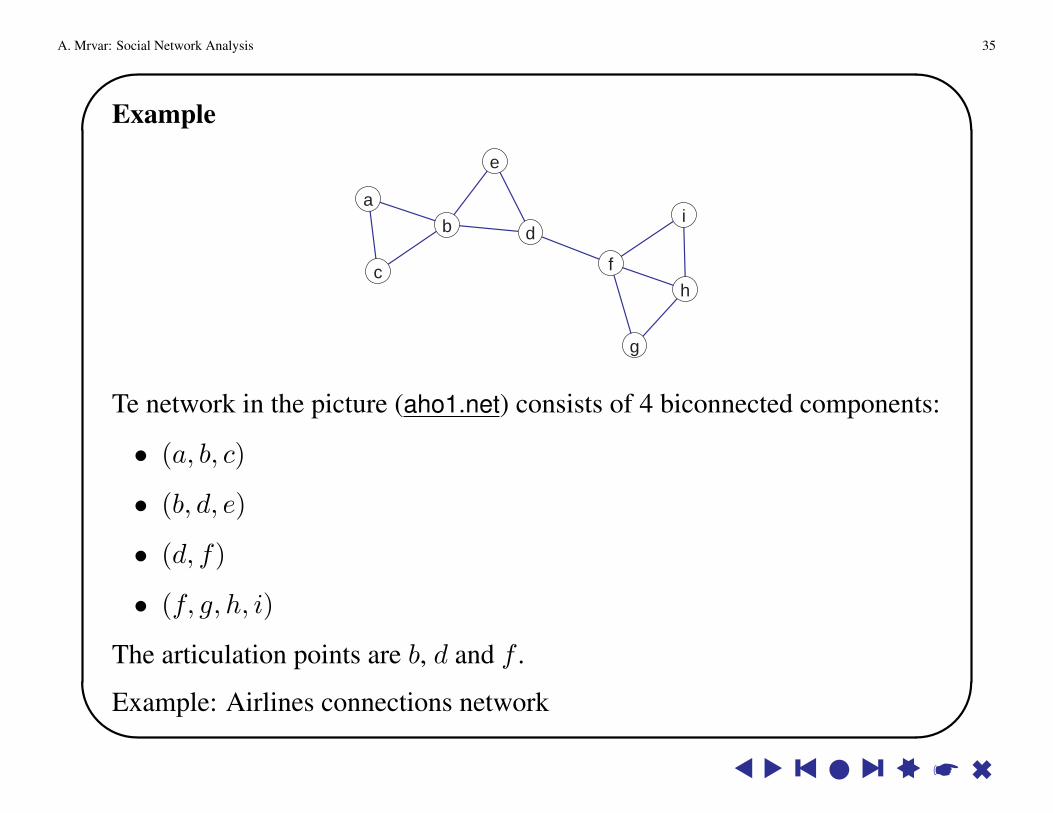
Te network in the picture (aho1.net) consists of 4 biconnected components:
• (a, b, c)
• (b, d, e)
• (d, f)
• (f, g, h, i)
The articulation points are b, d and f .
Example: Airlines connections networks s y s l s y ss * 6
A. Mrvar: Social Network Analysis 36'
&
$
%
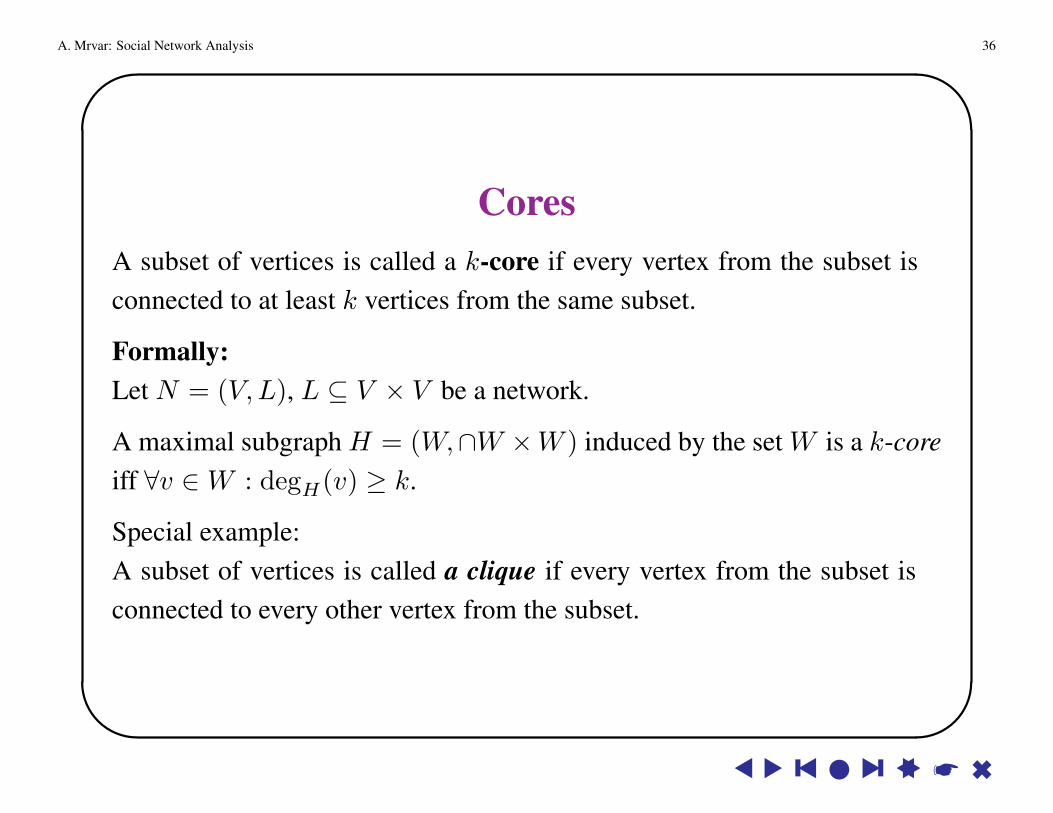
CoresA subset of vertices is called a k-core if every vertex from the subset isconnected to at least k vertices from the same subset.
Formally:Let N = (V,L), L ⊆ V × V be a network.
A maximal subgraph H = (W,∩W ×W ) induced by the set W is a k-coreiff ∀v ∈W : degH(v) ≥ k.
Special example:A subset of vertices is called a clique if every vertex from the subset isconnected to every other vertex from the subset.
s s y s l s y ss * 6
A. Mrvar: Social Network Analysis 37'
&
$
%
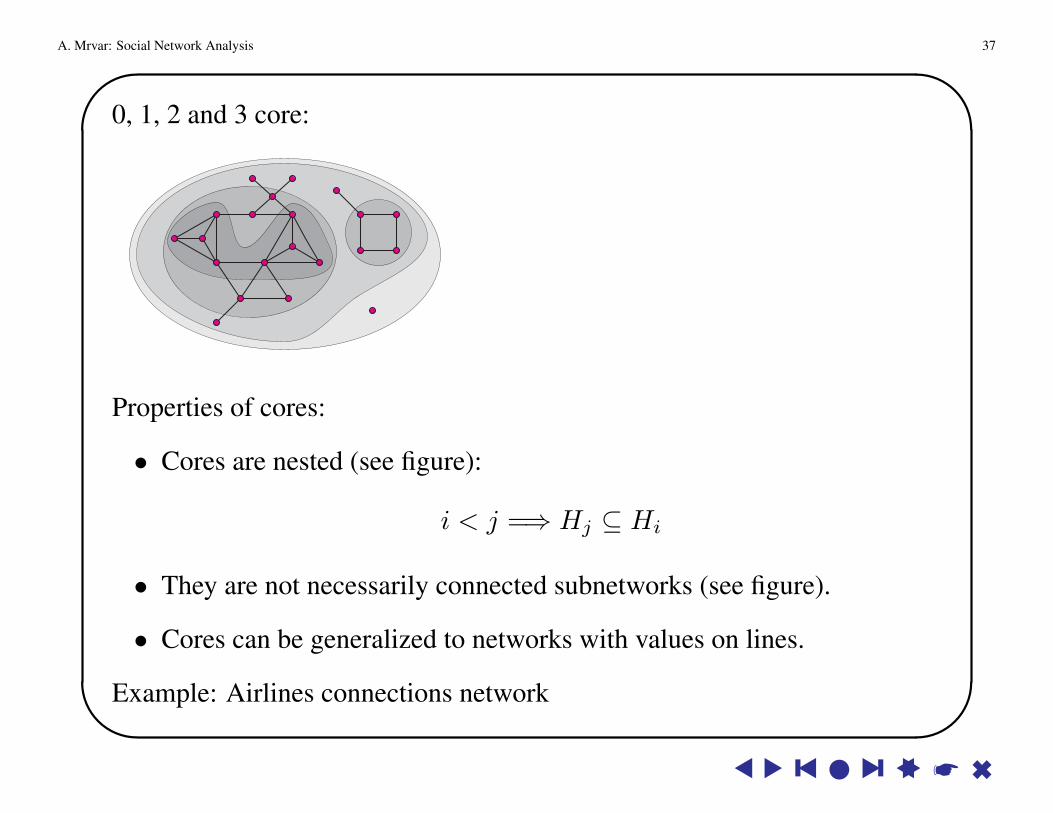
0, 1, 2 and 3 core:
Properties of cores:
• Cores are nested (see figure):
i < j =⇒ Hj ⊆ Hi
• They are not necessarily connected subnetworks (see figure).
• Cores can be generalized to networks with values on lines.
Example: Airlines connections network
s s y s l s y ss * 6
A. Mrvar: Social Network Analysis 38'
&
$
%
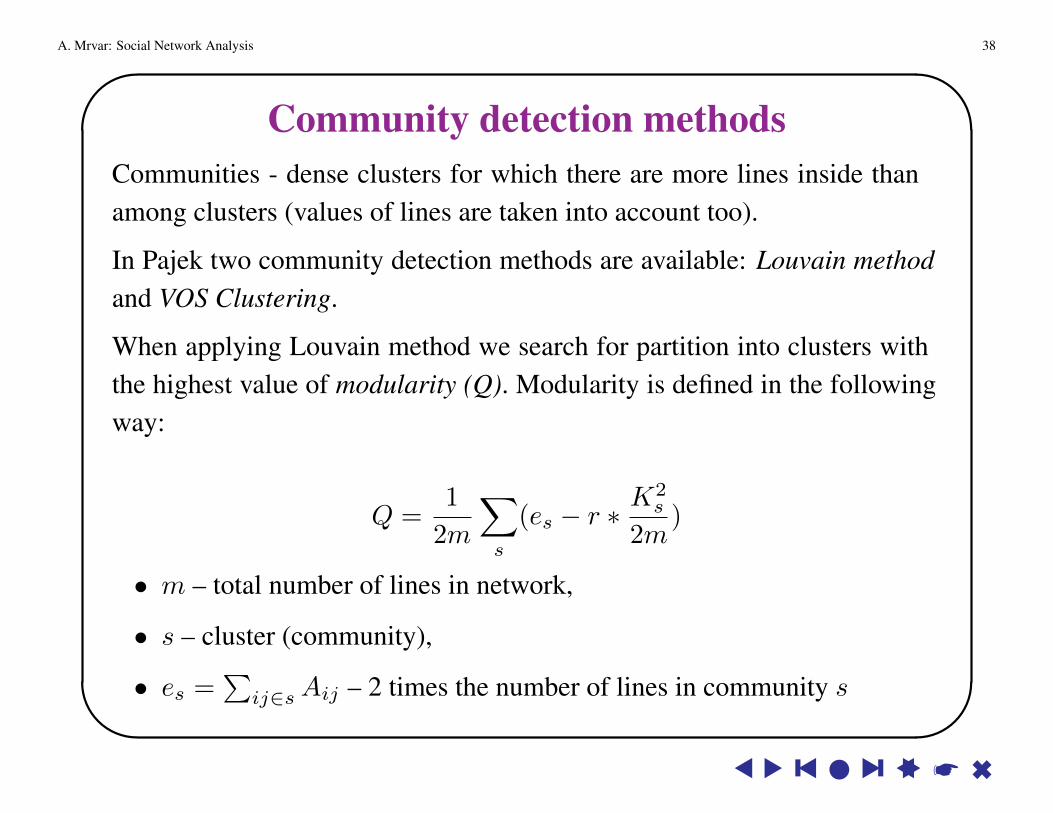
Community detection methodsCommunities - dense clusters for which there are more lines inside thanamong clusters (values of lines are taken into account too).
In Pajek two community detection methods are available: Louvain methodand VOS Clustering.
When applying Louvain method we search for partition into clusters withthe highest value of modularity (Q). Modularity is defined in the followingway:
Q =1
2m
∑s
(es − r ∗ K2s
2m)
• m – total number of lines in network,
• s – cluster (community),
• es =∑
ij∈s Aij – 2 times the number of lines in community s
s s y s l s y ss * 6
A. Mrvar: Social Network Analysis 39'
&
$
%
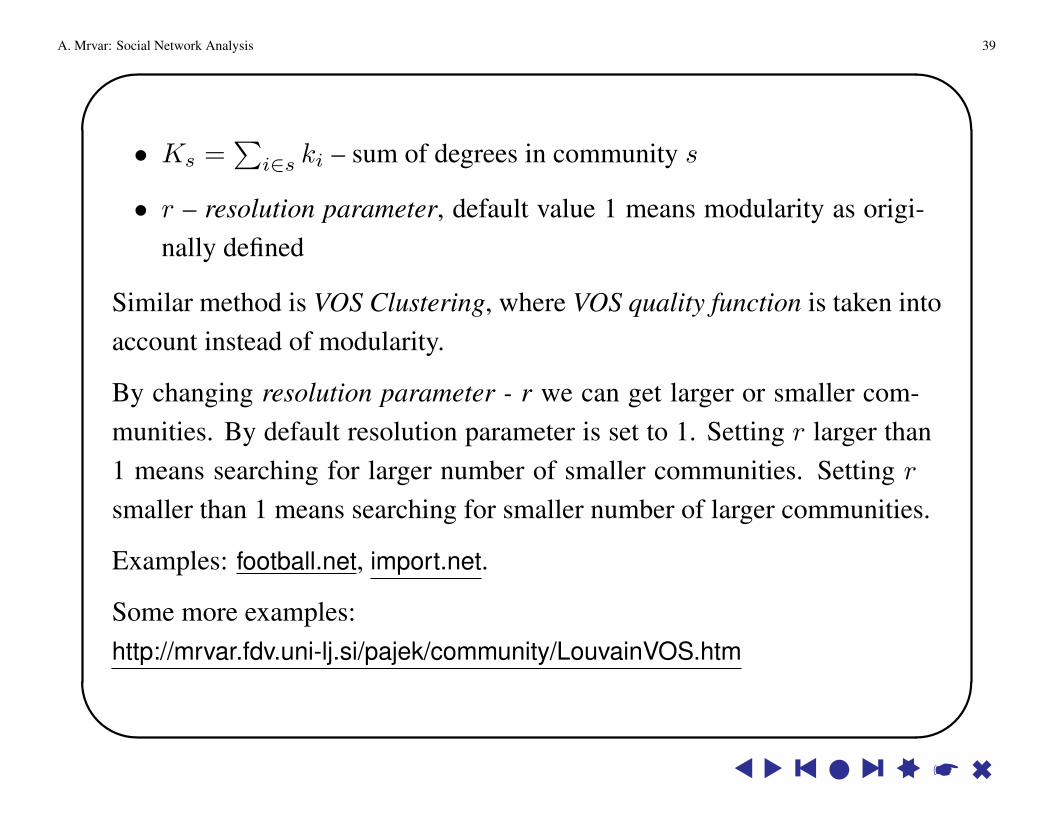
• Ks =∑
i∈s ki – sum of degrees in community s
• r – resolution parameter, default value 1 means modularity as origi-nally defined
Similar method is VOS Clustering, where VOS quality function is taken intoaccount instead of modularity.
By changing resolution parameter - r we can get larger or smaller com-munities. By default resolution parameter is set to 1. Setting r larger than1 means searching for larger number of smaller communities. Setting r
smaller than 1 means searching for smaller number of larger communities.
Examples: football.net, import.net.
Some more examples:http://mrvar.fdv.uni-lj.si/pajek/community/LouvainVOS.htm
s s y s l s y ss * 6
A. Mrvar: Social Network Analysis 40'
&
$
%
Measures of centrality and prestige
One of the most important uses of network analysis is identification of’most central’ units in a network.
Measures of centrality and prestige can be defined in two different ways:
• for each unit respectively – unit centrality (one number for each unit)
• for the whole network – network centralisation (only one number forthe whole network).
s s y s l s y ss * 6

A. Mrvar: Social Network Analysis 41'
&
$
%
Unit centrality and prestigeWhen we talk about centrality we must distinguish between undirected anddirected networks:
• the term centrality measures is used for undirected networks;Example: A city is central, if a lot of roads are passing through it.
• the term prestige is used for directed networks. In this case we candefine two different types of prestige:
– one for outgoing arcs (measures of influence),
– one for incoming arcs (measures of support).
Examples:An actor has high influence, if he gives commands to several otheractors.An actor has high support, if a lot of people vote for him.
s s y s l s y ss * 6

A. Mrvar: Social Network Analysis 42'
&
$
%
Unit centrality measuresSelected unit is central
• if it has high degree,
• if it is easily accessible (close to) all other units,
• if it lies on several geodesics (shortest paths) between other units.
Star and cycle
According to all criteria mentioned, unit 7 in the star is the most central,while all units in the cycle are equally central.
s s y s l s y ss * 6
A. Mrvar: Social Network Analysis 43'
&
$
%
Degree CentralityThe simplest measure – unit is central in a network, if it is active enough inthe sense that is has a lot of links to other units (unit 7 in the star). In thecase of cycle all units are equally central.
Degree centrality is defined by a degree of unit x
cD(x) = degree of unit x
Such measures are called absolute measures of centrality. Absolutemeasures cannot be used to compare centralities of networks with differentnumber of units. Therefore such measures are normalised to get measurein interval from 0 to 1, where 0 means the smallest possible and value 1the highest possible centrality. Measures normalised in this way are calledrelative measures of centrality.
s s y s l s y ss * 6
A. Mrvar: Social Network Analysis 44'
&
$
%
Relative degree centrality is
CD(x) =cD(x)
highest degree=
cD(x)
n− 1
if n is number of units in a network, the highest possible degree (in anetwork without loops) is n− 1.
The same centrality measure can be used as a measure of prestige fordirected networks. In this case there are two possibilities
• to choose (influence – out degree: number of arcs going out)
• to be chosen (support – in degree: number of arcs coming into).
s s y s l s y ss * 6

A. Mrvar: Social Network Analysis 45'
&
$
%
Closeness CentralitySabidussi (1966) suggested the measure of centrality according to closenessof unit x:
cC(x) =1∑
y∈U d(x, y)
where d(x, y) is the graph theoretic distance (length of shortest path)between units x and y, U is set of all units.
If network is not strongly connected, we take only reachable vertices intoaccount, but we weight the result with number of reachable vertices.
Ce omrezje ni krepko povezano, upostevamo samo dosegljive tocke, s temda mero utezimo z mocjo mnozice dosegljivih tock.
The most central units according to closeness centrality can quickly interactto all others because they are close to all others.
This measure is preferable to degree centrality, because it does not take intoaccount only direct connections among units but also indirect connections.
s s y s l s y ss * 6
A. Mrvar: Social Network Analysis 46'
&
$
%
Betweenness CentralityIn the case of communication networks the distance from other units is notthe only important property of a unit. More important is which units lie onthe shortest paths among pairs of other units. Such units have control overthe flow of information in the network.
Idea of betweenness centrality measures: unit is central, if it lies on severalshortest paths among other pairs of units.
Freeman (1977) defined the centrality measure of unit x according tobetweenness in the following way:
cB(x) =∑y<z
# of shortest paths between y and z through unit x# of shortest paths between y and z
Suppose that communication in a network always passes through shortestavailable paths: Betweenness centrality of unit x is the sum of probabilitiesacross all possible pairs of units, that the shortest path between y and z willpass through unit x.
s s y s l s y ss * 6
A. Mrvar: Social Network Analysis 47'
&
$
%
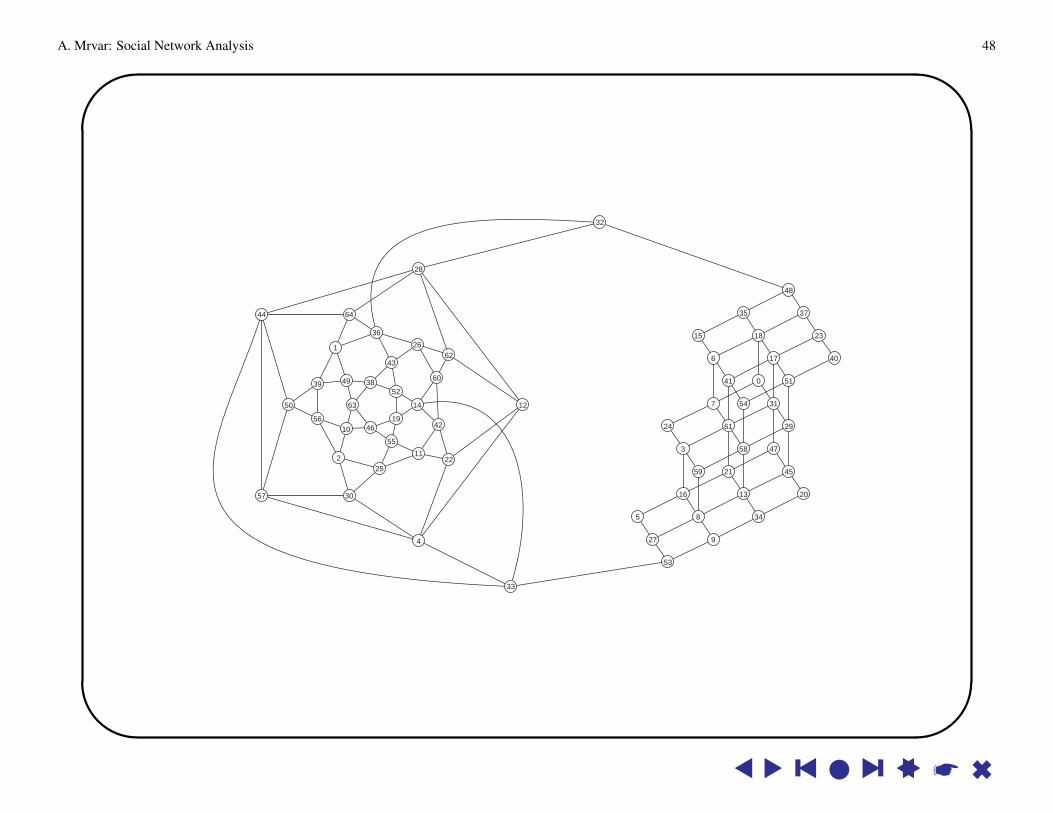
Choosing suitable centrality measureDifferent centrality measures can give quite different results. Thereforewe must be very careful which centrality measure to choose for a givennetwork:
It can happen, that some units have low degrees, but high betweennesscentrality.
Example: units 33, 53, 32 in 48 are the most central according to between-ness centrality, although several other vertices with higher degree centralityexist (unit 61 has degree 6, some units have degree 5). The four unitsmentioned have degree only 3 or 4.
s s y s l s y ss * 6
A. Mrvar: Social Network Analysis 48'
&
$
%
1
23
4
5
6
7
8
9
10
11
12
13
14
15
16
17
18
19
20
21
22
23
24
25
26
27
28
29
30
31
32
33
34
35
36
37
3839
40
41
42
43
44
45
46
47
48
49
50
5152
53
54
55
56
57
58
59
60
61
62
63
64
0
s s y s l s y ss * 6
A. Mrvar: Social Network Analysis 49'
&
$
%
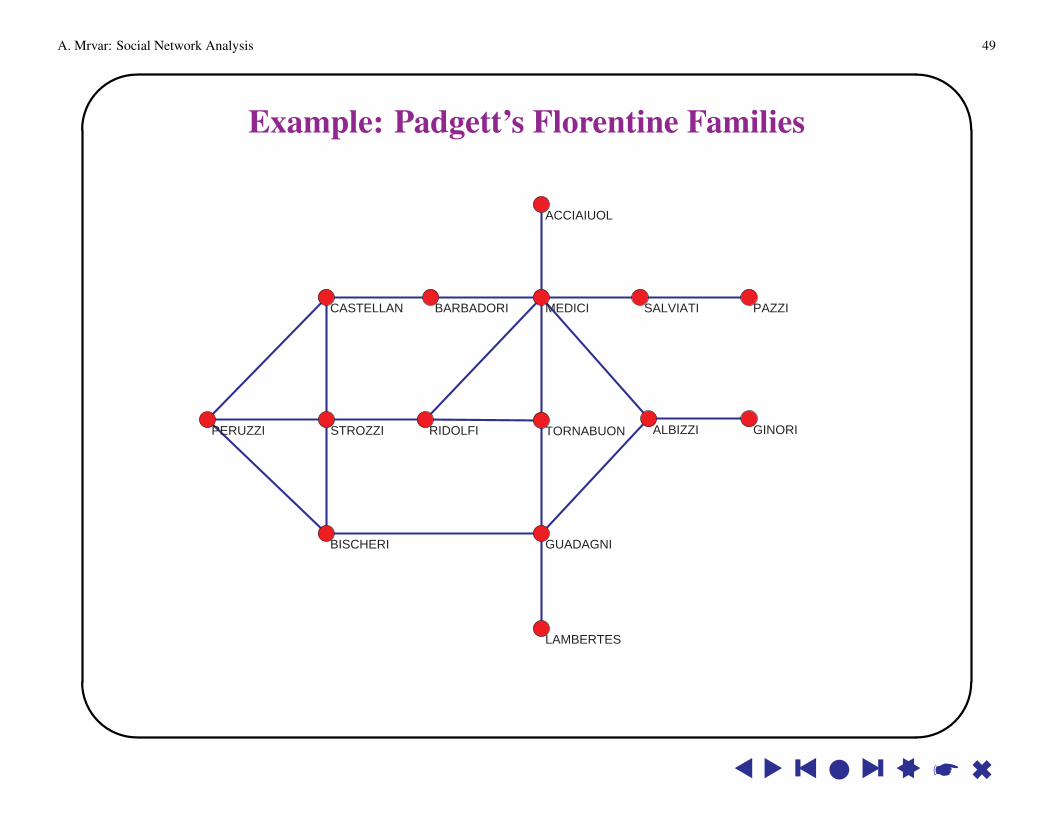
Example: Padgett’s Florentine Families
ACCIAIUOL
ALBIZZI
BARBADORI
BISCHERI
CASTELLAN
GINORI
GUADAGNI
LAMBERTES
MEDICI PAZZI
PERUZZI RIDOLFI
SALVIATI
STROZZI TORNABUON
s s y s l s y ss * 6
A. Mrvar: Social Network Analysis 50'
&
$
%
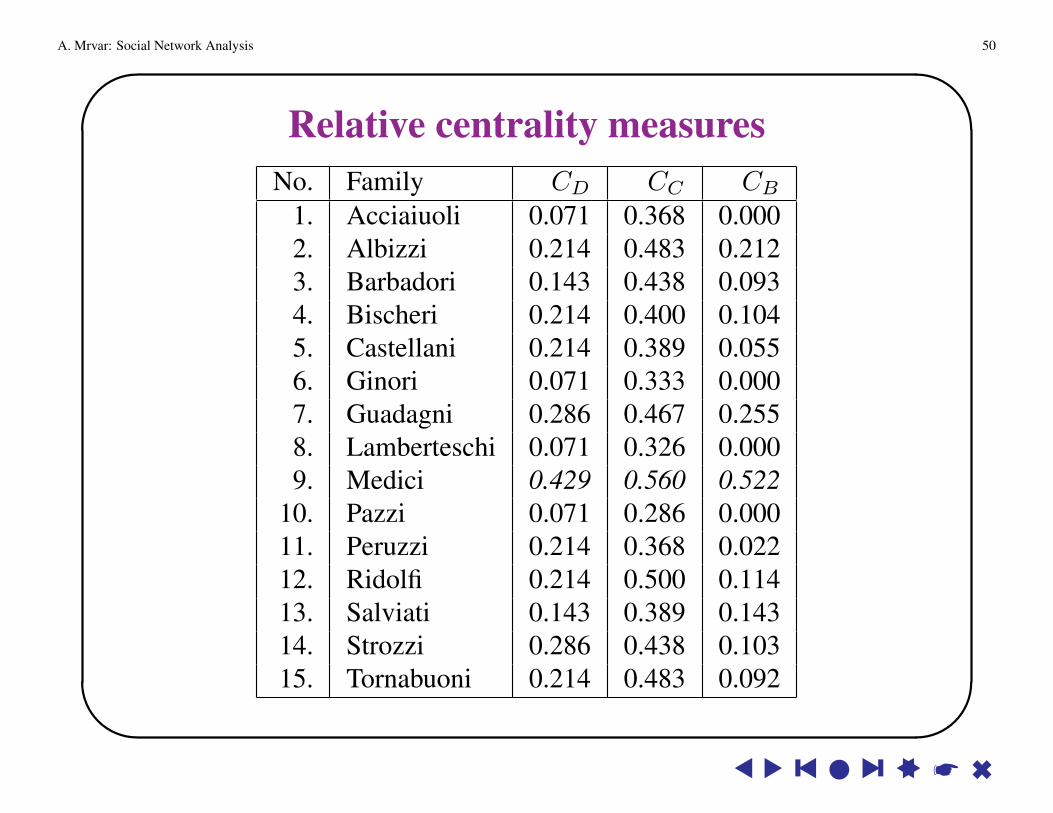
Relative centrality measuresNo. Family CD CC CB
1. Acciaiuoli 0.071 0.368 0.0002. Albizzi 0.214 0.483 0.2123. Barbadori 0.143 0.438 0.0934. Bischeri 0.214 0.400 0.1045. Castellani 0.214 0.389 0.0556. Ginori 0.071 0.333 0.0007. Guadagni 0.286 0.467 0.2558. Lamberteschi 0.071 0.326 0.0009. Medici 0.429 0.560 0.522
10. Pazzi 0.071 0.286 0.00011. Peruzzi 0.214 0.368 0.02212. Ridolfi 0.214 0.500 0.11413. Salviati 0.143 0.389 0.14314. Strozzi 0.286 0.438 0.10315. Tornabuoni 0.214 0.483 0.092
s s y s l s y ss * 6
A. Mrvar: Social Network Analysis 51'
&
$
%
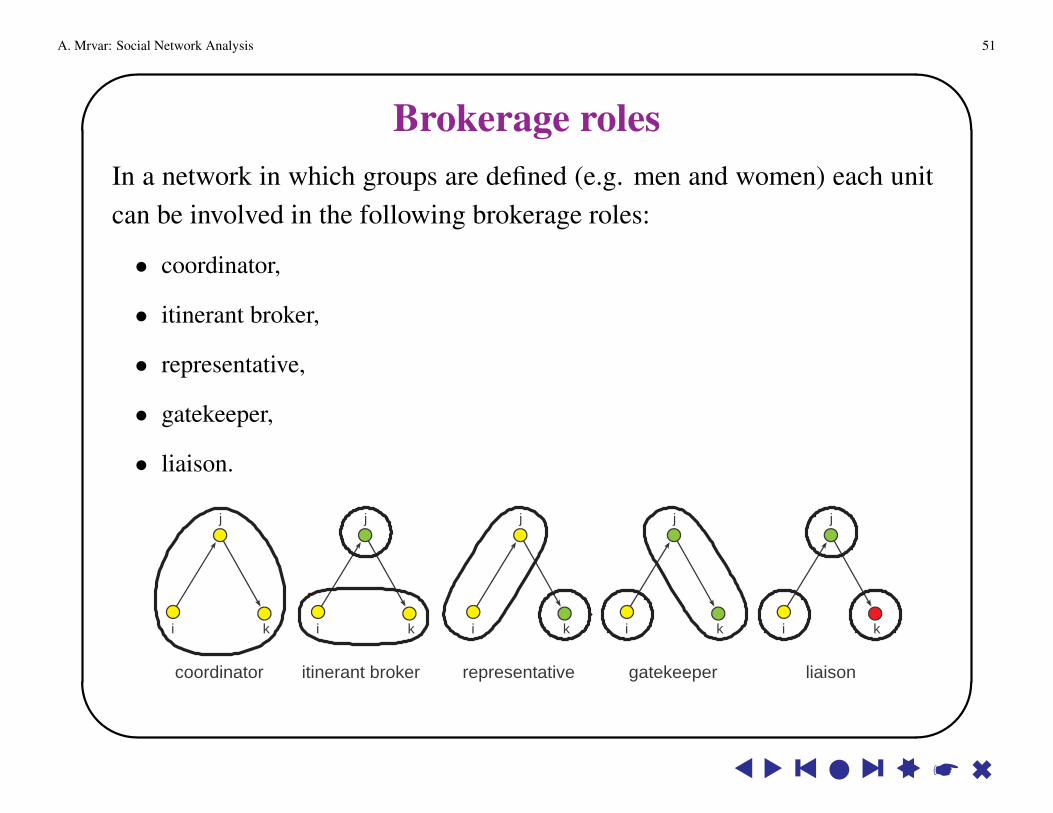
Brokerage rolesIn a network in which groups are defined (e.g. men and women) each unitcan be involved in the following brokerage roles:
• coordinator,
• itinerant broker,
• representative,
• gatekeeper,
• liaison.
j
i k
coordinator
j
i k
itinerant broker
j
i k
liaison
j
i k
gatekeeper
j
i k
representative
s s y s l s y ss * 6

A. Mrvar: Social Network Analysis 52'
&
$
%
Genealogies as large networksGEDCOM is standard for storing genealogical data, which is used to interchange
and combine data from different programs. The following lines are extracted from
the GEDCOM file of European Royal families.
0 HEAD 0 @I115@ INDI1 FILE ROYALS.GED 1 NAME William Arthur Philip/Windsor/... 1 TITL Prince0 @I58@ INDI 1 SEX M1 NAME Charles Philip Arthur/Windsor/ 1 BIRT1 TITL Prince 2 DATE 21 JUN 19821 SEX M 2 PLAC St.Mary’s Hospital, Paddington1 BIRT 1 CHR2 DATE 14 NOV 1948 2 DATE 4 AUG 19822 PLAC Buckingham Palace, London 2 PLAC Music Room, Buckingham Palace1 CHR 1 FAMC @F16@2 DATE 15 DEC 1948 ...2 PLAC Buckingham Palace, Music Room 0 @I116@ INDI1 FAMS @F16@ 1 NAME Henry Charles Albert/Windsor/1 FAMC @F14@ 1 TITL Prince... 1 SEX M... 1 BIRT0 @I65@ INDI 2 DATE 15 SEP 19841 NAME Diana Frances /Spencer/ 2 PLAC St.Mary’s Hosp., Paddington1 TITL Lady 1 FAMC @F16@1 SEX F ...1 BIRT 0 @F16@ FAM2 DATE 1 JUL 1961 1 HUSB @I58@2 PLAC Park House, Sandringham 1 WIFE @I65@1 CHR 1 CHIL @I115@2 PLAC Sandringham, Church 1 CHIL @I116@1 FAMS @F16@ 1 DIV N1 FAMC @F78@ 1 MARR... 2 DATE 29 JUL 1981... 2 PLAC St.Paul’s Cathedral, London
s s y s l s y ss * 6
A. Mrvar: Social Network Analysis 53'
&
$
%
Representation of genealogies using networks
Genealogies can be represented as networks in different ways:
• as Ore-graph,
• as p-graph,
• as bipartite p-graph.
s s y s l s y ss * 6
A. Mrvar: Social Network Analysis 54'
&
$
%
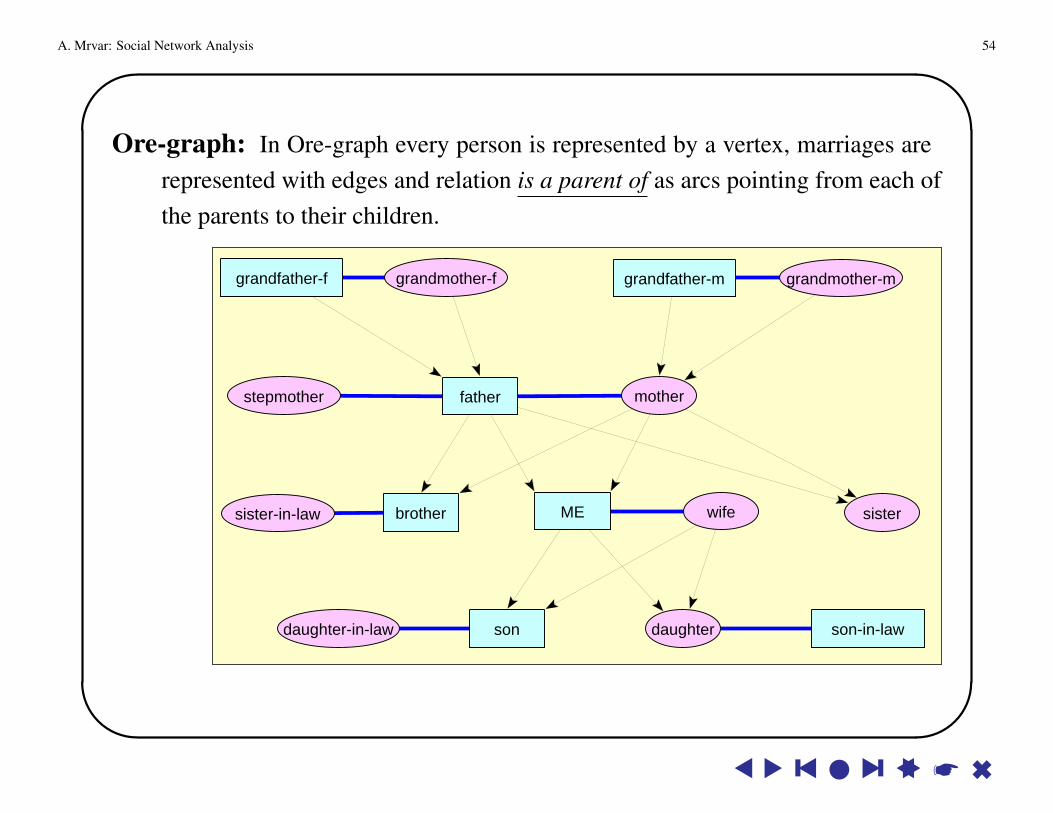
Ore-graph: In Ore-graph every person is represented by a vertex, marriages arerepresented with edges and relation is a parent of as arcs pointing from each ofthe parents to their children.
grandfather-f grandmother-f
father mother
ME wife
sondaughter-in-law daughter son-in-law
stepmother
grandfather-m grandmother-m
sisterbrothersister-in-law
s s y s l s y ss * 6
A. Mrvar: Social Network Analysis 55'
&
$
%
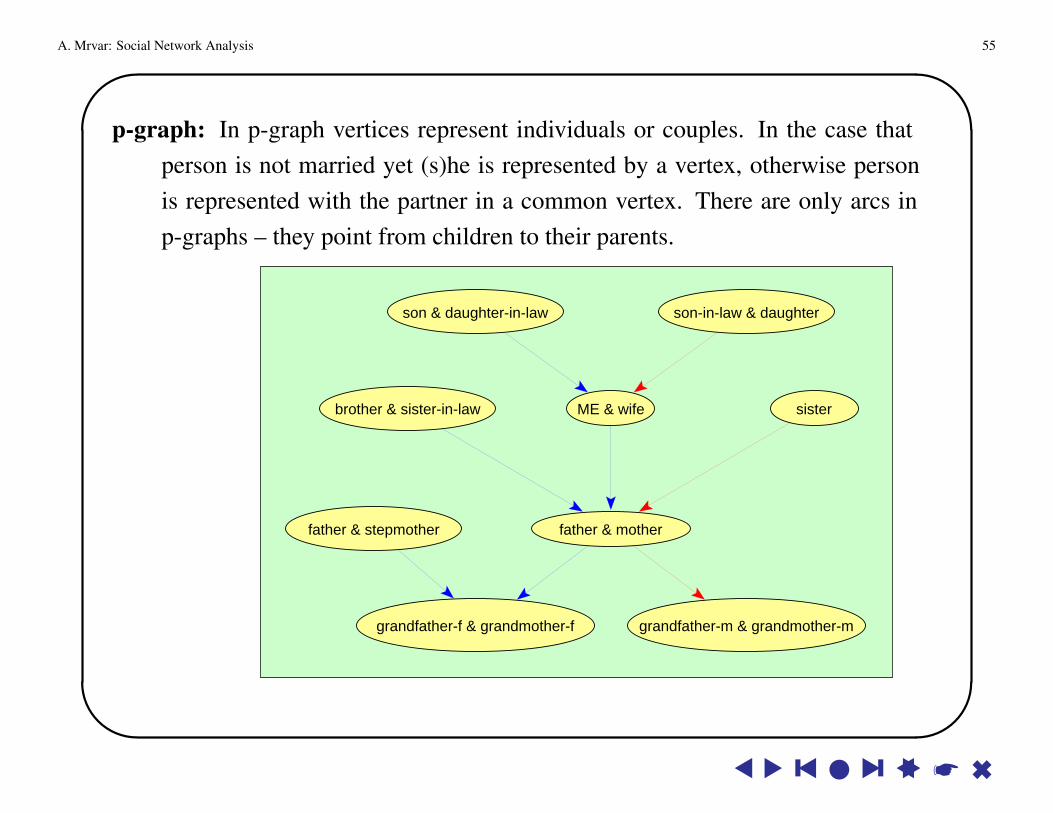
p-graph: In p-graph vertices represent individuals or couples. In the case thatperson is not married yet (s)he is represented by a vertex, otherwise personis represented with the partner in a common vertex. There are only arcs inp-graphs – they point from children to their parents.
son-in-law & daughter
ME & wife
father & mother
grandfather-f & grandmother-f grandfather-m & grandmother-m
son & daughter-in-law
brother & sister-in-law sister
father & stepmother
s s y s l s y ss * 6
A. Mrvar: Social Network Analysis 56'
&
$
%
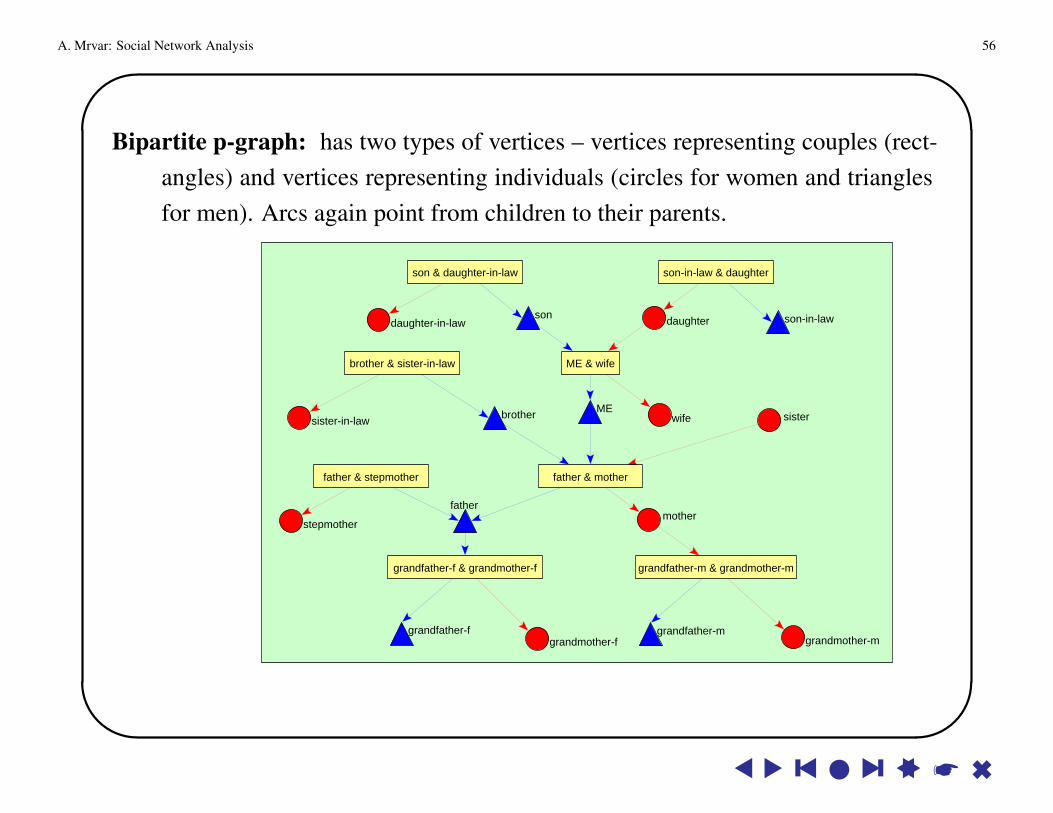
Bipartite p-graph: has two types of vertices – vertices representing couples (rect-angles) and vertices representing individuals (circles for women and trianglesfor men). Arcs again point from children to their parents.
son-in-law & daughter
ME & wife
father & mother
grandfather-f & grandmother-f grandfather-m & grandmother-m
son & daughter-in-law
brother & sister-in-law
father & stepmother
son daughter
brother sister
fathermother
ME
daughter-in-law son-in-law
sister-in-law wife
stepmother
grandfather-fgrandmother-f
grandfather-mgrandmother-m
s s y s l s y ss * 6

A. Mrvar: Social Network Analysis 57'
&
$
%
Largest component of genealogy of American presidents
George H.W. Bush
George W. Bush
Franklin D. Roosevelt
s s y s l s y ss * 6
A. Mrvar: Social Network Analysis 58'
&
$
%
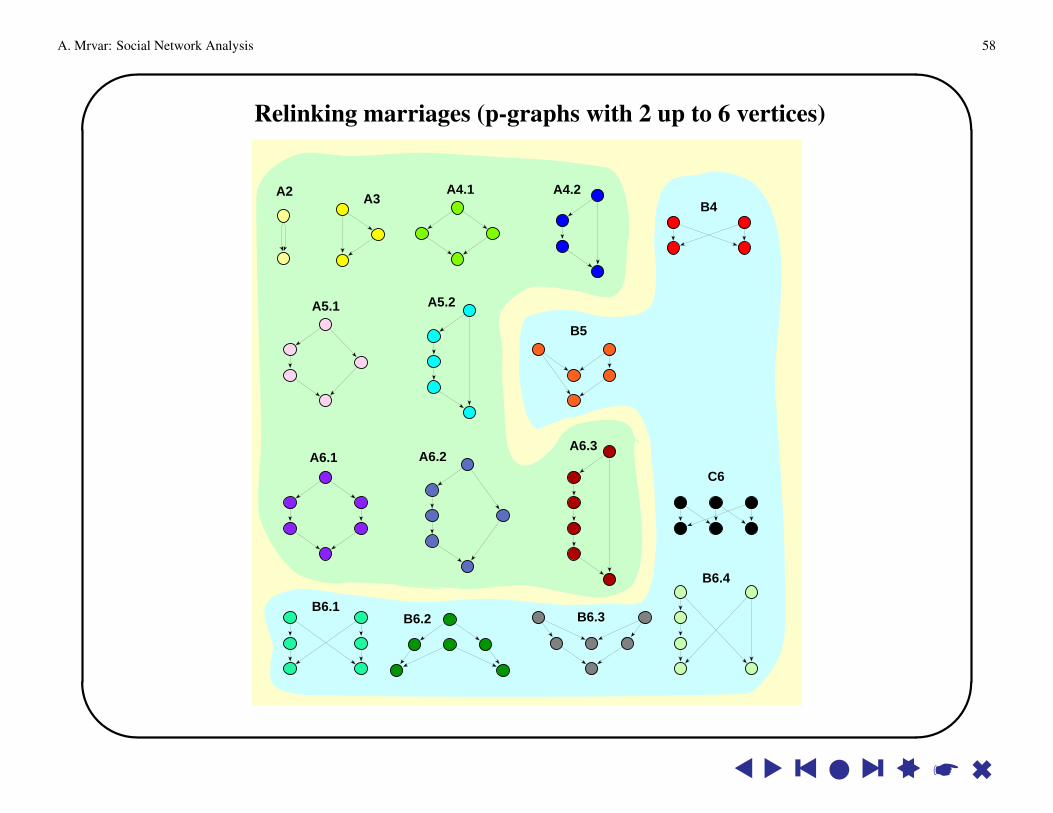
Relinking marriages (p-graphs with 2 up to 6 vertices)
A3A2 A4.1B4
A4.2
B6.2
A5.1 A5.2
B5
A6.1 A6.2A6.3
C6
B6.1B6.3
B6.4
s s y s l s y ss * 6
A. Mrvar: Social Network Analysis 59'
&
$
%
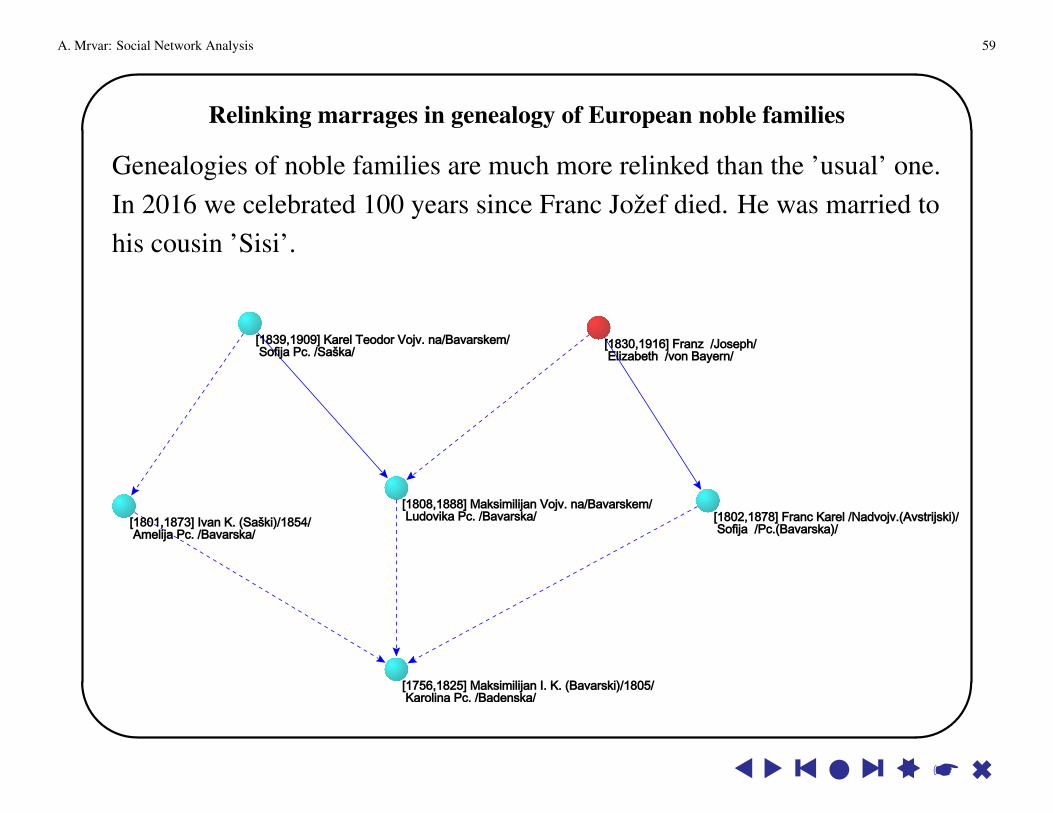
Relinking marrages in genealogy of European noble families
Genealogies of noble families are much more relinked than the ’usual’ one.In 2016 we celebrated 100 years since Franc Jozef died. He was married tohis cousin ’Sisi’.
s s y s l s y ss * 6
A. Mrvar: Social Network Analysis 60'
&
$
%
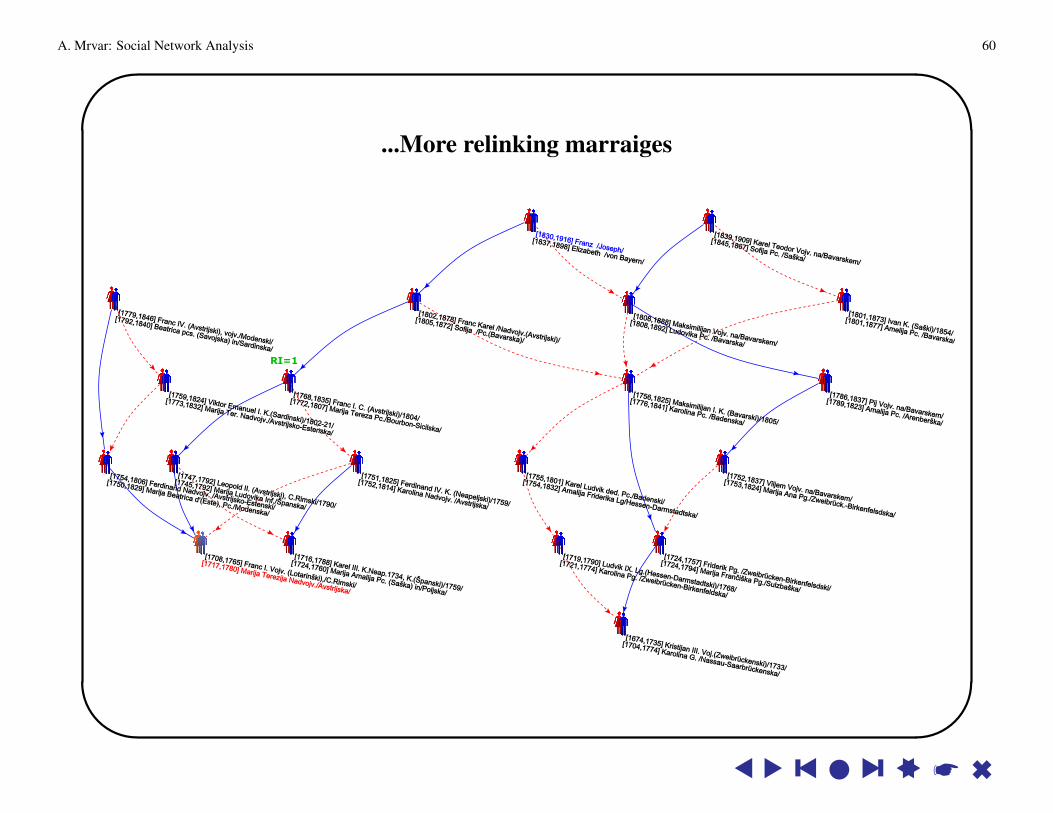
...More relinking marraiges
s s y s l s y ss * 6
A. Mrvar: Social Network Analysis 61'
&
$
%
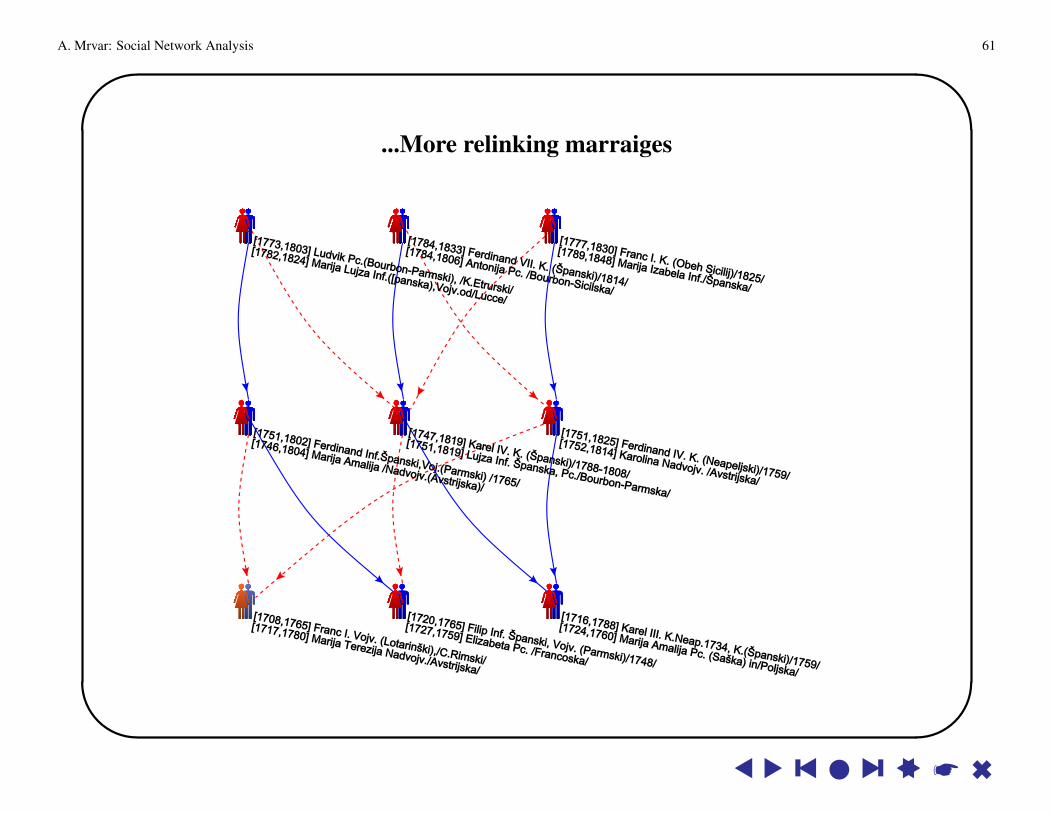
...More relinking marraiges
s s y s l s y ss * 6
A. Mrvar: Social Network Analysis 62'
&
$
%
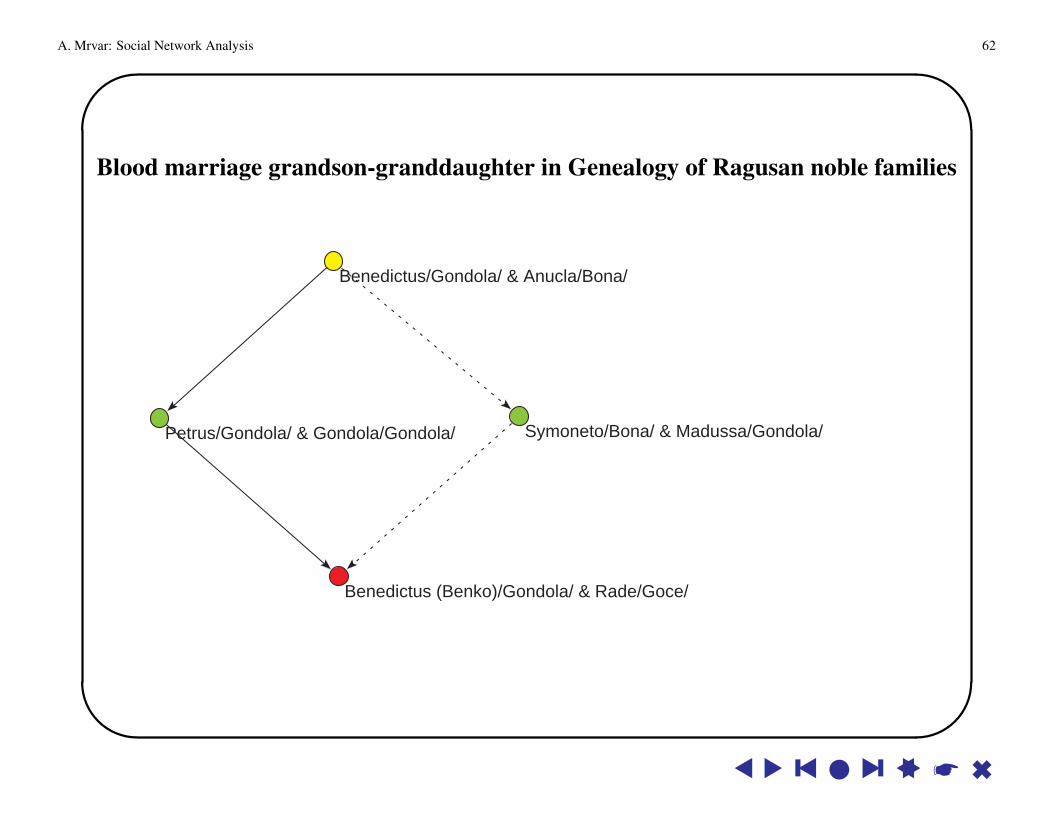
Blood marriage grandson-granddaughter in Genealogy of Ragusan noble families
Benedictus (Benko)/Gondola/ & Rade/Goce/
Petrus/Gondola/ & Gondola/Gondola/ Symoneto/Bona/ & Madussa/Gondola/
Benedictus/Gondola/ & Anucla/Bona/
s s y s l s y ss * 6
A. Mrvar: Social Network Analysis 63'
&
$
%
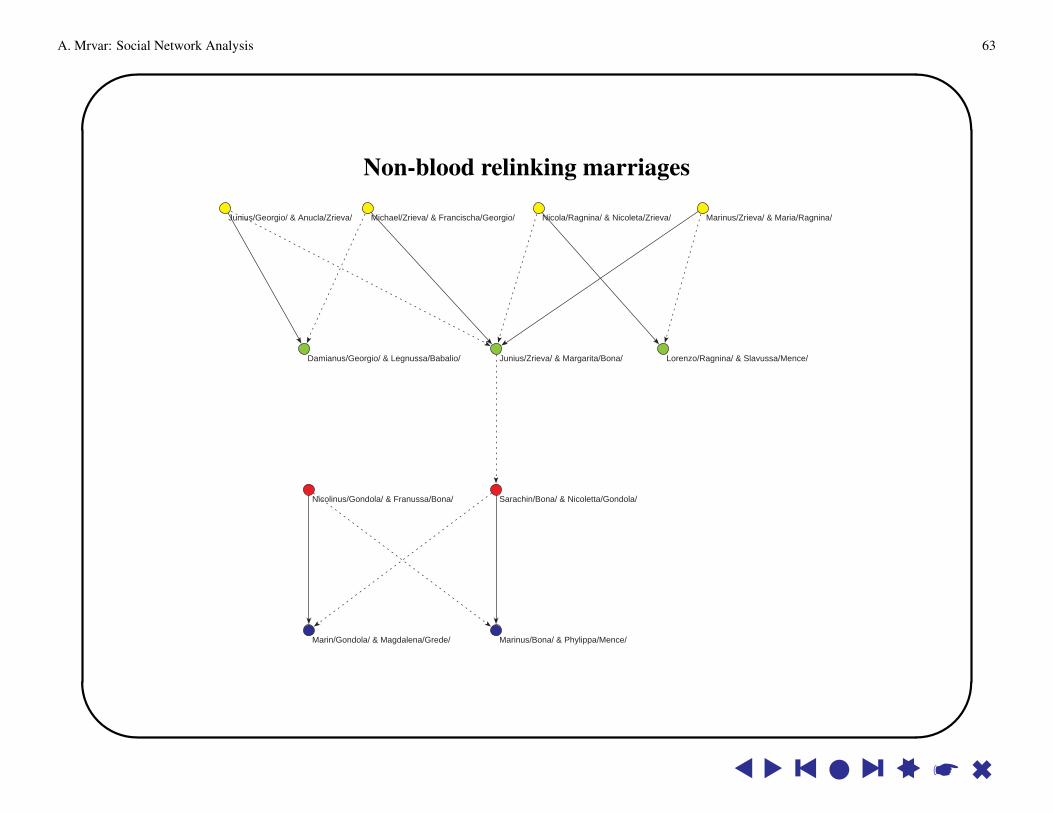
Non-blood relinking marriages
Damianus/Georgio/ & Legnussa/Babalio/
Marin/Gondola/ & Magdalena/Grede/
Nicolinus/Gondola/ & Franussa/Bona/
Marinus/Bona/ & Phylippa/Mence/
Sarachin/Bona/ & Nicoletta/Gondola/
Marinus/Zrieva/ & Maria/Ragnina/
Lorenzo/Ragnina/ & Slavussa/Mence/Junius/Zrieva/ & Margarita/Bona/
Junius/Georgio/ & Anucla/Zrieva/ Michael/Zrieva/ & Francischa/Georgio/ Nicola/Ragnina/ & Nicoleta/Zrieva/
s s y s l s y ss * 6