Introduction to Probability - Henri Picciotto · PDF file15. € Add a line representing...
12
Introduction to Probability 1 Algebra: Themes, Tools, Concepts www.MathEducationPage.org © 1994, Anita Wah and Henri Picciotto Introduction to Probability Adapted from Algebra: Themes, Tools, Concepts by Anita Wah and Henri Picciotto www.MathEducationPage.org/attc
Transcript of Introduction to Probability - Henri Picciotto · PDF file15. € Add a line representing...
Introduction to Probability 1
Algebra: Themes, Tools, Concepts www.MathEducationPage.org © 1994, Anita Wah and Henri Picciotto
Introduction to Probability
Adapted from Algebra: Themes, Tools, Concepts by Anita Wah and Henri Picciotto
www.MathEducationPage.org/attc
Introduction to Probability 2
Algebra: Themes, Tools, Concepts www.MathEducationPage.org © 1994, Anita Wah and Henri Picciotto
1. Dice Games
You will need: dice
1. Exploration. Play these games with another person. To play, roll a pair of dice and add the numbers on the uppermost faces. Roll twenty times, keeping track of how many rolls each player wins. Whoever wins the most rolls wins the game. First Game: If the sum is 3, 5, 7, 9, or 11, Player A wins. If the sum is 2, 4, 6, 8, 10, or 12, Player B
wins. Second Game: If the sum is 5, 6, 7, 8, or 9, Player A wins. If the sum is 2, 3, 4, 10, 11, or 12,
Player B wins. For each game, who wins more often ? Why?
If we roll a red die and a blue die, there are many possible outcomes. We will use (4,3) to refer to the outcome in which 4 dots appear uppermost on the red die and 3 dots appear uppermost on the blue die. Likewise, (3,4) refers to 3 on the red die and 4 on the blue die. Both of these outcomes show a sum of seven.
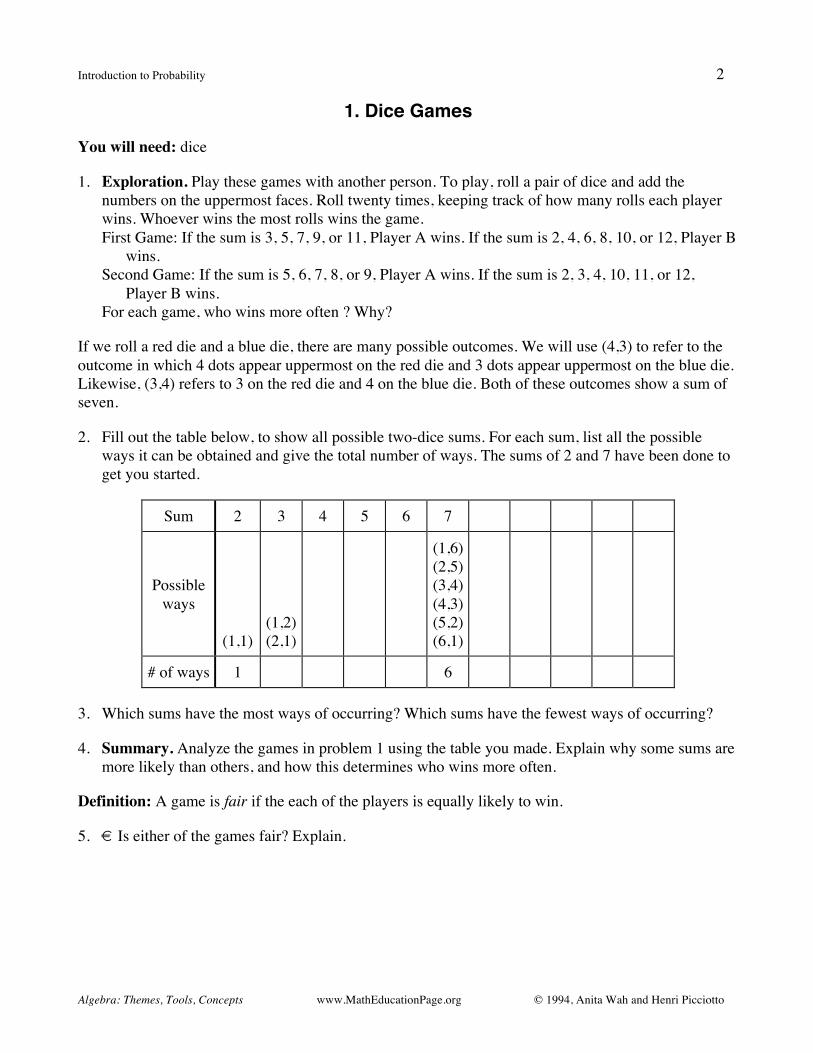
2. Fill out the table below, to show all possible two-dice sums. For each sum, list all the possible ways it can be obtained and give the total number of ways. The sums of 2 and 7 have been done to get you started.
Sum 2 3 4 5 6 7
Possible ways
(1,1)
(1,2) (2,1)
(1,6) (2,5) (3,4) (4,3) (5,2) (6,1)
# of ways 1 6
3. Which sums have the most ways of occurring? Which sums have the fewest ways of occurring?
4. Summary. Analyze the games in problem 1 using the table you made. Explain why some sums are more likely than others, and how this determines who wins more often.
Definition: A game is fair if the each of the players is equally likely to win.
5. € Is either of the games fair? Explain.
Introduction to Probability 3
Algebra: Themes, Tools, Concepts www.MathEducationPage.org © 1994, Anita Wah and Henri Picciotto
Outcomes and Events
Definition: We call one roll of the dice an experiment. Each of the different possibilities you listed in the table of dice rolls is called an outcome of the experiment.
6. When you roll a red die and a blue die, how many outcomes are possible?
7. If you flip a penny and a nickel, how many outcomes are possible? Make a list.
8. * If you roll a red, a blue, and a yellow die, how many outcomes are possible?
When an experiment is performed, we are usually interested in whether or not a particular event has occurred. An event consists of one or more outcomes.
In the two-dice experiment, an example of an event could be: the sum of the dots is even. This event was important in the First Game. In that game, 36 outcomes were possible, but we were not interested in the individual outcomes, but only in which of the two events had occurred: an even sum, or an odd sum.
9. What events were we interested in in the Second Game of Problem 1?
10. The outcome of a two-dice experiment is (3,2). Which of the following events occurred? a. the difference is even b. the product is even c. one die shows a multiple of the other d. the sum is a prime number
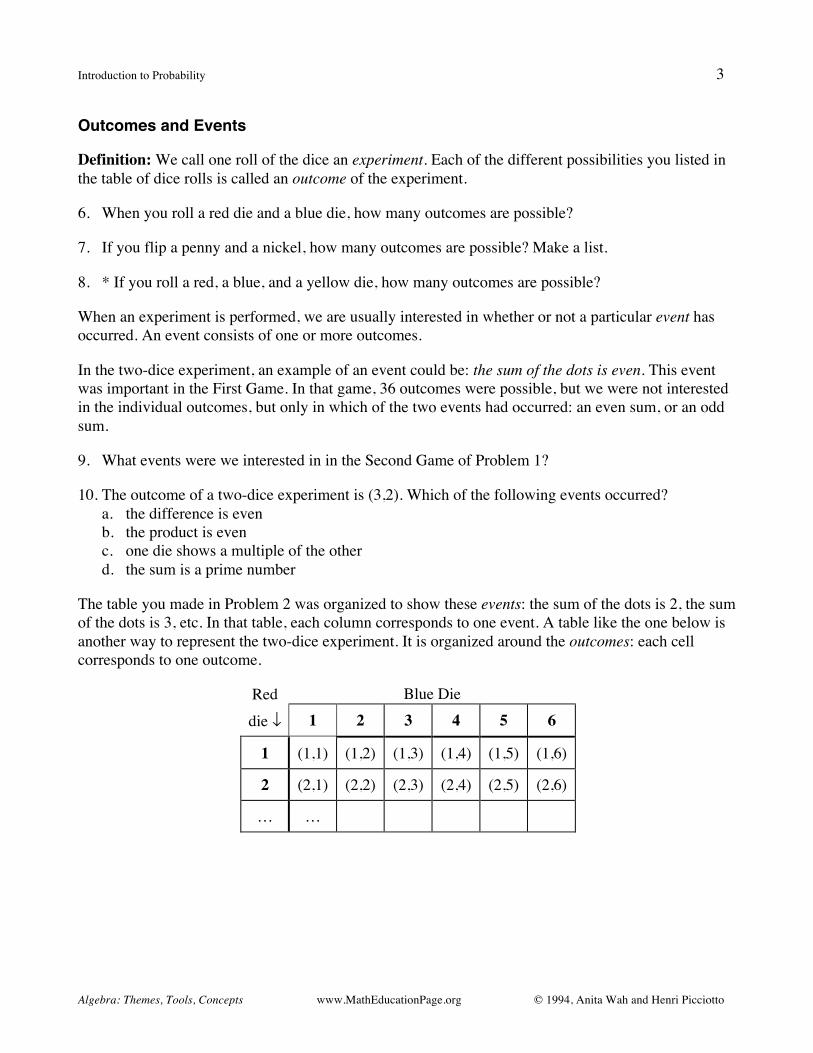
The table you made in Problem 2 was organized to show these events: the sum of the dots is 2, the sum of the dots is 3, etc. In that table, each column corresponds to one event. A table like the one below is another way to represent the two-dice experiment. It is organized around the outcomes: each cell corresponds to one outcome.
Red die ↓
Blue Die 1 2 3 4 5 6
1 (1,1) (1,2) (1,3) (1,4) (1,5) (1,6)
2 (2,1) (2,2) (2,3) (2,4) (2,5) (2,6)
… …
Introduction to Probability 4
Algebra: Themes, Tools, Concepts www.MathEducationPage.org © 1994, Anita Wah and Henri Picciotto
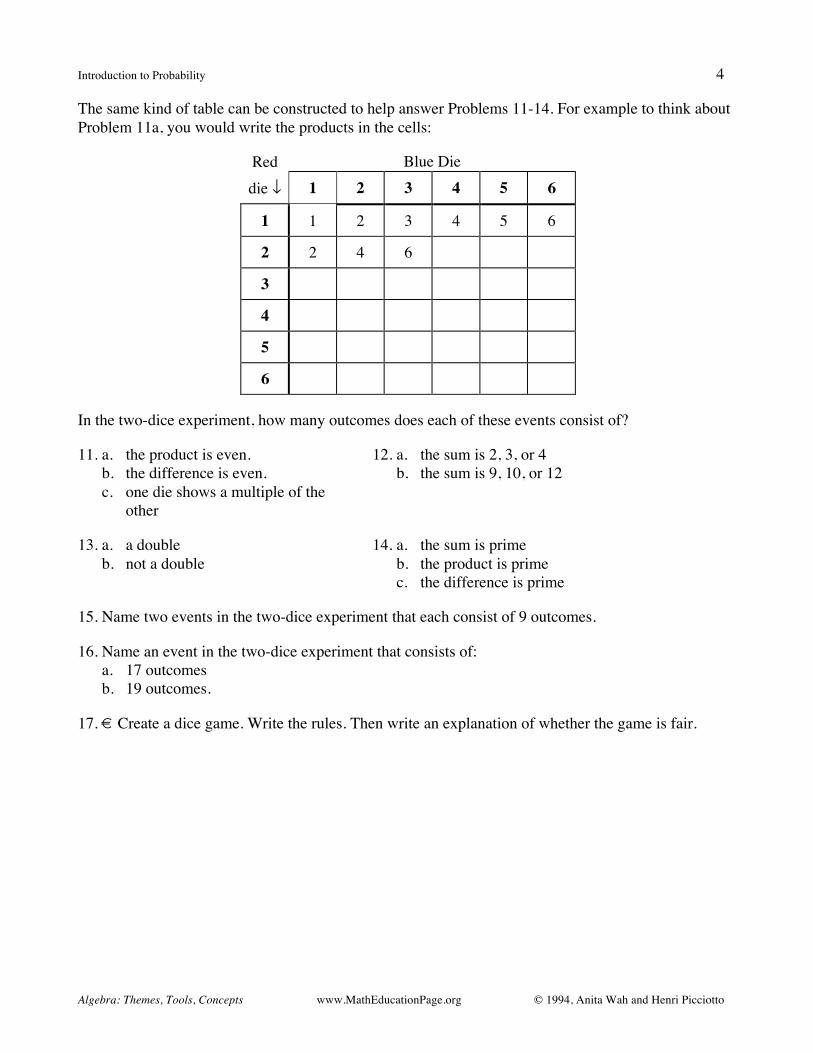
The same kind of table can be constructed to help answer Problems 11-14. For example to think about Problem 11a, you would write the products in the cells:
Red die ↓
Blue Die 1 2 3 4 5 6
1 1 2 3 4 5 6
2 2 4 6
3
4
5
6
In the two-dice experiment, how many outcomes does each of these events consist of?
11. a. the product is even. b. the difference is even. c. one die shows a multiple of the
other
12. a. the sum is 2, 3, or 4 b. the sum is 9, 10, or 12
13. a. a double b. not a double
14. a. the sum is prime b. the product is prime c. the difference is prime
15. Name two events in the two-dice experiment that each consist of 9 outcomes.
16. Name an event in the two-dice experiment that consists of: a. 17 outcomes b. 19 outcomes.
17. € Create a dice game. Write the rules. Then write an explanation of whether the game is fair.

Introduction to Probability 5
Algebra: Themes, Tools, Concepts www.MathEducationPage.org © 1994, Anita Wah and Henri Picciotto
2. What is Probability?
You will need: two coins
This lesson will introduce you to three interpretations of probability.
Relative Frequency
While waiting for his food at the Slow Food Café, Zoltan was asking himself what is the probability of getting at least one head when tossing two coins. He thought it might be 1/2, since there was an equal chance to get heads or tails, or 1/3, since there were three possibilities (two heads, one head, no heads). He decided to find out by doing an experiment. Here are his notes on the first eight tosses (or trials):
HH, HT, TT, HT, HH, TT, TH, TT…
He made a table of the results. A success is a toss where one or two heads appeared.
Definition: The relative frequency of the successes is the ratio of successes to trials.
He graphed the results, with relative frequency on the y-axis, and trials on the x-axis.
1. Toss a pair of coins 30 times. Make a table like Zoltan's.
2. Make a graph like Zoltan's for the data in your table.
3. € If you tossed the coins 100 times, what do you think the graph would look like? What if you tossed them 500 times? Explain.
Trials so far
Successes so far
Relative Frequency
1 1 1/1=1.00
2 2 2/2=1.00
3 2 2/3=.67
4 3 3/4=.75
5 4 4/5=.80
6 4 4/6=.67
7 5 5/7=.72
8 5 5/8=.63 trials
Introduction to Probability 6
Algebra: Themes, Tools, Concepts www.MathEducationPage.org © 1994, Anita Wah and Henri Picciotto
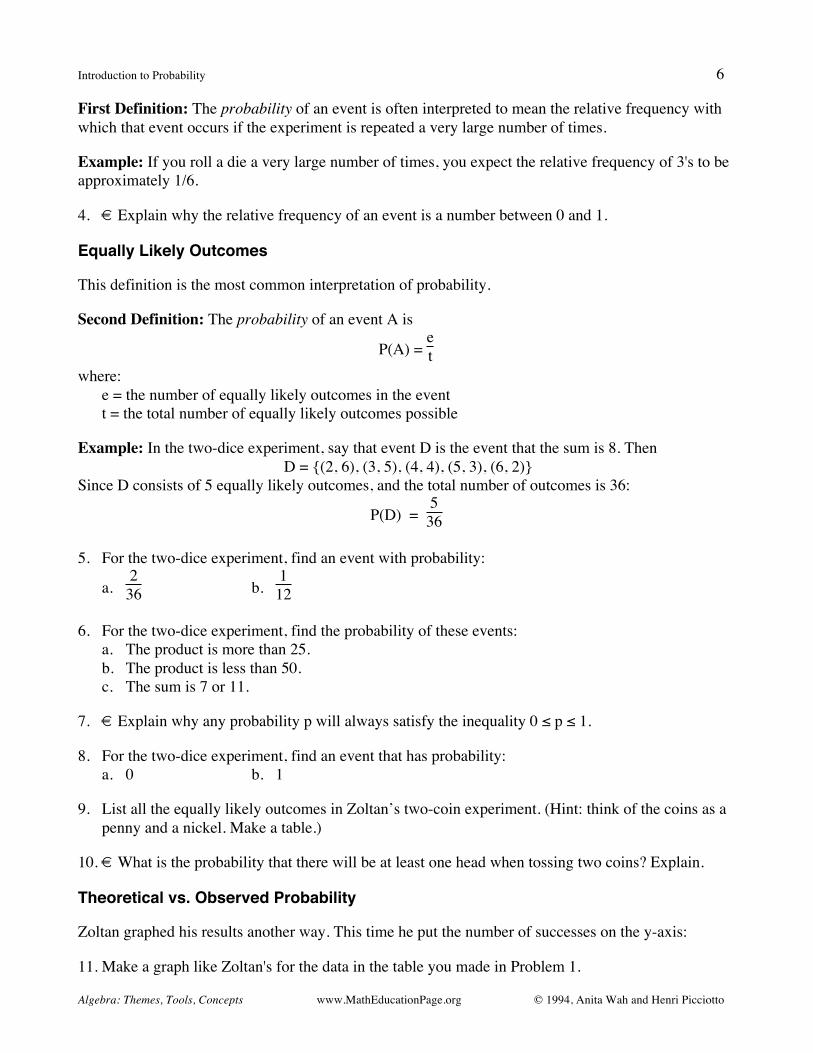
First Definition: The probability of an event is often interpreted to mean the relative frequency with which that event occurs if the experiment is repeated a very large number of times.
Example: If you roll a die a very large number of times, you expect the relative frequency of 3's to be approximately 1/6.
4. € Explain why the relative frequency of an event is a number between 0 and 1.
Equally Likely Outcomes
This definition is the most common interpretation of probability.
Second Definition: The probability of an event A is
P(A) = et
where: e = the number of equally likely outcomes in the event t = the total number of equally likely outcomes possible
Example: In the two-dice experiment, say that event D is the event that the sum is 8. Then D = {(2, 6), (3, 5), (4, 4), (5, 3), (6, 2)}
Since D consists of 5 equally likely outcomes, and the total number of outcomes is 36:
P(D) = 536
5. For the two-dice experiment, find an event with probability:
a. 236 b.
112
6. For the two-dice experiment, find the probability of these events: a. The product is more than 25. b. The product is less than 50. c. The sum is 7 or 11.
7. € Explain why any probability p will always satisfy the inequality 0 ≤ p ≤ 1.
8. For the two-dice experiment, find an event that has probability: a. 0 b. 1
9. List all the equally likely outcomes in Zoltan’s two-coin experiment. (Hint: think of the coins as a penny and a nickel. Make a table.)
10. € What is the probability that there will be at least one head when tossing two coins? Explain.
Theoretical vs. Observed Probability
Zoltan graphed his results another way. This time he put the number of successes on the y-axis:
11. Make a graph like Zoltan's for the data in the table you made in Problem 1.
Introduction to Probability 7
Algebra: Themes, Tools, Concepts www.MathEducationPage.org © 1994, Anita Wah and Henri Picciotto
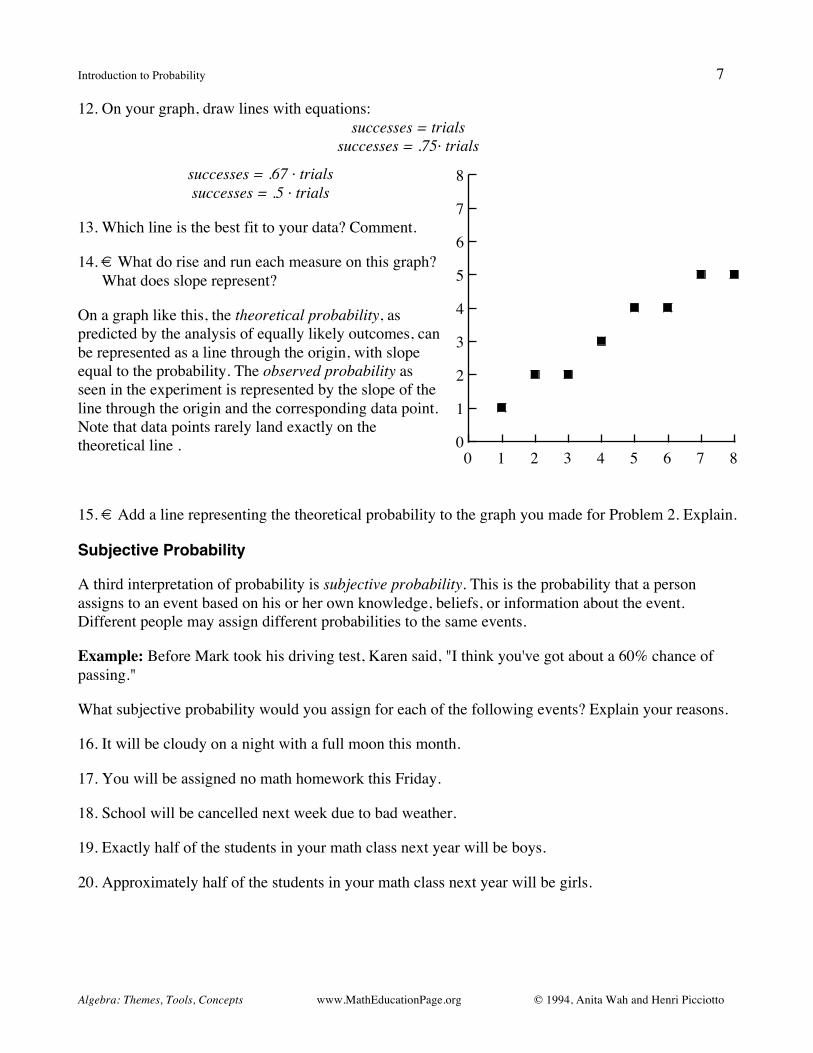
12. On your graph, draw lines with equations: successes = trials
successes = .75· trials
successes = .67 · trials successes = .5 · trials
13. Which line is the best fit to your data? Comment.
14. € What do rise and run each measure on this graph? What does slope represent?
On a graph like this, the theoretical probability, as predicted by the analysis of equally likely outcomes, can be represented as a line through the origin, with slope equal to the probability. The observed probability as seen in the experiment is represented by the slope of the line through the origin and the corresponding data point. Note that data points rarely land exactly on the theoretical line .
15. € Add a line representing the theoretical probability to the graph you made for Problem 2. Explain.
Subjective Probability
A third interpretation of probability is subjective probability. This is the probability that a person assigns to an event based on his or her own knowledge, beliefs, or information about the event. Different people may assign different probabilities to the same events.
Example: Before Mark took his driving test, Karen said, "I think you've got about a 60% chance of passing."
What subjective probability would you assign for each of the following events? Explain your reasons.
16. It will be cloudy on a night with a full moon this month.
17. You will be assigned no math homework this Friday.
18. School will be cancelled next week due to bad weather.
19. Exactly half of the students in your math class next year will be boys.
20. Approximately half of the students in your math class next year will be girls.
0 1 2 3 4 5 6 7 80
1
2
3
4
5
6
7
8
Introduction to Probability 8
Algebra: Themes, Tools, Concepts www.MathEducationPage.org © 1994, Anita Wah and Henri Picciotto
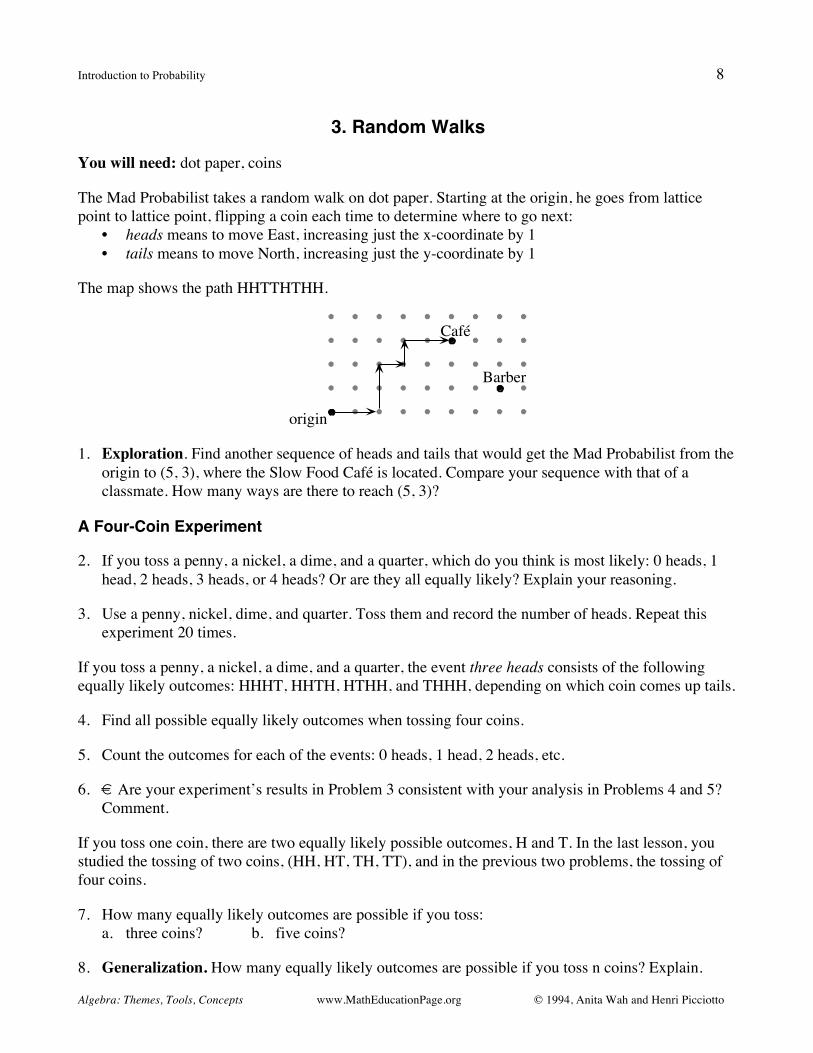
3. Random Walks
You will need: dot paper, coins
The Mad Probabilist takes a random walk on dot paper. Starting at the origin, he goes from lattice point to lattice point, flipping a coin each time to determine where to go next:
• heads means to move East, increasing just the x-coordinate by 1 • tails means to move North, increasing just the y-coordinate by 1
The map shows the path HHTTHTHH.
1. Exploration. Find another sequence of heads and tails that would get the Mad Probabilist from the origin to (5, 3), where the Slow Food Café is located. Compare your sequence with that of a classmate. How many ways are there to reach (5, 3)?
A Four-Coin Experiment
2. If you toss a penny, a nickel, a dime, and a quarter, which do you think is most likely: 0 heads, 1 head, 2 heads, 3 heads, or 4 heads? Or are they all equally likely? Explain your reasoning.
3. Use a penny, nickel, dime, and quarter. Toss them and record the number of heads. Repeat this experiment 20 times.
If you toss a penny, a nickel, a dime, and a quarter, the event three heads consists of the following equally likely outcomes: HHHT, HHTH, HTHH, and THHH, depending on which coin comes up tails.
4. Find all possible equally likely outcomes when tossing four coins.
5. Count the outcomes for each of the events: 0 heads, 1 head, 2 heads, etc.
6. € Are your experiment’s results in Problem 3 consistent with your analysis in Problems 4 and 5? Comment.
If you toss one coin, there are two equally likely possible outcomes, H and T. In the last lesson, you studied the tossing of two coins, (HH, HT, TH, TT), and in the previous two problems, the tossing of four coins.
7. How many equally likely outcomes are possible if you toss: a. three coins? b. five coins?
8. Generalization. How many equally likely outcomes are possible if you toss n coins? Explain.
origin
Café
Barber
Introduction to Probability 9
Algebra: Themes, Tools, Concepts www.MathEducationPage.org © 1994, Anita Wah and Henri Picciotto
Tossing the same coin repeatedly works in a similar way. For example, one possible string of 8 tosses is: TTHTHTTH, just like one possible outcome of tossing 8 coins is TTHTHTTH.
9. If you toss one coin 8 times, how many possible outcomes are there? How about n times?
The Mad Probabilist
10. How many moves does it take the Mad Probabilist to get to (5, 3)?
11. Generalization. How many moves does it take him to get to (p, q)? Explain.
12. a. Where might he be after 6 moves? b. Make a list of the points he could get to in 7 moves.
13. € How would you describe the set you listed in Problem 12b? (How many points does it consist of? What equation relates their coordinates?) Explain.
14. Generalization. Describe the set of points he could reach in n moves. Explain.
15. € The number of possible points he could end up on after 8 tosses is different from the number of possible strings of 8 tosses. Why? Explain.
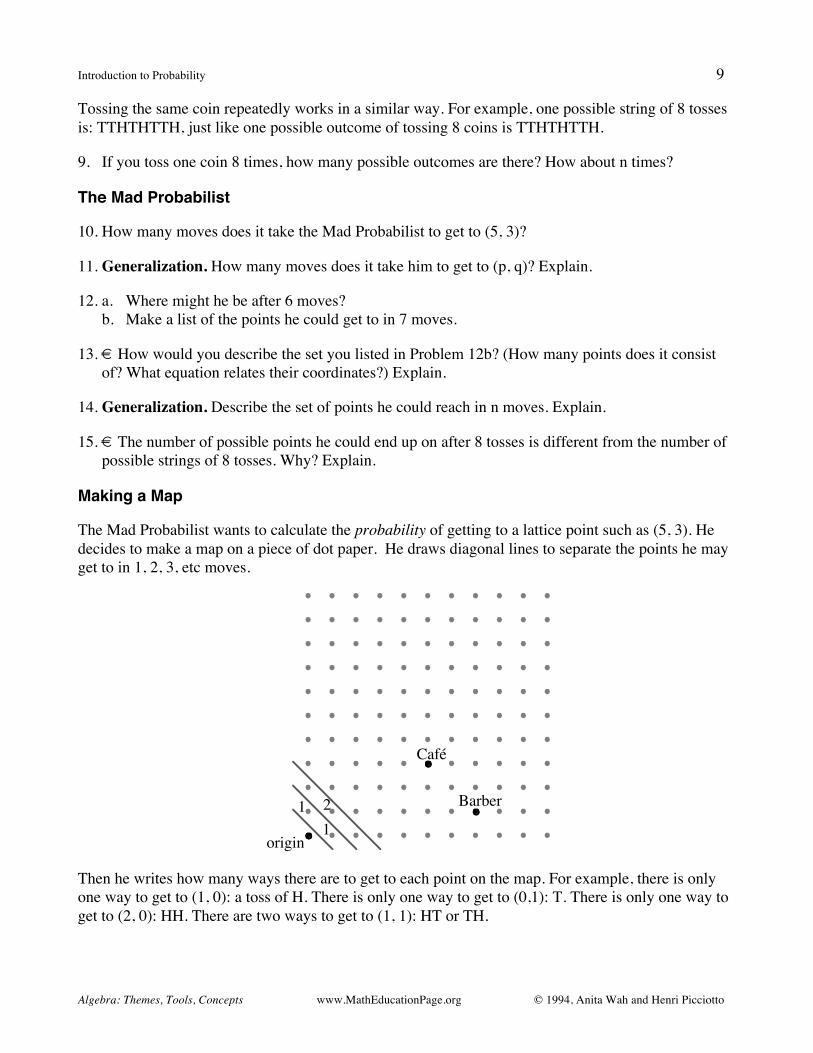
Making a Map
The Mad Probabilist wants to calculate the probability of getting to a lattice point such as (5, 3). He decides to make a map on a piece of dot paper. He draws diagonal lines to separate the points he may get to in 1, 2, 3, etc moves.
Then he writes how many ways there are to get to each point on the map. For example, there is only one way to get to (1, 0): a toss of H. There is only one way to get to (0,1): T. There is only one way to get to (2, 0): HH. There are two ways to get to (1, 1): HT or TH.
origin
Café
Barber
121
Introduction to Probability 10
Algebra: Themes, Tools, Concepts www.MathEducationPage.org © 1994, Anita Wah and Henri Picciotto
As he makes his map, he finds it helpful to ask himself for each point: “Where could I have come from to get here?”
16. Continue the Mad Probabilist’s map, until you get to (5, 3).
The Mad Probabilist reasons: “At the end of eight moves, I will be at one of these points, one of which is the Slow Food Café. ” He marks the points on his map. “The outcomes are 8-move paths; the event is those paths that end up at (5, 3). To find out the probability of this event, I need a numerator and a denominator. I write:
P(5, 3) = # of paths that get to (5, 3)
# of 8-move paths
17. What is P(5, 3)? In other words, what is the probability the Mad Probabilist’s random walk will end up at the Slow Food Café?
18. What is the probability it will end up at (7, 1), where the barbershop is? Explain.
19. Summary. Explain how you can get the probability of getting to any lattice point in the first quadrant.
Introduction to Probability 11
Algebra: Themes, Tools, Concepts www.MathEducationPage.org © 1994, Anita Wah and Henri Picciotto
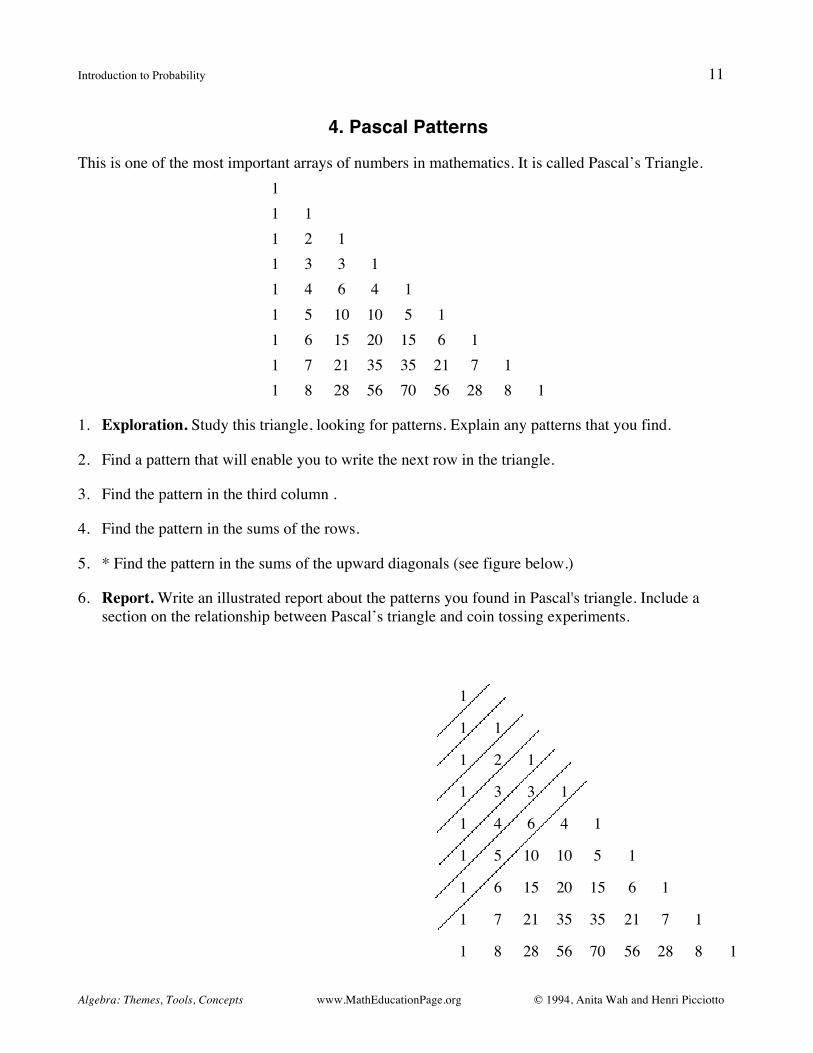
4. Pascal Patterns
This is one of the most important arrays of numbers in mathematics. It is called Pascal’s Triangle. 1 1 1 1 2 1 1 3 3 1 1 4 6 4 1 1 5 10 10 5 1 1 6 15 20 15 6 1 1 7 21 35 35 21 7 1 1 8 28 56 70 56 28 8 1
1. Exploration. Study this triangle, looking for patterns. Explain any patterns that you find.
2. Find a pattern that will enable you to write the next row in the triangle.
3. Find the pattern in the third column .
4. Find the pattern in the sums of the rows.
5. * Find the pattern in the sums of the upward diagonals (see figure below.)
6. Report. Write an illustrated report about the patterns you found in Pascal's triangle. Include a section on the relationship between Pascal’s triangle and coin tossing experiments.
1
1 1
1 2 1
1 3 3 1
1 4 6 4 1
1 5 10 10 5 1
1 6 15 20 15 6 1
1 7 21 35 35 21 7 1
1 8 28 56 70 56 28 8 1
Introduction to Probability 12
Algebra: Themes, Tools, Concepts www.MathEducationPage.org © 1994, Anita Wah and Henri Picciotto
5. Problems About Games and Probability
1. If you choose a letter at random from the alphabet, what's the probability that it's a vowel?
2. If you choose a month at random, what's the probability that its name: a. begins with J? b. contains an R?
3. Assume that you draw one card from an ordinary deck of 52 playing cards. What's the probability that you draw: a. a 7? b. a heart? c. a 7 or a heart? d. a 7 of hearts?
4. Which game, if either, is fair? Explain. a. Roll a pair of dice and multiply the numbers on the uppermost faces. If the product is 18 or
greater, Player A wins. If the product is less than 18, Player B wins. b. Toss three coins. If the number of heads is even, Player A wins. If it is odd, Player B wins. c. * Repeat Part (b) for six coins.