Introduction to LabVIEW
118
Introduction to LabVIEW TM Six-Hour Course Course Software Version X.X September 2003 Edition Part Number 323669B-01 Copyright © 2003 National Instruments Corporation. All rights reserved. Universities, colleges, and other educational institutions may reproduce all or part of this publication for educational use. For all other uses, this publication may not be reproduced or transmitted in any form, electronic or mechanical, including photocopying, recording, storing in an information retrieval system, or translating, in whole or in part, without the prior written consent of National Instruments Corporation. Trademarks LabVIEW™, National Instruments™, NI™, and ni.com™ are trademarks of National Instruments Corporation. Product and company names mentioned herein are trademarks or trade names of their respective companies. Patents For patents covering National Instruments products, refer to the appropriate location: Help»Patents in your software, the patents.txt file on your CD, or ni.com/legal/patents.
-
Upload
herman-herklotz -
Category
Documents
-
view
43 -
download
0
description
A clear explanation for new students to learn LabVIEW.
Transcript of Introduction to LabVIEW
Introduction to LabVIEWTM Six-Hour Course
Course Software Version X.XSeptember 2003 EditionPart Number 323669B-01
Copyright
© 2003 National Instruments Corporation. All rights reserved. Universities, colleges, and other educational institutions may reproduce all or part of this publication for educational use. For all other uses, this publication may not be reproduced or transmitted in any form, electronic or mechanical, including photocopying, recording, storing in an information retrieval system, or translating, in whole or in part, without the prior written consent of National Instruments Corporation.
TrademarksLabVIEW™, National Instruments™, NI™, and ni.com™ are trademarks of National Instruments Corporation.Product and company names mentioned herein are trademarks or trade names of their respective companies.
PatentsFor patents covering National Instruments products, refer to the appropriate location: Help»Patents in your software, the patents.txt file on your CD, or ni.com/legal/patents.

Worldwide Technical Support and Product Informationni.com
National Instruments Corporate Headquarters11500 North Mopac Expressway Austin, Texas 78759-3504 USA Tel: 512 683 0100
Worldwide OfficesAustralia 1800 300 800, Austria 43 0 662 45 79 90 0, Belgium 32 0 2 757 00 20, Brazil 55 11 3262 3599, Canada (Calgary) 403 274 9391, Canada (Montreal) 514 288 5722, Canada (Ottawa) 613 233 5949, Canada (Québec) 514 694 8521, Canada (Toronto) 905 785 0085, Canada (Vancouver) 514 685 7530, China 86 21 6555 7838, Czech Republic 420 2 2423 5774, Denmark 45 45 76 26 00, Finland 385 0 9 725 725 11, France 33 0 1 48 14 24 24, Germany 49 0 89 741 31 30, Greece 30 2 10 42 96 427, India 91 80 51190000, Israel 972 0 3 6393737, Italy 39 02 413091, Japan 81 3 5472 2970, Korea 82 02 3451 3400, Malaysia 603 9131 0918, Mexico 001 800 010 0793, Netherlands 31 0 348 433 466, New Zealand 0800 553 322, Norway 47 0 66 90 76 60, Poland 48 0 22 3390 150, Portugal 351 210 311 210, Russia 7 095 783 68 51, Singapore 65 6226 5886, Slovenia 386 3 425 4200, South Africa 27 0 11 805 8197, Spain 34 91 640 0085, Sweden 46 0 8 587 895 00, Switzerland 41 56 200 51 51, Taiwan 886 2 2528 7227, Thailand 662 992 7519, United Kingdom 44 0 1635 523545

LabVIEW Six Hour Course � Instructor Notes This zip file contains material designed to give students a working knowledge of LabVIEW in a 6 hour timeframe. The contents are: • Instructor Notes.doc � this document. • LabVIEWIntroduction-SixHour.ppt � a PowerPoint presentation containing
screenshots and notes on the topics covered by the course. • Ex0-Open and Run a Virtual Instrument.doc � step by step instructions for the �open
and run� exercise. • Ex1-Convert C to F.doc � step by step instructions for Exercise 1. • Convert C to F (Ex1).vi � Exercise 1 solution VI. • Ex2a-Create a SubVI.doc � step by step instructions for Exercise 2a. • Convert C to F (Ex2).vi � Exercise 2 solution subVI. • Ex2b-Data Acquisition.doc � step by step instructions for Exercise 2b. • Thermometer-DAQ (Ex2).vi � Exercise 2 solution VI. • Ex3-Use a Loop.doc � step by step instructions for Exercise 3. • Temperature Monitor (Ex3).vi � Exercise 3 solution VI. • Ex4-Analyzing and Logging Data.doc � step by step instructions for Exercise 4. • Temperature logger (Ex4).vi � Exercise 4 solution subVI. • Convert C to F (Ex4).vi � Exercise 4 solution subVI. • Temperature Logger (Ex4).vi � Exercise 4 solution VI. • Ex5-Using Waveform Graphs.doc � step by step instructions for Exercise 5. • Multiplot Graph (Ex5).vi � Exercise 5 solution VI. • Ex6-Error Clusters.doc � step by step instructions for Exercise 6. • Square Root (Ex6).vi � Exercise 6 solution VI. • Ex7-Simple State Machines.doc � step by step instructions for Exercise 7. • State Machine 1 (Ex7).vi � Exercise 7 solution VI. The slides can be presented in two three hour labs, or six one hour lectures. Depending on the time and resources available in class, you can choose whether to assign the exercises as homework or to be done in class. If you decide to assign the exercises in class, it is best to assign them in order with the presentation. This way the students can create VIs while the relevant information is still fresh. The notes associated with the exercise slide should be sufficient to guide the students to a solution. The solution files included are one possible solution, but by no means the only solution. The step by step instructions provide the student with an easy means to complete the exercise, but if you decide to assign the exercises outside of a classroom, you may find it useful to print out the abbreviated directions from the exercise slide and hand them to the students as an assignment. The exercises can be submitted via email to a grader.

1
Virtual Instrumentation With LabVIEW

2
Course Goals
� Understand the components of a Virtual Instrument� Introduce LabVIEW and common LabVIEW functions � Build a simple data acquisition application� Create a subroutine in LabVIEW� Work with Arrays, Clusters, and Structures� Learn About Printing & Documentation Features� Develop in Basic Programming Architectures� Publish VIs on the Web
This is a list of the objectives of the course.
This course prepares you to do the following:� Use LabVIEW to create applications.� Understand front panels, block diagrams, and icons and connector panes.� Use built-in LabVIEW functions.� Create and save programs in LabVIEW so you can use them as subroutines.� Create applications that use plug-in DAQ devices.
This course does not describe any of the following:� Programming theory� Every built-in LabVIEW function or object� Analog-to-digital (A/D) theory
3
Section I
� LabVIEW terms� Components of a LabVIEW application� LabVIEW programming tools� Creating an application in LabVIEW
4
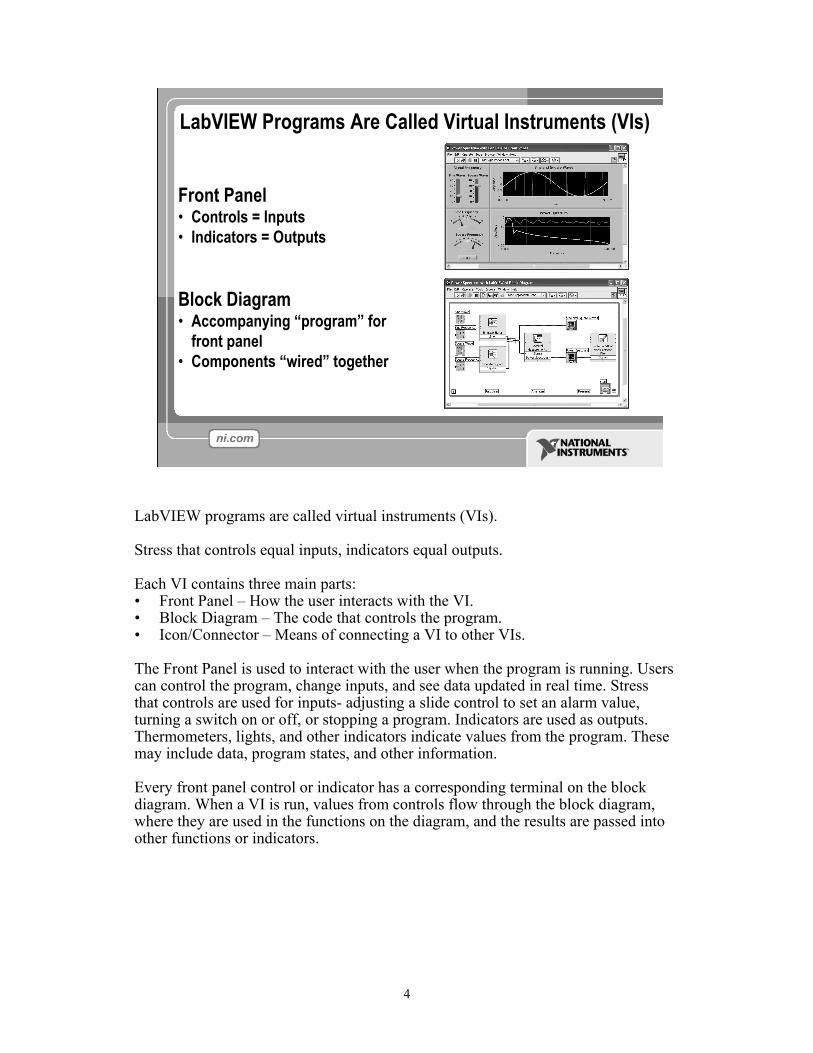
LabVIEW Programs Are Called Virtual Instruments (VIs)
Front Panel� Controls = Inputs� Indicators = Outputs
Block Diagram� Accompanying �program� for
front panel� Components �wired� together
LabVIEW programs are called virtual instruments (VIs).
Stress that controls equal inputs, indicators equal outputs.
Each VI contains three main parts:� Front Panel � How the user interacts with the VI.� Block Diagram � The code that controls the program.� Icon/Connector � Means of connecting a VI to other VIs.
The Front Panel is used to interact with the user when the program is running. Users can control the program, change inputs, and see data updated in real time. Stress that controls are used for inputs- adjusting a slide control to set an alarm value, turning a switch on or off, or stopping a program. Indicators are used as outputs. Thermometers, lights, and other indicators indicate values from the program. These may include data, program states, and other information.
Every front panel control or indicator has a corresponding terminal on the block diagram. When a VI is run, values from controls flow through the block diagram, where they are used in the functions on the diagram, and the results are passed into other functions or indicators.

5
VI Front PanelFront Panel Toolbar
GraphLegend
BooleanControl
WaveformGraph
Icon
PlotLegend
ScaleLegend
The front panel is the user interface of the VI. You build the front panel with controls and indicators, which are the interactive input and output terminals of the VI, respectively. Controls are knobs, pushbuttons, dials, and other input devices. Indicators are graphs, LEDs, and other displays. Controls simulate instrument input devices and supply data to the block diagram of the VI. Indicators simulate instrument output devices and display data the block diagram acquires or generates.
In this picture, the Power switch is a boolean control. A boolean contains either a true or false value. The value is false until the switch is pressed. When the switch is pressed, the value becomes true. The temperature history indicator is a waveform graph. It displays multiple numbers. In this case, the graph will plot Deg F versus Time (sec).
The front panel also contains a toolbar, whose functions we will discuss later.

6
VI Block Diagram
Wire Data
GraphTerminal
SubVI
While LoopStructure
Block Diagram Toolbar Divide
Function
Numeric Constant
Timing Function
Boolean Control Terminal
The block diagram contains this graphical source code. Front panel objects appear as terminals on the block diagram. Additionally, the block diagram contains functions and structures from built-in LabVIEW VI libraries. Wires connect each of the nodes on the block diagram, including control and indicator terminals, functions, and structures.
In this block diagram, the subVI Temp calls the subroutine which retrieves a temperature from a Data Acquisition (DAQ) board. This temperature is plotted along with the running average temperature on the waveform graph Temperature History. The Power switch is a boolean control on the Front Panel which will stop execution of the While Loop. The While Loop also contains a Timing Function to control how frequently the loop iterates.

7
Express VIs, VIs and Functions� Express VIs: interactive VIs with configurable dialog page� Standard VIs: modularized VIs customized by wiring� Functions: fundamental operating elements of
LabVIEW; no front panel or block diagram
Express VI Standard VI
Function
LabVIEW 7.0 introduced a new type of subVI called Express VIs. These are interactive VIs that have a configuration dialog box that allows the user to customize the functionality of the Express VI. LabVIEW then generates a subVIbased on these settings.Standard VIs are VIs (consisting of a front panel and a block diagram) that are used within another VI.Functions are the building blocks of all VIs. Functions do not have a front panel or a block diagram.
8
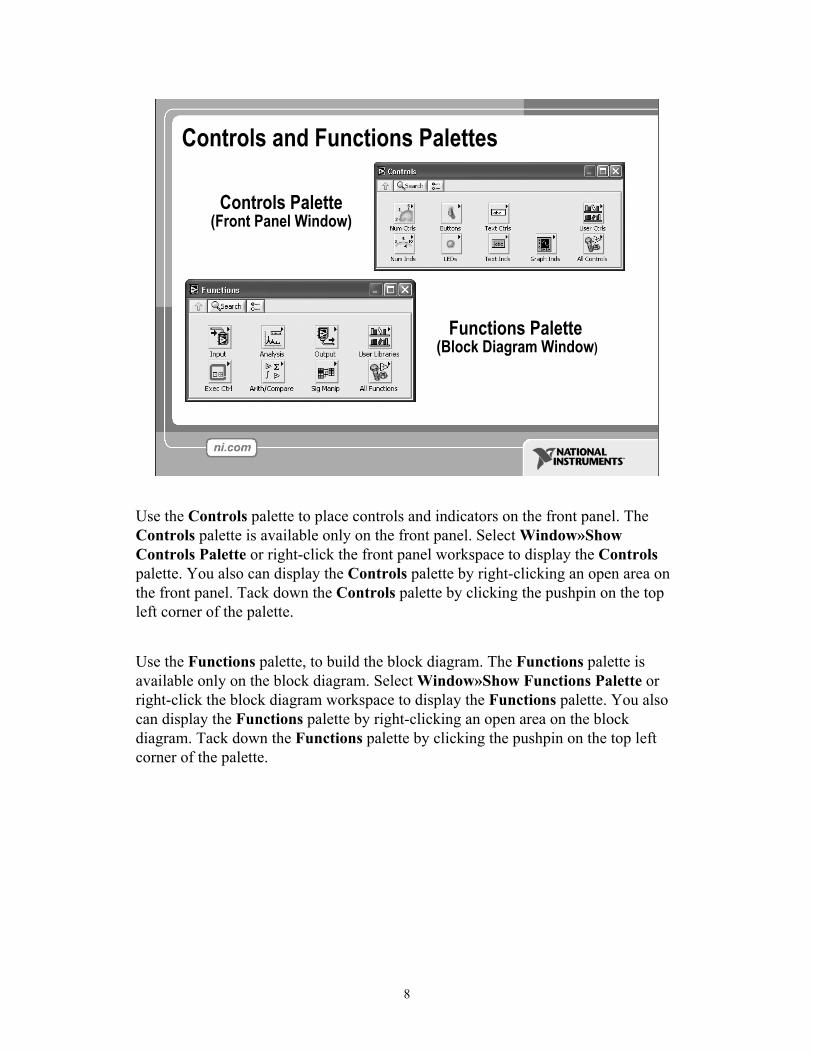
Controls and Functions Palettes
Controls Palette(Front Panel Window)
Functions Palette(Block Diagram Window)
Use the Controls palette to place controls and indicators on the front panel. TheControls palette is available only on the front panel. Select Window»Show Controls Palette or right-click the front panel workspace to display the Controls palette. You also can display the Controls palette by right-clicking an open area on the front panel. Tack down the Controls palette by clicking the pushpin on the top left corner of the palette.
Use the Functions palette, to build the block diagram. The Functions palette is available only on the block diagram. Select Window»Show Functions Palette or right-click the block diagram workspace to display the Functions palette. You also can display the Functions palette by right-clicking an open area on the block diagram. Tack down the Functions palette by clicking the pushpin on the top left corner of the palette.

9
Tools Palette
Operating ToolPositioning/Resizing ToolLabeling ToolWiring ToolShortcut Menu Tool
� Floating Palette� Used to operate and modify front
panel and block diagram objects.
Scrolling ToolBreakpoint ToolProbe ToolColor Copy ToolColoring Tool
Automatic Selection Tool
If automatic tool selection is enabled and you move the cursor over objects on the front panel or block diagram, LabVIEW automatically selects the corresponding tool from the Tools palette. Toggle automatic tool selection by clicking the Automatic Tool Selection button in the Tools palette.
� Use the Operating tool to change the values of a control or select the text within a control.
� Use the Positioning tool to select, move, or resize objects. The Positioning tool changes shape when it moves over a corner of a resizable object.
� Use the Labeling tool to edit text and create free labels. The Labeling tool changes to a cursor when you create free labels.
� Use the Wiring tool to wire objects together on the block diagram.
10
Run Button
Continuous Run Button
Abort Execution
Pause/Continue Button
Text Settings
Align Objects
Distribute Objects
Reorder
Resize front panel objects
Execution Highlighting Button
Step Into Button
Step Over Button
Step Out Button
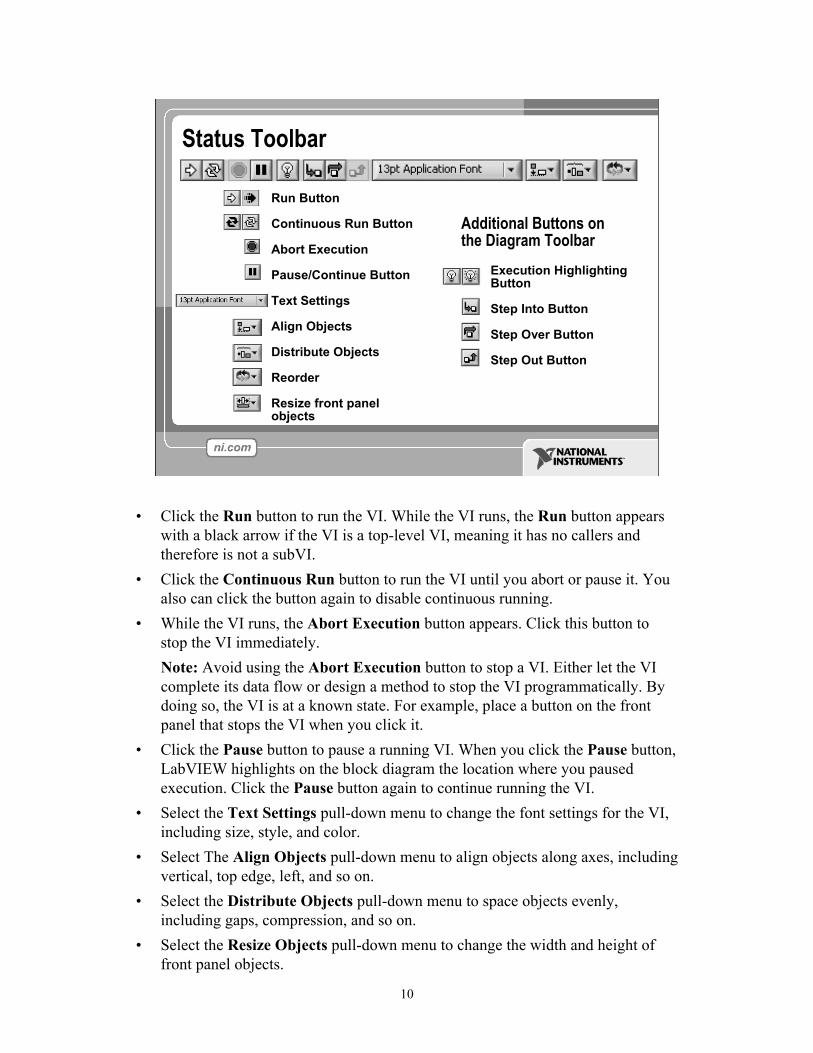
Status Toolbar
Additional Buttons on the Diagram Toolbar
� Click the Run button to run the VI. While the VI runs, the Run button appears with a black arrow if the VI is a top-level VI, meaning it has no callers and therefore is not a subVI.
� Click the Continuous Run button to run the VI until you abort or pause it. You also can click the button again to disable continuous running.
� While the VI runs, the Abort Execution button appears. Click this button to stop the VI immediately.Note: Avoid using the Abort Execution button to stop a VI. Either let the VI complete its data flow or design a method to stop the VI programmatically. By doing so, the VI is at a known state. For example, place a button on the front panel that stops the VI when you click it.
� Click the Pause button to pause a running VI. When you click the Pause button, LabVIEW highlights on the block diagram the location where you paused execution. Click the Pause button again to continue running the VI.
� Select the Text Settings pull-down menu to change the font settings for the VI, including size, style, and color.
� Select The Align Objects pull-down menu to align objects along axes, including vertical, top edge, left, and so on.
� Select the Distribute Objects pull-down menu to space objects evenly, including gaps, compression, and so on.
� Select the Resize Objects pull-down menu to change the width and height of front panel objects.

11
� Select the Reorder pull-down menu when you have objects that overlap each other and you want to define which one is in front or back of another. Select one of the objects with the Positioning tool and then select from Move Forward, Move Backward, Move To Front, and Move To Back.
<the following items only appear on the bock diagram toolbar>� Click the Highlight Execution button to see the flow of data through the block
diagram. Click the button again to disable execution highlighting.� Click the Step Into button to single-step into a loop, subVI, and so on. Single-
stepping through a VI steps through the VI node to node. Each node blinks to denote when it is ready to execute. By stepping into the node, you are ready to single-step inside the node.
� Click the Step Over button to step over a loop, subVI, and so on. By stepping over the node, you execute the node without single-stepping through the node.
� Click the Step Out button to step out of a loop, subVI, and so on. By stepping out of a node, you complete single-stepping through the node and go to the next node.
12
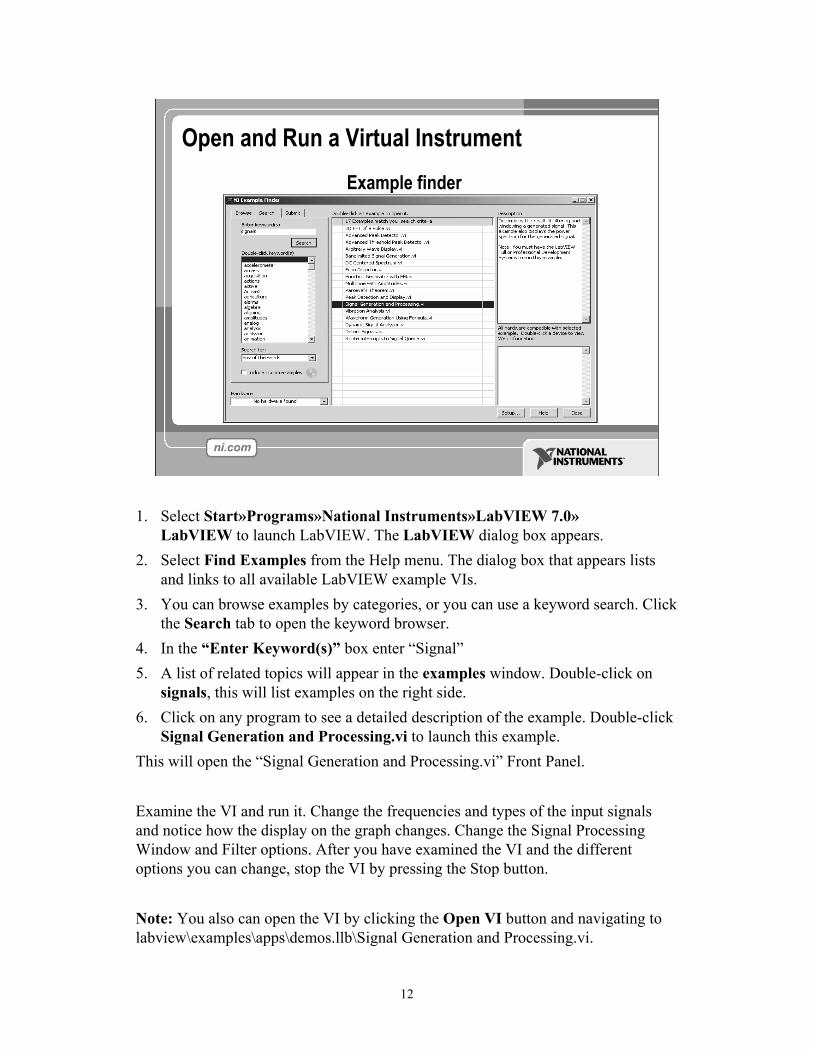
Open and Run a Virtual InstrumentExample finder
1. Select Start»Programs»National Instruments»LabVIEW 7.0» LabVIEW to launch LabVIEW. The LabVIEW dialog box appears.
2. Select Find Examples from the Help menu. The dialog box that appears lists and links to all available LabVIEW example VIs.
3. You can browse examples by categories, or you can use a keyword search. Click the Search tab to open the keyword browser.
4. In the �Enter Keyword(s)� box enter �Signal�5. A list of related topics will appear in the examples window. Double-click on
signals, this will list examples on the right side.6. Click on any program to see a detailed description of the example. Double-click
Signal Generation and Processing.vi to launch this example.This will open the �Signal Generation and Processing.vi� Front Panel.
Examine the VI and run it. Change the frequencies and types of the input signals and notice how the display on the graph changes. Change the Signal Processing Window and Filter options. After you have examined the VI and the different options you can change, stop the VI by pressing the Stop button.
Note: You also can open the VI by clicking the Open VI button and navigating to labview\examples\apps\demos.llb\Signal Generation and Processing.vi.

13
Creating a VI
ControlTerminals
Block Diagram Window
Front Panel Window
Indicator Terminals
When you create an object on the Front Panel, a terminal will be created on the Block Diagram. These terminals give you access to the Front Panel objects from the Block Diagram code.
Each terminal contains useful information about the Front Panel object it corresponds to. For example, the color and symbols provide the data type. Double-precision, floating point numbers are represented with orange terminals and the letters DBL. Boolean terminals are green with TF lettering.
In general, orange terminals should wire to orange terminals, green to green, and so on. This is not a hard-and-fast rule; LabVIEW will allow a user to connect a blue terminal (integer value) to an orange terminal (fractional value), for example. But in most cases, look for a match in colors.
Controls have an arrow on the right side and have a thick border. Indicators have an arrow on the left and a thin border. Logic rules apply to wiring in LabVIEW: Each wire must have one (but only one) source (or control), and each wire may have multiple destinations (or indicators).
The program in this slide takes data from A and B and passes the values to both an Add function and a subtract function. The results are displayed on the appropriate indicators.

14
Creating a VI � Block Diagram
In addition to Front Panel terminals, the Block diagram contains functions. Each function may have multiple input and output terminals. Wiring to these terminals is an important part of LabVIEW programming.
Once you have some experience programming in LabVIEW, wiring will become easy. At first, you may need some assistance. Here are some tips to get you started:� The wiring tool is used to wire to the nodes of the functions. When you �aim�
with the wiring tool, aim with the end of the wire hanging from the spool. This is where the wire will be placed.
� As you move the wiring tool over functions, watch for the yellow tip strip. This will tell you the name of the terminal you are wiring to.
� As you move the wiring tool over a terminal, it will flash. This will help you identify where the wire will attach.
� For more help with the terminals, right-click on the function and select Visible Items»Terminals. The function�s picture will be pulled back to reveal the connection terminals. Notice the colors- these match the data types used by the front panel terminals.
� For additional help, select Help»Show Context Help, or press <Ctrl-H>. This will bring up the context help window. As you move your mouse over the function, this window will show you the function, terminals, and a brief help description. Use this with the other tools to help you as you wire.

15
Wiring Tips � Block DiagramWiring �Hot Spot�
Clean Up WiringUse Automatic Wire Routing
Click To Select Wires
In addition to Front Panel terminals, the Block diagram contains functions. Each function may have multiple input and output terminals. Wiring to these terminals is an important part of LabVIEW programming.
Once you have some experience programming in LabVIEW, wiring will become easy. At first, you may need some assistance. Here are some tips to get you started:� The wiring tool is used to wire to the nodes of the functions. When you �aim� with the
wiring tool, aim with the end of the wire hanging from the spool. This is where the wire will be placed.
� As you move the wiring tool over functions, watch for the yellow tip strip. This will tell you the name of the terminal you are wiring to.
� As you move the wiring tool over a terminal, it will flash. This will help you identify where the wire will attach.
� For more help with the terminals, right-click on the function and select Visible Items»Terminals. The function�s picture will be pulled back to reveal the connection terminals. Notice the colors�these match the data types used by the front panel terminals.
� For additional help, select Help»Show Context Help, or press <Ctrl-H>. This will bring up the context help window. As you move your mouse over the function, this window will show you the function, terminals, and a brief help description. Use this with the other tools to help you as you wire.
� If your wiring becomes doesn�t look very good, right-click on the particular wire in question and choose Clean Up Wire to automatically re-route that wire.

16
Wiring is very flexible in LabVIEW. Experiment with keystroke and clicking combinations when wiring. Here are some of the most often used features:� Single, double, and triple clicking a wire selects the wire for movement or
deletion� Clicking while wiring tacks down a bend in the wire� Right-clicking or pressing Escape while wiring cancels the wiring operation
Don�t worry about wire colors�LabVIEW will automatically select the right wire for each situation.
Automatically Wiring ObjectsLabVIEW automatically wires objects as you place them on the block diagram. You also can automatically wire objects already on the block diagram. LabVIEW connects the terminals that best match and leaves terminals that do not match unconnected. As you move a selected object close to other objects on the block diagram, LabVIEW draws temporary wires to show you valid connections. When you release the mouse button to place the object on the block diagram, LabVIEW automatically connects the wires. Toggle automatic wiring by pressing the spacebar while you move an object using the Positioning tool. You can adjust the automatic wiring settings by selecting Tools»Options and selecting Block Diagram from the top pull-down menu.

17
� Block diagram executes dependent on the flow of data; block diagram does NOT execute left to right
� Node executes when data is available to ALL input terminals
� Nodes supply data to all output terminals when done
Dataflow Programming
LabVIEW follows a dataflow model for running VIs. A block diagram node executes when all its inputs are available. When a node completes execution, it supplies data to its output terminals and passes the output data to the next node in the dataflow path. Visual Basic, C++, JAVA, and most other text-based programming languages follow a control flow model of program execution. In control flow, the sequential order of program elements determines the execution order of a program.
Consider the block diagram above. It adds two numbers and then subtracts 50.0 from the result of the addition. In this case, the block diagram executes from left to right, not because the objects are placed in that order, but because one of the inputs of the Subtract function is not valid until the Add function has finished executing and passed the data to the Subtract function. Remember that a node executes only when data are available at all of its input terminals, and it supplies data to its output terminals only when it finishes execution.
In the code to the right, consider which code segment would execute first�the Add, Random Number, or Divide function. You cannot know because inputs to the Add and Divide functions are available at the same time, and the Random Number function has no inputs. In a situation where one code segment must execute before another, and no data dependency exists between the functions, use a Sequence structure to force the order of execution.

18
Help Options
Context Help� Online help� Lock help� Simple/Complex Diagram help� Ctrl + H
Online reference� All menus online� Pop up on functions in diagram to access online info directly
Use the Context Help window and the LabVIEW Help to help you build and edit VIs. Refer to the LabVIEW Help and manuals for more information.
Context Help WindowTo display the Context Help window, select Help»Show Context Help or press the <Ctrl-H> keys. When you move the cursor over front panel and block diagram objects, the Context Help window displays the icon for subVIs, functions, constants, controls, and indicators, with wires attached to each terminal. When you move the cursor over dialog box options, the Context Help window displays descriptions of those options. In the window, required connections are bold, recommended connections are plain text, and optional connections are dimmed or do not appear. Above is an example Context Help window.
Click the Simple/Detailed Context Help button located on the lower left corner of the Context Help window to change between simple and detailed context help. The simple mode emphasizes the important connections. Optional terminals are shown by wire stubs, informing you that other connections exist.Click the Lock Context Help button to lock the current contents of the Context Help window. When the contents are locked, moving the cursor over another object does not change the contents of the window. To unlock the window, click the button again. You also can access this option from the Help menu.

19
Click the More Help button to display the corresponding topic in the LabVIEW Help, which describes the object in detail.
LabVIEW HelpYou can access the LabVIEW Help either by clicking the More Help button in the Context Help window, selecting Help»VI, Function, & How-To Help, clicking the sentence Click here for more help in the Context Help window, or pressing the <Ctrl-?> keys.The LabVIEW Help contains detailed descriptions of most palettes, menus, tools, VIs, and functions. It also includes step-by-step instructions for using LabVIEW features and links to the LabVIEW Tutorial, PDF versions of all the LabVIEW manuals and Application Notes, and technical support resources on the National Instruments Web site.

20
Exercise 1 � Convert °C to °F
Estimate completion time: 20 minutes. The exercise is easy, but since it will be the first VI that we actually create, it is good to allow ample time to explore the LabVIEW environment.
Instructions: Build a VI that converts °C to °F. When run, the VI should take an input value (°C), multiply it by 1.8, add 32, and display the result (°F). The front panel should display both the input value and the result. Save the VI as Convert C to F.vi.

21
Debugging Techniques� Finding Errors
� Execution Highlighting
� Probe
Click on broken Run buttonWindow showing error appears
Click on Execution Highlighting button; data flow is animated using bubbles. Values are displayed on wires.
Right-click on wire to display probe and it shows data as it flows through wire segment
You can also select Probe tool from Tools palette and click on wire
When your VI is not executable, a broken arrow is displayed in the Run button in the palette.
� Finding Errors: To list errors, click on the broken arrow. To locate the bad object, click on the error message.
� Execution Highlighting: Animates the diagram and traces the flow of the data, allowing you to view intermediate values.Click on the light bulb on the toolbar.
� Probe: Used to view values in arrays and clusters.Click on wires with the Probe tool or right-click on the wire to set probes.
� Breakpoint: Set pauses at different locations on the diagram.Click on wires or objects with the Breakpoint tool to set breakpoints.
Use Debug Demonstrate VI from BASICS.LLB to demonstrate the options and tools.
22
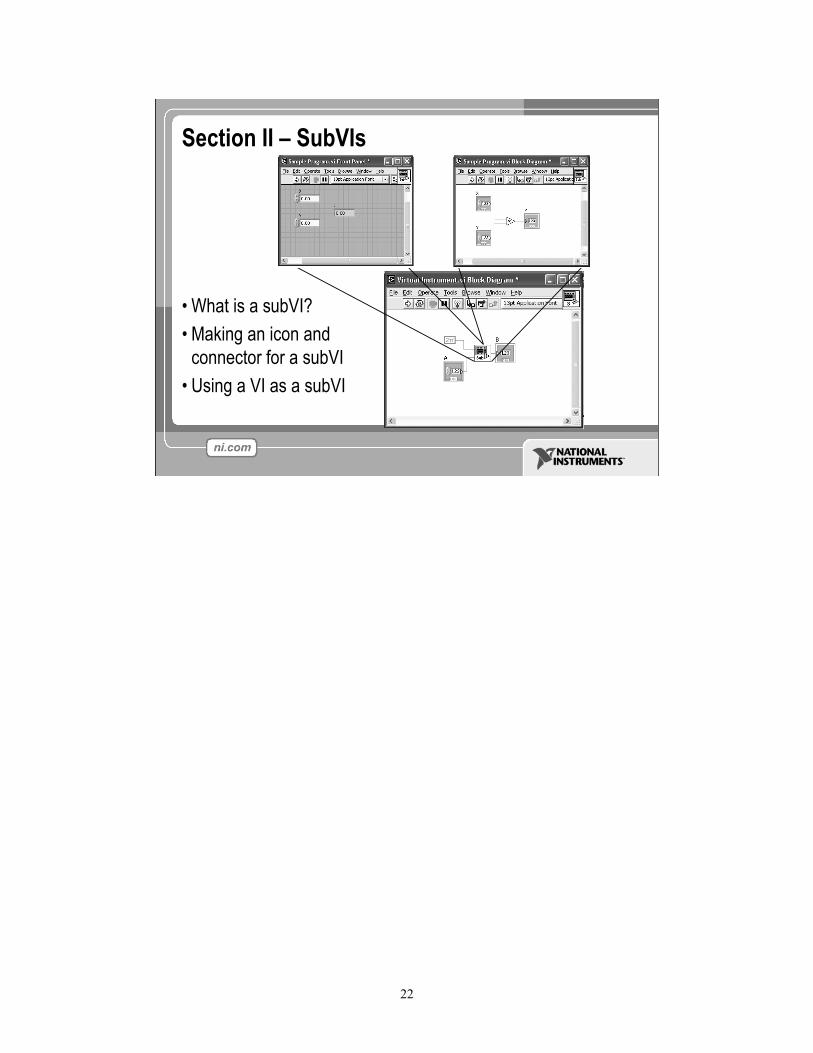
Section II � SubVIs
� What is a subVI?� Making an icon and
connector for a subVI� Using a VI as a subVI
23
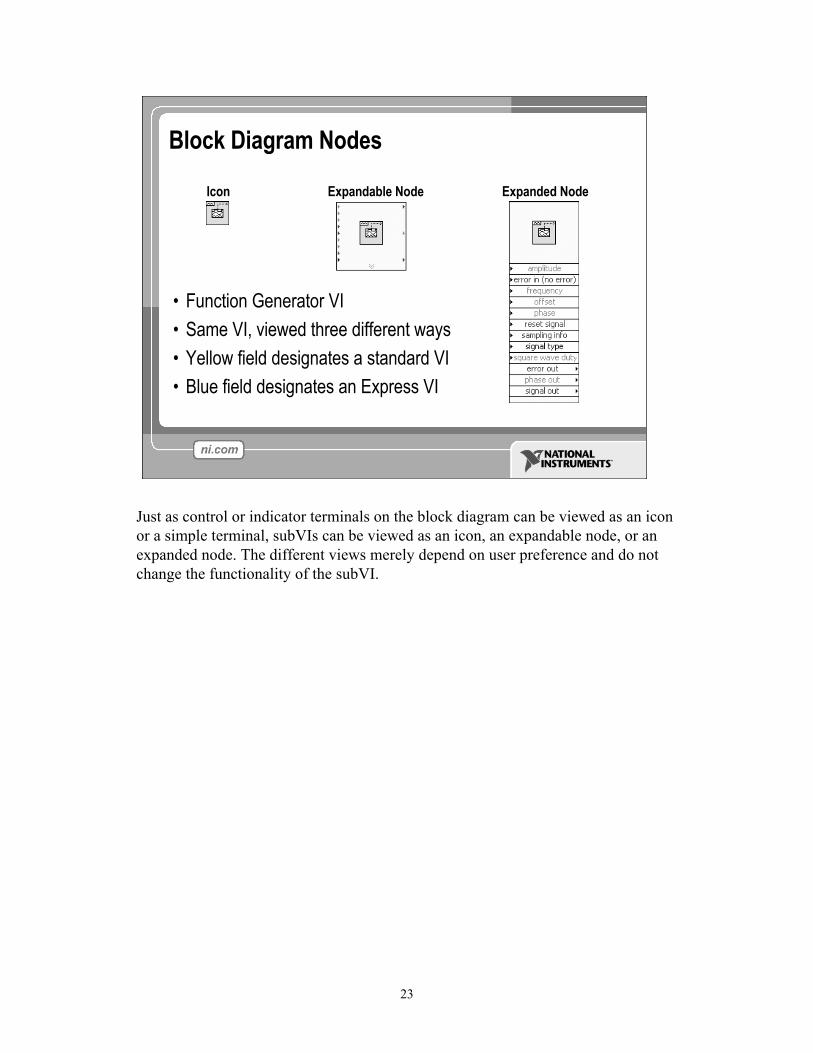
Block Diagram Nodes
Icon Expandable Node Expanded Node
� Function Generator VI� Same VI, viewed three different ways� Yellow field designates a standard VI� Blue field designates an Express VI
Just as control or indicator terminals on the block diagram can be viewed as an icon or a simple terminal, subVIs can be viewed as an icon, an expandable node, or an expanded node. The different views merely depend on user preference and do not change the functionality of the subVI.

24
SubVIs� A SubVI is a VI that can be used within another VI� Similar to a subroutine� Advantages
� Modular� Easier to debug� Don�t have to recreate code� Require less memory
After you build a VI and create its icon and connector pane, you can use it in another VI. A VI within another VI is called a subVI. A subVI corresponds to a subroutine in text-based programming languages. Using subVIs helps you manage changes and debug the block diagram quickly.

25
Icon and Connector
Icon
Connector
Terminals
� An icon represents a VI in other block diagrams
� A connector shows available terminals for data transfer
Every VI displays an icon, shown above, in the upper right corner of the front panel and block diagram windows. An icon is a graphical representation of a VI. It can contain text, images, or a combination of both. If you use a VI as a subVI, the icon identifies the subVI on the block diagram of the VI.
The connector shows terminals available for transfer or data to and from the subVI. There are several connector patterns to choose from. Right click on the connector and select the pattern from the Patterns menu. From there you can assign controls and indicators on the front panel to the connector terminal, as we will see later.

26
SubVIs Sub VIs
The above block diagram contains two subVIs. To see the front panel of a subVI, simply double click the subVI. You can also view the hierarchy of subVIs within a top level VI by clicking on Browse»Show VI Hierarchy.
27
Steps to Create a SubVI
� Create the Icon� Create the Connector� Assign Terminals� Save the VI� Insert the VI into a Top Level VI
28
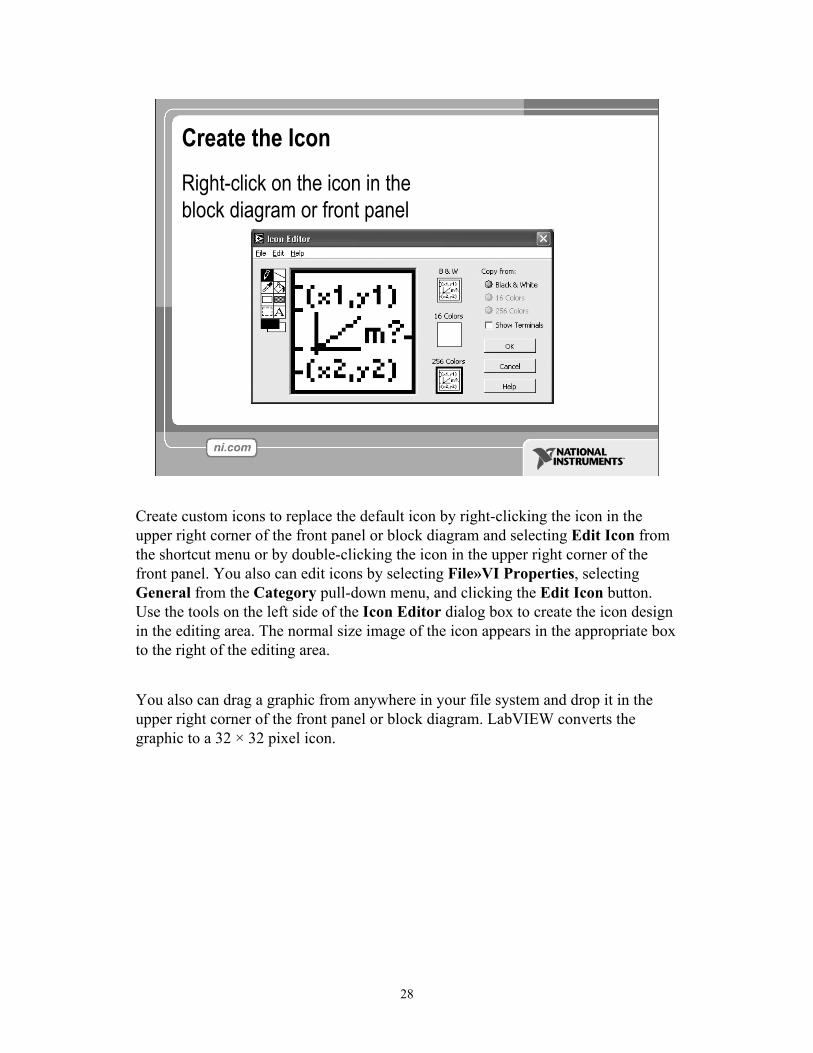
Create the IconRight-click on the icon in the block diagram or front panel
Create custom icons to replace the default icon by right-clicking the icon in the upper right corner of the front panel or block diagram and selecting Edit Icon from the shortcut menu or by double-clicking the icon in the upper right corner of the front panel. You also can edit icons by selecting File»VI Properties, selecting General from the Category pull-down menu, and clicking the Edit Icon button. Use the tools on the left side of the Icon Editor dialog box to create the icon design in the editing area. The normal size image of the icon appears in the appropriate box to the right of the editing area.
You also can drag a graphic from anywhere in your file system and drop it in the upper right corner of the front panel or block diagram. LabVIEW converts the graphic to a 32 × 32 pixel icon.
29
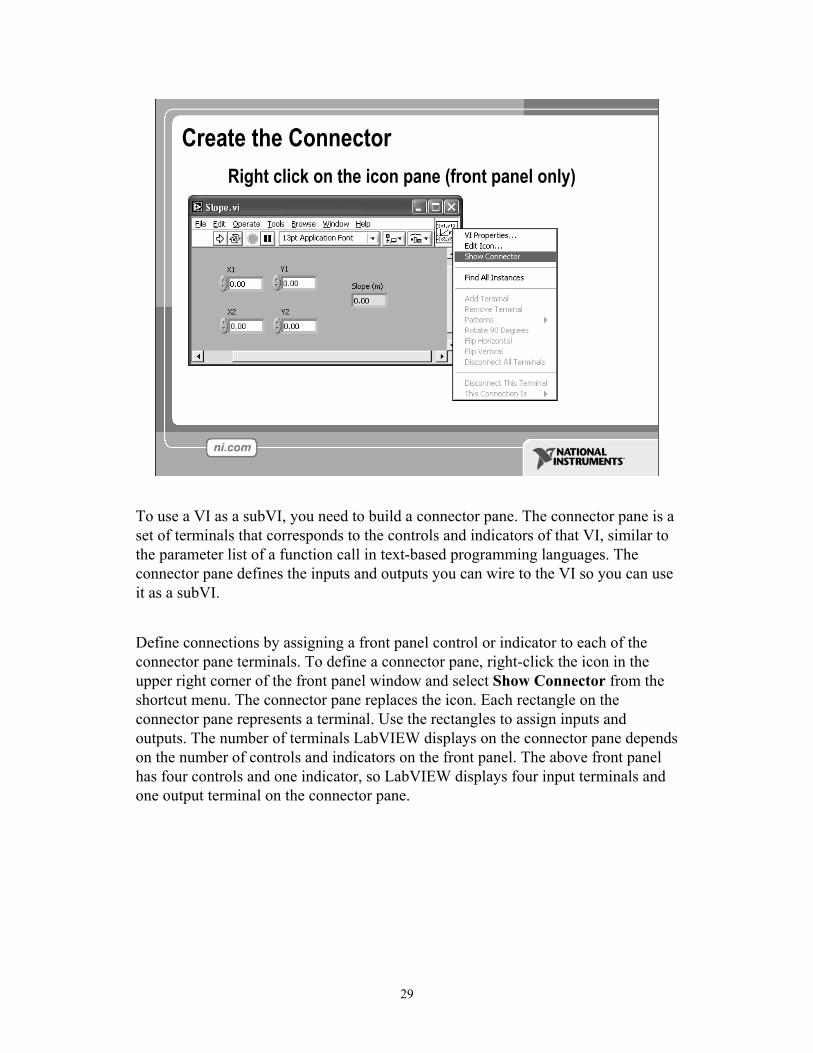
Create the ConnectorRight click on the icon pane (front panel only)
To use a VI as a subVI, you need to build a connector pane. The connector pane is a set of terminals that corresponds to the controls and indicators of that VI, similar to the parameter list of a function call in text-based programming languages. The connector pane defines the inputs and outputs you can wire to the VI so you can use it as a subVI.
Define connections by assigning a front panel control or indicator to each of the connector pane terminals. To define a connector pane, right-click the icon in the upper right corner of the front panel window and select Show Connector from the shortcut menu. The connector pane replaces the icon. Each rectangle on the connector pane represents a terminal. Use the rectangles to assign inputs and outputs. The number of terminals LabVIEW displays on the connector pane depends on the number of controls and indicators on the front panel. The above front panel has four controls and one indicator, so LabVIEW displays four input terminals and one output terminal on the connector pane.
30
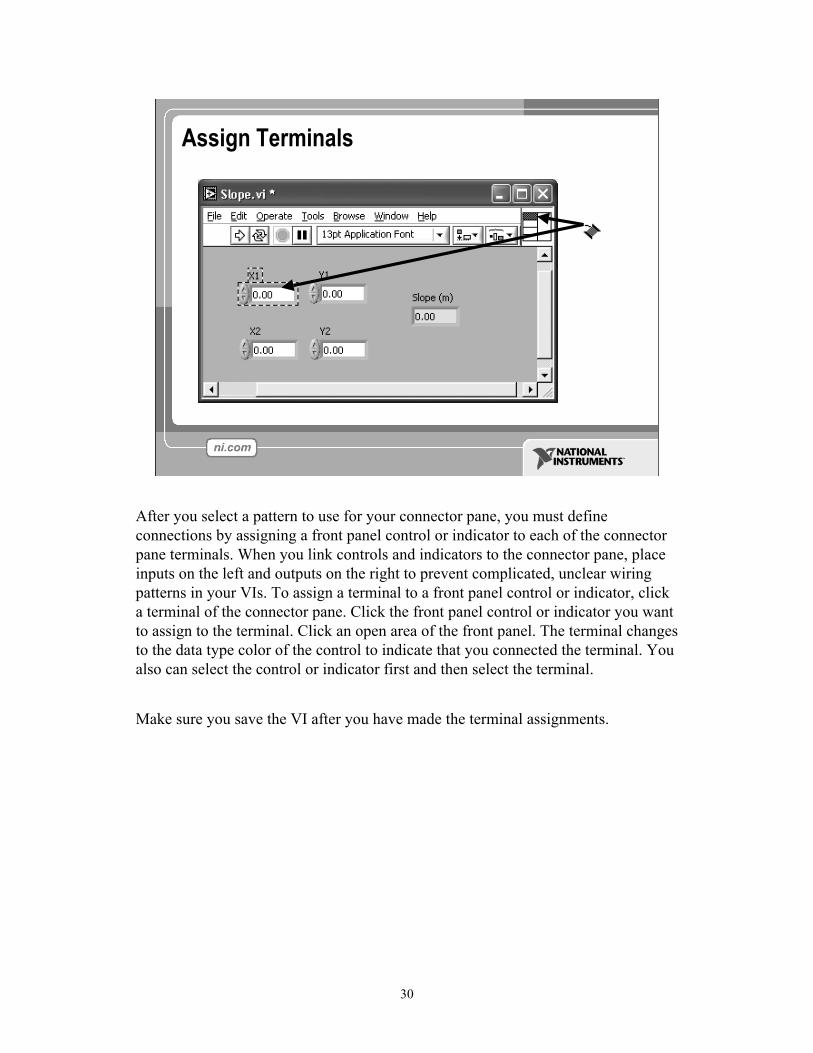
Assign Terminals
After you select a pattern to use for your connector pane, you must define connections by assigning a front panel control or indicator to each of the connector pane terminals. When you link controls and indicators to the connector pane, place inputs on the left and outputs on the right to prevent complicated, unclear wiring patterns in your VIs. To assign a terminal to a front panel control or indicator, click a terminal of the connector pane. Click the front panel control or indicator you want to assign to the terminal. Click an open area of the front panel. The terminal changes to the data type color of the control to indicate that you connected the terminal. You also can select the control or indicator first and then select the terminal.
Make sure you save the VI after you have made the terminal assignments.

31
Save The VI
� Choose an Easy to Remember Location� Organize by Functionality
� Save Similar VIs into one directory (e.g. Math Utilities)� Organize by Application
� Save all VIs Used for a Specific Application into one directory or library file (e.g. Lab 1 � Frequency Response)� Library Files (.llbs) combine many VIs into a single file, ideal for
transferring entire applications across computers
There are several ways to organize your subVIs. The most common way is to organize by application. In this case, all the VI�s for a particular application are saved into the same directory or into a VI Library file. Saving into a library file allows you to transport an entire application within a single file.
Saving into library is simple. After clicking Save As�, click New VI Library. This will allow you to name the library, and then save your VI into it. To add subsequent VI�s, simply double click the .llb file from the standard Save window, and give the VI a name.

32
Insert the SubVI into a Top Level VI
Accessing user-made subVIsFunctions»All Functions»Select a VI
Or Drag icon onto target diagram
After you build a VI and create its icon and connector pane, you can use it as a subVI. To place a subVI on the block diagram, select Functions»Select a VI. Navigate to and double-click the VI you want to use as a subVI and place it on the block diagram.
You also can place an open VI on the block diagram of another open VI by using the Positioning tool to click the icon in the upper right corner of the front panel or block diagram of the VI you want to use as a subVI and drag the icon to the block diagram of the other VI.
33
Tips for Working in LabVIEW
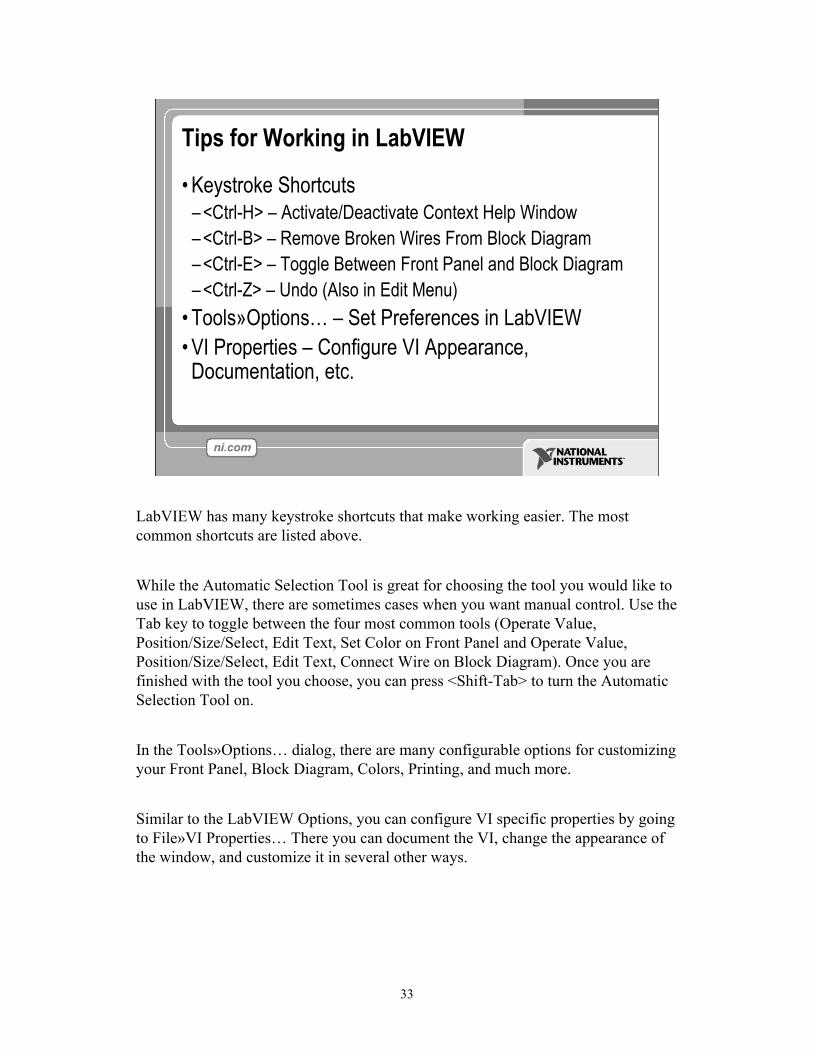
� Keystroke Shortcuts�<Ctrl-H> � Activate/Deactivate Context Help Window�<Ctrl-B> � Remove Broken Wires From Block Diagram�<Ctrl-E> � Toggle Between Front Panel and Block Diagram�<Ctrl-Z> � Undo (Also in Edit Menu)
� Tools»Options� � Set Preferences in LabVIEW� VI Properties � Configure VI Appearance, Documentation, etc.
LabVIEW has many keystroke shortcuts that make working easier. The most common shortcuts are listed above.
While the Automatic Selection Tool is great for choosing the tool you would like to use in LabVIEW, there are sometimes cases when you want manual control. Use the Tab key to toggle between the four most common tools (Operate Value, Position/Size/Select, Edit Text, Set Color on Front Panel and Operate Value, Position/Size/Select, Edit Text, Connect Wire on Block Diagram). Once you are finished with the tool you choose, you can press <Shift-Tab> to turn the Automatic Selection Tool on.
In the Tools»Options� dialog, there are many configurable options for customizing your Front Panel, Block Diagram, Colors, Printing, and much more.
Similar to the LabVIEW Options, you can configure VI specific properties by going to File»VI Properties� There you can document the VI, change the appearance of the window, and customize it in several other ways.
34
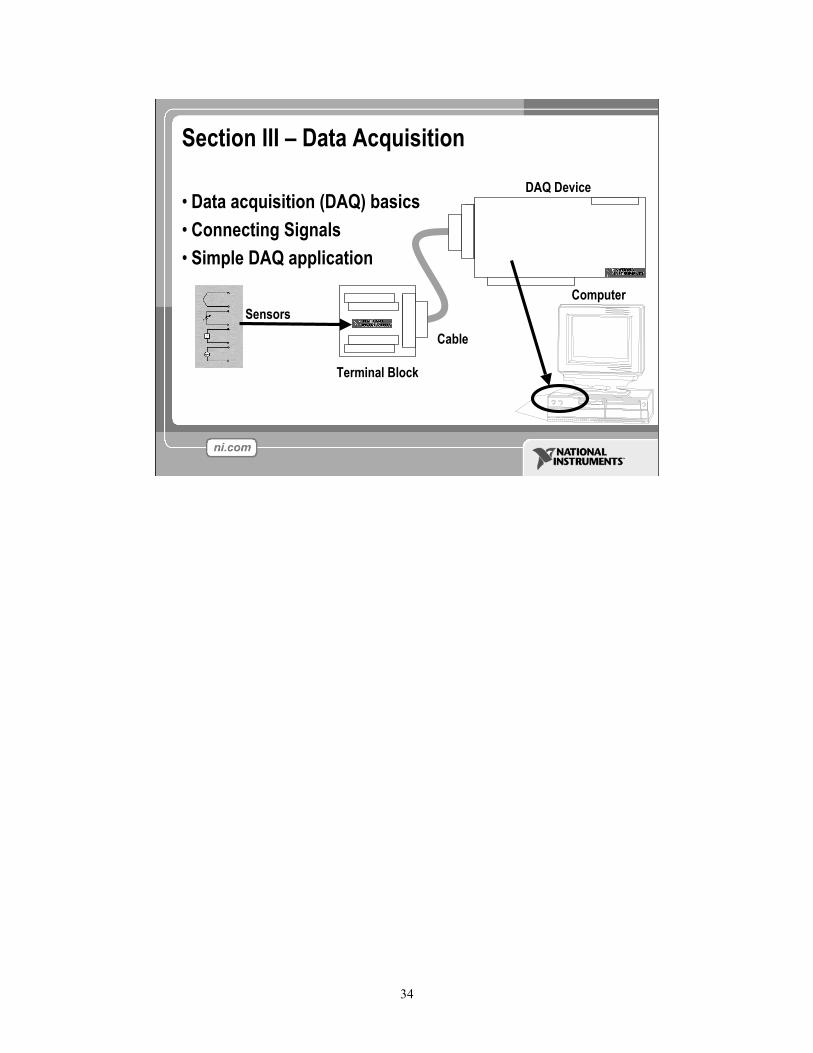
Section III � Data Acquisition
� Data acquisition (DAQ) basics� Connecting Signals� Simple DAQ application
Computer
DAQ Device
Terminal Block
Cable
Sensors

35
Data Acquisition in LabVIEW
Traditional NI-DAQSpecific VIs for performing:� Analog Input� Analog Output� Digital I/O� Counter operations
NI-DAQmxNext generation driver: � VIs for performing a
task� One set of VIs for all
measurement types
The Data Acquisition palette in LabVIEW contains a palette for traditional NI-DAQ and one for NI-DAQmx.Traditional VIs are divided by the type of measurement; DAQmx VIs are divided by the type of task.
You must complete several steps before you can use the Data Acquisition VIs. The devices should be configured for the computers in this class.
1. NI-DAQ software must be installed on the computer2. You must have installed an E-series DAQ board and configured it using
Measurement & Automation Explorer (MAX).
For more information on installing and configuring National Instruments hardware, consult the DAQ Quick Start Guide:http://digital.ni.com/manuals.nsf/websearch/E502277FE33ED60686256B3B0056AEDF?OpenDocument&node=132100_US

36
DAQ � Data AcquisitionTemperature Acquisition using the DAQ Assistant
Above is the DAQ Assistant window that can be quickly configured to read temperature from a Data Acquisition (DAQ) board.

37
Data Acquisition Terminology
� Resolution � Determines How Many Different Voltage Changes Can Be Measured� Larger Resolution ! More Precise Representation of Signal
� Range � Minimum and Maximum Voltages� Smaller range ! More Precise Representation of Signal
� Gain � Amplifies or Attenuates Signal for Best Fit in Range
Resolution: When acquiring data to a computer, an Analog-to-Digital Converter (ADC) takes an analog signal and turns it into a binary number. Therefore, each binary number from the ADC represents a certain voltage level. The ADC returns the highest possible level without going over the actual voltage level of the analog signal. Resolution refers to the number of binary levels the ADC can use to represent a signal. To figure out the number of binary levels available based on the resolution you simply take 2Resolution. Therefore, the higher the resolution, the more levels you will have to represent your signal. For instance, an ADC with 3-bit resolution can measure 23 or 8 voltage levels, while an ADC with 12-bit resolution can measure 212 or 4096 voltage levels.
Range: Unlike the resolution of the ADC, the range of the ADC is selectable. Most DAQ devices offer a range from 0 - +10 or -10 to +10. The range is chosen when you configure your device in NI-DAQ. Keep in mind that the resolution of the ADC will be spread over whatever range you choose. The larger the range, the more spread out your resolution will be, and you will get a worse representation of your signal. Thus it is important to pick your range to properly fit your input signal.

38
Gain: Properly choosing the range of your ADC is one way to make sure you are maximizing the resolution of your ADC. Another way to help your signal maximize the resolution of the ADC is by applying a gain. Gain refers to any amplification or attenuation of a signal. The gain setting is a scaling factor. Each voltage level on your incoming signal is multiplied by the gain setting to achieve the amplified or attenuated signal. Unlike resolution that is a fixed setting of the ADC, and range that is chosen when the DAQ device is configured, the gain is specified indirectly through a setting called input limits. Input limits refers to the minimum and maximum values of your actual analog input signal. Based on the input limits you set, the largest possible gain is applied to your signal that will keep the signal within the chosen range of the ADC. So instead of needing to calculate the best gain based on your signal and the chosen range, all you need to know is the minimum and maximum values of your signal.

39
Hardware Connections
BNC-2120
SCB-68NI-ELVIS
SC-2075
There are many different hardware setups possible when acquiring data. All Data Acquisition systems require some sort of connection terminal that accepts a signal from your transducer and transmits it to the DAQ card. Four such terminal blocks are the BNC-2120, SC-2075, SCB-68, and NI-ELVIS.
The BNC-2120 is a shielded connector block with signal-labeled BNC connectors for easy connectivity to your DAQ device. It also provides a function generator, quadrature encoder, temperature reference, thermocouple connector, and LED so that you can test the functionality of your hardware.
The SC-2075 provides breadboard area for prototyping and BNC and springterminal connectivity. The built-in ±15 V or adjustable 0 to 5 V power supply and LED�s make the SC-2075 ideal for academic laboratories.
The SCB-68 is a shielded I/O connector block for rugged, very low-noise signal termination. It includes general-purpose breadboard areas (two) as well as an IC temperature sensor for cold-junction compensation in temperature measurements.
NI-ELVIS (Educational Laboratory Virtual Instrumentation Suite) is a LabVIEW-based design and prototyping environment and consists of LabVIEW-based virtual instruments, a multifunction data acquisition device, and a custom-designed bench-top workstation and prototyping board.

40
Exercise 2 � Simple Data Acquisition
Complete Convert C to F.vi, then create Thermometer.vi.
Note: To complete this exercise, you will need the IC temperature sensor available on either the BNC-2120, SCB-68 or DAQ Signal Accessory. Estimated completion time: 30 minutes.
Instructions: This exercise has three parts.First, create an icon and connector for Convert C to F.vi (Exercise 1). The icon should remind you of the functionality of the VI (e.g. C!F or CtoF). The connector should have one input and one output, allowing a terminal for °C in, and °F out.Second, create a top level VI that acquires a data point from channel 0 (the temperature sensor) of your DAQ board and allows the user to display the temperature in Celsius or Fahrenheit. To do this you will need to acquire a single data point from your DAQ board and scale it by a factor of 100. This will give you °C. You should have a Boolean switch or button that allows the user to select Celsius or Fahrenheit. If the user selects Celsius, the scaled value should be displayed in a thermometer indicator. If the user selects Fahrenheit, the Celsius value should be passed into Convert C to F.vi (used as a subVI), and the output Fahrenheit value should be displayed.Hint: Use the Select function in the Comparison palette.

41
Finally, create an Icon and Connector for Thermometer.vi. One possible Icon would be a picture of a thermometer. The connector should have two terminals. One for the Boolean input (°C or °F), and the second for the scaled temperature output. Save the VI as Thermometer.vi.
42
Section IV � Loops and Charts
� For Loop� While Loop� Charts� Multiplots

43
Loops
� While Loops� Have Iteration Terminal� Always Run at least Once� Run According to Conditional
Terminal
� For Loops� Have Iteration Terminal� Run According to input N of
Count Terminal
Both the While and For Loops are located on the Functions»Structures palette. The For Loop differs from the While Loop in that the For Loop executes a set number of times. A While Loop stops executing the subdiagram only if the value at the conditional terminal exists.
While LoopsSimilar to a Do Loop or a Repeat-Until Loop in text-based programming languages, a While Loop, shown at the top right, executes a subdiagram until a condition is met. The While Loop executes the sub diagram until the conditional terminal, an input terminal, receives a specific Boolean value. The default behavior and appearance of the conditional terminal is Continue If True, shown at left. When a conditional terminal is Continue If True, the While Loop executes its subdiagram until the conditional terminal receives a FALSE value. The iteration terminal (an output terminal), shown at left, contains the number of completed iterations. The iteration count always starts at zero. During the first iteration, the iteration terminal returns 0.
For LoopsA For Loop, shown at left, executes a subdiagram a set number of times. The value in the count terminal (an input terminal) represented by the N, indicates how many times to repeat the subdiagram. The iteration terminal (an output terminal), shown at left, contains the number of completed iterations. The iteration count always starts at zero. During the first iteration, the iteration terminal returns 0.
44
Loops (cont.)1. Select the loop 2. Enclose code to be repeated
3. Drop or drag additional nodes and then wire
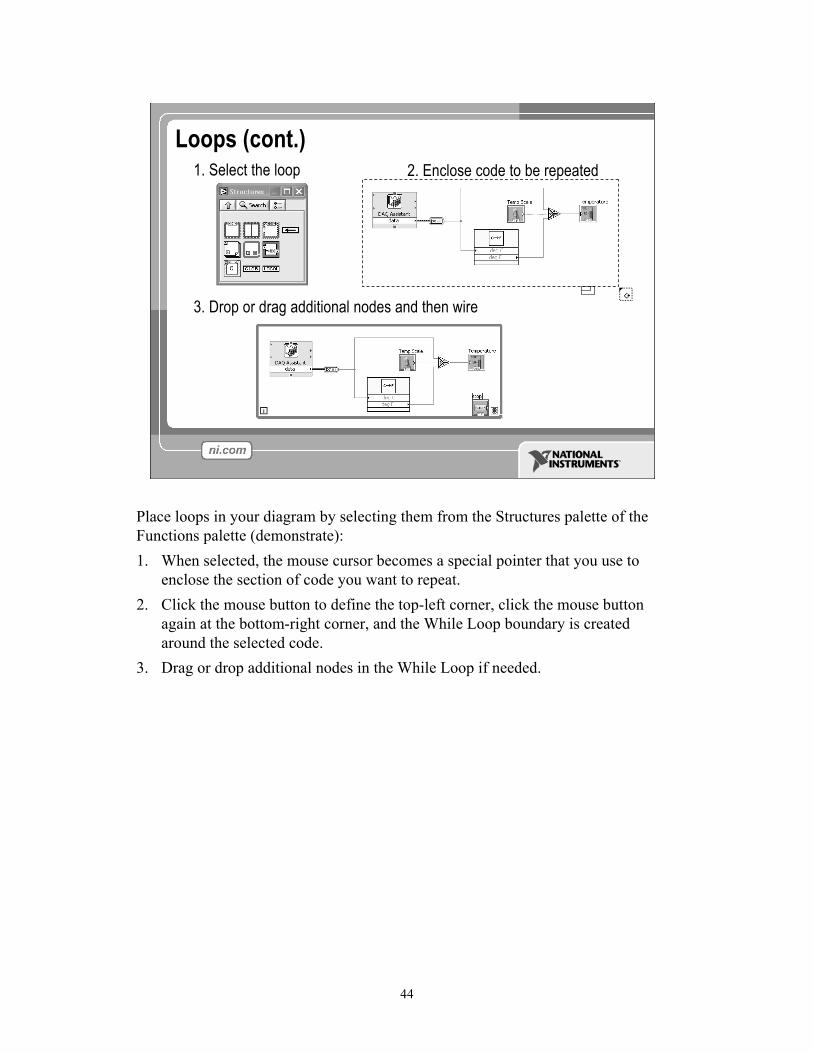
Place loops in your diagram by selecting them from the Structures palette of the Functions palette (demonstrate):1. When selected, the mouse cursor becomes a special pointer that you use to
enclose the section of code you want to repeat.2. Click the mouse button to define the top-left corner, click the mouse button
again at the bottom-right corner, and the While Loop boundary is created around the selected code.
3. Drag or drop additional nodes in the While Loop if needed.

45
Charts
Waveform chart � special numeric indicator that can display a history of valuesControls»Graph Indicators»Waveform Chart
The waveform chart is a special numeric indicator that displays one or more plots. The waveform chart is located on the Controls»Graph Indicators palette. Waveform charts can display single or multiple plots. The following front panel shows an example of a multi-plot waveform chart.
You can change the min and max values of either the x or y axis by double clicking on the value with the labeling tool and typing the new value. Similarly, you can change the label of the axis. You can also right click the plot legend and change the style, shape, and color of the trace that is displayed on the chart.

46
Wiring Data into Charts
Single Plot Charts Multiplot Charts
You can wire a scalar output directly to a waveform chart to display one plot. To display multiple plots on one chart, use the Merge Signals function found in the Functions»Signal Manipulation palette. The Merge Signal function bundles multiple outputs to plot on the waveform chart. To add more plots, use the Positioning tool to resize the Merge Signal function.
The context help contains very good information on how the different ways to wire data into charts.

47
Exercise 3 � Using loops
Students build Use a loop.vi.
This exercise should take 15-20 minutes.
Instructions:Create a VI that generates a random number at a specified rate and displays the readings on a Waveform Chart until stopped by the user. Connect the termination terminal to a front panel stop button, and add a slider control to the front panel. The slider control should range from 0 to 2000 in value, and be connected to the Time Delay Express VI function inside your while loop. Save the VI as Use a loop.vi.
48
Section V � Arrays & File I/O
� Build arrays manually� Have LabVIEW build arrays automatically� Write to a spreadsheet file� Read from a spreadsheet file
Arrays group data elements of the same type. An array consists of elements and dimensions. Elements are the data that make up the array. A dimension is the length, height, or depth of an array. An array can have one or more dimensions and as many as 2^31 � 1 elements per dimension, memory permitting.
You can build arrays of numeric, Boolean, path, string, waveform, and cluster data types. Consider using arrays when you work with a collection of similar data and when you perform repetitive computations. Arrays are ideal for storing data you collect from waveforms or data generated in loops, where each iteration of a loop produces one element of the array.
Array elements are ordered. An array uses an index so you can readily access any particular element. The index is zero-based, which means it is in the range 0 to n �1, where n is the number of elements in the array. For example, n = 9 for the nine planets, so the index ranges from 0 to 8. Earth is the third planet, so it has an index of 2.
File I/O operations pass data to and from files. Use the File I/O VIs and functions located on the Functions»File I/O palette to handle all aspects of file I/O. In this class we will cover reading and writing spreadsheet files using the Express VIs for File I/O.

49
Adding an Array to the Front Panel
Drop it on the screen.
From the Controls»All Controls»Array & Clustersubpalette, select the Array Shell
To create an array control or indicator as shown, select an array on the Controls»All Controls»Array & Cluster palette, place it on the front panel, and drag a control or indicator into the array shell. If you attempt to drag an invalid control or indicator such as an XY graph into the array shell, you are unable to drop the control or indicator in the array shell.
You must insert an object in the array shell before you use the array on the block diagram. Otherwise, the array terminal appears black with an empty bracket.

50
Adding an Array (cont.)
Place data object into shell (i.e. Numeric Control)
To add dimensions to an array one at a time, right-click the index display and select Add Dimension from the shortcut menu. You also can use the Positioning tool toresize the index display until you have as many dimensions as you want.
51
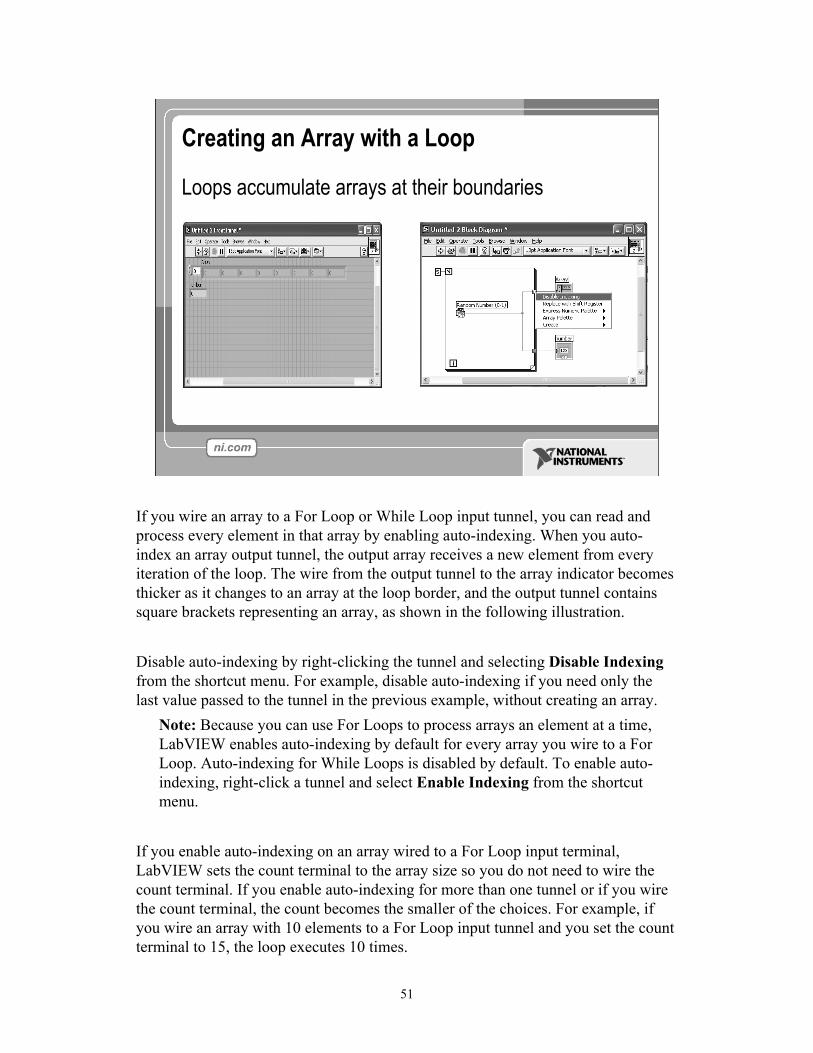
Creating an Array with a Loop
Loops accumulate arrays at their boundaries
If you wire an array to a For Loop or While Loop input tunnel, you can read and process every element in that array by enabling auto-indexing. When you auto-index an array output tunnel, the output array receives a new element from every iteration of the loop. The wire from the output tunnel to the array indicator becomes thicker as it changes to an array at the loop border, and the output tunnel contains square brackets representing an array, as shown in the following illustration.
Disable auto-indexing by right-clicking the tunnel and selecting Disable Indexing from the shortcut menu. For example, disable auto-indexing if you need only the last value passed to the tunnel in the previous example, without creating an array.
Note: Because you can use For Loops to process arrays an element at a time, LabVIEW enables auto-indexing by default for every array you wire to a For Loop. Auto-indexing for While Loops is disabled by default. To enable auto-indexing, right-click a tunnel and select Enable Indexing from the shortcut menu.
If you enable auto-indexing on an array wired to a For Loop input terminal, LabVIEW sets the count terminal to the array size so you do not need to wire the count terminal. If you enable auto-indexing for more than one tunnel or if you wire the count terminal, the count becomes the smaller of the choices. For example, if you wire an array with 10 elements to a For Loop input tunnel and you set the count terminal to 15, the loop executes 10 times.

52
Creating 2D Arrays
You can use two For Loops, one inside the other, to create a 2D array. The outer For Loop creates the row elements, and the inner For Loop creates the column elements.

53
File I/O
File I/O � passing data to and from files� Files can be binary, text, or spreadsheet� Write/Read LabVIEW Measurements file (*.lvm)
Writing to LVM file Reading from LVM file
File I/O operations pass data to and from files. In LabVIEW, you can use File I/O functions to:� Open and close data files� Read data from and write data to files� Read from and writ to spreadsheet-formatted files� Move and rename files and directories� Change file characteristics� Create, modify, and read a configuration file� Write to or read from LabVIEW Measurements files.
In this course we will examine how to write to or read from LabVIEW Measurements files (*.lvm files).

54
Write LabVIEW Measurement File� Includes the open, write, close and error handling functions � Handles formatting the string with either a tab or comma
delimiter � Merge Signals function is used to combine data into the
dynamic data type
The Write LVM file can write to spreadsheet files. However, its main purpose is for logging data, that will be used in LabVIEW. This VI creates a .lvm file which can be opened in a spreadsheet application. For simple spreadsheet files, use the Express VIs: Write LVM and Read LVM.
55
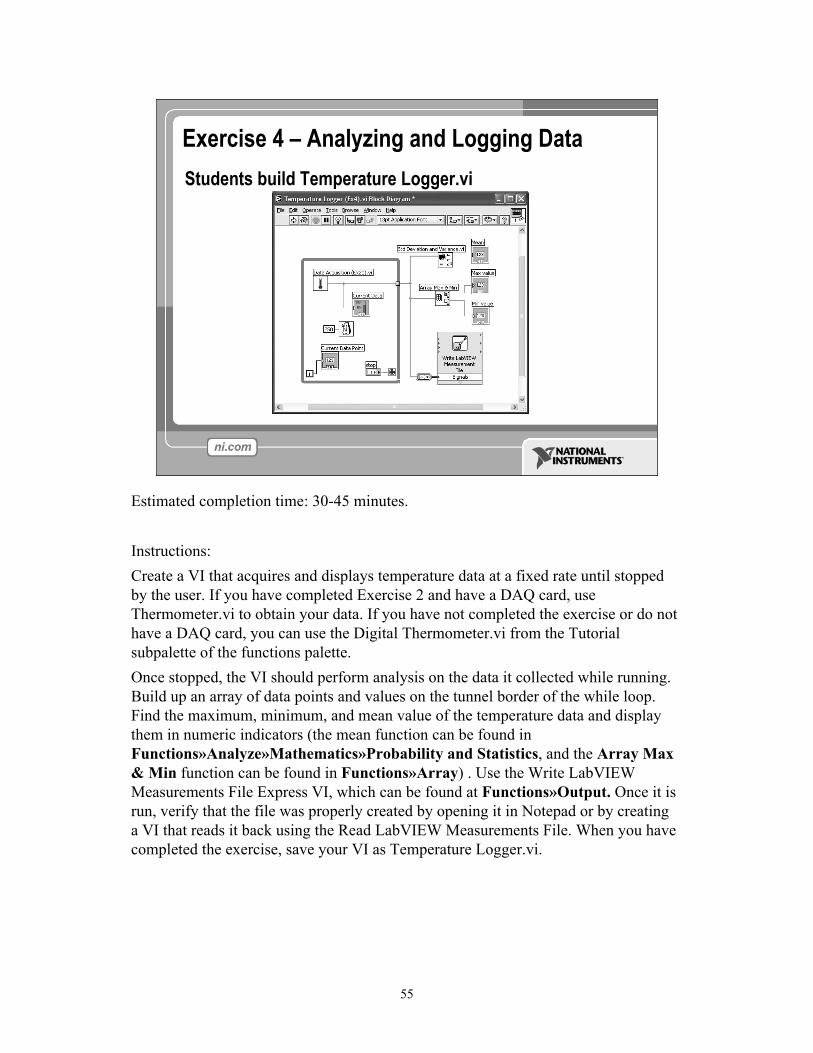
Exercise 4 � Analyzing and Logging DataStudents build Temperature Logger.vi
Estimated completion time: 30-45 minutes.
Instructions:Create a VI that acquires and displays temperature data at a fixed rate until stopped by the user. If you have completed Exercise 2 and have a DAQ card, use Thermometer.vi to obtain your data. If you have not completed the exercise or do not have a DAQ card, you can use the Digital Thermometer.vi from the Tutorial subpalette of the functions palette.Once stopped, the VI should perform analysis on the data it collected while running. Build up an array of data points and values on the tunnel border of the while loop. Find the maximum, minimum, and mean value of the temperature data and display them in numeric indicators (the mean function can be found in Functions»Analyze»Mathematics»Probability and Statistics, and the Array Max & Min function can be found in Functions»Array) . Use the Write LabVIEW Measurements File Express VI, which can be found at Functions»Output. Once it is run, verify that the file was properly created by opening it in Notepad or by creating a VI that reads it back using the Read LabVIEW Measurements File. When you have completed the exercise, save your VI as Temperature Logger.vi.

56
Section VI � Array Functions & Graphs
� Basic Array Functions� Use graphs� Create multiplots with graphs

57
Array Functions � BasicsFunctions»All functions»Array
Use the Array functions located on the Functions»All Functions»Array palette to create and manipulate arrays. Array functions include the following:
� Array Size�Returns the number of elements in each dimension of an array. Ifthe array is n-dimensional, the size output is an array of n elements.
� Initialize Array�Creates an n-dimensional array in which every element is initialized to the value of element. Resize the function to increase the number of dimensions of the output array.
� Build Array�Concatenates multiple arrays or appends elements to an n-dimensional array. Resize the function to increase the number of elements in the output array.
� Array Subset�Returns a portion of an array starting at index and containing length elements.
� Index Array�Returns an element of an array at index. You also can use the Index Array function to extract a row or column of a 2D array to create a subarray of the original. To do so, wire a 2D array to the input of the function. Two index terminals are available. The top index terminal indicates the row, and the second terminal indicates the column. You can wire inputs to both index terminals to index a single element, or you can wire only one terminal to extract a row or column of data. For example, wire the following array to the input of the function.

58
Array Functions � Build Array
Build Array can perform two distinct functions. It Concatenates multiple arrays or appends elements to an n-dimensional array. Resize the function to increase the number of elements in the output array. To concatenate the inputs into a longer array of the same dimension as shown in the following array, right-click the function node and select Concatenate Inputs from the shortcut menu.

59
GraphsSelected from the Graph palette of Controls menu Controls»All Controls»Graphs
Waveform Graph � Plot an array of numbers against their indicesExpress XY Graph � Plot one array against anotherDigital Waveform Graph � Plot bits from binary data
VIs with graphs usually collect the data in an array and then plot the data to the graph.
The graphs located on the Controls» All Controls» Graph palette include the waveform graph and XY graph. The waveform graph plots only single-valued functions, as in y = f(x), with points evenly distributed along the x-axis, such as acquired time-varying waveforms. Express XY graphs display any set of points, evenly sampled or not. Resize the plot legend to display multiple plots. Use multiple plots to save space on the front panel and to make comparisons between plots. XY and waveform graphs automatically adapt to multiple plots.
Single-Plot Waveform GraphsThe waveform graph accepts a single array of values and interprets the data as points on the graph and increments the x index by one starting at x = 0. The graph also accepts a cluster of an initial x value, a .x, and an array of y data. Refer to the Waveform Graph VI in the examples\general\graphs\gengraph.llb for examples of the data types that single-plot waveform graphs accept.

60
Multiple-Plot Waveform GraphsA multiplot waveform graph accepts a 2D array of values, where each row of the array is a single plot. The graph interprets the data as points on the graph and increments the x index by one, starting at x = 0. Wire a 2D array data type to the graph, right-click the graph, and select Transpose Array from the shortcut menu to handle each column of the array as a plot. Refer to the (Y) Multi Plot 1 graph in the Waveform Graph VI in the examples\general\graphs\gengraph.llb for an example of a graph that accepts this data type.
A multiplot waveform graph also accepts a cluster of an x value, a ∆x value, and a 2D array of y data. The graph interprets the y data as points on the graph and increments the x index by ∆x, starting at x = 0. Refer to the (Xo, ∆x, Y) Multi Plot 3 graph in the Waveform Graph VI in the examples\general\graphs\gengraph.llb for an example of a graph that accepts this data type.
A multiplot waveform graph accepts a cluster of an initial x value, a .x value, and an array that contains clusters. Each cluster contains a point array that contains the y data. You use the Bundle function to bundle the arrays into clusters, and you use the Build Array function to build the resulting clusters into an array. You also can use the Build Cluster Array, which creates arrays of clusters that contain inputs you specify. Refer to the (Xo, ∆x, Y) Multi Plot 2 graph in the Waveform Graph VI in the examples\general\graphs\gengraph.llb for an example of a graph that accepts this data type.
Single-Plot XY GraphsThe single-plot XY graph accepts a cluster that contains an x array and a y array. The XY graph also accepts an array of points, where a point is a cluster that contains an x value and a y value. Refer to the XY Graph VI in the examples\general\graph\gengraph.llb for an example of single-plot XY graph data types.
Multiplot XY GraphsThe multiplot XY graph accepts an array of plots, where a plot is a cluster that contains an x array and a y array. The multiplot XY graph also accepts an array of clusters of plots, where a plot is an array of points. A point is a cluster that contains an x value and a y value. Refer to the XY Graph VI in the examples\general\graph\gengraph.llb for an example of multiplot XY graph data types.
61
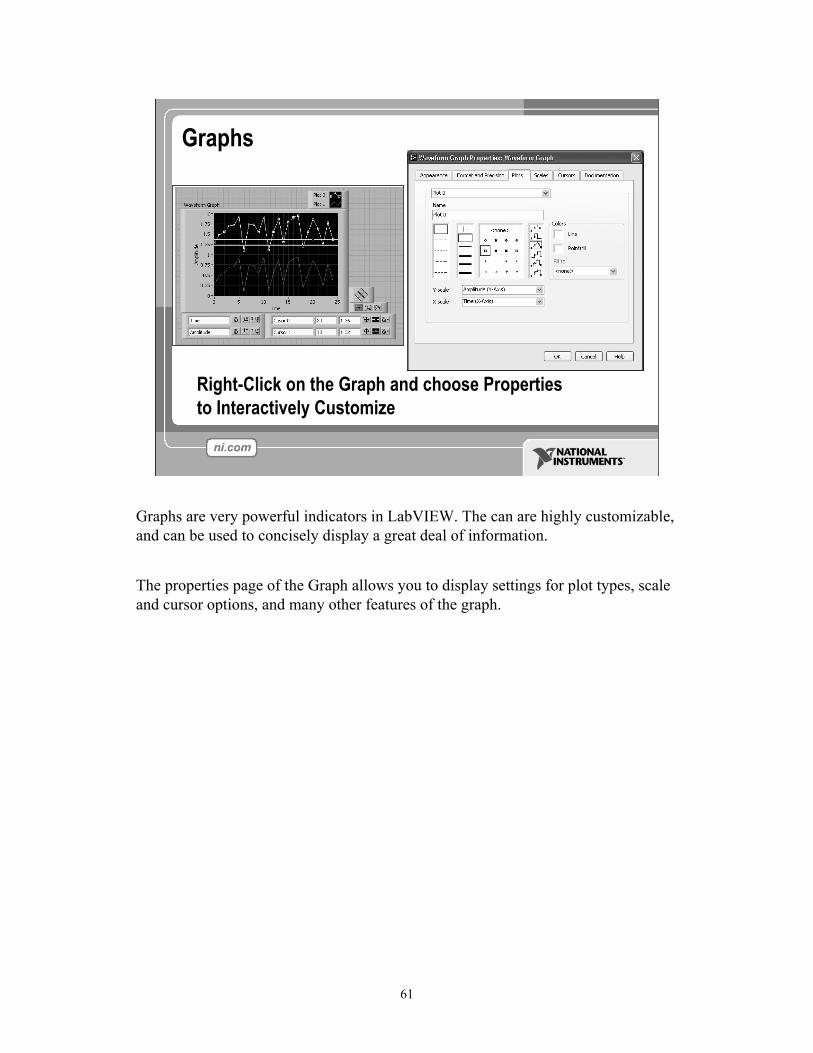
Graphs
Right-Click on the Graph and choose Propertiesto Interactively Customize
Graphs are very powerful indicators in LabVIEW. The can are highly customizable, and can be used to concisely display a great deal of information.
The properties page of the Graph allows you to display settings for plot types, scale and cursor options, and many other features of the graph.

62
Exercise 5 � Using Waveform Graphs
Estimated Completion Time: 20 minutes.
Create a VI like the one pictured above. The VI should use a while loop with a 100 millisecond delay to continuously generate sine and square waves and display them on a waveform graph. Use Simulate Signal Express VI from the Functions»Inputpalette to generate the signals. The frequency input to each function is chosen by the userChange the colors, visible items, and plot styles of the graph. Experiment with some of the cursor and zooming options available.
63
Section VII � Strings, Clusters, & Error Handling
� Strings� Creating Clusters� Cluster Functions� Error I/O
64
Strings� A string is a sequence of displayable or nondisplayable
characters (ASCII)� Many uses � displaying messages, instrument control, file
I/O� String control/indicator is in the Controls»Text Control or
Text Indicator
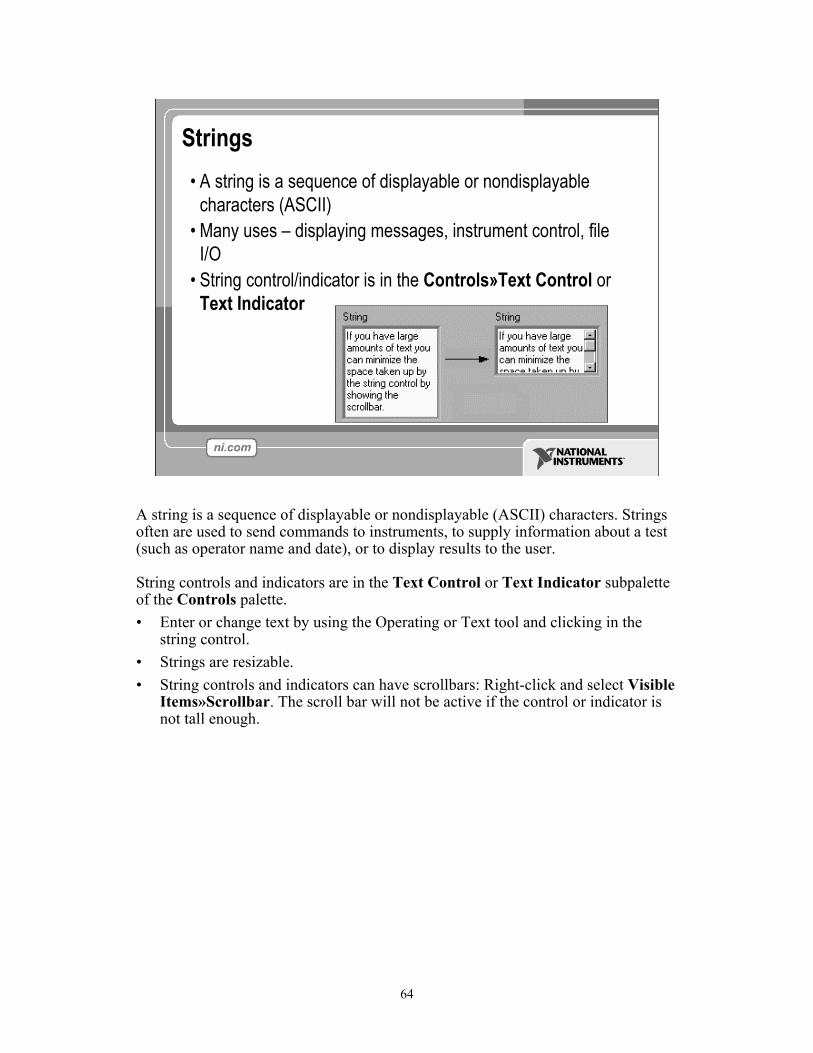
A string is a sequence of displayable or nondisplayable (ASCII) characters. Strings often are used to send commands to instruments, to supply information about a test (such as operator name and date), or to display results to the user.
String controls and indicators are in the Text Control or Text Indicator subpaletteof the Controls palette.� Enter or change text by using the Operating or Text tool and clicking in the
string control.� Strings are resizable.� String controls and indicators can have scrollbars: Right-click and select Visible
Items»Scrollbar. The scroll bar will not be active if the control or indicator is not tall enough.

65
Clusters
� Data structure that groups data together� Data may be of different types� Analogous to struct in C� Elements must be either all controls or all indicators� Thought of as wires bundled into a cable
Clusters group like or unlike components together.Equivalent to a record in Pascal or a struct in C.Cluster components may be of different data types.Examples:� Error information�Grouping a Boolean error flag, a numeric error code, and an
error source string to specify the exact error.� User information�Grouping a string indicating a user�s name and an ID
number specifying their security code.All elements of a cluster must be either controls or indicators. You cannot have a string control and a Boolean indicator. Clusters can be thought of as grouping individual wires (data objects) together into a cable (cluster).

66
Creating a Cluster1. Select a Cluster shell
Controls»All Controls»Array & Cluster
2. Place objects inside the shell
Demonstrate how to create a cluster front panel object by choosing Cluster from the Controls»All Controls»Array & Cluster palette.� This option gives you a shell (similar to the array shell when creating arrays).� You can size the cluster shell when you drop it.� Right click inside the shell and add objects of any type. Note: You can even have a cluster inside of a cluster.The cluster becomes a control or an indicator cluster based on the first object you place inside the cluster.
You can also create a cluster constant on the block diagram by choosing Cluster Constant from the Cluster palette.� This gives you an empty cluster shell.� You can size the cluster when you drop it.� Put other constants inside the shell.Note: You cannot place terminals for front panel objects in a cluster constant on the block diagram, nor can you place �special� constants like the Tab or Empty String constant within a block diagram cluster shell.

67
Cluster Functions� In the Cluster subpalette of the Functions»All functions
palette� Can also be accessed by right-clicking on the cluster
terminal
Bundle
(Terminal labels reflect data type)
Bundle By Name
� Bundle function�Forms a cluster containing the given objects (explain the example).
� Bundle by Name function�Updates specific cluster object values (the object must have an owned label).
Note: You must have an existing cluster wired into the middle terminal of the function to use Bundle By Name.
68
Cluster Functions
Unbundle
Unbundle By Name
Unbundled cluster in the diagram
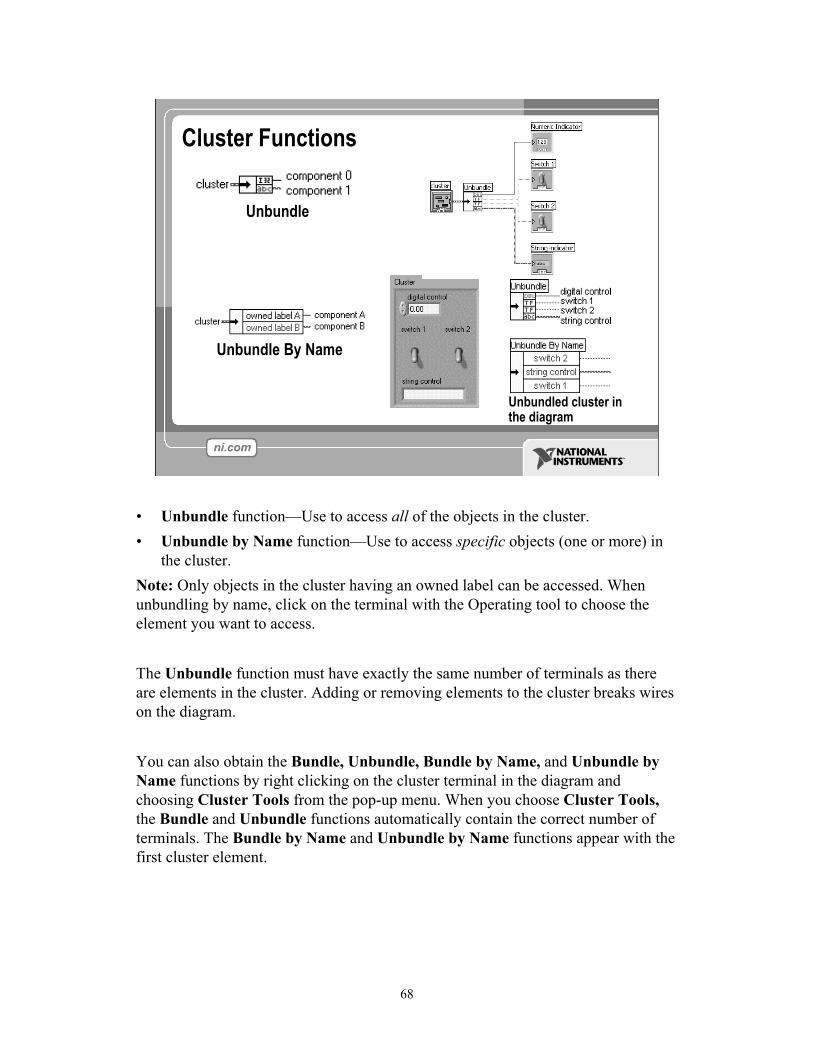
� Unbundle function�Use to access all of the objects in the cluster.� Unbundle by Name function�Use to access specific objects (one or more) in
the cluster. Note: Only objects in the cluster having an owned label can be accessed. When unbundling by name, click on the terminal with the Operating tool to choose the element you want to access.
The Unbundle function must have exactly the same number of terminals as there are elements in the cluster. Adding or removing elements to the cluster breaks wires on the diagram.
You can also obtain the Bundle, Unbundle, Bundle by Name, and Unbundle by Name functions by right clicking on the cluster terminal in the diagram and choosing Cluster Tools from the pop-up menu. When you choose Cluster Tools,the Bundle and Unbundle functions automatically contain the correct number of terminals. The Bundle by Name and Unbundle by Name functions appear with the first cluster element.

69
Error Clusters
Error cluster contains the following information:� Boolean to report whether error occurred� Integer to report a specific error code� String to give information about the error
Error clusters are a powerful means of handling errors.The LabVIEW DAQ VIs, File I/O functions, networking VIs, and many other VI�s use this method to pass error information between nodes.The error cluster contains the following elements:� status, a Boolean which is set to True if an error occurs.� code, a numeric which is set to a code number corresponding to the error that
occurred.� source, a string which identifies the VI in which the error occurred.
70
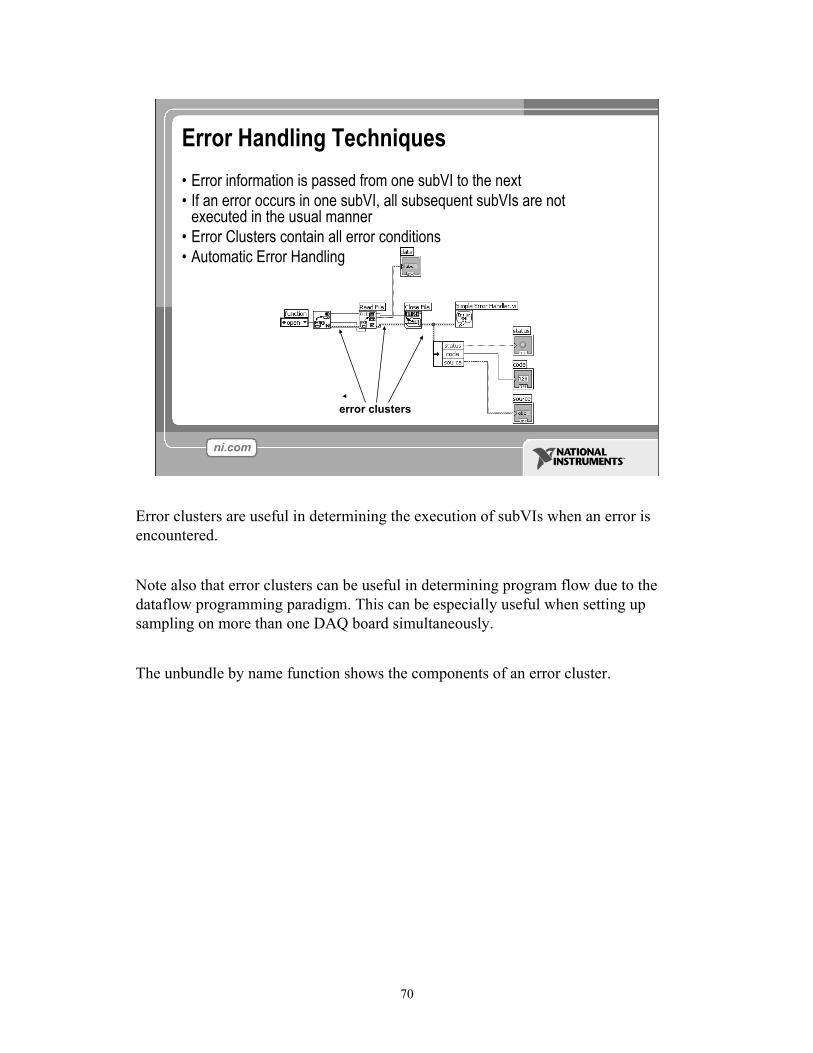
Error Handling Techniques� Error information is passed from one subVI to the next� If an error occurs in one subVI, all subsequent subVIs are not
executed in the usual manner� Error Clusters contain all error conditions� Automatic Error Handling
error clusters
Error clusters are useful in determining the execution of subVIs when an error is encountered.
Note also that error clusters can be useful in determining program flow due to the dataflow programming paradigm. This can be especially useful when setting up sampling on more than one DAQ board simultaneously.
The unbundle by name function shows the components of an error cluster.

71
Section VIII � Case & Sequence Structures, Formula Nodes
72
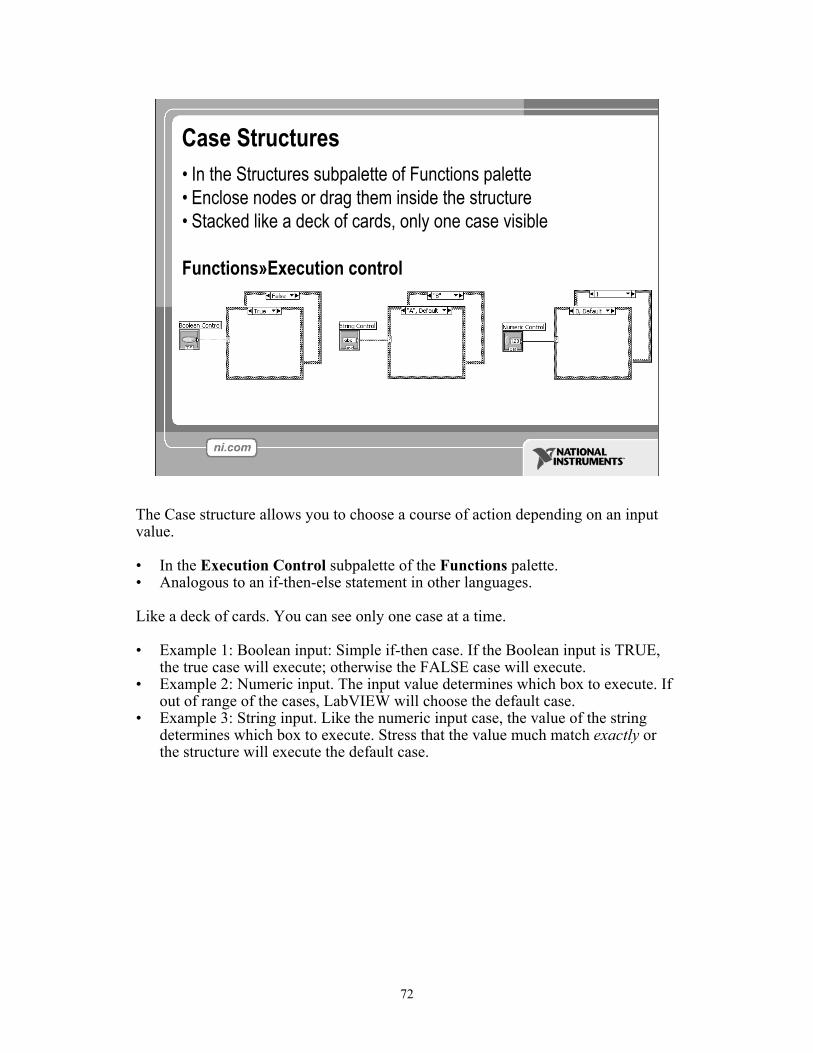
Case Structures� In the Structures subpalette of Functions palette� Enclose nodes or drag them inside the structure� Stacked like a deck of cards, only one case visible
Functions»Execution control
The Case structure allows you to choose a course of action depending on an input value.
� In the Execution Control subpalette of the Functions palette.� Analogous to an if-then-else statement in other languages.
Like a deck of cards. You can see only one case at a time.
� Example 1: Boolean input: Simple if-then case. If the Boolean input is TRUE, the true case will execute; otherwise the FALSE case will execute.
� Example 2: Numeric input. The input value determines which box to execute. If out of range of the cases, LabVIEW will choose the default case.
� Example 3: String input. Like the numeric input case, the value of the string determines which box to execute. Stress that the value much match exactly or the structure will execute the default case.
73
Exercise 6 � Error Clusters & Handling
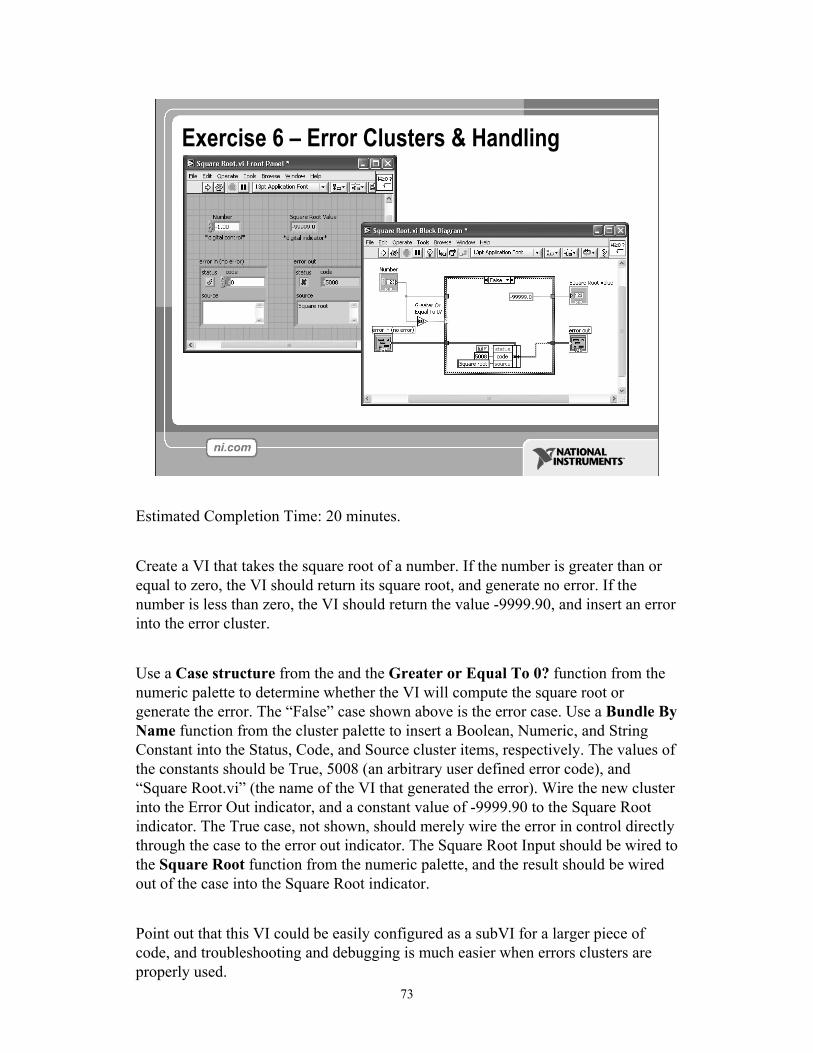
Estimated Completion Time: 20 minutes.
Create a VI that takes the square root of a number. If the number is greater than or equal to zero, the VI should return its square root, and generate no error. If the number is less than zero, the VI should return the value -9999.90, and insert an error into the error cluster.
Use a Case structure from the and the Greater or Equal To 0? function from the numeric palette to determine whether the VI will compute the square root or generate the error. The �False� case shown above is the error case. Use a Bundle By Name function from the cluster palette to insert a Boolean, Numeric, and String Constant into the Status, Code, and Source cluster items, respectively. The values of the constants should be True, 5008 (an arbitrary user defined error code), and �Square Root.vi� (the name of the VI that generated the error). Wire the new cluster into the Error Out indicator, and a constant value of -9999.90 to the Square Root indicator. The True case, not shown, should merely wire the error in control directly through the case to the error out indicator. The Square Root Input should be wired to the Square Root function from the numeric palette, and the result should be wired out of the case into the Square Root indicator.
Point out that this VI could be easily configured as a subVI for a larger piece of code, and troubleshooting and debugging is much easier when errors clusters are properly used.
74
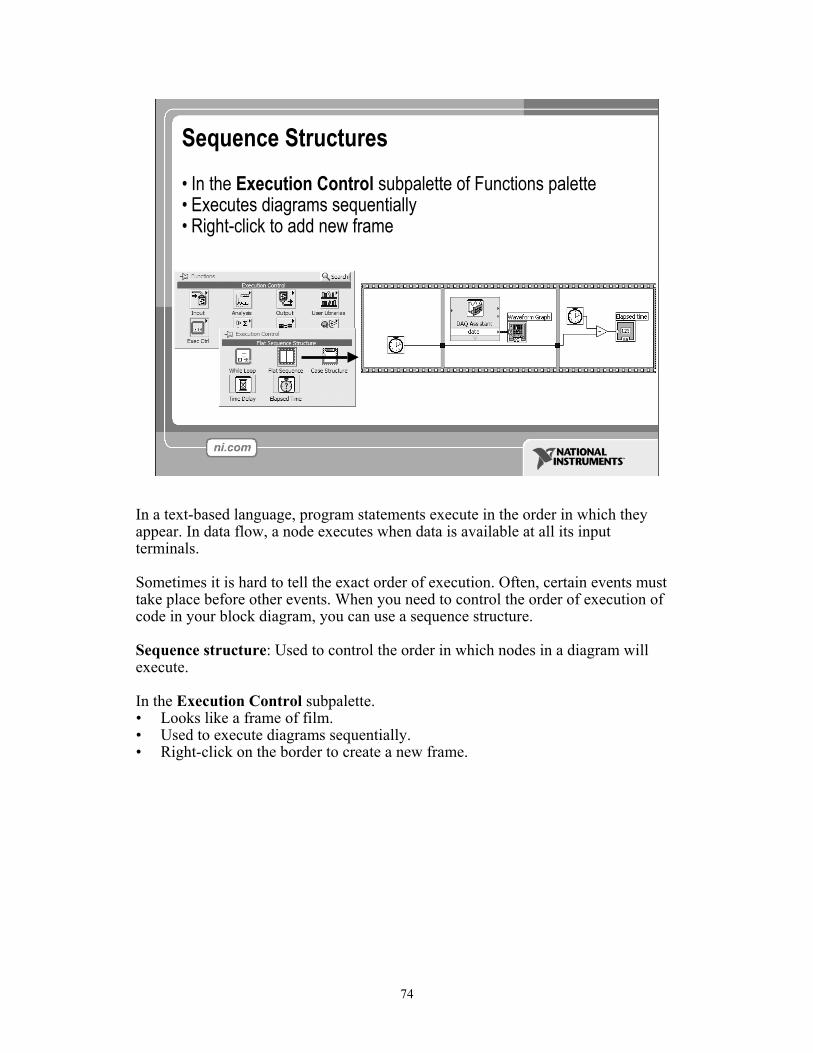
Sequence Structures� In the Execution Control subpalette of Functions palette� Executes diagrams sequentially� Right-click to add new frame
In a text-based language, program statements execute in the order in which they appear. In data flow, a node executes when data is available at all its input terminals.
Sometimes it is hard to tell the exact order of execution. Often, certain events must take place before other events. When you need to control the order of execution of code in your block diagram, you can use a sequence structure.
Sequence structure: Used to control the order in which nodes in a diagram will execute.
In the Execution Control subpalette.� Looks like a frame of film.� Used to execute diagrams sequentially.� Right-click on the border to create a new frame.

75
Formula Nodes� In the Structures subpalette � Implement complicated equations� Variables created at border� Variable names are case sensitive� Each statement must terminate with a semicolon (;)� Context Help Window shows available functions
Note semicolon
Sometimes it is preferable to program mathematical expressions with text-based function calls, rather than icons (which can take up a lot of room on the diagram). Formula Node: allows you to implement complicated equations using text-based instructions.� Located in the Structures subpalette.� Resizable box for entering algebraic formulas directly into block diagrams.� To add variables, right-click and choose Add Input or Add Output. Name
variables as they are used in formula. (Names are case sensitive.) � Statements must be terminated with a semicolon.� When using several formulas in a single formula node, every assigned variable
(those appearing on the left hand side of each formula) must have an output terminal on the formula node. These output terminals do not need to be wired, however.
Compare the examples on the slide.
76
Section IX � Printing & Documentation
� Print From File Menu to Printer, HTML, Rich Text File� Programmatically Print Graphs or Front Panel Images� Document VIs in VI Properties»Documentation Dialog� Add Comments Using Free Labels on Front Panel & Block Diagram

77
Printing� File»Print� Gives Many Printing Options
� Choose to Print Icon, Front Panel, Block Diagram, VI Hierarchy, Included SubVIs, VI History
� Print Panel.vi (Programmatically Prints a Front Panel) � Functions»All Functions»Application Control
� Generate & Print Reports (Functions»Output»Report)
LabVIEW offers many options for printing VIs. From the standard File » Print� menu, the user can print a hard copy of his or her VI, or print the VI to a file for storage or publishing.
Using the Print Panel VI in LabVIEW allows the user to programmatically print the results of a test. VIs can also be configured to print automatically after execution. This option is set in VI Properties » Print Options.
For more advanced applications, LabVIEW has report generation tools that allow the user to create custom reports for individual applications.
LabVIEW 7.0 includes an Express VI called Report. This VI generates a preformatted report that contains VI documentation, datathe VI returns, and report properties, such as the author, company, and number of pages.

78
Documenting VIs
� VI Properties»Documentation� Provide a Description and Help Information for a VI
� VI Properties»Revision History� Track Changes Between Versions of a VI
� Individual Controls»Description and Tip�� Right-click to Provide Description and Tip Strip
� Use Labeling Tool to Document Front Panels & Block Diagrams
By opening a VI�s properties a developer can add documentation to his or her VI. The documentation placed in the Description field of the VI Documentation window shows up in Context Help, and prints with the VI.
If a user has an application that is continually developing, he or she can track changes in the development with Revision History, also found in VI Properties.
Any control or indicator on the Front Panel can be documented by right-clicking and choosing Description and Tip� The Description information appears in the Context Help menu when a user hovers the mouse over the object, and the Tip information pops up in a small strip next to the mouse when the user pauses above the object.
Much like comments in a text-based language, the developer may want to explain a portion of his code, or provide directions on a front panel. Either of these needs can be met by using the labeling tool to create a free text box with as many instructions or explanations as necessary.

79
Section X � Basic Programming Architecture
� Simple VI Architecture� General VI Architecture� State Machine Architecture
You can structure VIs differently depending on what functionality you want them to have. This section discusses some of the most common types of VI architectures, along with their advantages/disadvantages: simple, general, and state machines.

80
Simple VI Architecture
� Functional VI that produces results when run� No �start� or �stop� options� Suitable for lab tests, calculations
� Example: Convert C to F.vi
Simple VI ArchitectureWhen making quick lab measurements, you do not need a complicated architecture. Your program may consist of a single VI that takes a measurement, performs calculations, and either displays the results or records them to disk. The measurement can be initiated when the user clicks on the run arrow. In addition to being commonly used for simple applications, this architecture is used for �functional� components within larger applications. You can convert these simple VIs into subVIs that are used as building blocks for larger applications.

81
General VI Architecture
Three Main Steps� Startup� Main Application� Shutdown
General VI ArchitectureIn designing an application, you generally have up to three main phases:� Startup�Use this area to initialize hardware, read configuration information
from files, or prompt the user for data file locations.� Main Application�Generally consists of at least one loop that repeats until the
user decides to exit the program, or the program terminates for other reasons such as I/O completion.
� Shutdown�This section usually takes care of closing files, writing configuration information to disk, or resetting I/O to its default state.
The diagram above shows this general architecture. For simple applications, the main application loop can be fairly straightforward. When you have complicated user interfaces or multiple events (user action, I/O triggers, and so on), this section can get more complicated.

82
State Machine Architecture� Advantages
� Can go from any state from any other� Easy to modify and debug
� Disadvantages� Can lose events if two occur at the
same time
States:0: Startup1: Idle2: Event 13: Event 24: Shutdown
State Machine VI ArchitectureYou can make your diagrams more compact by using a single case structure to handle all of your events. In this model, you scan the list of possible events, or states, and then map that to a case. For the VI shown above, the possible states are startup, idle, event 1, event 2, and shutdown. These states are stored in an enumerated constant. Each state has its own case where you place the appropriate nodes. While a case is running, the next state is determined based on the current outcome. The next state to run is stored in the shift register. If an error occurs an any of the states, the shutdown case is called. The advantage of this model is that your diagram can become significantly smaller (left to right), making it easier to read and debug. One drawback of the Sequence structure is that it cannot skip or break out of a frame. This method solves that problem because each case determines what the next state will be as it runs. A disadvantage to this approach is that with the simple approach shown above, you can lose events. If two events occur at the same time, this model handles only the first one, and the second one is lost. This can lead to errors that are difficult to debug because they may occur only occasionally. More complex versions of the state machine VI architecture contain extra code that builds a queue of events (states) so that you do not miss any events.
83
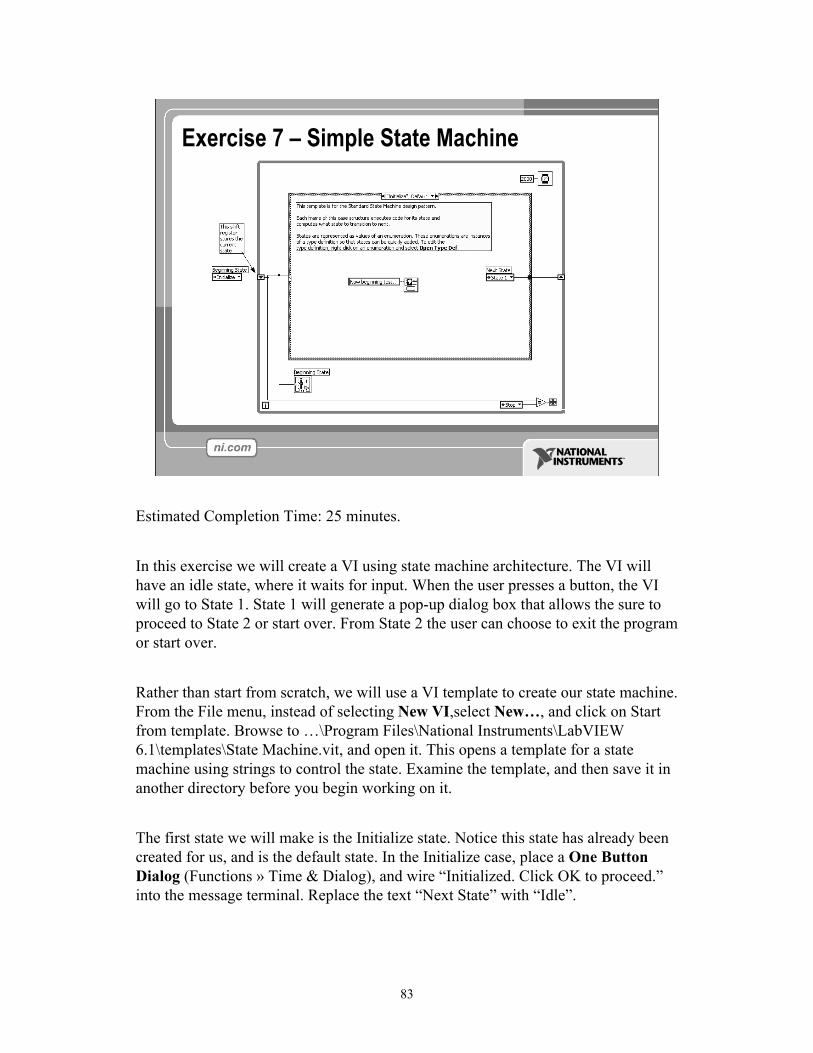
Exercise 7 � Simple State Machine
Estimated Completion Time: 25 minutes.
In this exercise we will create a VI using state machine architecture. The VI will have an idle state, where it waits for input. When the user presses a button, the VI will go to State 1. State 1 will generate a pop-up dialog box that allows the sure to proceed to State 2 or start over. From State 2 the user can choose to exit the program or start over.
Rather than start from scratch, we will use a VI template to create our state machine. From the File menu, instead of selecting New VI,select New�, and click on Start from template. Browse to �\Program Files\National Instruments\LabVIEW 6.1\templates\State Machine.vit, and open it. This opens a template for a state machine using strings to control the state. Examine the template, and then save it in another directory before you begin working on it.
The first state we will make is the Initialize state. Notice this state has already been created for us, and is the default state. In the Initialize case, place a One Button Dialog (Functions » Time & Dialog), and wire �Initialized. Click OK to proceed.� into the message terminal. Replace the text �Next State� with �Idle�.
84
Right click on the case structure and, choose Add Case After, and name the case �Idle�. Inside the Idle case, place a second case structure. Wire a Boolean called �Begin Test� to the select terminal for the inner case structure, and wire a string constant with the value �Test� out of the True case to the shift register. In the False case, wire the value �Idle� out to the shift register. This setup will keep the state machine in the Idle state until the user presses the button to begin the test. Right click on the Boolean output tunnel and choose Create » Constant. Set the constant value to True.
Right click on the main case structure and add another case. Call this case �Test�. In the Test case, place a Two Button Dialog (Functions » Time & Dialog). Wire the text �The test has run. Click OK to quit, Cancel to test again.� into the message terminal. Place another case structure inside the Test case, and wire �T button?� the output of the Two Button Dialog into the selection terminal. Wire a value of �Idle� out of the False case into the shift register, and a Boolean True constant into the termination condition of the while loop. The True case should contain an empty string constant, and a Boolean False wired into the termination condition. This will terminate the program if the user presses OK, and return it back to the idle state if the user presses Cancel.

85
Section XI � Remote Front Panels
� View & Control LabVIEW Front Panels from a Web Browser
� Requires no programming� Remote clients see �live� front panel updates� Multiple clients can view the same panel simultaneously
� Only one client can control the front panel at a time
In LabVIEW, a feature called remote front panels allow users to view and control the VI front panels remotely from LabVIEW or from a web browser without any programming. A user can run an application or check progress from anywhere. In addition, several users at different locations all can access the VI simultaneously.Remote panel clients will see �live� updates to the VI front panel, as opposed to static images. There can be multiple clients simultaneously viewing the same front panel. However, only one client can control the front panel at a time.

86
Remote Panel Web Publishing Tool� Tools»Web Publishing Tool�
� Click Save to Disk and VI is embedded into an HTML file
� After file is saved, it can be reopened and customized in any HTML editor
To embed your VI into a web page, simply open the Web Publishing Tool from the Tools pull-down menu. The Web Publishing Tool creates a simple html file with the LabVIEW front panel embedded inside it. From the tool, you can create a title, and supply text before and after the front panel object. Once you have created the html file, you can preview it in a web browser, and save the file to disk. Saving the file places the html file in your LabVIEW www directory, which is the default directory for the LabVIEW web server. You can start the web server from the Web Publishing Tool, or from Tools»Options�»Web Server: Configuration.
Note: in the Tools»Options� menu you can also configure access rights and exposed VI�s for your web server.
If you would like to customize your web page beyond what the Web Publishing Tool provides, simply open the html file in another html editor, and customize around the embedded LabVIEW panel code.

87
Remote Front Panels � Resources
NI Developer Zone (zone.ni.com)
� Search for Remote Front Panel
� Tutorials & Instructions Are Available for Download
� Information on Incorporating Web Cameras into Remote Panel Applications
For more information on remote front panels, visit the NI Developer Zone, zone.ni.com.
Remote Panels in LabVIEW -- Distributed Application Development http://zone.ni.com/devzone/insights.nsf/2d17d611efb58b22862567a9006ffe76/8bc90a5f744a482886256ba000681713?OpenDocument
Developing Remote Front Panel LabVIEW Applicationshttp://zone.ni.com/devzone/conceptd.nsf/2d17d611efb58b22862567a9006ffe76/e789515b9976253786256b1f007e039b?OpenDocument

88
Section XII � Additional Topics
� Property Nodes� Local Variables� Global Variables� DataSocket� Binary File I/O
LabVIEW has many other tools available for your development. While time constraints don�t permit us to go into great detail, it is a good idea to highlight some of the advanced capabilities offered by LabVIEW. Students who are interested in a specific topic can search the LabVIEW Example Finder or visit NI�s Developer Zone for more information.
� Property Nodes � Properties are all the qualities of a front panel object. With property nodes, you can set or read such characteristics as foreground and background color, data formatting and precision, visibility, descriptive text, size and location on the front panel, and so on. Search for property nodes in the Find Examples window, there are 24 example programs that ship with LabVIEW.
� Local Variables � Local Variables break the dataflow programming paradigm, allowing data to be passed without wires.
� Global Variables � A special kind of VI, used to store data in front panel objectsfor the purpose of data exchange between VI�s.
� DataSocket � A platform independent means of exchanging data between computers and applications, based on TCP-IP, but without the complexity of low level programming.
� Binary File I/O�allows a user to stream data to a disk in high speed applications.

89
Where Do I Go From Here?
� Example programs (Help»Find Examples�)� LabVIEW Student Edition (ni.com/labviewse)� Web resources (ni.com)
� NI Developer Zone (zone.ni.com)� Application Notes � Info-labview newsgroup (www.info-labview.org/)� Instrument Driver Library (ni.com/idnet)
Where do you go from here?
� National Instruments offers a wide range of instructional courseware to expand your knowledge. Please visit ni.com/academic for programs and resources available.
� The LabVIEW Student Edition is a available from our website. In includes Learning With LabVIEW, a textbook written by Dr. Bob Bishop from the University of Texas at Austin.
� The Web is the best place to turn in order to find information on LabVIEW. Ni.com is designed to be the one stop resource to find information. � The NI Developer Zone (�NIDZ�) is a place for developers to meet, discuss
design issues, and post content.� Application Notes can be downloaded from ni.com/support on a variety of
topics.� Info-labview is a newsgroup maintained by a third party.� There is an exhaustive library of LabVIEW instrument drivers available for
download from NIDZ.
90
Exercise 0 - Open and Run a Virtual Instrument (Slide 12) Examine the Signal Generation and Processing VI and run it. Change the frequencies and types of the input signals and notice how the display on the graph changes. Change the Signal Processing Window and Filter options. After you have examined the VI and the different options you can change, stop the VI by pressing the Stop button.
1. Select Start»Programs»National Instruments»LabVIEW 7.0»LabVIEW to launch LabVIEW. The LabVIEW dialog box appears.
2. Select Help»Find Examples. The dialog box that appears lists and links to all available LabVIEW example VIs.
3. On the Browse Tab, select browse according to task. Choose Analyzing and Processing Signals, then Signal Processing, then Signal Generation and Processing.vi. This will open the Signal Generation and Processing VI Front Panel.
Note: You also can open the VI by clicking the Open VI button and navigating to labview\examples\apps\demos.llb\Signal Generation and Processing.vi. Front Panel
4. Click the Run button on the toolbar, shown at left, to run this VI.
This VI determines the result of filtering and windowing a generated signal. This example also displays the power spectrum for the generated signal. The resulting signals are displayed in the graphs on the front panel, as shown in the following figure.

91
5. Use the Operating tool, shown at left, to change the Input Signal and the Signal Processing, use the increment or decrement arrows on the control, and drag the pointer to the desired Frequency.
6. Press the More Info… button or [F5] to read more about the analysis functions.
7. Press the Stop button or [F4] to stop the VI.
Block Diagram
8. Select Window»Show Diagram or press the <Ctrl-E> keys to display the block diagram for the Signal Generation and Processing VI.
(MacOS) Press the <Command-E> keys. (Sun) Press the <Meta-E> keys.
(Linux) Press the <Alt-E> keys.
This block diagram contains several of the basic block diagram elements, including subVIs, functions, and structures, which you will learn about later in this course.
9. Select Window»Show Panel or press the <Ctrl-E> keys to return to the Front Panel.
10. Close the VI and do not save changes.
End of Exercise

92
Exercise 1 --- Convert °C to °F Build a VI Complete the following steps to create a VI that takes a number representing degrees Celsius and converts it to a number representing degrees Fahrenheit.
In wiring illustrations, the arrow at the end of this mouse icon shows where to click and the number on the arrow indicates how many times to click.
Front Panel
1. Select File»New to open a new front panel.
2. (Optional) Select Window»Tile Left and Right to display the front panel and block diagram side by side.
3. Create a numeric digital control. You will use this control to enter the value for degrees Centigrade.
a. Select the digital control on the Controls»Numeric Controls palette. If the Controls palette is not visible, right-click an open area on the front panel to display it.
b. Move the control to the front panel and click to place the control.
c. Type deg C inside the label and click outside the label or click the Enter button on the toolbar. If you do not type the name immediately, LabVIEW uses a default label. You can edit a label at any time by using the Labeling tool.
4. Create a numeric digital indicator. You will use this indicator to display the value for degrees Fahrenheit.
a. Select the digital indicator on the Controls»Numeric Indicators palette.
b. Move the indicator to the front panel and click to place the indicator.
c. Type deg F inside the label and click outside the label or click the Enter button.
LabVIEW creates corresponding control and indicator terminals on the block diagram. The terminals represent the data type of the control or indicator. For example, a DBL terminal represents a double-precision, floating-point numeric control or indicator.
Note: Control terminals have a thicker border than indicator terminals.

93
Block Diagram 5. Display the block diagram by clicking it or by selecting Window»Show
Diagram.
Note: Block Diagram terminals can be viewed as icons or as terminals. To change the way LabVIEW displays these objects right click on a terminal and select View As Icon.
6. Select the Multiply and Add functions on the Functions»Numeric palette and place them on the block diagram. If the Functions palette is not visible, right-click an open area on the block diagram to display it.
7. Select the numeric constant on the Functions»Numeric palette and place two of them on the block diagram. When you first place the numeric constant, it is highlighted so you can type a value.
8. Type 1.8 in one constant and 32.0 in the other.
If you moved the constants before you typed a value, use the Labeling tool to enter the values.
9. Use the Wiring tool to wire the icons as shown in the previous block diagram.
• To wire from one terminal to another, use the Wiring tool to click the first terminal, move the tool to the second terminal, and click the second terminal, as shown in the following illustration. You can start wiring at either terminal.

94
• You can bend a wire by clicking to tack the wire down and moving the cursor in a perpendicular direction. Press the spacebar to toggle the wire direction.
• To identify terminals on the nodes, right-click the Multiply and Add functions and select Visible Items»Terminals from the shortcut menu to display the connector pane. Return to the icons after wiring by right-clicking the functions and selecting Visible Items»
• Terminals from the shortcut menu to remove the checkmark.
• When you move the Wiring tool over a terminal, the terminal area blinks, indicating that clicking will connect the wire to that terminal and a tip strip appears, listing the name of the terminal.
• To cancel a wire you started, press the <Esc> key, right-click, or click the source terminal.
10. Display the front panel by clicking it or by selecting Window»Show Panel.
11. Save the VI because you will use this VI later in the course.
a. Select File»Save.
b. Navigate to c:\exercises\LV Intro.
Note: Save all the VIs you edit in this course in c:\exercises\LV Intro.
c. Type Convert C to F.vi in the dialog box.
d. Click the Save button.
12. Enter a number in the digital control and run the VI.
a. Use the Operating tool or the Labeling tool to double-click the digital control and type a new number.
b. Click the Run button to run the VI.
c. Try several different numbers and run the VI again.
13. Select File»Close to close the Convert C to F VI.
End of Exercise

95
Exercise 2a --- Create a SubVI
Front Panel 1. Select File»Open and navigate to c:\exercises\LV Intro to open the
Convert C to F VI.
If you closed all open VIs, click the Open… button on the LabVIEW dialog box.
Tip: Click the arrow next to Open… button on the LabVIEW dialog box to open recently opened files, such as Convert C to F.vi.
The following front panel appears.
2. Right-click the icon in the upper right corner of the front panel and select Edit Icon from the shortcut menu. The Icon Editor dialog box appears.
3. Double-click the Select tool on the left side of the Icon Editor dialog box to select the default icon.
4. Press the <Delete> key to remove the default icon.
5. Double-click the Rectangle tool to redraw the border.
6. Create the following icon.
a. Use the Text tool to click the editing area.
b. Type C and F.
c. Double-click the Text tool and change the font to Small Fonts.
d. Use the Pencil tool to create the arrow.
Note To draw horizontal or vertical straight lines, press the <Shift> key while you use the Pencil tool to drag the cursor.
96
e. Use the Select tool and the arrow keys to move the text and arrow you created.
f. Select the B&W icon and select 256 Colors in the Copy from field to create a black and white icon, which LabVIEW uses for printing unless you have a color printer.
g. When the icon is complete, click the OK button to close the Icon Editor dialog box. The icon appears in the upper right corner of the front panel and block diagram.
7. Right-click the icon on the front panel and select Show Connector from the shortcut menu to define the connector pane terminal pattern.
LabVIEW selects a connector pane pattern based on the number of controls and indicators on the front panel. For example, this front panel has two terminals, deg C and deg F, so LabVIEW selects a connector pane pattern with two terminals.
8. Assign the terminals to the digital control and digital indicator.
a. Select Help»Show Context Help to display the Context Help window. View each connection in the Context Help window as you make it.
b. Click the left terminal in the connector pane. The tool automatically changes to the Wiring tool, and the terminal turns black.
c. Click the deg C control. The left terminal turns orange, and a marquee highlights the control.
d. Click an open area of the front panel. The marquee disappears, and the terminal changes to the data type color of the control to indicate that you connected the terminal.
e. Click the right terminal in the connector pane and click the deg F indicator. The right terminal turns orange.
f. Click an open area on the front panel. Both terminals are orange.
g. Move the cursor over the connector pane. The Context Help window shows that both terminals are connected to floating-point values.
9. Select File»Save to save the VI because you will use this VI later in the course.
10. Select File»Close to close the Convert C to F VI.
End of Exercise

97
Exercise 2b - Data Acquisition To complete this exercise, you will need the IC temperature sensor available on either the BNC-2120, SCB-68, or DAQ Signal Accessory.
Front Panel 1. Select File»New to open a new front panel.
2. Create the thermometer indicator, as shown on the following front panel.
a. Select the thermometer on the Controls»Numeric Indicators palette and place it on the front panel.
b. Type Temperature inside the label and click outside the label or click the Enter button on the toolbar.
c. Right-click the thermometer and select Visible Items»Digital Display from the shortcut menu to display the digital display for the thermometer.
3. Create the vertical switch control.
a. Select the vertical toggle switch on the Controls»Buttons palette.
b. Type Temp Scale inside the label and click outside the label or click the Enter button.
c. Use the Labeling tool to place a free label, deg C, next to the TRUE position of the switch, as shown in the previous front panel.
d. Place a free label, deg F, next to the FALSE position of the switch.
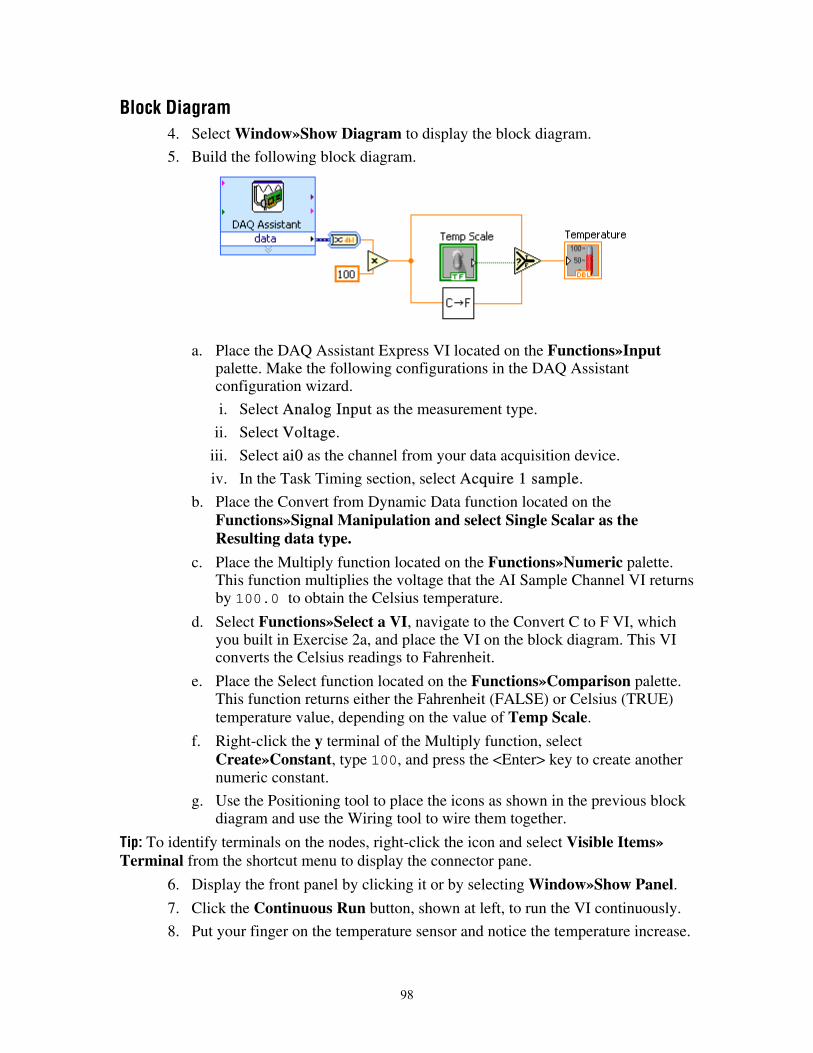
98
Block Diagram 4. Select Window»Show Diagram to display the block diagram.
5. Build the following block diagram.
a. Place the DAQ Assistant Express VI located on the Functions»Input palette. Make the following configurations in the DAQ Assistant configuration wizard.
i. Select Analog Input as the measurement type.
ii. Select Voltage.
iii. Select ai0 as the channel from your data acquisition device.
iv. In the Task Timing section, select Acquire 1 sample.
b. Place the Convert from Dynamic Data function located on the Functions»Signal Manipulation and select Single Scalar as the Resulting data type.
c. Place the Multiply function located on the Functions»Numeric palette. This function multiplies the voltage that the AI Sample Channel VI returns by 100.0 to obtain the Celsius temperature.
d. Select Functions»Select a VI, navigate to the Convert C to F VI, which you built in Exercise 2a, and place the VI on the block diagram. This VI converts the Celsius readings to Fahrenheit.
e. Place the Select function located on the Functions»Comparison palette. This function returns either the Fahrenheit (FALSE) or Celsius (TRUE) temperature value, depending on the value of Temp Scale.
f. Right-click the y terminal of the Multiply function, select Create»Constant, type 100, and press the <Enter> key to create another numeric constant.
g. Use the Positioning tool to place the icons as shown in the previous block diagram and use the Wiring tool to wire them together.
Tip: To identify terminals on the nodes, right-click the icon and select Visible Items» Terminal from the shortcut menu to display the connector pane.
6. Display the front panel by clicking it or by selecting Window»Show Panel.
7. Click the Continuous Run button, shown at left, to run the VI continuously.
8. Put your finger on the temperature sensor and notice the temperature increase.
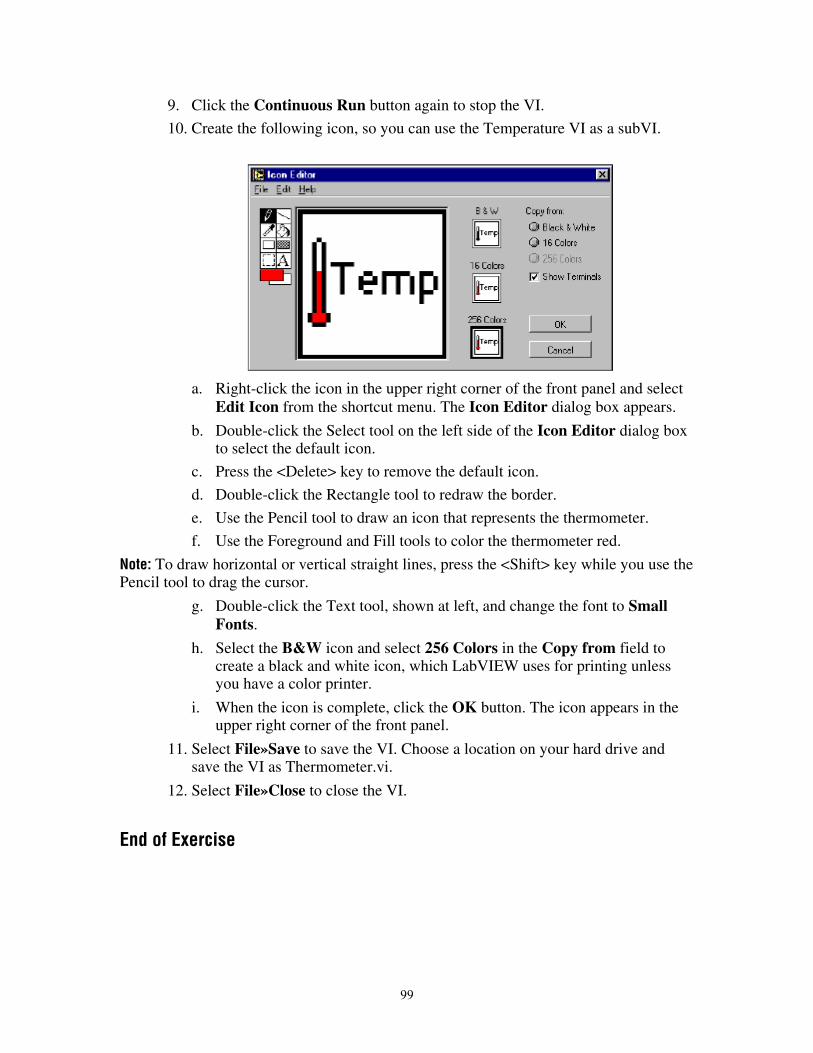
99
9. Click the Continuous Run button again to stop the VI.
10. Create the following icon, so you can use the Temperature VI as a subVI.
a. Right-click the icon in the upper right corner of the front panel and select Edit Icon from the shortcut menu. The Icon Editor dialog box appears.
b. Double-click the Select tool on the left side of the Icon Editor dialog box to select the default icon.
c. Press the <Delete> key to remove the default icon.
d. Double-click the Rectangle tool to redraw the border.
e. Use the Pencil tool to draw an icon that represents the thermometer.
f. Use the Foreground and Fill tools to color the thermometer red.
Note: To draw horizontal or vertical straight lines, press the <Shift> key while you use the Pencil tool to drag the cursor.
g. Double-click the Text tool, shown at left, and change the font to Small Fonts.
h. Select the B&W icon and select 256 Colors in the Copy from field to create a black and white icon, which LabVIEW uses for printing unless you have a color printer.
i. When the icon is complete, click the OK button. The icon appears in the upper right corner of the front panel.
11. Select File»Save to save the VI. Choose a location on your hard drive and save the VI as Thermometer.vi.
12. Select File»Close to close the VI.
End of Exercise

100
Exercise 3 --- Using Loops Use a while loop and a waveform chart to build a VI that demonstrates software timing.
Front Panel
1. Open a new VI.
2. Build the following front panel.
a. Select the horizontal pointer slide on the Controls»Numeric Controls palette and place it on the front panel. You will use the slide to change the software timing.
b. Type millisecond delay inside the label and click outside the label or click the Enter button on the toolbar, shown at left.
c. Place a Stop Button from the Controls»Buttons palette.
d. Select a waveform chart on the Controls»Graph Indicators palette and place it on the front panel. The waveform chart will display the data in real time.
e. Type Value History inside the label and click outside the label or click the Enter button.
f. The waveform chart legend labels the plot Plot 0. Use the Labeling tool to triple-click Plot 0 in the chart legend, type Value, and click outside the label or click the Enter button to relabel the legend.
g. The random number generator generates numbers between 0 and 1, in a classroom setting you could replace this with a data acquisition VI. Use the Labeling tool to double-click 10.0 in the y-axis, type 1, and click outside the label or click the Enter button to rescale the chart.
h. Change –10.0 in the y-axis to 0.
i. Label the y-axis Value and the x-axis Time (sec).
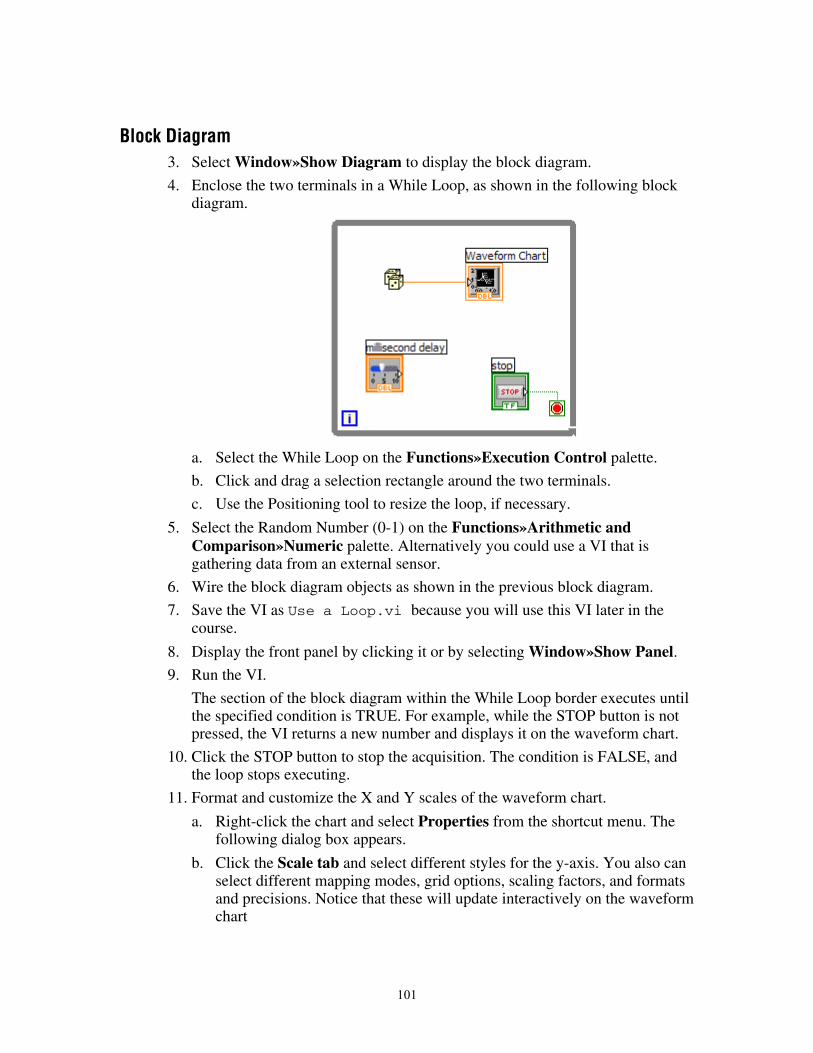
101
Block Diagram
3. Select Window»Show Diagram to display the block diagram.
4. Enclose the two terminals in a While Loop, as shown in the following block diagram.
a. Select the While Loop on the Functions»Execution Control palette.
b. Click and drag a selection rectangle around the two terminals.
c. Use the Positioning tool to resize the loop, if necessary.
5. Select the Random Number (0-1) on the Functions»Arithmetic and Comparison»Numeric palette. Alternatively you could use a VI that is gathering data from an external sensor.
6. Wire the block diagram objects as shown in the previous block diagram.
7. Save the VI as Use a Loop.vi because you will use this VI later in the course.
8. Display the front panel by clicking it or by selecting Window»Show Panel.
9. Run the VI.
The section of the block diagram within the While Loop border executes until the specified condition is TRUE. For example, while the STOP button is not pressed, the VI returns a new number and displays it on the waveform chart.
10. Click the STOP button to stop the acquisition. The condition is FALSE, and the loop stops executing.
11. Format and customize the X and Y scales of the waveform chart.
a. Right-click the chart and select Properties from the shortcut menu. The following dialog box appears.
b. Click the Scale tab and select different styles for the y-axis. You also can select different mapping modes, grid options, scaling factors, and formats and precisions. Notice that these will update interactively on the waveform chart

102
c. Select the options you desire and click the OK button.
12. Right-click the waveform chart and select Data Operations»Clear Chart from the shortcut menu to clear the display buffer and reset the waveform chart. If the VI is running, you can select Clear Chart from the shortcut menu.
Adding Timing When this VI runs, the While Loop executes as quickly as possible. Complete the following steps to take data at certain intervals, such as once every half-second, as shown in the following block diagram.
103
a. Place the Time Delay Express VI located on the Functions»Execution Control palette. In the dialog box that appears, insert 0.5. This function would make sure that each iteration occurs every half-second (500 ms).
b. Divide the millisecond delay by 1000 to get time in seconds. Connect the output of the divide function to the Delay Time (s) input of the Time Delay Express VI. This will allow you to adjust the speed of the execution from the pointer slide on the front panel.
13. Save the VI, because you will use this VI later in the course.
14. Run the VI.
15. Try different values for the millisecond delay and run the VI again. Notice how this effects the speed of the number generation and display.
16. Close the VI.
End of Exercise
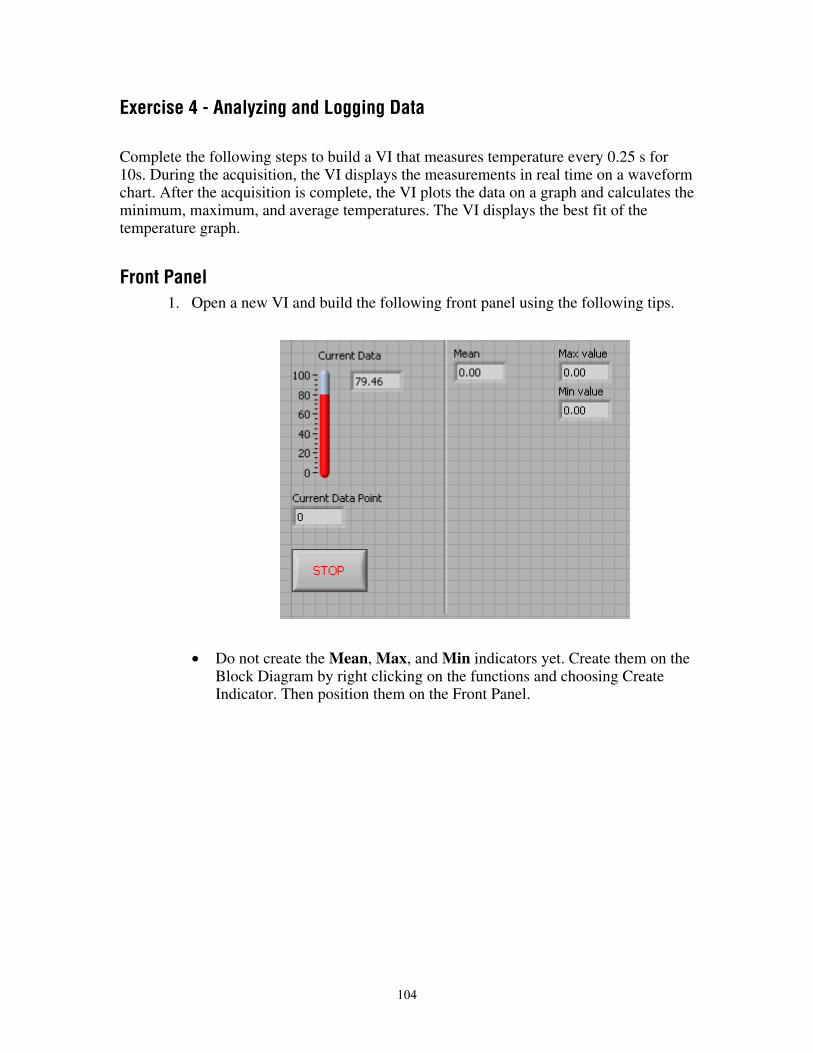
104
Exercise 4 - Analyzing and Logging Data Complete the following steps to build a VI that measures temperature every 0.25 s for 10s. During the acquisition, the VI displays the measurements in real time on a waveform chart. After the acquisition is complete, the VI plots the data on a graph and calculates the minimum, maximum, and average temperatures. The VI displays the best fit of the temperature graph.
Front Panel 1. Open a new VI and build the following front panel using the following tips.
• Do not create the Mean, Max, and Min indicators yet. Create them on the Block Diagram by right clicking on the functions and choosing Create Indicator. Then position them on the Front Panel.

105
Block Diagram 2. Build the following block diagram.
a. Select Functions»All Functions»Select a VI… and choose Thermometer.vi (from previous exercise).
b. Place the Wait Until Next ms Multiple function located on the Functions»All Functions »Time & Dialog palette and create a constant of 250. Much like the Time Delay Express VI, this function causes the For Loop to execute every 0.25 s (250 ms).
c. Place the Array Max & Min function located on the Functions»All Functions »Array palette. This function returns the maximum and minimum temperature.
d. Place the Mean VI located on the Functions»All Functions» Mathematics»Probability and Statistics palette. This VI returns the average of the temperature measurements.
e. Right-click the output terminals of the Array Max & Min function and Mean VI and select Create»Indicator from the shortcut menu to create the Max, Min, and Mean indicators.
f. Place the Write LabVIEW Measurements File Express VI located on the Functions»Output palette. LabVIEW will automatically insert the From DDT function into the wire you connect to the Signals input.
3. Save the VI as Temperature Logger.vi.
4. Display the front panel and run the VI.
5. After pressing STOP a dialog box will appear. Enter the name of the file to save the spreadsheet.

106
6. Open the spreadsheet file to make sure the file was properly created by using Notepad or by creating a VI to read the file as follows.
• Create the following block diagram
• Place the Read LabVIEW Measurement File Express VI located on the
Functions»Input palette.
• Configure the VI to ask the user to choose the file to read and change the delimiter to Tab
• Right click on the Signals Output and choose create graph indicator
7. Run the VI
8. Save and close both of the VIs.
End of Exercise

107
Exercise 5 - Using Waveform Graphs
Front Panel 1. Open a new VI and build the following front panel using the following tips.
a. Create a waveform graph indicator from the Controls»Graph Indicators palette. Use the position/size/select tool to move the plot legend to the side, and expand it to display two plots. Use the labeling tool to change the plot names and the properties page to choose different colors for your plots.
b. Place a Stop button on the front panel.
c. Place two vertical pointer slides from the Controls»Numeric Controls palette. Use the properties page again to change the slide fill color.

108
Block Diagram 2. Build the following block diagram.
a. Place a While Loop from Functions»Execution Control palette.
b. Place a Wait Until Next ms Multiple from Functions»All Functions»Time & Dialog and create a constant with a value of 100.
c. Place two Simulate Signal Express VIs from the Functions»Input and leave the Signal type as Sine for the first Simulate Signal VI and change the Signal Type to Square for the second VI. Wire both of the outputs into the waveform graph. A Merge Signals function will automatically be inserted.
d. Expand the Simulate Signal Express VIs to show another Input/Output. By default, error out should appear. Change this to Frequency by clicking on error out and choosing Frequency.
3. Save the VI as Multiplot Graph.vi.
4. Display the front panel and run the VI.
5. Save and close the VI.
End of Exercise
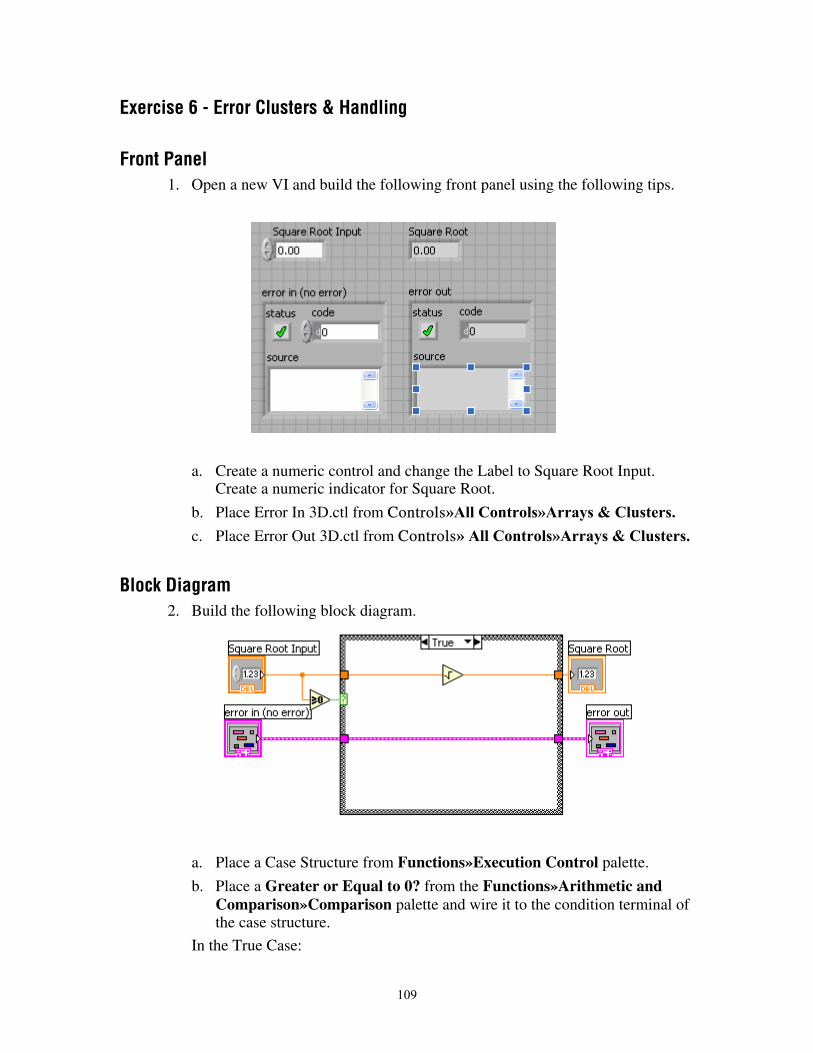
109
Exercise 6 - Error Clusters & Handling
Front Panel 1. Open a new VI and build the following front panel using the following tips.
a. Create a numeric control and change the Label to Square Root Input. Create a numeric indicator for Square Root.
b. Place Error In 3D.ctl from Controls»All Controls»Arrays & Clusters. c. Place Error Out 3D.ctl from Controls» All Controls»Arrays & Clusters.
Block Diagram 2. Build the following block diagram.
a. Place a Case Structure from Functions»Execution Control palette.
b. Place a Greater or Equal to 0? from the Functions»Arithmetic and Comparison»Comparison palette and wire it to the condition terminal of the case structure.
In the True Case:

110
c. Place the Square Root function from Functions»Arithmetic and Comparison»Numeric palette.
In the False Case:
d. Create a numeric constant from Functions»Arithmetic and
Comparison»Numeric palette and type -9999.90.
e. Place the Bundle By Name from Functions»All Functions»Arrays & Clusters palette. Wire from Error in to the center terminal of Bundle by Name to make status show up. Create constants. Wire from the Error Out indicator to the output of Bundle By name.
3. Save the VI as Square Root.vi.
4. Display the front panel and run the VI.
5. Save and close the VI.
End of Exercise

111
Exercise 7 - Simple State Machine Create a VI using state machine architecture that simulates a simple test sequence. The VI will have an initial state, where it will display a pop-up message indicating that it is starting the test. Then it will proceed to the next case and then to the final state where it will ask the user whether to start over or end the test.
Front Panel Rather than start from scratch, we will use a VI template to create our state machine.
1. From the initial LabVIEW screen click on New…, and choose Standard State Machine, which is located under the VI from Template » Frameworks » Design Patterns heading.
2. Examine the template, and then save it in another directory before you begin working on it.
Block Diagram

112
3. Right click on the enum constant labeled Next State and select Open Type Def.
4. On the front panel of the StateMachinesStates.ctl Type Def VI, right click on the States enum control and choose Edit Items.
5. Add two more states. Call them ‘‘State 1’’ and ‘‘State 2’’
6. Close the State Machines.ctl Type Def Front panel and save the control with the default name when prompted.
7. Right click on the Case Selector Label of the case structure and choose Duplicate case. Do this one additional time so that there are four cases: Initialize, State 1, State 2, and Stop.
8. Change the value connected to the Wait function to 2000.

113
9. Right click on the shift register on the left side of the while loop and create an indicator. Change it’s name to ‘‘Current State’’.
10. In the ‘‘Initialize’’, Default case place a One Button Dialog function and wire a string constant into the Message input. Type ‘‘Now beginning test…’’ into the string constant.
11. Change the enum constant labled Next State to ‘‘State 1’’.
12. Change to the next state in the case structure (‘‘State 1’’) and change the enum constant labled Next State to ‘‘State 2’’.
13. Change to the next state (‘‘State2’’) and add the following code.
a. Place a Select function and connect two enum constants
Tip: Copy the enum constants from one of the previous cases
b. Place a Two Button Dialog and wire create the constants as illustrated below.
14. Run the VI.
15. Save and close the VI.
End of Exercise