
Introduction to Hypothesis Testing - University Of...
20
1 Introduction to Hypothesis Testing Decision Examples • How can the jury avoid – Convicting an innocent person? – Freeing a guilty person? • Is one kind of error worse than another? – What does the instruction, “Innocent unless the evidence proves guilt beyond a reasonable doubt,” suggest about how our system, in theory, balances the two? DECISION Innocent Guilty Declare innocent correct decision ERROR Declare guilty ERROR correct decision TRUE STATE Introduction to Hypothesis Testing Decision Examples • The evidence comes from a painless blood test – PSA <4.0 or less is considered normal, cancer-free – PSA > 4.0 can be caused by infection or by cancer of the prostrate – Urologists disagree on how much above 4.0 or for how long above 4.0 the PSA should be to call for a biopsy, and on how age of the patient should influence the decision • Note, disagreements are about the decision criterion and the relative costs of the two types of errors DECISION No Prostate Cancer Prostate Cancer Decide no Prostate Cancer correct decision ERROR Biopsy ERROR correct decision TRUE STATE
Transcript of Introduction to Hypothesis Testing - University Of...
1
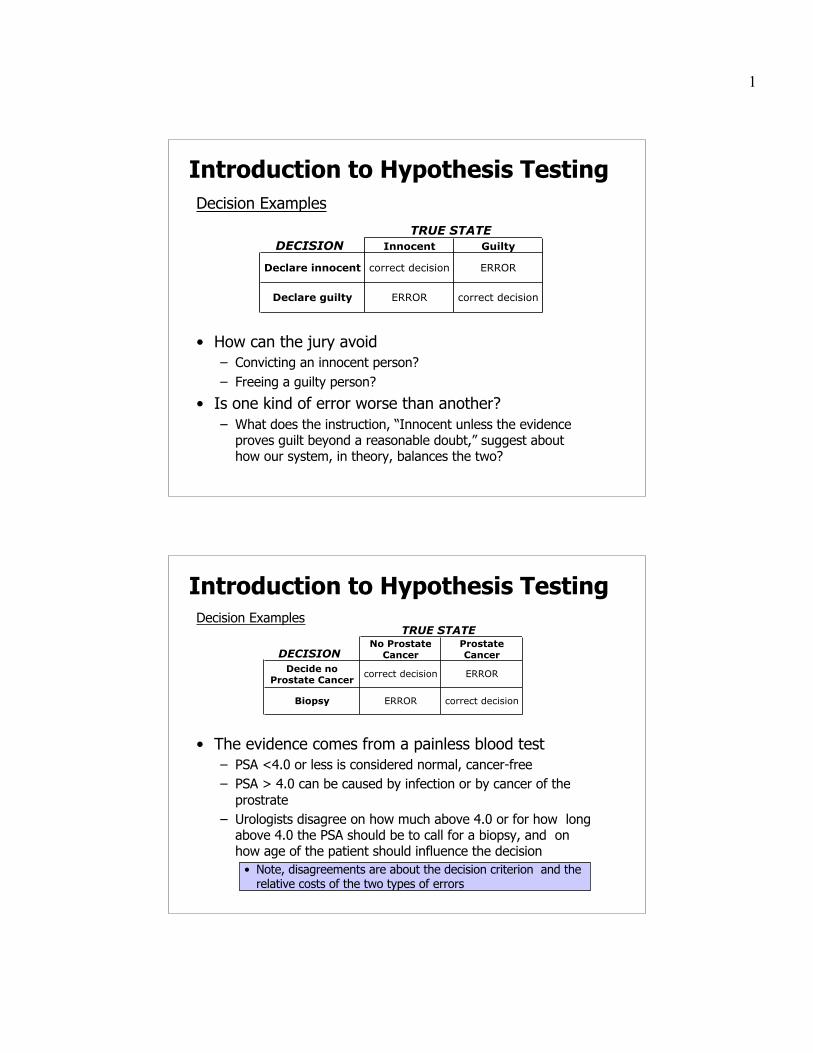
Introduction to Hypothesis TestingDecision Examples
• How can the jury avoid– Convicting an innocent person?– Freeing a guilty person?
• Is one kind of error worse than another?– What does the instruction, “Innocent unless the evidence
proves guilt beyond a reasonable doubt,” suggest abouthow our system, in theory, balances the two?
DECISION Innocent Guilty
Declare innocent correct decision ERROR
Declare guilty ERROR correct decision
TRUE STATE
Introduction to Hypothesis TestingDecision Examples
• The evidence comes from a painless blood test– PSA <4.0 or less is considered normal, cancer-free– PSA > 4.0 can be caused by infection or by cancer of the
prostrate– Urologists disagree on how much above 4.0 or for how long
above 4.0 the PSA should be to call for a biopsy, and onhow age of the patient should influence the decision
• Note, disagreements are about the decision criterion and therelative costs of the two types of errors
DECISIONNo Prostate
CancerProstate Cancer
Decide no Prostate Cancer
correct decision ERROR
Biopsy ERROR correct decision
TRUE STATE
2
Introduction to Hypothesis Testing
What would you do if you wanted to determine if a twosided coin is fair?
• You’d probably flip it a bunch of times to see if about1/2 the time it’s “heads” and 1/2 the time it’s “tails”.
• You might also set a criteria by which it would beconsidered unfair. For example, you might suggestthat out of 12 flips if there are 9 or more “heads” or“tails” the coin is unfair.
• This scenario is a simple hypothesis test. Using whatis known about probabilities and samplingdistributions, even more precise tests may bedeveloped.
Introduction to Hypothesis Testing
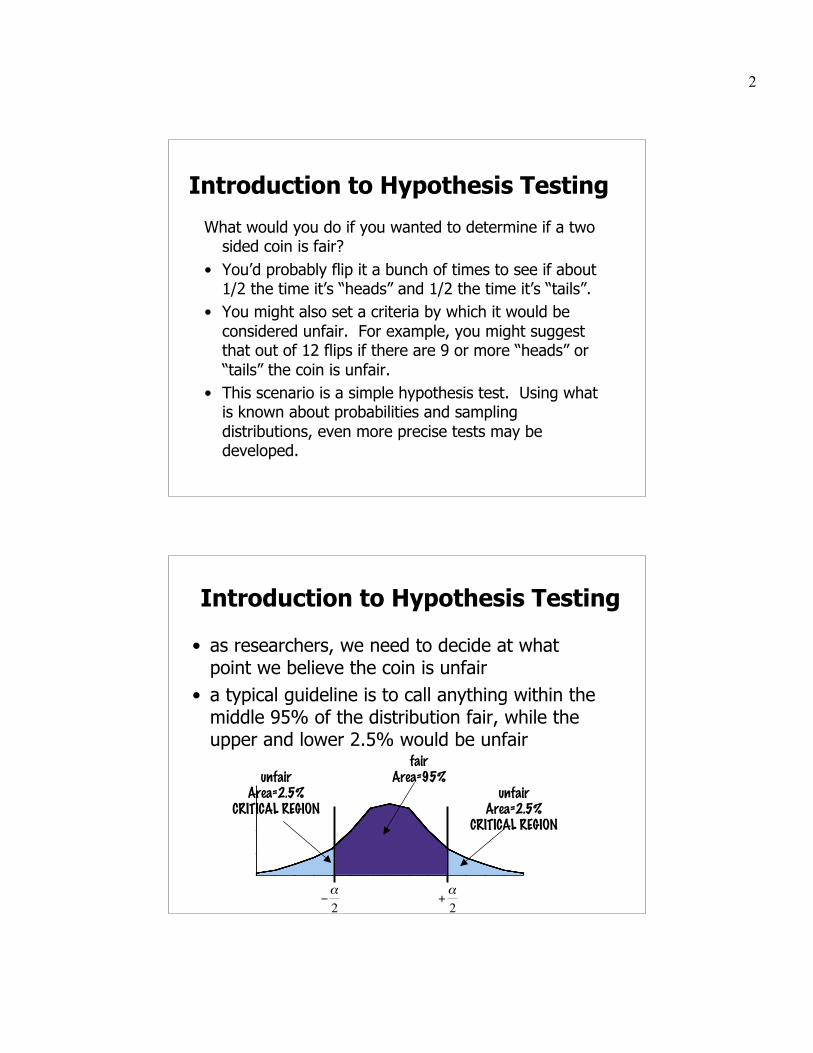
• as researchers, we need to decide at whatpoint we believe the coin is unfair
• a typical guideline is to call anything within themiddle 95% of the distribution fair, while theupper and lower 2.5% would be unfair
0
1
2
3
4unfair
Area=2.5%CRITICAL REGION
0
1
2
3
4
fairArea=95%
unfairArea=2.5%
CRITICAL REGION
€
−α2
€
+α2
3
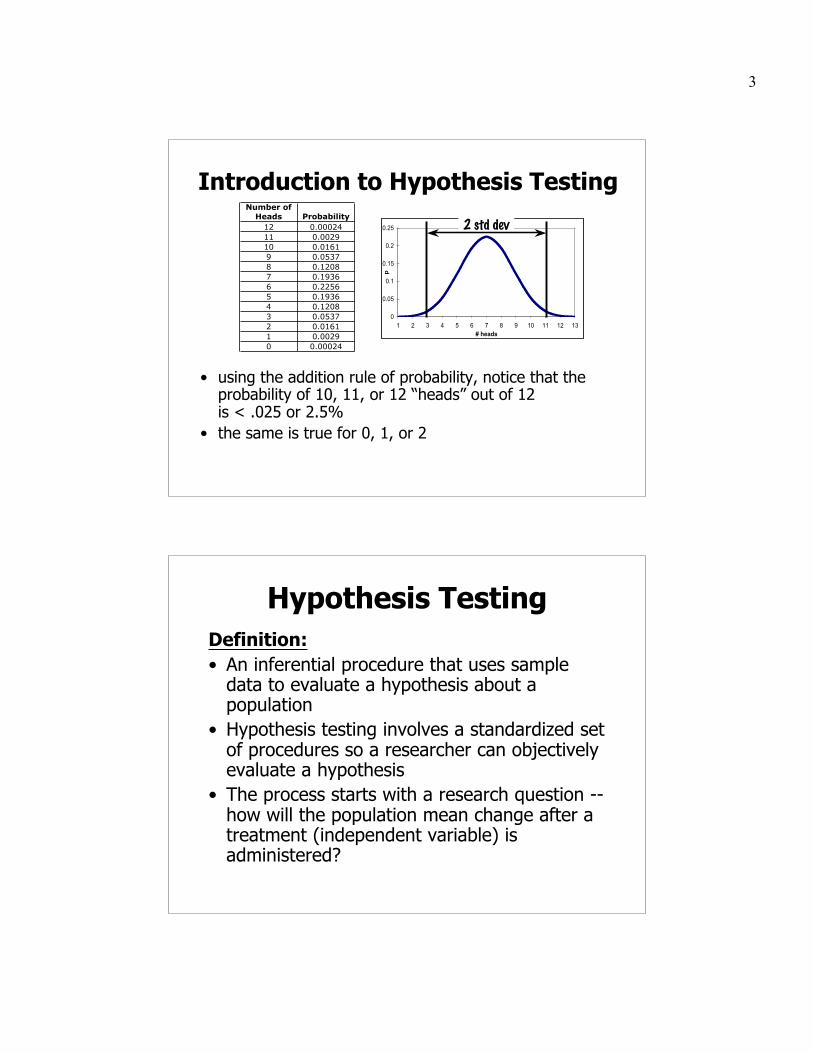
• using the addition rule of probability, notice that theprobability of 10, 11, or 12 “heads” out of 12is < .025 or 2.5%
• the same is true for 0, 1, or 2
Introduction to Hypothesis TestingNumber of
Heads Probability12 0.0002411 0.002910 0.01619 0.05378 0.12087 0.19366 0.22565 0.19364 0.12083 0.05372 0.01611 0.00290 0.00024
0
0.05
0.1
0.15
0.2
0.25
1 2 3 4 5 6 7 8 9 10 11 12 13# heads
p
2 std dev
Hypothesis TestingDefinition:• An inferential procedure that uses sample
data to evaluate a hypothesis about apopulation
• Hypothesis testing involves a standardized setof procedures so a researcher can objectivelyevaluate a hypothesis
• The process starts with a research question --how will the population mean change after atreatment (independent variable) isadministered?

4
Hypothesis Testing: The Steps
1. State the hypotheses: null & alternative2. Set the criterion3. Obtain sample data4. Calculate the test statistic5. Decided to reject or fail to reject the
null hypothesis and interpret yourdecision
1. State the hypotheses• the null hypothesis, H0 , is always the hypothesis
that states that there is no treatment effect, nochange, no difference, etc.
• the alternative hypothesis, H1 , states that therewas a treatment effect, usually in terms of theindependent variable, I.V., having an effect on thedependent variable, D.V.
hypothesis are always stated in terms of populations
remember, even though samples are used, the goalof inferential statistics is to make statements aboutthe population of interest
5
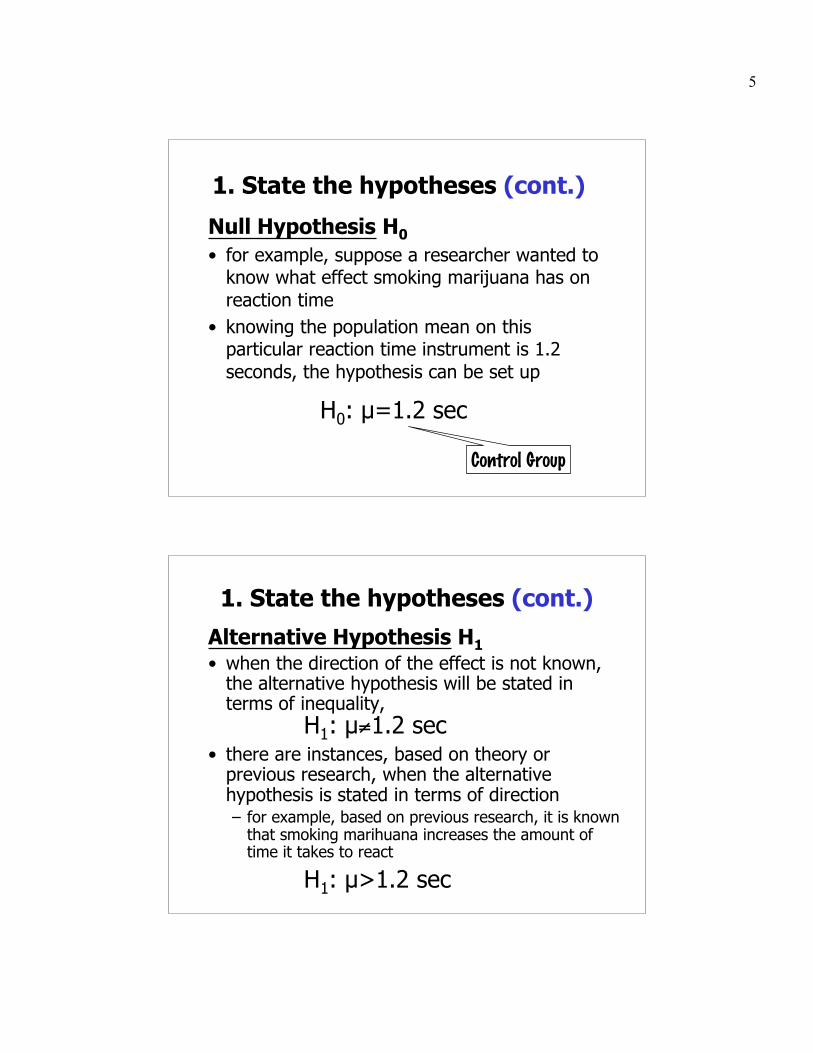
1. State the hypotheses (cont.)
Null Hypothesis H0
• for example, suppose a researcher wanted toknow what effect smoking marijuana has onreaction time
• knowing the population mean on thisparticular reaction time instrument is 1.2seconds, the hypothesis can be set up
H0: µ=1.2 sec
Control Group
1. State the hypotheses (cont.)
Alternative Hypothesis H1• when the direction of the effect is not known,
the alternative hypothesis will be stated interms of inequality, H1: µ≠1.2 sec
• there are instances, based on theory orprevious research, when the alternativehypothesis is stated in terms of direction– for example, based on previous research, it is known
that smoking marihuana increases the amount oftime it takes to react
H1: µ>1.2 sec

6
1. State the hypotheses (cont.)
• notice in the previous example that thenull hypothesis, H0 , still maintainsequality
• this should always be the case• therefore,
H0: µ=1.2 secH1: µ>1.2 sec
2. Set the criterion
• referring back to the example of flipping thecoin, setting the criterion, α, is the statisticalequivalent of deciding “at what point is thecoin unfair”
• as was already mentioned, the middle 95% isusually considered “fair”
• in this example, the remaining 5% would beconsidered error, therefore the criterion is
α=0.05
0
1
2
3
4
Area=2.5%
0
1
2
3
4 Area=95%
Area=2.5%
€
−α2
€
+α2

7
2. Set the criterion (cont.)
• The criterion, α, is also known as Type IError
• Type I error is defined as the probabilityof rejecting a true null hypothesis– that is to say, if the null hypothesis is true
and we reject it, there is a predeterminedchance (usually a 5%) that we are wrong
• errors will be discussed in detail later on
2. Set the criterion (cont.)
• The criterion delimits what is called the critical region• The critical region is defined as the extreme scores in a
distribution where the probability of obtaining them is< α when the null hypothesis is true
0
1
2
3
4
CriticalRegion
0
1
2
3
4
CriticalRegion
€
−α2
€
+α2
0
1
2
3
4
Two-Tailed Test
0
1
2
3
4
CriticalRegion
€
+α2
One-Tailed Test
8
2. Set the criterion (cont.)
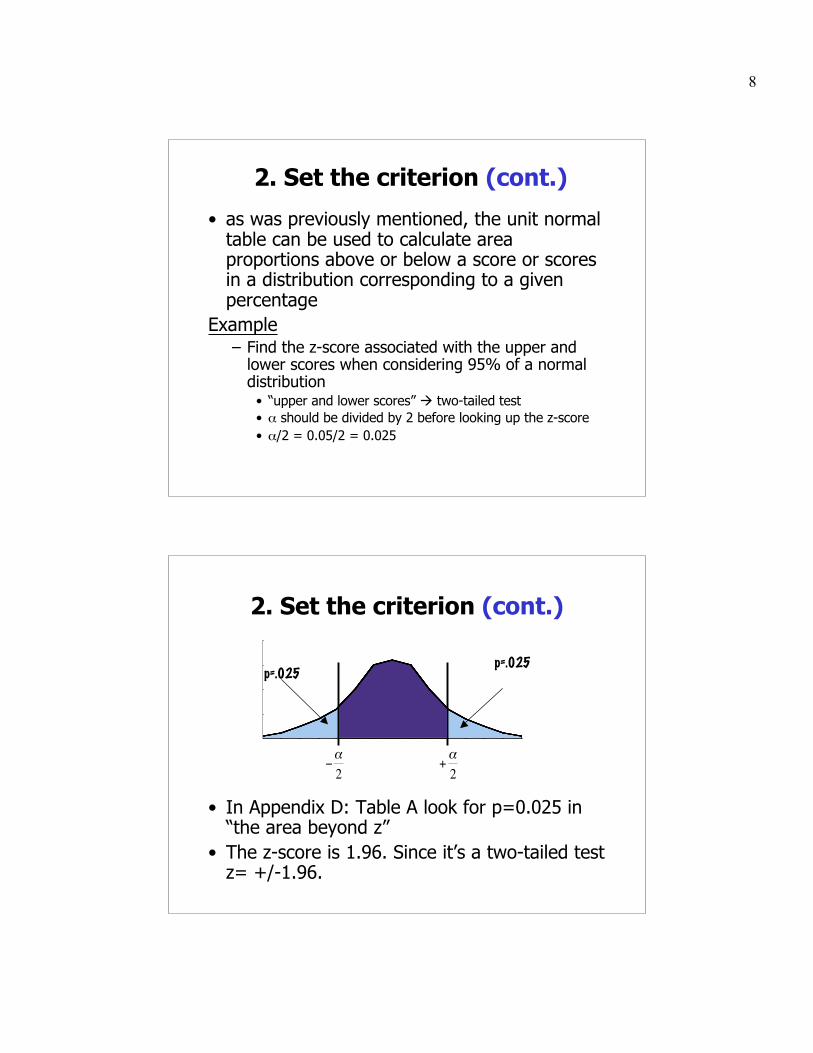
• as was previously mentioned, the unit normaltable can be used to calculate areaproportions above or below a score or scoresin a distribution corresponding to a givenpercentage
Example– Find the z-score associated with the upper and
lower scores when considering 95% of a normaldistribution
• “upper and lower scores” two-tailed test• α should be divided by 2 before looking up the z-score• α/2 = 0.05/2 = 0.025
2. Set the criterion (cont.)
• In Appendix D: Table A look for p=0.025 in“the area beyond z”
• The z-score is 1.96. Since it’s a two-tailed testz= +/-1.96.
0
1
2
3
4
p=.025
0
1
2
3
4
p=.025
€
−α2
€
+α2

9
4. Obtain Sample Data
• After manipulating as per yourhypothesis, collect sample data
• Use descriptive statistics to see howyour data looks like
4. Calculate the test statistic
• one of the challenges you will face isdeciding which test statistic to use
• you will learn what each one is used foras the class progresses

10
5. Decide to reject or fail to reject
• if the test statistic falls in thecritical region, the nullhypothesis is rejected
• if the test statistic does not fallin the critical region, the nullhypothesis is NOT rejected
0
1
2
3
4
0
1
2
3
4test
statistic
€
−α2
€
+α2
0
1
2
3
4
0
1
2
3
4test
statistic
€
−α2
€
+α2
Notice that no statements are made about the alternative hypothesis
Caveat:• hypothesis testing does not “prove” anything• this is particularly true of the alternative
hypothesis• the reason probability statements are not
made about the alternative hypothesis, isthat there still might be other alternativehypothesis– comments such as “supports the theory” and
“provide evidence to suggest” are common waysof describing research findings
11
Example:Suppose I am interested in determiningwhether or not review sessions have anyeffect on exam performance. I willadminister the independent variable, a reviewsession, to a sample of students in anattempt to determine if this has an effect onthe dependent variable, exam performance.Based on information gathered in previoussemesters, I know that the population meanfor a given exam is 24.
Step 1: State the hypotheses• A researcher always states two opposing
hypotheses
NULL HYPOTHESIS:– States that the treatment has no effect (there is
no change, no difference, nothing happened).– The null hypothesis is always written as Ho.
Example:– H0: µ=24 (Even with the review session, the
mean exam score is 24)– µ represents the hypothesized population mean
for students having review sessions

12
Step 1: State the hypotheses (cont)
ALTERNATIVE HYPOTHESIS: Predicts that theindependent variable will have an effect on thedependent variable (this is the hypothesis theresearcher “roots” for
– The alternative hypothesis is written as H1 or HA.We’ll use H1.
Example:– H1: µ≠24– µ represents the hypothesized population mean
for students having review sessions. The truepopulation mean for these students may be higheror lower than 24
Step 1: State the hypotheses (cont)Hypotheses:
• H0: µ=24• H1: µ≠24
– The task is to choose between these twohypotheses
– The null hypothesis is the hypothesis that isactually tested (we can only test one distributionat at time)
– The null hypothesis states that the mean for thereview population will be 24 -- the same as theuntreated, previous population
13
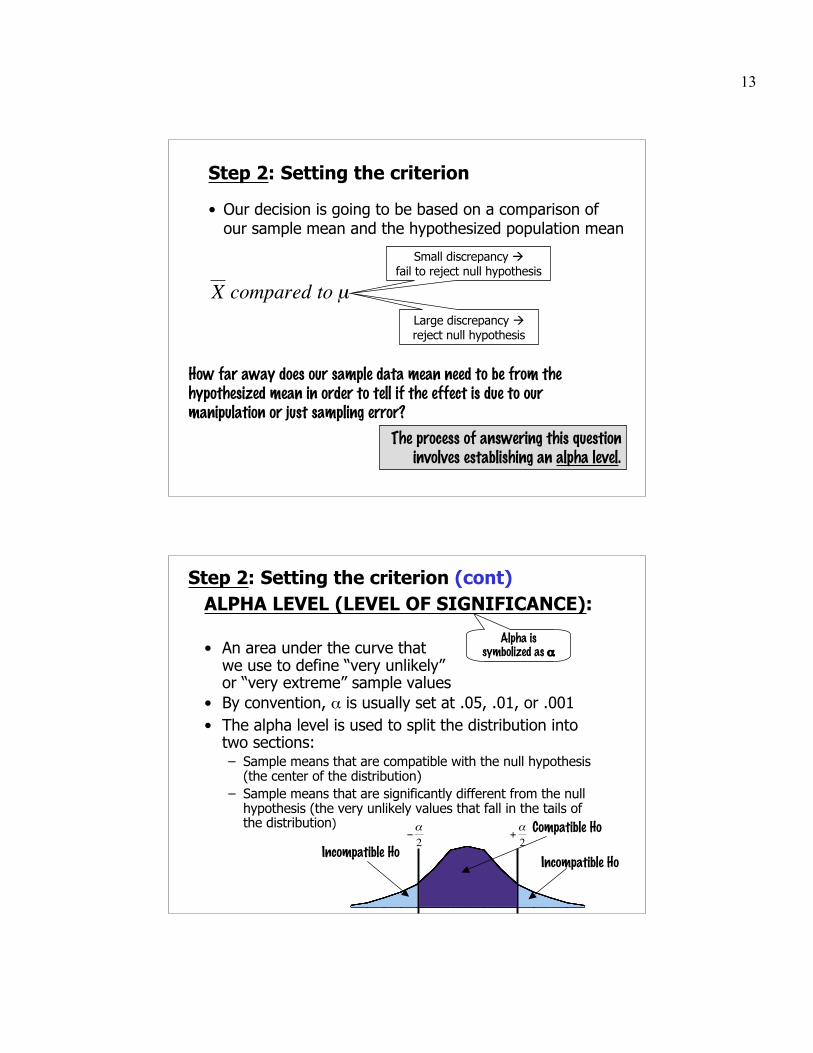
Step 2: Setting the criterion
How far away does our sample data mean need to be from thehypothesized mean in order to tell if the effect is due to ourmanipulation or just sampling error?
• Our decision is going to be based on a comparison ofour sample mean and the hypothesized population mean
€
X compared to µLarge discrepancy reject null hypothesis
Small discrepancy fail to reject null hypothesis
The process of answering this questioninvolves establishing an alpha level.
0
1
2
3
4
Incompatible Ho
Compatible Ho
Incompatible Ho
€
−α2
€
+α2
0
1
2
3
4
ALPHA LEVEL (LEVEL OF SIGNIFICANCE):
• An area under the curve thatwe use to define “very unlikely”or “very extreme” sample values
• By convention, α is usually set at .05, .01, or .001• The alpha level is used to split the distribution into
two sections:– Sample means that are compatible with the null hypothesis
(the center of the distribution)– Sample means that are significantly different from the null
hypothesis (the very unlikely values that fall in the tails ofthe distribution)
Alpha issymbolized as α
Step 2: Setting the criterion (cont)
14
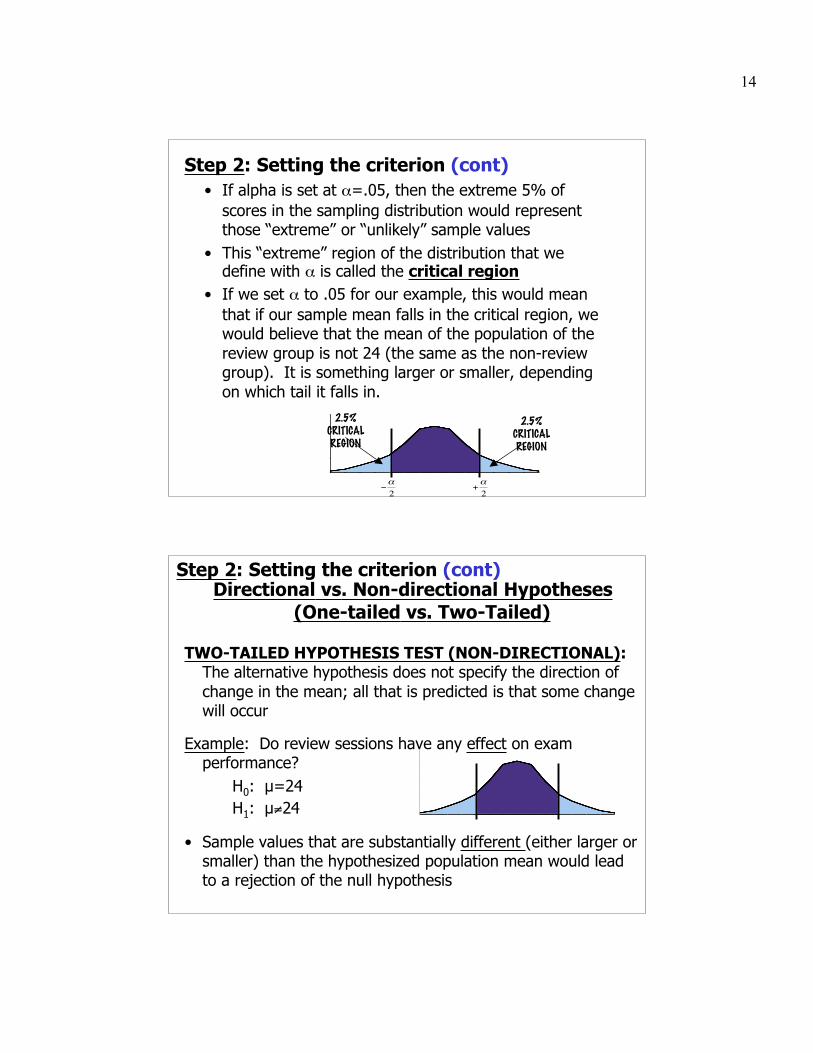
• If alpha is set at α=.05, then the extreme 5% ofscores in the sampling distribution would representthose “extreme” or “unlikely” sample values
• This “extreme” region of the distribution that wedefine with α is called the critical region
• If we set α to .05 for our example, this would meanthat if our sample mean falls in the critical region, wewould believe that the mean of the population of thereview group is not 24 (the same as the non-reviewgroup). It is something larger or smaller, dependingon which tail it falls in.
0
1
2
3
4 2.5%CRITICALREGION
0
1
2
3
42.5%
CRITICALREGION
€
−α2
€
+α2
Step 2: Setting the criterion (cont)
0
1
2
3
4
0
1
2
3
4
Directional vs. Non-directional Hypotheses(One-tailed vs. Two-Tailed)
TWO-TAILED HYPOTHESIS TEST (NON-DIRECTIONAL):The alternative hypothesis does not specify the direction ofchange in the mean; all that is predicted is that some changewill occur
Example: Do review sessions have any effect on examperformance?
H0: µ=24H1: µ≠24
• Sample values that are substantially different (either larger orsmaller) than the hypothesized population mean would leadto a rejection of the null hypothesis
Step 2: Setting the criterion (cont)
15
0
1
2
3
4
0
1
2
3
4
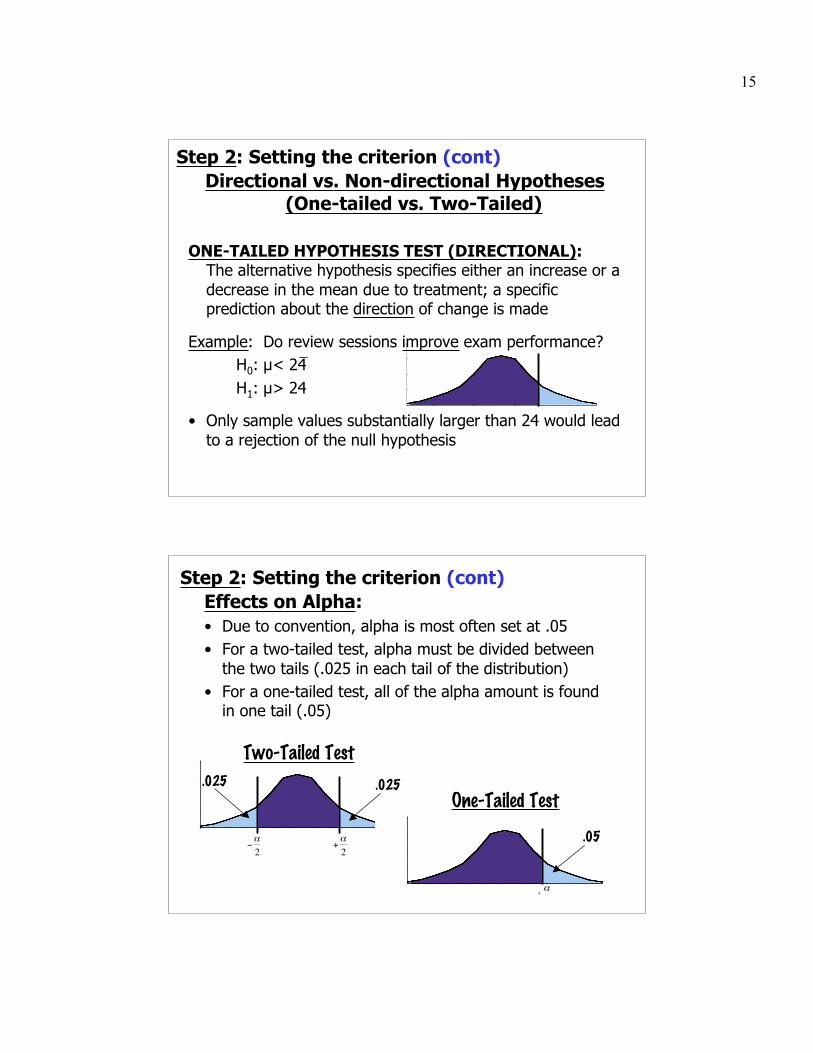
Directional vs. Non-directional Hypotheses(One-tailed vs. Two-Tailed)
ONE-TAILED HYPOTHESIS TEST (DIRECTIONAL):The alternative hypothesis specifies either an increase or adecrease in the mean due to treatment; a specificprediction about the direction of change is made
Example: Do review sessions improve exam performance?H0: µ< 24H1: µ> 24
• Only sample values substantially larger than 24 would leadto a rejection of the null hypothesis
Step 2: Setting the criterion (cont)
Effects on Alpha:• Due to convention, alpha is most often set at .05• For a two-tailed test, alpha must be divided between
the two tails (.025 in each tail of the distribution)• For a one-tailed test, all of the alpha amount is found
in one tail (.05)
0
1
2
3
4
.025
0
1
2
3
4
.025
€
−α2
€
+α2
0
1
2
3
4
Two-Tailed Test
0
1
2
3
4
.05
€
+α2
One-Tailed Test
Step 2: Setting the criterion (cont)
16
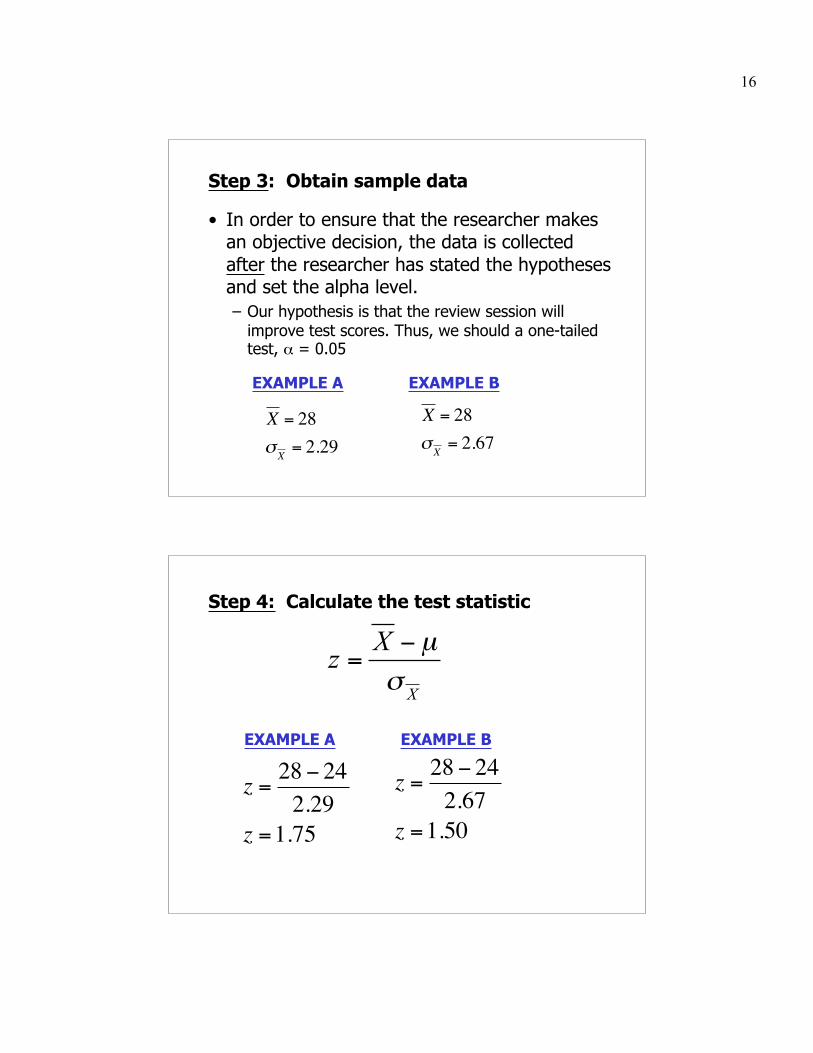
Step 3: Obtain sample data
• In order to ensure that the researcher makesan objective decision, the data is collectedafter the researcher has stated the hypothesesand set the alpha level.– Our hypothesis is that the review session will
improve test scores. Thus, we should a one-tailedtest, α = 0.05
EXAMPLE A EXAMPLE B
€
X = 28σX = 2.67
€
X = 28σX = 2.29
Step 4: Calculate the test statistic
X
Xz
σµ−
=
EXAMPLE A EXAMPLE B
€
z =28 − 242.29
z =1.75
€
z =28 − 242.67
z =1.50

17
Step 5: Evaluate the null hypothesis• In the final step, you compare your sample
data to the null hypothesis and make adecision
• There are 2 possible decisions:1. Reject the null hypothesis: if our sample
mean is substantially different from what thenull hypothesis predicts (if the sample meanfalls in the critical region)
2. Fail to reject the null hypothesis: if oursample mean is not substantially differentfrom the null hypothesis (does not fall in thecritical region)
1) Reject the null hypothesis:– The sample mean provides evidence that the
treatment had an effect– Findings are considered statistically significant
when the null hypothesis is rejected
EXAMPLE A
In Appendix D:Table A, lookup what the p value is forz=1.75
• Which column should you look at, B or C?• Is the p value less or greater than alpha?• Did the treatment have an effect?• Was it statistically significant?
Step 5: Evaluate the null hypothesis (cont)
18
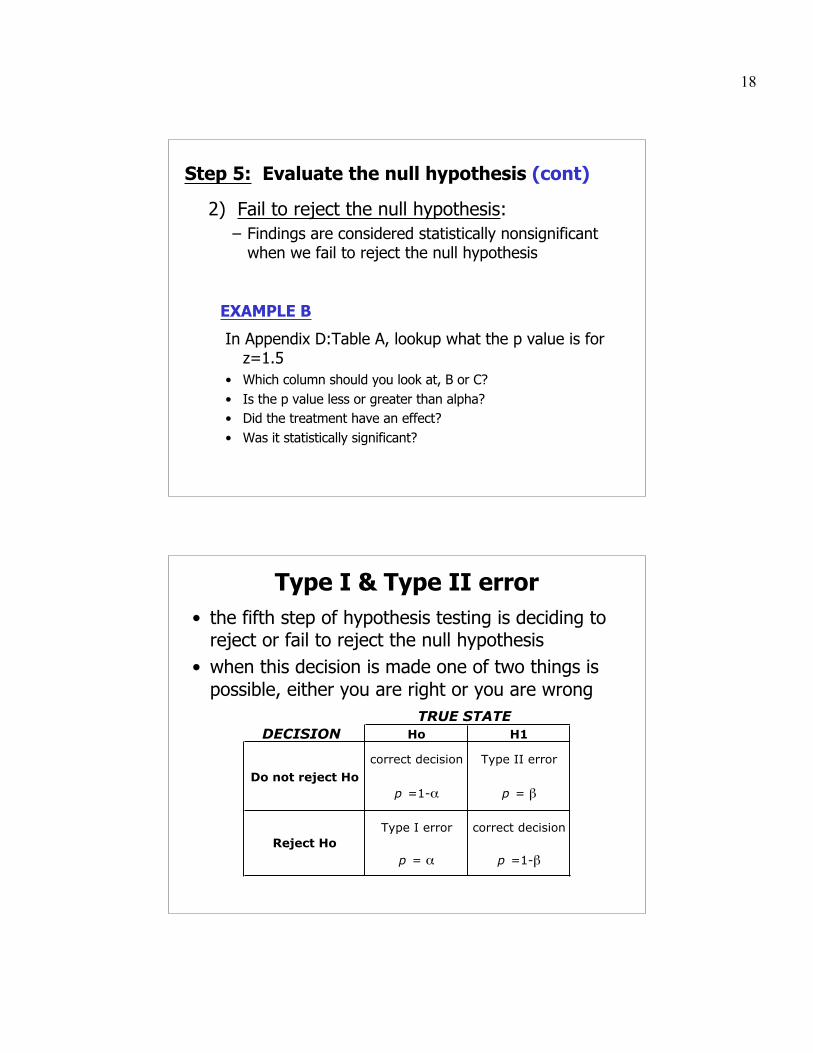
2) Fail to reject the null hypothesis:– Findings are considered statistically nonsignificant
when we fail to reject the null hypothesis
EXAMPLE B
In Appendix D:Table A, lookup what the p value is forz=1.5
• Which column should you look at, B or C?• Is the p value less or greater than alpha?• Did the treatment have an effect?• Was it statistically significant?
Step 5: Evaluate the null hypothesis (cont)
Type I & Type II error• the fifth step of hypothesis testing is deciding to
reject or fail to reject the null hypothesis• when this decision is made one of two things is
possible, either you are right or you are wrong
DECISION Ho H1
correct decision Type II error
p =1-α p = β
Type I error correct decision
p = α p =1-β
TRUE STATE
Do not reject Ho
Reject Ho
19
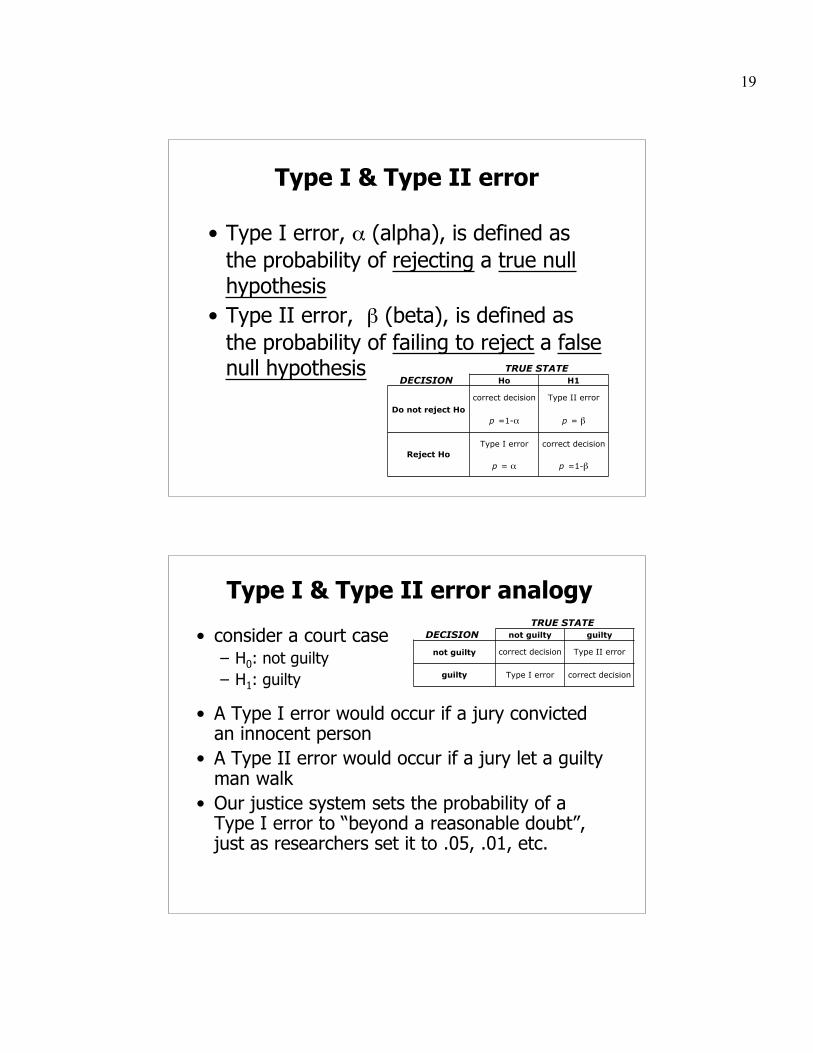
Type I & Type II error
• Type I error, α (alpha), is defined asthe probability of rejecting a true nullhypothesis
• Type II error, β (beta), is defined asthe probability of failing to reject a falsenull hypothesis
DECISION Ho H1
correct decision Type II error
p =1-α p = β
Type I error correct decision
p = α p =1-β
TRUE STATE
Do not reject Ho
Reject Ho
Type I & Type II error analogy
• consider a court case– H0: not guilty– H1: guilty
• A Type I error would occur if a jury convictedan innocent person
• A Type II error would occur if a jury let a guiltyman walk
• Our justice system sets the probability of aType I error to “beyond a reasonable doubt”,just as researchers set it to .05, .01, etc.
DECISION not guilty guilty
not guilty correct decision Type II error
guilty Type I error correct decision
TRUE STATE
20
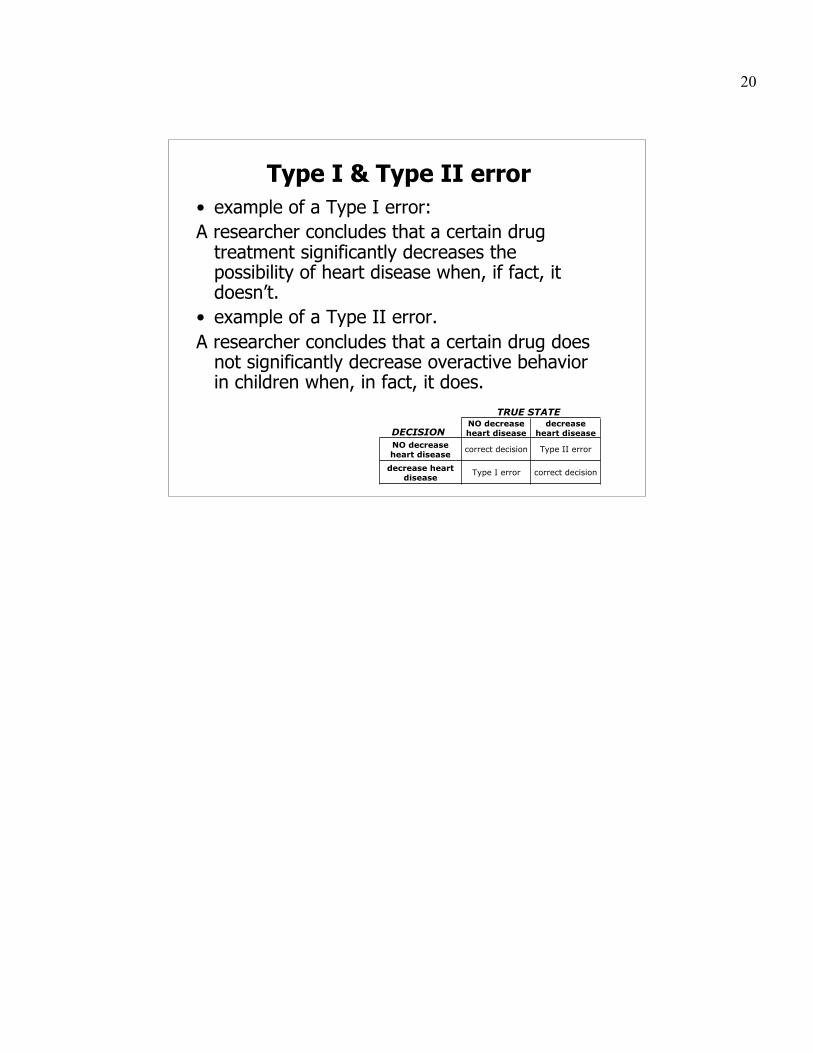
Type I & Type II error• example of a Type I error:A researcher concludes that a certain drug
treatment significantly decreases thepossibility of heart disease when, if fact, itdoesn’t.
• example of a Type II error.A researcher concludes that a certain drug does
not significantly decrease overactive behaviorin children when, in fact, it does.
DECISIONNO decrease heart disease
decrease heart disease
NO decrease heart disease
correct decision Type II error
decrease heart disease
Type I error correct decision
TRUE STATE


