Non-Hierarchical Sequencing Graphs. Algorithmic Graph Theory2.

Introduction to Graphs
2 is a real number, and 3 is a real number. We can take those two numbersand write them as a pair of real numbers: (2, 3). When we write a pair ofreal numbers, the order is important. That is to say that (2, 3) is not thesame pair as (3, 2).Unfortunately, (2, 3) is also the way we write the interval of real numbers
between 2 and 3. We have to try hard to never confuse a pair of numbersfor an interval, but it’s usually clear from the context of a problem whether(2, 3) refers to a pair of numbers or to an interval.
R2 is the set of all pairs of real numbers. So (2, 3) 2 R2, and (3, 2) 2 R2,and (
p2,�7) 2 R2, etc.. Any pair of real numbers is called a point in R2.
Suppose f : A ! B is a function with A ✓ R and B ✓ R. The graph of fis the subset of R2 consisting of all points of the form (a, f(a)).
Examples.
• If f : R ! R is the function f(x) = 5x, then f(3) = 5(3) = 15. Weput 3 in, and got 15 out. That means the point (3, 15) is in the graph of f .Also, f(1) = 5, so (1, 5) is a point in the graph of f , and (2, f(2)) = (2, 10)
is a point in the graph of f as well.
• Suppose g : R ! R is the function where g(x) = x� 2. If you put 2in to g, then 0 comes out. That means the point (2, 0) is in the graph of g.
* * * * * * * * * * * * *
56

Drawing R2
The set R2 is a plane. The first coordinate of a point in R2 measures thehorizontal. The second number measures the vertical.
The set of points in R2 of the form (x, 0) creates a horizontal line calledthe x-axis.
The set of points in R2 of the form (0, y) creates a vertical line called they-axis.
57
Drawing R2
The set R2 is a plane. The first coordinate of a point in R2 measures thehorizontal. The second number measures the vertical.
The set of points in R2 of the form (x, 0) creates a horizontal line calledthe x-axis.
The set of points in R2 of the form (0, y) creates a vertical line called they-axis.
46
Drawing R2
The set R2 is a plane. The first coordinate of a point in R2 measures thehorizontal. The second number measures the vertical.
The set of points in R2 of the form (x, 0) creates a horizontal line calledthe x-axis.
The set of points in R2 of the form (0, y) creates a vertical line called they-axis.
2

Drawing graphsThe graph of a function is a subset of R2. You draw it by marking all of
the points in the graph.
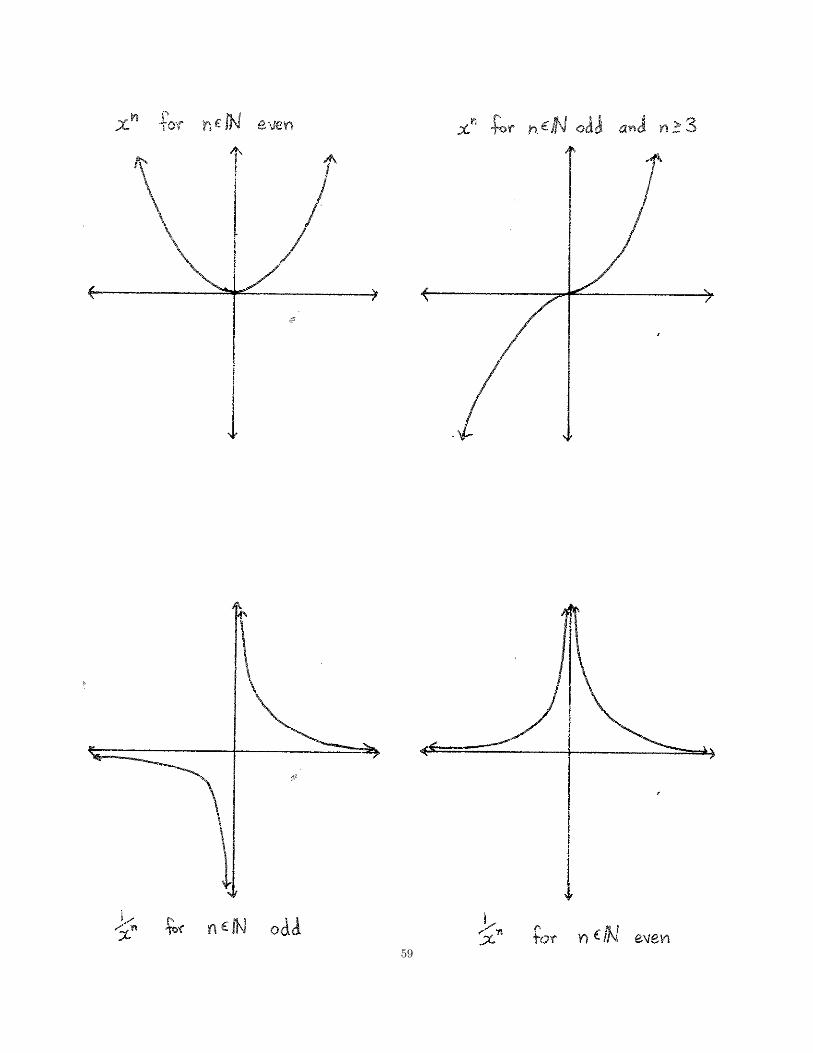
Graphs of important functionsSome functions are important enough in mathematics that you should be
able to draw their graphs quickly (and you will be required to do so onexams). A list of these important functions includes constant functions; theidentity function id; f(x) = x
n for an even n 2 N; f(x) = x
n for n 2 N oddand n � 3 ; f(x) = 1
x
n
for odd n 2 N; and f(x) = 1
x
n
for even n 2 N.
58
Drawing graphsThe graph of a function is a subset of R2. You draw it by marking all of
the points in the graph.
Graphs of important functionsSome functions are important enough in mathematics that you should be
able to draw their graphs quickly (and you will be required to do so onexams). A list of these important functions includes constant functions; theidentity function id; f(x) = xn for an even n ⇥ N; f(x) = xn for n ⇥ N oddand n � 3 ; f(x) = 1
xn for odd n ⇥ N; and f(x) = 1xn for even n ⇥ N.
47
Drawing graphsThe graph of a function is a subset of R2. You draw it by marking all of
the points in the graph.
Graphs of important functionsSome functions are important enough in mathematics that you should be
able to draw their graphs quickly (and you will be required to do so onexams). A list of these important functions includes constant functions; theidentity function id; f(x) = xn for an even n ⇥ N; f(x) = xn for n ⇥ N oddand n � 3 ; f(x) = 1
xn for odd n ⇥ N; and f(x) = 1xn for even n ⇥ N.
3
59
53
48
44

Vertical line testSometimes you’ll see something drawn in R2 that looks like it might be the
graph of a function. To know for sure if it is, use the vertical line test :
If a vertical line intersects a thing in more than one point, thenthat thing is not a graph of a function.
The reason such a thing is not a graph of a function, is because if a verticalline intersects it in two di↵erent points, then the thing would include twodi↵erent points with the same first coordinate – for example, (1, 4) and (1, 9).This could not be the graph of a function, because if it were, then the functionwould assign two di↵erent numbers — 4 and 9 — to the same object of thedomain — 1. Functions can’t do that.
Example. A circle is not the graph of a function. It fails the vertical linetest.
60
Vertical line testSometimes you’ll see something drawn in R2 that looks like it might be the
graph of a function. To know for sure if it is, use the vertical line test :
If a vertical line intersects a thing in more than one point, thenthe thing is not a graph.
The reason such a thing is not a graph, is because if a vertical line intersectsit in two di�erent points, then the thing would include two di�erent pointswith the same first coordinate – for example, (1, 4) and (1, 9). This couldnot be the graph of a function, because if it were, then the function wouldassign two di�erent numbers – 4 and 9 – to the same object of the domain –1. Functions can’t do that.
Example. A circle is not the graph of a function. It fails the vertical linetest.
49
Vertical line testSometimes you’ll see something drawn in R2 that looks like it might be the
graph of a function. To know for sure if it is, use the vertical line test :
If a vertical line intersects a thing in more than one point, thenthe thing is not a graph.
The reason such a thing is not a graph, is because if a vertical line intersectsit in two di�erent points, then the thing would include two di�erent pointswith the same first coordinate – for example, (1, 4) and (1, 9). This couldnot be the graph of a function, because if it were, then the function wouldassign two di�erent numbers – 4 and 9 – to the same object of the domain –1. Functions can’t do that.
Example. A circle is not the graph of a function. It fails the vertical linetest.
5

InterceptsIf the graph of a function contains a point of the form (a, 0) for some a 2 R,
then a is called an x-intercept of the graph.
If the graph of a function contains a point of the form (0, b) for some b 2 R,then b is called the y-intercept of the graph.
Example. Below is the graph of a function f . The x-intercepts of the graphare 2 and �2. The y-intercept of the graph is 3.
* * * * * * * * * * * * *
61
InterceptsIf the graph of a function contains a point of the form (a, 0) for some a ⇥ R,
then a is called an x-intercept of the graph.
If the graph of a function contains a point of the form (0, b) for some b ⇥ R,then b is called the y-intercept of the graph.
Example. Below is the graph of a function f . The x-intercepts of the graphare 2 and �2. The y-intercept of the graph is 3.
* * * * * * * * * * * * *
50
InterceptsIf the graph of a function contains a point of the form (a, 0) for some a ⇥ R,
then a is called an x-intercept of the graph.
If the graph of a function contains a point of the form (0, b) for some b ⇥ R,then b is called the y-intercept of the graph.
Example. Below is the graph of a function f . The x-intercepts of the graphare 2 and �2. The y-intercept of the graph is 3.
* * * * * * * * * * * * *
6

Little circles vs. giant dotsDrawing a giant dot in a graph means that point is in the graph of the
function.Drawing a little circle in a graph means that point is not in the graph of
the function, but some nearby points are.
Example. Below is the graph of the function f : [1, 4) ! R wheref(x) = x+2. The number 1 is in the domain of f , and f(1) = 3, so the point(1, 3) is in the graph of f . We can label it with a giant dot.The number 4 is not in the domain of f , but some numbers really close to
4 are. If 4 was in the domain, then f(4) = 6, and (4, 6) would be a point inthe graph of f . But 4 isn’t in the domain, so (4, 6) isn’t a point in the graphof f . The graph does go all the way up to the point (4, 6), but it doesn’tinclude the point (4, 6). So we label the point (4, 6) with a little circle toremind us that it’s not actually in the graph.
Example. Below is the graph of the function g : R� {2} ! R whereg(x) = 4. Since 2 is not in the domain of g, the point (2, 4) is not in thegraph of g, so we label it with a little circle to remind us that it’s not in thegraph.
62
Little circles vs. giant dotsDrawing a giant dot in a graph means that point is in the graph of the
function.Drawing a little circle in a graph means that point is not in the graph of
the function, but some nearby points are.
Example. Below is the graph of the function f : [1, 4)⇥ R wheref(x) = x+2. The number 1 is in the domain of f , and f(1) = 3, so the point(1, 3) is in the graph of f . We can label it with a giant dot.
The number 4 is not in the domain of f , but some numbers really close to4 are. If 4 was in the domain, then f(4) = 6, and (4, 6) would be a point inthe graph of f . But 4 isn’t in the domain, so (4, 6) isn’t a point in the graphof f . The graph does go all the way up to the point (4, 6), but it doesn’tinclude the point (4, 6). So we label the point (4, 6) with a little circle toremind us that it’s not actually in the graph.
Example. Below is the graph of the function g : R� {2}⇥ R whereg(x) = 4. Since 2 is not in the domain of g, the point (2, 4) is not in thegraph of g, so we label it with a little circle to remind us that it’s not in thegraph.
51
Little circles vs. giant dotsDrawing a giant dot in a graph means that point is in the graph of the
function.Drawing a little circle in a graph means that point is not in the graph of
the function, but some nearby points are.
Example. Below is the graph of the function f : [1, 4) ⇥ R wheref(x) = x+2. The number 1 is in the domain of f , and f(1) = 3, so the point(1, 3) is in the graph of f . We can label it with a giant dot.The number 4 is not in the domain of f , but some numbers really close to
4 are. If 4 was in the domain, then f(4) = 6, and (4, 6) would be a point inthe graph of f . But 4 isn’t in the domain, so (4, 6) isn’t a point in the graphof f . The graph does go all the way up to the point (4, 6), but it doesn’tinclude the point (4, 6). So we label the point (4, 6) with a little circle toremind us that it’s not actually in the graph.
Example. Below is the graph of the function g : R� {2} ⇥ R whereg(x) = 4. Since 2 is not in the domain of g, the point (2, 4) is not in thegraph of g, so we label it with a little circle to remind us that it’s not in thegraph.
7
Little circles vs. giant dotsDrawing a giant dot in a graph means that point is in the graph of the
function.Drawing a little circle in a graph means that point is not in the graph of
the function, but some nearby points are.
Example. Below is the graph of the function f : [1, 4)⇥ R wheref(x) = x+2. The number 1 is in the domain of f , and f(1) = 3, so the point(1, 3) is in the graph of f . We can label it with a giant dot.
The number 4 is not in the domain of f , but some numbers really close to4 are. If 4 was in the domain, then f(4) = 6, and (4, 6) would be a point inthe graph of f . But 4 isn’t in the domain, so (4, 6) isn’t a point in the graphof f . The graph does go all the way up to the point (4, 6), but it doesn’tinclude the point (4, 6). So we label the point (4, 6) with a little circle toremind us that it’s not actually in the graph.
Example. Below is the graph of the function g : R� {2}⇥ R whereg(x) = 4. Since 2 is not in the domain of g, the point (2, 4) is not in thegraph of g, so we label it with a little circle to remind us that it’s not in thegraph.
51
Little circles vs. giant dotsDrawing a giant dot in a graph means that point is in the graph of the
function.Drawing a little circle in a graph means that point is not in the graph of
the function, but some nearby points are.
Example. Below is the graph of the function f : [1, 4) ⇥ R wheref(x) = x+2. The number 1 is in the domain of f , and f(1) = 3, so the point(1, 3) is in the graph of f . We can label it with a giant dot.The number 4 is not in the domain of f , but some numbers really close to
4 are. If 4 was in the domain, then f(4) = 6, and (4, 6) would be a point inthe graph of f . But 4 isn’t in the domain, so (4, 6) isn’t a point in the graphof f . The graph does go all the way up to the point (4, 6), but it doesn’tinclude the point (4, 6). So we label the point (4, 6) with a little circle toremind us that it’s not actually in the graph.
Example. Below is the graph of the function g : R� {2} ⇥ R whereg(x) = 4. Since 2 is not in the domain of g, the point (2, 4) is not in thegraph of g, so we label it with a little circle to remind us that it’s not in thegraph.
7
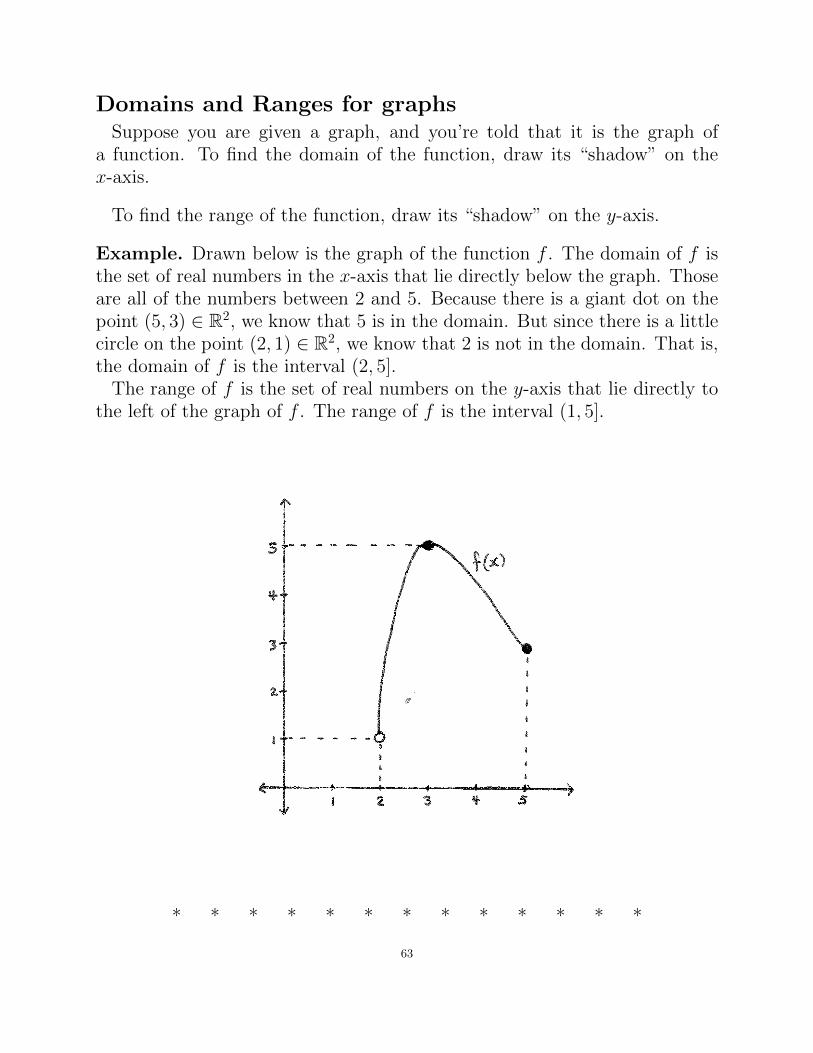
Domains and Ranges for graphsSuppose you are given a graph, and you’re told that it is the graph of
a function. To find the domain of the function, draw its “shadow” on thex-axis.
To find the range of the function, draw its “shadow” on the y-axis.
Example. Drawn below is the graph of the function f . The domain of f isthe set of real numbers in the x-axis that lie directly below the graph. Thoseare all of the numbers between 2 and 5. Because there is a giant dot on thepoint (5, 3) 2 R2, we know that 5 is in the domain. But since there is a littlecircle on the point (2, 1) 2 R2, we know that 2 is not in the domain. That is,the domain of f is the interval (2, 5].The range of f is the set of real numbers on the y-axis that lie directly to
the left of the graph of f . The range of f is the interval (1, 5].
* * * * * * * * * * * * *
63
Domains and Ranges for graphsSuppose you are given a graph, and you’re told that it is the graph of
a function. To find the domain of the function, draw its “shadow” on thex-axis.
To find the range of the function, draw its “shadow” on the y-axis.
Example. Drawn below is the graph of the function f . The domain of f isthe set of real numbers in the x-axis that lie directly below the graph. Thoseare all of the numbers between 2 and 5. Because there is a giant dot on thepoint (5, 3) � R2, we know that 5 is in the domain. But since there is a littlecircle on the point (2, 1) � R2, we know that 2 is not in the domain. That is,the domain of f is the interval (2, 5].
The range of f is the set of real numbers on the y-axis that lie directly tothe left of the graph of f . The range of f is the interval (1, 5].
* * * * * * * * * * * * *
52
Domains and Ranges for graphsSuppose you are given a graph, and you’re told that it is the graph of
a function. To find the domain of the function, draw its “shadow” on thex-axis.
To find the range of the function, draw its “shadow” on the y-axis.
Example. Drawn below is the graph of the function f . The domain of f isthe set of real numbers in the x-axis that lie directly below the graph. Thoseare all of the numbers between 2 and 5. Because there is a giant dot on thepoint (5, 3) � R2, we know that 5 is in the domain. But since there is a littlecircle on the point (2, 1) � R2, we know that 2 is not in the domain. That is,the domain of f is the interval (2, 5].The range of f is the set of real numbers on the y-axis that lie directly to
the left of the graph of f . The range of f is the interval (1, 5].
* * * * * * * * * * * * *
8
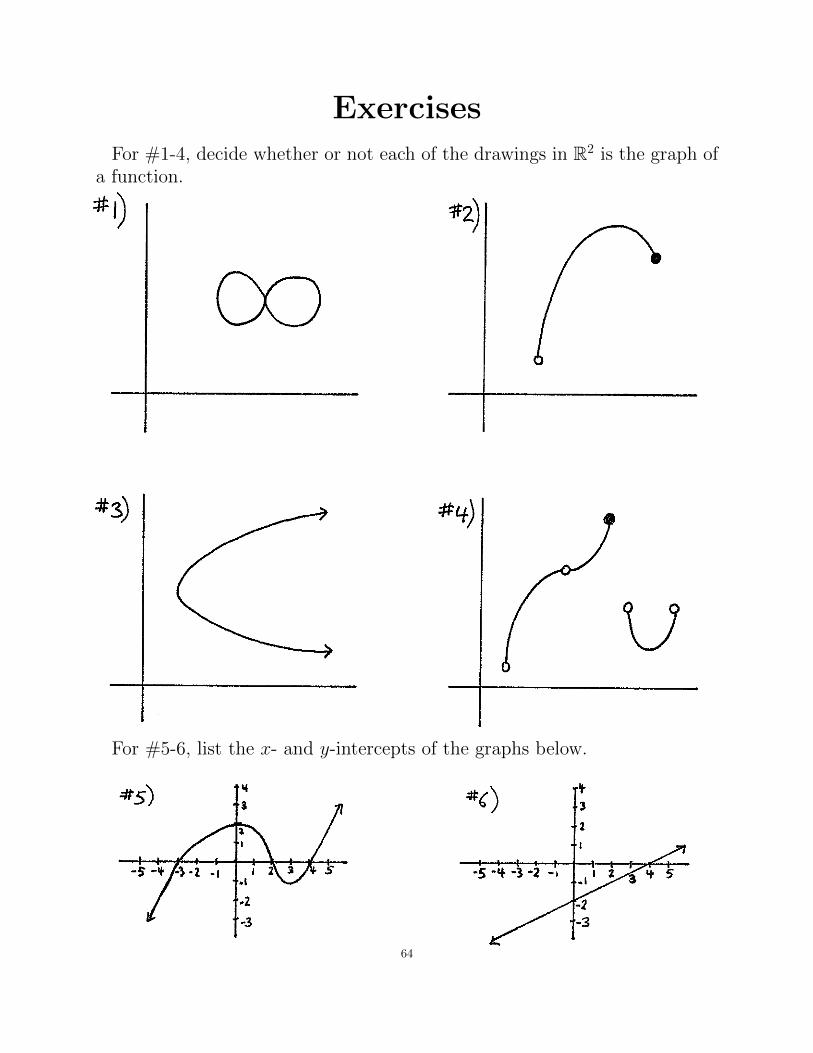
ExercisesFor #1-4, decide whether or not each of the drawings in R2 is the graph of
a function.
For #5-6, list the x- and y-intercepts of the graphs below.
64
ExercisesFor #1-4, decide whether or not each of the drawings in R2 is the graph of
a function.
58
ExercisesFor #1-4, decide whether or not each of the drawings in R2 is the graph of
a function.
53
(S -i~
Exercises~‘tS -z i
For #1-4, decide whether or not each of the drawings in R2 is the graph of
a function.
00
U
#3) 4tq.)
53
(S -i~
Exercises~‘tS -z i
For #1-4, decide whether or not each of the drawings in R2 is the graph of
a function.
00
U
#3) 4tq.)
53
ExercisesFor #1-4, decide whether or not each of the drawings in JR2 is the graph of
a function.
For #5-6, list the z and y-intercepts of the graphs below.
-5-4 4-z 4
32
~i.4—2-3
58

For #7-12, determine the domains and ranges for the functions that aredrawn.
65
For #5-8, determine the domains and ranges for the functions that are
(I-I)
drawn.
*7) (s,q)
(‘i~,z)
(a,’)
49)
(-2,-5)(L,-I)
59
For #5-8, determine the domains and ranges for the functions that are
(I-I)
drawn.
*7) (s,q)
(‘i~,z)
(a,’)
49)
(-2,-5)(L,-I)
59
*i i) #12)
a
S
-a
*i i) #12)
a
S
-a

13.) Write out the product (x+ y)4.
For #14-19, assume that f(x) = x + 1, g(x) = 4, and that h(x) = x
2 � 2.Match each of the numbered functions with one of the lettered formulas.
14.) f � g(x) 15.) g � f(x) 16.) g � h(x)
17.) h � g(x) 18.) f � h(x) 19.) h � f(x)
A.) x2 � 1 B.) x2 + 2x� 1 C.) 4
D.) 5 E.) 14
20.) What is the implied domain of f(x) = 2x2 � 3x+ 7 ?
21.) What is the implied domain of g(x) = 2x
x�8
?
66