Introduction to Flow Cytometry -- BD FACSCanto IItechcomm.lifescience.ntu.edu.tw/TCX/file/FACSCanto...
56
Daisy Kuo Assistant Product Manager E-mail: [email protected] BDBiosciences Introduction to Flow Cytometry -- BD FACSCanto II TM
Transcript of Introduction to Flow Cytometry -- BD FACSCanto IItechcomm.lifescience.ntu.edu.tw/TCX/file/FACSCanto...
Daisy KuoAssistant Product ManagerE-mail: [email protected]
Introduction to Flow Cytometry
-- BD FACSCanto IITM

2
Outline
• Basic Concept of Flow Cytometry
• FACSCanto II System Introduction
• Application Examples
3
What is Flow Cytometry?
• Flow = Fluid• Cyto = Cell• Metry = Measurement
• A variety of measurements are made on cells, cell organelles, and other objects suspended in a liquid and flowing at rates of several thousands per second through a flow chamber.

4
Particle Size
• Detection range: 0.5~50um

5
What Can a Flow Cytometer Tell Us About a Cell?
Its relative size (Forward Scatter—FSC)
Its relative granularity or internal complexity (Side Scatter—SSC)
Its relative fluorescence intensity

6
Scatter Light
FSC Sensor
Laser
SSC Sensor

7
Lysed Whole Blood
Forward Scatter
Sid
e S
catte
r
Lymphocytes
Monocytes
Neutrophils

8
Fluorescence Light

9
Fluorescence
10
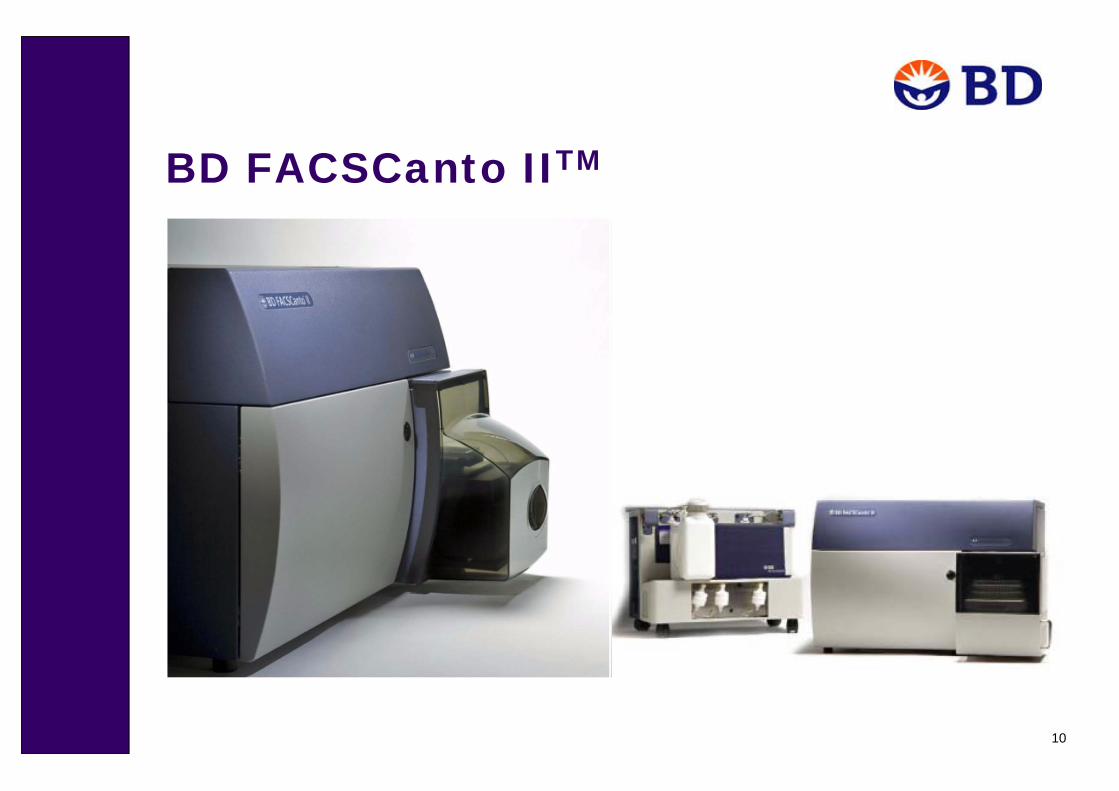
BD FACSCanto IITM

11
Subsystems
FluidicsTo introduce and focus the cells for interrogation.
OpticsTo generate and collect the light signals.
ElectronicsTo convert the optical signals to proportional digital signals, process the signals, and communicate with the computer.

12
sheath sheathsample
Sample Flow
Hydrodynamic Focusing
Excitation Lasers

13
Sample Differential
Sample
High Sample Pressure
120 µL/min
High Differential Pressure
LaminarFlow
Sheath Sheath
LaminarFlow
Low Differential Pressure
Sheath SheathSample
Low Sample Pressure
12 µL/min

14
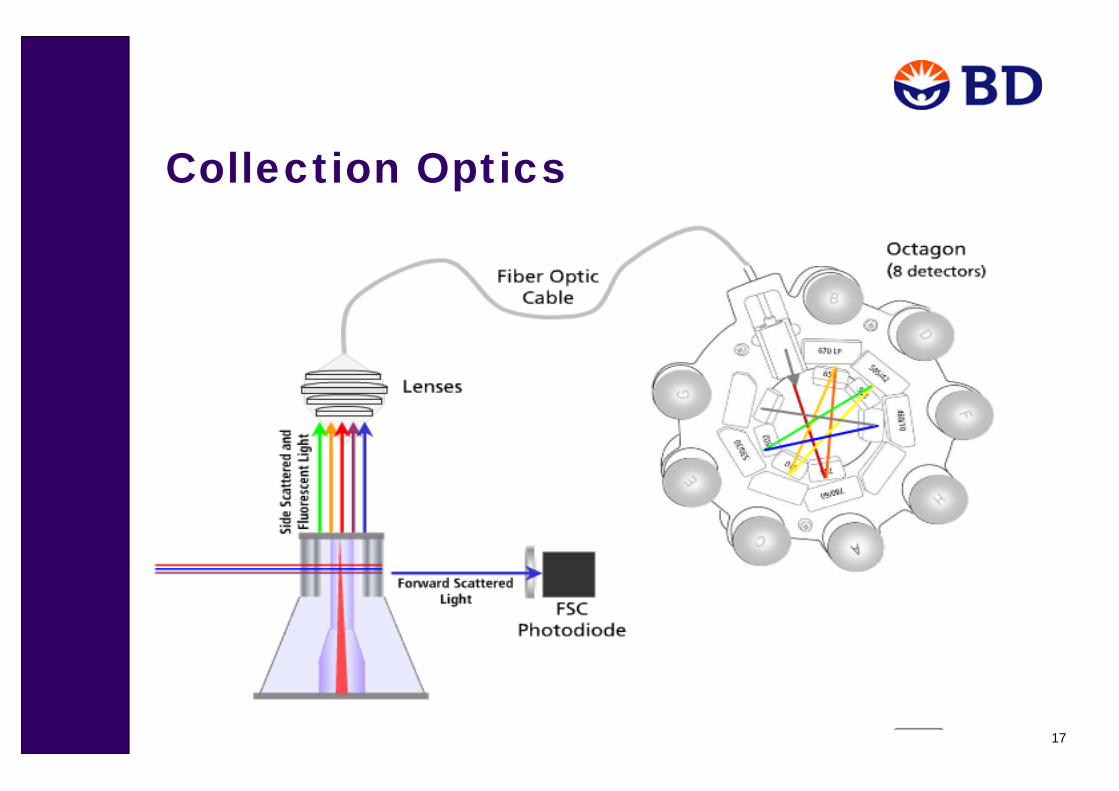
Optics
• Excitation optics– Lasers Lenses to shape and focus the laser beam
• Collection optics– A collection lens to collect light emitted from the
article-laser beam interaction– A system of optical mirrors and filters to route
specified wavelengths of emitted light to designated optical detectors

15
Fluorochrome Spectra

16
Excitation Optics
• Spatially separated laser beams lower the possibility of fluorescence spillover
17
Collection Optics

18
Optics-- ConfigurationOther Fluorochrome
GFP
PI
PI, PE-Cy5.5, 7-AAD
Alexa Fluor® 633
DAPI, Hoechst Dye
Cascade Blue®

19
PMTs and preamps convert photons to voltage pulses.
Analog-to-digital converters translate analog signals to proportional digital signals.
Compute area and height for each pulse.
Perform compensation and calculate ratios and width.
An embedded computer interfaces with the computer workstation for data transfer.
Electronics

20
Creation of a Voltage Pulse
Laser
Time (µs)
Volts
Pul
se H
eigh
t
Pulse Width

21
Analog-to-Digital Converter
Baseline
16,364
Time
937
1,985
7,650
12,420
Hei
ght
351
383
375
406
377
318
367
319
375
423
432
937
1985
7650
1242
015
300
1325
657
9124
7184
243
333
131
130
837
634
941
482
313
7390
351
433
841
830
731
735
331
370
340
337
830
840
640
530
335
340
532
8
Digitized values

22
Quantification of a Voltage Pulse

23
Doublet Discrimination

24
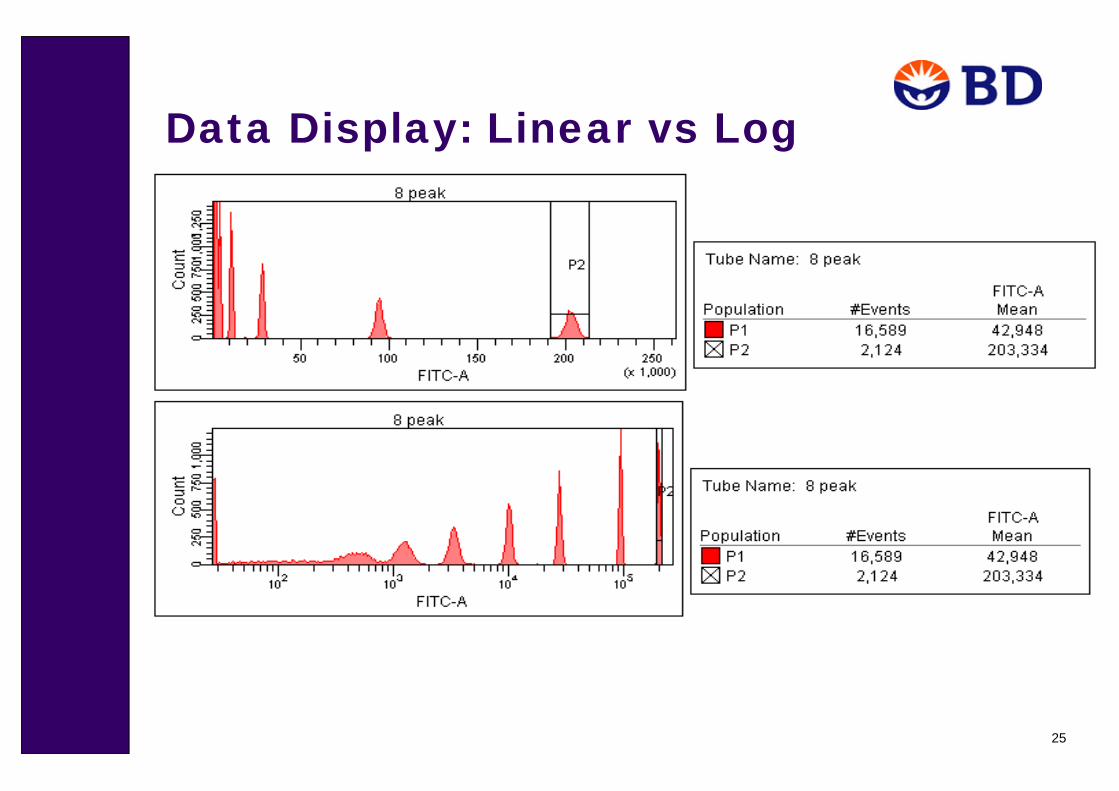
39,27139,271
Data Storage
Event 1Event 2Event 3
FSC SSC FITC PE0 60 120 89
10 160 65
30 650 160
List-Mode Data
39,271
89
675 30,621PE
FITC
675Time
PEFI
TC
39,271
22,688
30,621
6,189
25
Data Display: Linear vs Log

26
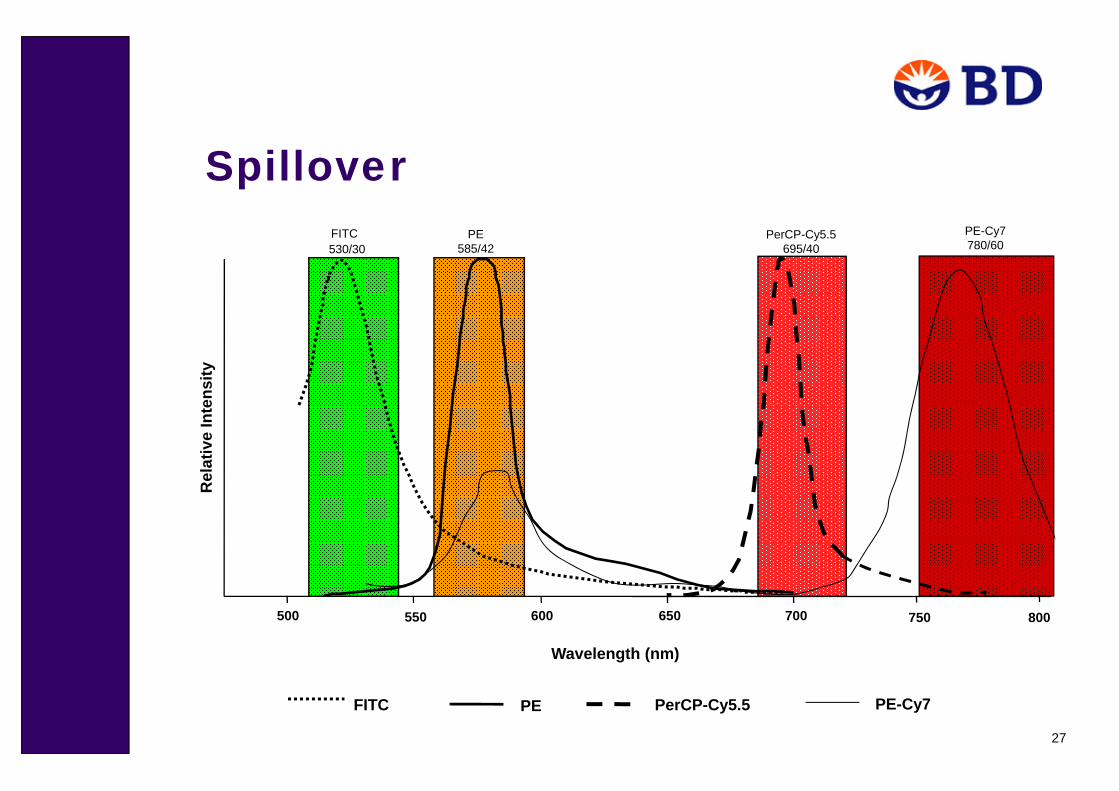
Spectral Overlap– Compensation Theory
APC PerCPPI
Wavelength (nm)400 500 600 700
100%
0%
Pacific Blue
Nor
mal
ized
Inte
nsity
FITC PEAmCyan PerCP-Cy5.5
800
PE-Cy7
27
Spillover
FITC PE PerCP-Cy5.5
650 700
PerCP-Cy5.5695/40
500 600
FITC530/30
Rel
ativ
e In
tens
ity
Wavelength (nm)
550
PE585/42
PE-Cy7
PE-Cy7780/60
750 800

28
FITC Spillover
650 700
PerCP-Cy5.5695/40
500 600
FITC530/30
Rel
ativ
e In
tens
ity
Wavelength (nm)
550
PE585/42
750 800
FITC
FITC
PEP
erC
P-C
y5.5

29
650 700
PerCP-Cy5.5695/40
500 600
FITC530/30
Rel
ativ
e In
tens
ity
Wavelength (nm)550
PE585/42
FITC CompensationTo lower cluster, increase value.
FITC FITC
FITC
Per
CP
-Cy5
.5
FITC
Per
CP
-Cy5
.5
PE-%FITC
PerCP-Cy5.5-%FITC

30
Compensation Examples
Correct Compensation Undercompensation Overcompensation
Incorrect Compensation

31
Review
Time
Time
Time
Time
Time
Data Processing
PE
FITC
SS
C
FSC
AP
C
PerCP-Cy5.5
Time

ApplicationExamples

33
Applications
• Phenotype Analysis (Cell Surface Antigens/Markers)• Intracellular Analysis
-- Eg. Cytokines, Signal Transduction molecules…etc.
• DNA Analysis-- Eg. Viability, Cell cycle, Apoptosis…etc.
• Cell Fuction Analysis-- Eg. Free radicals, Ca2+, Reporter genes…etc.
• CBA (Cytometric Bead Array)• Others

34
• Ligand• Receptor• Adhesion molecule• …etc
Phenotype Analysis

35
Lymphocyte Immunophenotyping
Granulocytes
Monocytes
Eosinophils
Basophils
NeutrophilsLymphocytes
T B NK
T Helper
TCytotoxic
Peripheral White Blood CellsCD45+
CD3+
CD4+ CD3+
CD8+
CD3+
CD3-
CD19+
CD3-
CD16+
CD56+
Monocytes

36

37
Permeabilizing solution
• Cytokine• Enzyme• signal transduction
molecule• …etc.
Intracellular Analysis
Fixation solution
38
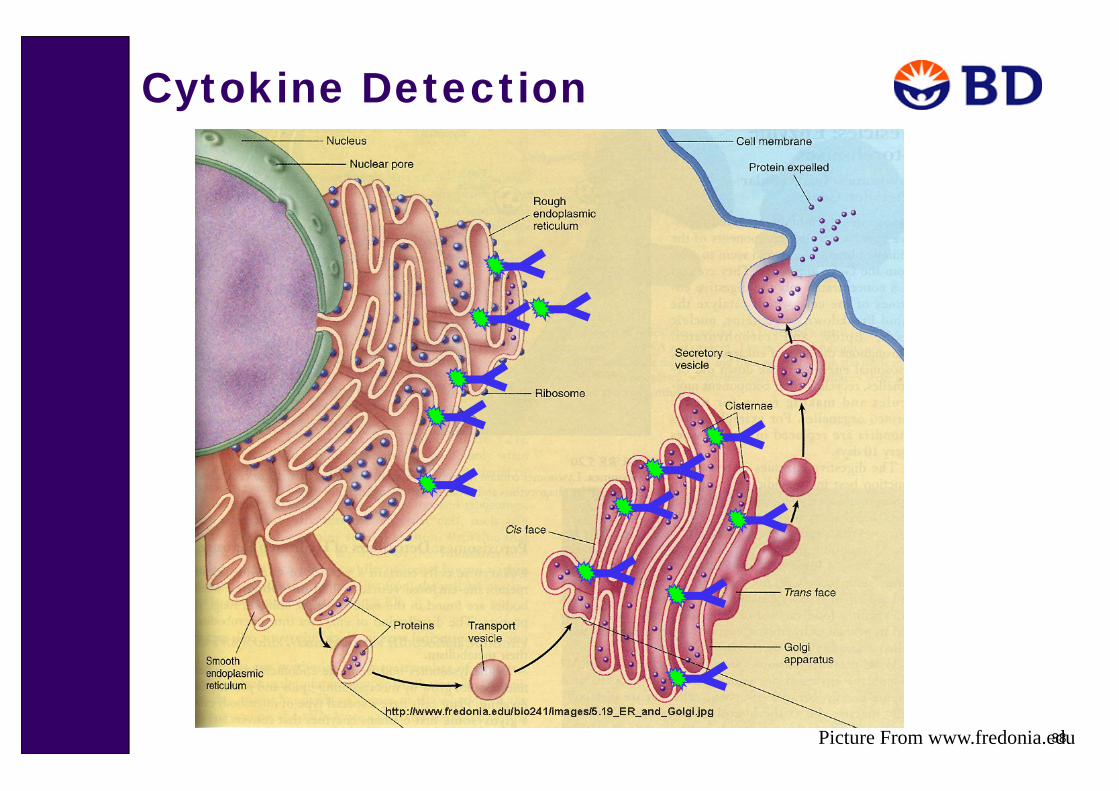
Cytokine Detection
Picture From www.fredonia.edu
39
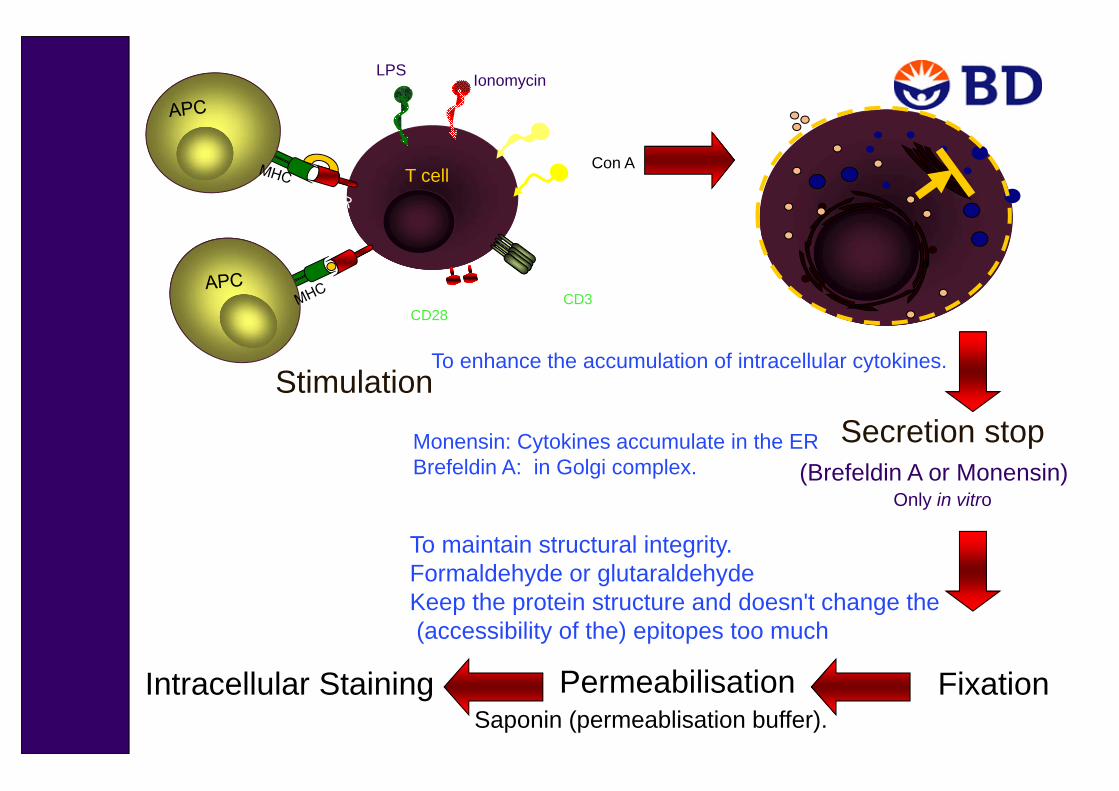
CD3CD28
PHA
Con A
IonomycinLPS
T cell
Stimulation
Fixation
Secretion stop(Brefeldin A or Monensin)
Only in vitro
PermeabilisationIntracellular Staining
To enhance the accumulation of intracellular cytokines.
Monensin: Cytokines accumulate in the ERBrefeldin A: in Golgi complex.
To maintain structural integrity.Formaldehyde or glutaraldehydeKeep the protein structure and doesn't change the(accessibility of the) epitopes too much
Saponin (permeablisation buffer).

40
Combination of Cell Surface and Cytoplasmic Staining
Th1/Th2/Th17 Phenotyping Kit

41
Signal Transduction

42
Intracellular Staining in Activated Lysed Whole Blood

43
DNA Analysis
Detergent
Nucleic Acid Dye
Ethanol

44
G2M G0
G1
s
0 200 400 600 800 1000
G0G1
s G2 M
DNA content
Count
2N 4N
Cell Cycle Analysis

45
Apoptosis (Sub G1)

46
• Membrane Potential (DiOC6, JC-1)
• Oxidative Metabolism (Free Radicals)
• Intracellular PH Value (Snarf-1)
• Ca++ Influx (Fluo-4/Fura Red, Indo-1)
• Phagocytosis
• Cell Proliferation (PI, BrdU, Intracellular Cyclins)
• Apoptosis (Annexin V, active Caspase-3)
Cell Function Analysis

47
C a++ C a++C a++
C a++
Externalization ofphosphatidylserine
Plasmamembrane
Apoptosis
Cytoplasm Cytoplasm
Annexin V-FITCconjugate
Annexin V Assay

48
Annexin V/PI Double Staining
Bordón et al. Radiation Oncology 2009 4:58

49
Cytometric Beads Array (CBA)
Single StepIncubation
Two-StepIncubation
or

50
Beads Provide a Flexible Platform
Multiple sizes
Different fluorescence
intensities
Different colors with different intensities

51
Advantages of Bead-Based Immunoassays• Analyze multiple analytes simultaneously• Reduced sample volume requirements• Reduced hands-on time by parallel analysis of samples• Wide dynamic range of fluorescence detection (requires
fewer sample dilutions)

52
Proteins MeasuredA. Interleukin (IL)-2B. IL-4C. IL-5D. IL-10E. Tumor Necrosis Factor-F. Interferon-

53
Cytometry Beads Array (CBA)

54
Standard Curves

55
CBA Flex Sets• Open configuration (Up to 30 plex)• Clustering based on Red and NIR fluorescence intensity• Need to be used at dual-laser(488nm blue v.s 633nm red) instrument

56
CBA Functional Beads• Can be conjugated with any Ab