Introduction to Electron Paramagnetic Resonance...
64
EPR Spectroscopy 2016 PSU Bioinorganic Workshop 1 Introduction to Electron Paramagnetic Resonance Spectroscopy Art van der Est, Department of Chemistry, Brock University St. Catharines, Ontario, Canada
Transcript of Introduction to Electron Paramagnetic Resonance...

EPR Spectroscopy
2016 PSU Bioinorganic Workshop 1
Introduction to Electron Paramagnetic Resonance Spectroscopy
Art van der Est, Department of Chemistry, Brock University
St. Catharines, Ontario, Canada

EPR Spectroscopy
2016 PSU Bioinorganic Workshop 2
EPR Spectroscopy
Molecules with all electrons paired have no electron magnetic moment → no EPR spectrum.
Species that can be studied by EPR:
• free radicals
• transition metals with odd numbers of electrons or high spin
• excited states with S≠0 e.g. triplet states
EPR is magnetic resonance on unpaired electrons

EPR Spectroscopy
2016 PSU Bioinorganic Workshop 3
Bioinorganic EPR
• The metals in metalloproteins usually do redox chemistry and are the active sites of the protein.
• The redox states are often paramagnetic.
(two general classes: S = ½, S > ½)
• These states can be studied by EPR
• No background signals from the rest of the protein or sample.
Examples: Iron-sulfur proteins, heme and non-heme iron proteins, iron-nickel proteins, copper proteins

EPR Spectroscopy
• Basics of the EPR experiment
• EPR in proteins at low temperature (S = ½)
• g-anisotropy, single crystals, powder patterns
• The hyperfine interaction
• Couplings between electrons, Zero Field Splitting (S > ½)
• High spin systems and Rhombograms
2016 PSU Bioinorganic Workshop 4
Outline

EPR Spectroscopy
• Hagen (2009) “Biomolecular EPR Spectroscopy”, CRC Press
• Brustolon and Giamello (2008) “Electron Paramagnetic Resonance: A Practitioner's Toolkit” Wiley
• Weil and Bolton (2007) “Electron Paramagnetic Resonance: Elementary Theory and Practical Applications” Wiley
• Golbeck and van der Est (2013) in “Molecular Biophysics for the Life Sciences” Allewell, Narhi and Rayment Eds.
2016 PSU Bioinorganic Workshop 5
References

EPR Spectroscopy
2016 PSU Bioinorganic Workshop 6
Basics of EPR
Electrons have spin angular momentum which generates a magnetic dipole moment .
e–
S
µS
µS = geβe s(s+1)
βe = Bohr magneton ge = free electron g-value s = spin angular momentum quantum number
S
ge = 2.002319 βe = 9.27×10⁻²⁴ J /T
µS

EPR Spectroscopy
2016 PSU Bioinorganic Workshop 7
Ene
rgy
Magnetic field
EPR Experiment
ms = −12
ms =+12
ΔE = hν = geβeB0
geβeh
= 28.02GHz /T
In a magnetic field the spin states are split by the Zeeman interaction. Transitions with are allowed in an EPR experiment.
Δms =±1

EPR Spectroscopy
The resonance frequency for a free electron is about 600 times larger than for a proton in the same magnetic field:
300 MHz 1H NMR → 180 GHz EPR
180 GHz = 6 cm-1 microwave/far infrared
2016 PSU Bioinorganic Workshop 8
Comparison with NMR spectroscopy
Couplings involving electrons are generally much stronger this leads to much broader spectra:
NMR: 1 Hz – 100 kHz
EPR: 1 MHz – several GHz

EPR Spectroscopy
2016 PSU Bioinorganic Workshop 9
Basics of EPR
In atoms and molecules the electrons have both orbital and spin angular momentum. Each of these generates a magnetic dipole moment.
µL = βe l(l +1)
e–
µL
L
S
µS
µS = geβe s(s+1)

EPR Spectroscopy
2016 PSU Bioinorganic Workshop 10
Basics of EPR
The magnetic moment of a bound electron is determined by its total angular momentum
µ = gβe J(J +1)
J
In molecules, the orbital angular momentum is generally quenched.
Some residual orbital angular momentum remains
→ Exact g-value depends on the spin-orbit coupling:
Examples. Cu(II) in Cu(acac)2 g=2.13 Ti(III) ions in solid TiO2 g=1.96
J ≈S, g ≈ ge→

EPR Spectroscopy
2016 PSU Bioinorganic Workshop 11
Choice of Field and Frequency
Commercially available spectrometers:
Frequency (GHz)
Frequency Band Field for g=2.0023 (T)
1.2 L 0.043 2.4 S 0.086 9.5 X 0.34 34 Q 1.2 95 W 3.4
263 mm-band 9.4
X-band spectrometers are by far the most common.

EPR Spectroscopy
2016 PSU Bioinorganic Workshop 12
The EPR Experiment
In an EPR experiment the absorbance is very weak and this method is only feasible at very high magnetic fields.
In most spectroscopic experiments the absorbance is measured as a function of frequency.
source I0 I
Aλ = − log10I(λ)I0 (λ)#
$%
&
'(

EPR Spectroscopy
2016 PSU Bioinorganic Workshop 13
The EPR Experiment
To overcome the problem of weak signals a resonator is used:
• The sample is placed in a resonant cavity such that it sits in the magnetic component of the resonant microwave field
magnetic lines of force
electric lines of force
sample
Many other resonator designs are possible. Each has its advantages

EPR Spectroscopy
2016 PSU Bioinorganic Workshop 14
The EPR Experiment
The microwaves are usually brought to the resonator using a waveguide
Image: Buker ER 4103TM cylindrical mode resonator http://www.bruker.com/typo3temp/pics/e_75d2de1d39.jpg
waveguide
resonator
An “iris” is placed at the entrance to the resonator to couple it.
entrance slit
iris
Hagen “Biomolecular EPR Spectroscopy” Fig. 2.6
EPR Spectroscopy
2016 PSU Bioinorganic Workshop 15
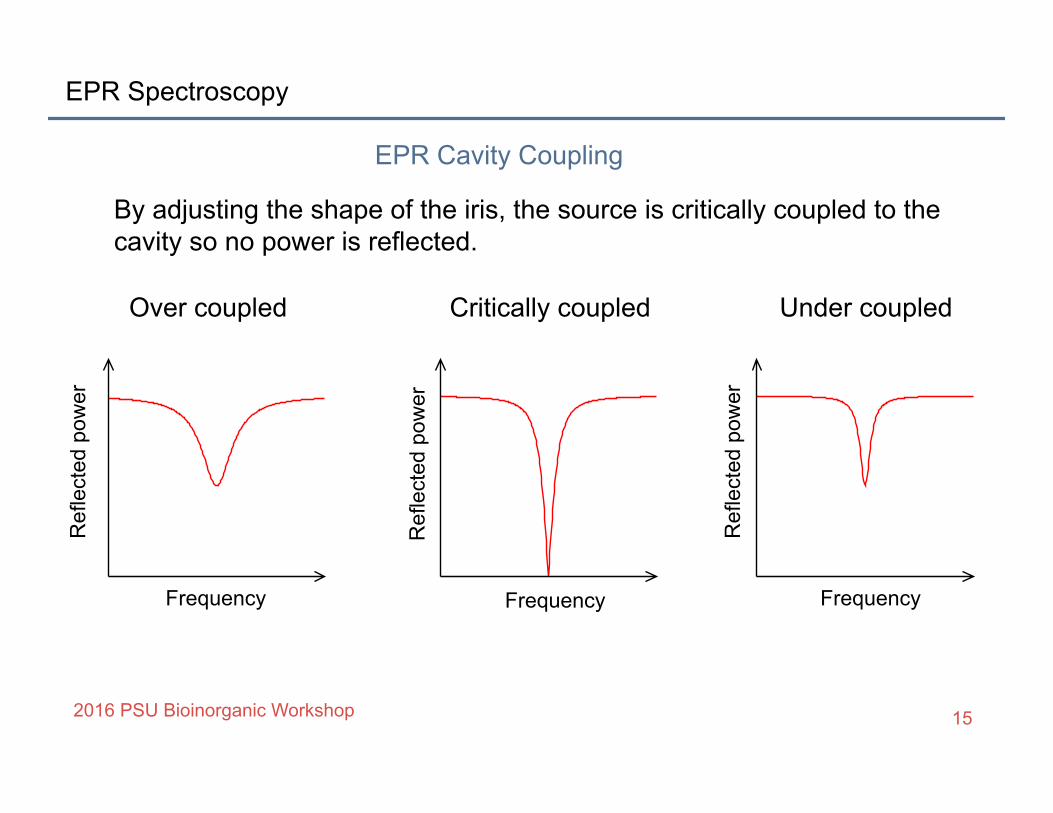
EPR Cavity Coupling
By adjusting the shape of the iris, the source is critically coupled to the cavity so no power is reflected.
Frequency
Ref
lect
ed p
ower
Frequency
Ref
lect
ed p
ower
Frequency
Ref
lect
ed p
ower
Over coupled Critically coupled Under coupled
EPR Spectroscopy
2016 PSU Bioinorganic Workshop 16
The EPR Experiment
• When an EPR transition occurs in the sample, the resonance is disturbed and power is reflected
• The reflected power gives a stronger signal than directly measuring the absorbance of the sample

EPR Spectroscopy
2016 PSU Bioinorganic Workshop 17
EPR Spectrometer
Typical resonator bandwidth: ~1-10 MHz
Spectral width: up to several GHz
Net result: Cannot sweep the frequency.
Therefore EPR spectrometers typically use electromagnets and the microwave absorption is monitored as the field is varied.
Image: Bruker EMX EPR Spectrometer from Physikalische Technische Bundesanstalt http://www.ptb.de/de/org/6/62/624/bilder/apparat03.jpg

EPR Spectroscopy
2016 PSU Bioinorganic Workshop 18
Schematic Diagram of an EPR Spectrometer
Detector
shifterPhase
MicrowaveSource
Circulator
Attenuator
Lock−inamplifier
100 kHzModulation
Preamplifier
Resonator
Magnet
To computer
Microwave bridgeattenuator
Bias

EPR Spectroscopy
2016 PSU Bioinorganic Workshop 19
The modulation coils are placed on the sides of the resonator
Even with a resonator the signals are still very noisy. So a different detection scheme is used.
To improve signal to noise, a small modulation field is added to the main magnetic field
Field modulation technique:
Image: Buker ER 4103TM cylindrical mode resonator http://www.bruker.com/typo3temp/pics/e_75d2de1d39.jpg

EPR Spectroscopy
B0
2016 PSU Bioinorganic Workshop 20
Field modulation technique:
The amplitude of the modulated signal is measured and its phase is compared to a reference signal
absorption line
modulation field
modulated signal

EPR Spectroscopy
2016 PSU Bioinorganic Workshop 21
The amplitude of the modulated signal plotted as the EPR spectrum.
Field modulation technique:
0 B0B
amplitude of modulated signal

EPR Spectroscopy
2016 PSU Bioinorganic Workshop 22
Field modulation technique Two drawbacks: The first derivative of the spectrum is obtained The signal amplitude and shape depends on the modulation amplitude

EPR Spectroscopy
2016 PSU Bioinorganic Workshop 23
Field modulation technique Main advantages: Much better signal to noise Structure of spectrum is emphasized in first derivative
absorption spectrum first derivative
EPR Spectroscopy
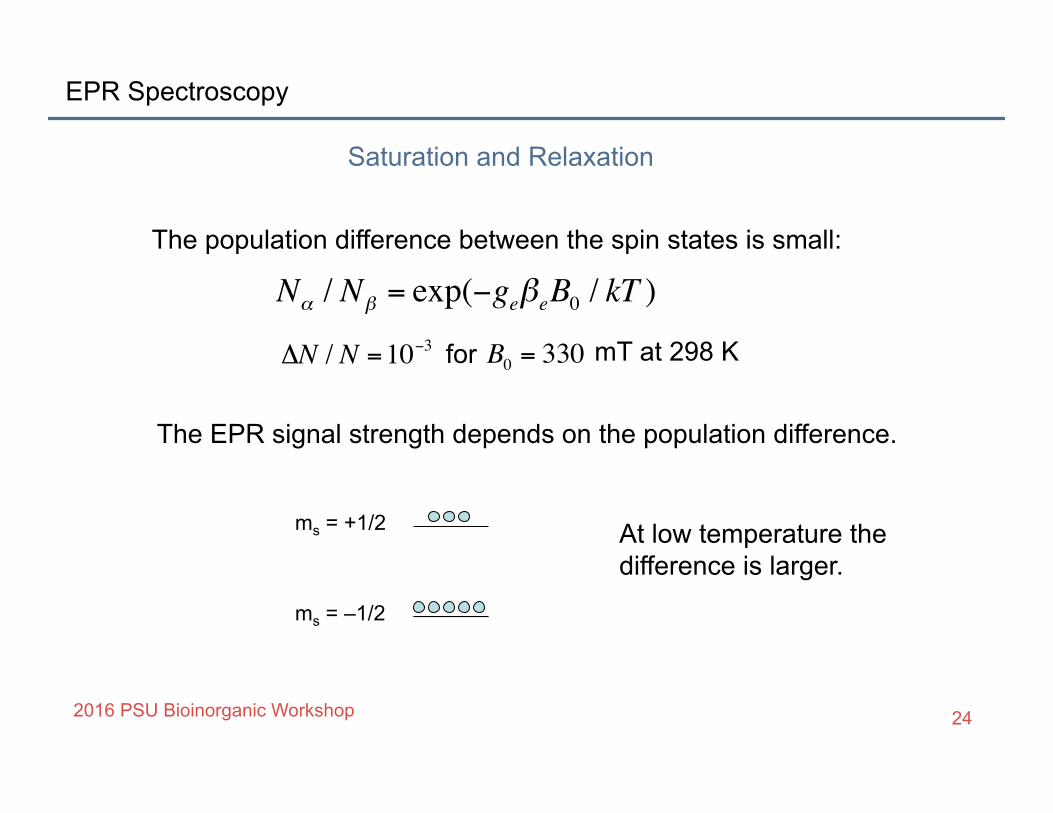
Saturation and Relaxation
2016 PSU Bioinorganic Workshop 24
The population difference between the spin states is small:
Nα / Nβ = exp(−geβeB0 / kT )
The EPR signal strength depends on the population difference.
ΔN / N =10−3 for B0 = 330 mT at 298 K
ms = +1/2
ms = –1/2
At low temperature the difference is larger.

EPR Spectroscopy
Saturation and Relaxation
2016 PSU Bioinorganic Workshop 25
EPR transitions tend to equalize the populations:
microwaves ms = +1/2
ms = –1/2
The population difference is restored by spin relaxation:
relaxation ms = +1/2
ms = –1/2
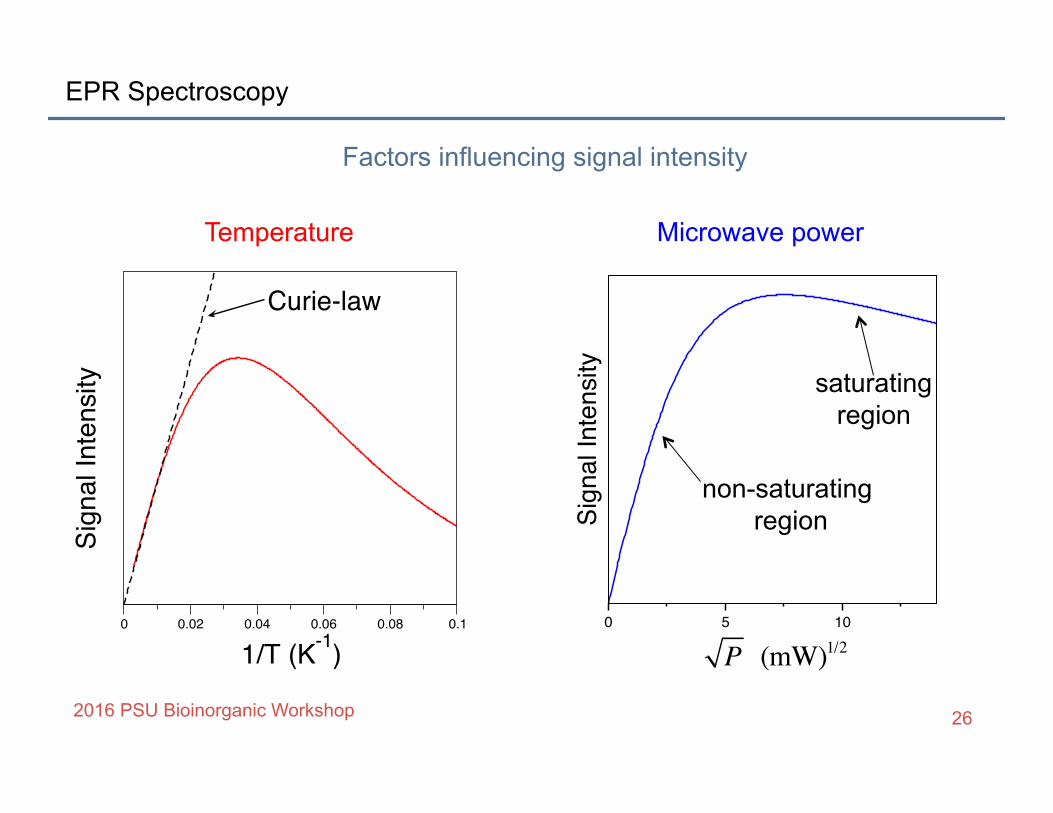
no EPR signal!
EPR Spectroscopy
0 5 10
Sign
al In
tens
ity
2016 PSU Bioinorganic Workshop 26
Factors influencing signal intensity
Temperature
saturating region
non-saturating region
Microwave power
0 0.02 0.04 0.06 0.08 0.1
1/T (K-1)
Sign
al In
tens
ity
Curie-law
P (mW)1/2

EPR Spectroscopy
2016 PSU Bioinorganic Workshop 27
Factors influencing signal intensity
For each sample there is an optimal microwave power and temperature. Metalloproteins are usually measured at low temperature. This means the orientation dependence of the g-values is important.

EPR Spectroscopy
2016 PSU Bioinorganic Workshop 28
The orientation dependence of the spectra can be studied in single crystals
Single crystal EPR
goniometer rod
crystal
magnet θ
crystal axis
magnetic field

EPR Spectroscopy
2016 PSU Bioinorganic Workshop 29
A series of spectra are collected at different orientations …
Single crystal EPR

EPR Spectroscopy
2016 PSU Bioinorganic Workshop 30
The g-values of the lines are fitted to the equation:
Single crystal EPR
geff2 = gaa
2 cos2θ +2gab2 cosθ sinθ + gbb
2 sin2θ
Rotation in 3 independent planes gives values of
gaa2 ,gbb
2 ,gcc2 ,gab
2 ,gac2 ,gbc
2

EPR Spectroscopy
2016 PSU Bioinorganic Workshop 31
The g-tensor is then diagonalized numerically
Single crystal EPR
gxx2 0 0
0 gyy2 0
0 0 gzz2
!
"
####
$
%
&&&&
gaa2 gab
2 gac2
gab2 gbb
2 gbc2
gac2 gbc
2 gcc2
!
"
####
$
%
&&&&
this gives the principal g-values gxx, gyy
and gzz .
The transformation matrix U gives the orientation of the principal axes x,y,z in the crystal axis system a,b,c
The diagonalization is achieved by the transformation:
Ug2U−1 = gdiagonal2

EPR Spectroscopy
2016 PSU Bioinorganic Workshop 32
Example Iron Sulfur Clusters in Photosystem I:
FX
FA
A1
FB
P700
A0
Rotation about c-axis
Kamlowski et al Biochim. Biophys. Acta 1319 (1997) 185–198

EPR Spectroscopy
Example Iron Sulfur Clusters in Photosystem I: mixed valence
Fe(II)/Fe(III) atoms
gzz
gyy
gxx equal valence
Fe(III)/Fe(III) atoms gxx gyy gzz
FA– 1.856 1.941 2.051
FB– 1.880 1.916 2.056
Kamlowski et al Biochim. Biophys. Acta 1319 (1997) 185–198
2016 PSU Bioinorganic Workshop 33

EPR Spectroscopy
2016 PSU Bioinorganic Workshop 34
For any tensorial property, T
Symmetry Terminology
Tensor Elements Term Symmetry Txx=Tyy=Tzz isotropic Tetrahedral or higher Txx=Tyy≠Tzz
or Txx≠Tyy=Tzz
axial 3-fold or higher
rotation axis
Txx≠Tyy≠Tzz rhombic 2-fold rotation or lower

EPR Spectroscopy
2016 PSU Bioinorganic Workshop 35
For randomly oriented samples the spectrum is a sum of all possible orientations.
The principal g-values can be obtained from features in the spectra.
The shape of the spectrum depends on the symmetry of the molecule
Powder Spectra
330 335 340 345Magnetic Field (mT)
rhombic
axial
axial
giso
g||g⊥
g⊥
g||
gxx gyygzz
isotropic

EPR Spectroscopy
2016 PSU Bioinorganic Workshop 36
The g-anisotropy depends on the spin orbit coupling. Perturbation theory gives:
g-Anisotropy
gij = ge +2λψ0 L̂i ψn ψn L̂ j ψ0
En −E0n∑
spin-orbit coupling parameter
mixing of molecular orbitals

EPR Spectroscopy
2016 PSU Bioinorganic Workshop 37
General trends:
• Radicals with light elements e.g. C, H, O, N .
- Weak spin orbit coupling
- Small g-anisotropy and signals near g=2.0023.
• Transition metals
- Moderate to strong spin-orbit coupling
- Larger g-anisotropy
- g-anisotropy depends on the electronic configuration and the symmetry of the ligand field.
g-anisotropy
EPR Spectroscopy
2016 PSU Bioinorganic Workshop 38
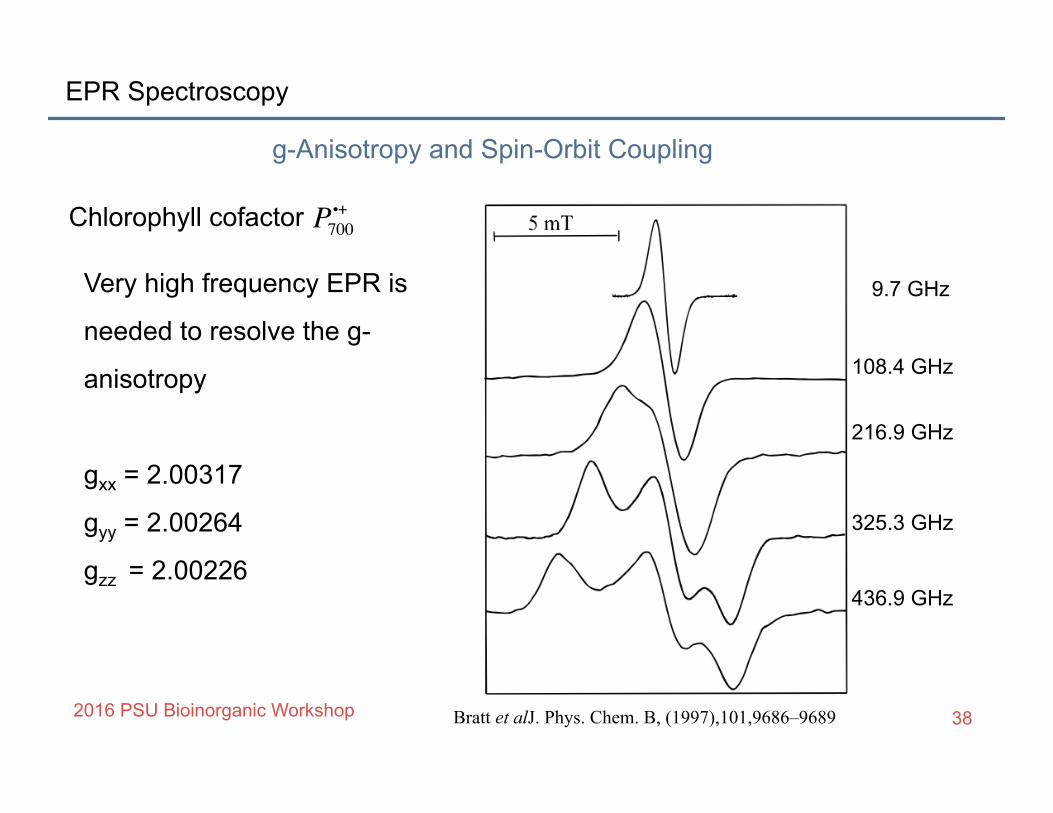
g-Anisotropy and Spin-Orbit Coupling
P700i+
Very high frequency EPR is
needed to resolve the g-
anisotropy
gxx = 2.00317
gyy = 2.00264
gzz = 2.00226
Chlorophyll cofactor
9.7 GHz
108.4 GHz
216.9 GHz
325.3 GHz
436.9 GHz
Bratt et alJ. Phys. Chem. B, (1997),101,9686–9689

EPR Spectroscopy
2016 PSU Bioinorganic Workshop 39
FeS clusters in Photosystem I:
g-Anisotropy and Spin-Orbit Coupling
320 340 360 380 400B0 /mT
*
* * P700
i+FB−* =
Spectra well resolved at X-band (9.5 GHz). Spin-orbit coupling is much stronger because of the metal atoms
FA−

EPR Spectroscopy
Energy level diagram for coupling to a nitrogen nucleus with I = 1
2016 PSU Bioinorganic Workshop 40
Hyperfine coupling
The interaction between the unpaired electron and neighbouring nuclei leads to splitting of the energy levels and the spectrum.
hν
a a
magnetic field
mI1 0
–1
–1 0 1
mI
B0
S=1/2 I =1
EPR Spectroscopy
2016 PSU Bioinorganic Workshop 41
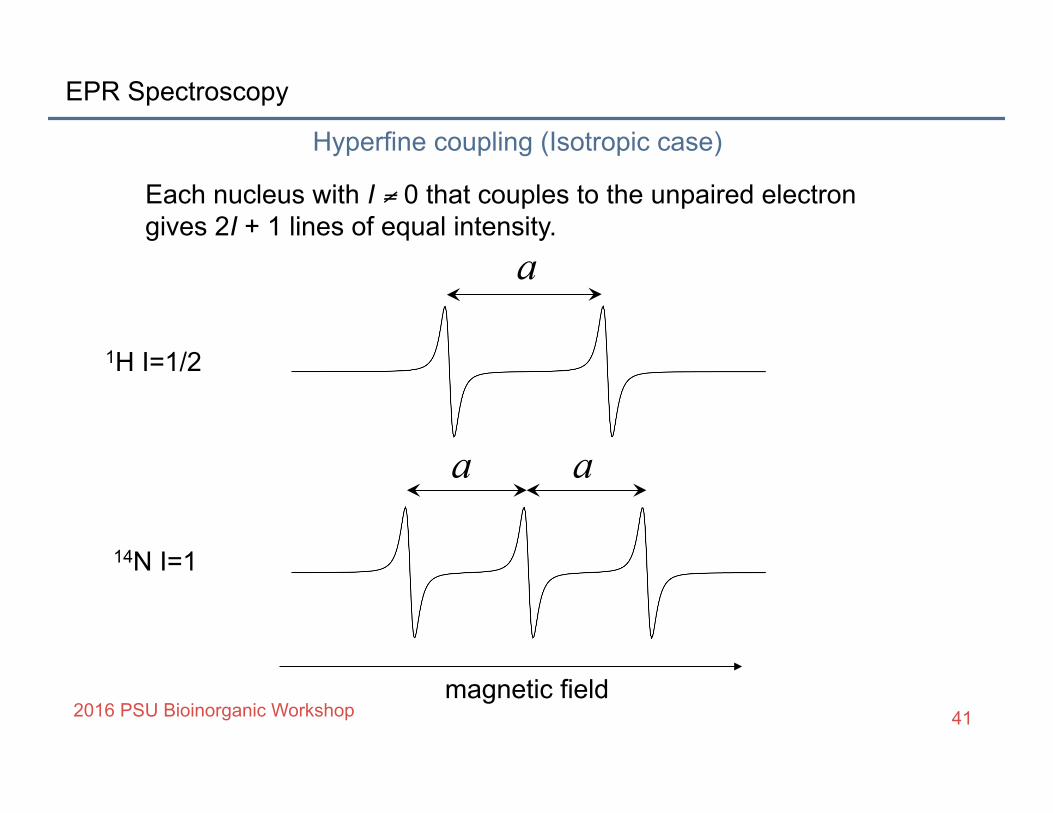
Hyperfine coupling (Isotropic case)
a
Each nucleus with I ≠ 0 that couples to the unpaired electron gives 2I + 1 lines of equal intensity.
1H I=1/2
a
magnetic field
14N I=1
a

EPR Spectroscopy
2016 PSU Bioinorganic Workshop 42
Hyperfine Coupling to Multiple Nuclei
Groups of equivalent nuclei give characteristic patterns of lines.
The number of hyperfine lines, nhfs, from a group of, n, equivalent nuclei of spin I is:
nhfs = (2nI +1)
The total number of hyperfine lines, n, from several groups of equivalent nuclei:
ntotal =Πi
(2ni Ii +1) = (2n1I1 +1)(2n2 I2 +1)...
This number can become very large

EPR Spectroscopy
2016 PSU Bioinorganic Workshop 43
Hyperfine coupling constants have two main contributions:
Interpretation of the hyperfine coupling:
aiso =23µ0βeβnh
gegn ψ(0)2
electron spin density at the nucleus
Fermi contact
Dipolar coupling adipolar =µ04π
βeβnh
gegn3cos2θ −1
r3
Notice that this term is orientation dependent
EPR Spectroscopy
2016 PSU Bioinorganic Workshop 44
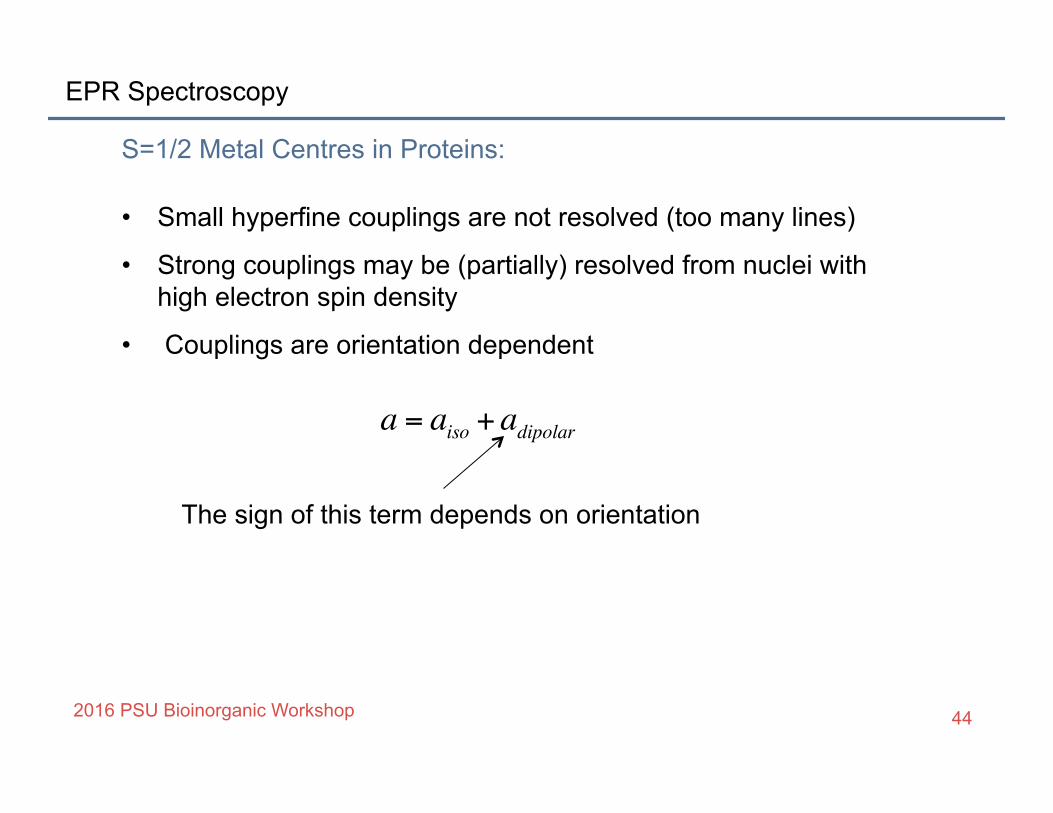
• Small hyperfine couplings are not resolved (too many lines)
• Strong couplings may be (partially) resolved from nuclei with high electron spin density
• Couplings are orientation dependent
S=1/2 Metal Centres in Proteins:
a = aiso +adipolar
The sign of this term depends on orientation
EPR Spectroscopy
2016 PSU Bioinorganic Workshop 45
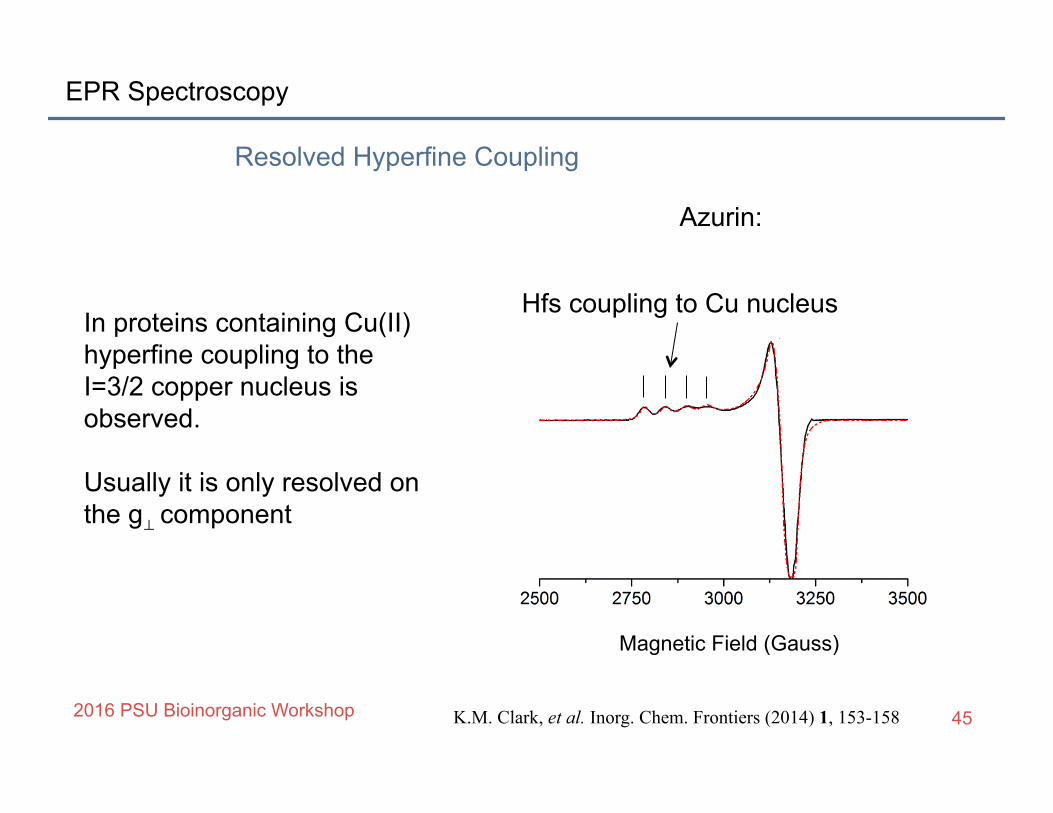
Azurin:
Resolved Hyperfine Coupling
In proteins containing Cu(II) hyperfine coupling to the I=3/2 copper nucleus is observed. Usually it is only resolved on the g⟂ component
K.M. Clark, et al. Inorg. Chem. Frontiers (2014) 1, 153-158
Magnetic Field (Gauss)
Hfs coupling to Cu nucleus

EPR Spectroscopy
2016 PSU Bioinorganic Workshop 46
Ni Superoxide dismutase:
Resolved Hyperfine Coupling
Hyperfine coupling to ligands is also sometimes resolved on one or more of the g-tensor components
Ryan et al Biochemistry (2015) 54, 1016–1027
14N coupling to axial His

EPR Spectroscopy
2016 PSU Bioinorganic Workshop 47
For systems with S > 1/2, spin-orbit coupling and spin-spin coupling, split the spin states :
Zero-Field Splitting
S = 1
ms = 0
ms = +1
S = 3/2
ms = ±3/2
ms = –1
ms = ±1/2
This splitting has a large impact on the EPR spectra

EPR Spectroscopy
2016 PSU Bioinorganic Workshop 48
Because the splitting occurs even when there is no magnetic field present is referred to as Zero-Field-Splitting:
Zero-Field Splitting
The term in the spin Hamiltonian describing this interaction has the form:
HZFS = S i D i S
In its principal axes the matrix D can be written:
D =
−13D+E 0 0
0 −13D−E 0
0 0 23D
"
#
$$$$$$$
%
&
'''''''

EPR Spectroscopy
2016 PSU Bioinorganic Workshop 49
For an isotropic system
Zero-Field Splitting and Symmetry
D,E = 0
The ratio E/D is a measure of the rhombicity of the zero-field splitting
For an axial system D ≠ 0,E = 0
For a rhombic system D ≠ 0,E ≠ 0
The rhombicity lies between 0 and 1/3

EPR Spectroscopy
2016 PSU Bioinorganic Workshop 50
Organic triplet sates: The parameters D and E are generally smaller than the Zeeman energy at X-band
Zero-Field Splitting
0 50 100 150 200 250 300B0 (mT)
-300
-200
-100
0
100
200
300
400
E/gβ
(m
T)
ms = 0
ms = +1
ms = –1
There are two allowed transitions in the EPR. They occur at different field values because of the ZFS

EPR Spectroscopy
2016 PSU Bioinorganic Workshop 51
For a powder, the spectrum is a so-called “Pake pattern”
Zero-Field Splitting
The parameters D and E can be determined from the positions of the features in the spectrum.
300 320 340 360 380 400Magnetic Field (mT)
EPR
Sig
nal
|D|+|E|
|D|–|E|
2|D|

EPR Spectroscopy
2016 PSU Bioinorganic Workshop 52
Few organic molecules have triplet ground states but excited triplet states are often long-lived enough to be observed by EPR.
Light-induced Triplet States
Such measurements require transient EPR
Direct detection is usually used. (No field modulation)

EPR Spectroscopy
2016 PSU Bioinorganic Workshop 53
Transient EPR
Magnetic Field
Spectrum extracted from dataset

EPR Spectroscopy
Spin Polarization of Triplet States
2016 PSU Bioinorganic Workshop 54
The sublevels of a light-induced triplet state are selectively populated
The selectivity is determined by the pathway by which the triplet state is populated.
T-1
T0
T+1
T-1
T0
T+1
or

EPR Spectroscopy
2016 PSU Bioinorganic Workshop 55
300 320 340 360 380 400B0 / mT
300 320 340 360 380 400B0 / mT
A
E
Spin Polarization Example: Photosystem II
radical pair recombination
relaxation from singlet state
3P680 in Photosystem II
Kamlowski et al , Ber. der Bunsenges. Phys. Chem. 100, 2045–2051 , (1996)

EPR Spectroscopy
2016 PSU Bioinorganic Workshop 56
For metals with S > 1/2, the zero field splitting is often much larger than the Zeeman interaction
High Spin Systems
e.g. S = 3/2
0 100 200 300 400B0 (mT)
-2
-1
0
1
2
E (c
m-1
)ms =+
32
ms = −32
ms =+12
ms = −12
For half-integer spins, transitions are often observed at low field.

EPR Spectroscopy
2016 PSU Bioinorganic Workshop 57
0
2
4
6
effe
ctiv
e g-
valu
e
0 0.1 0.2 0.3E/D
0
2
4
6
effe
ctiv
e g-
valu
e
ms =±32
ms =±12
x
xy
z
zy
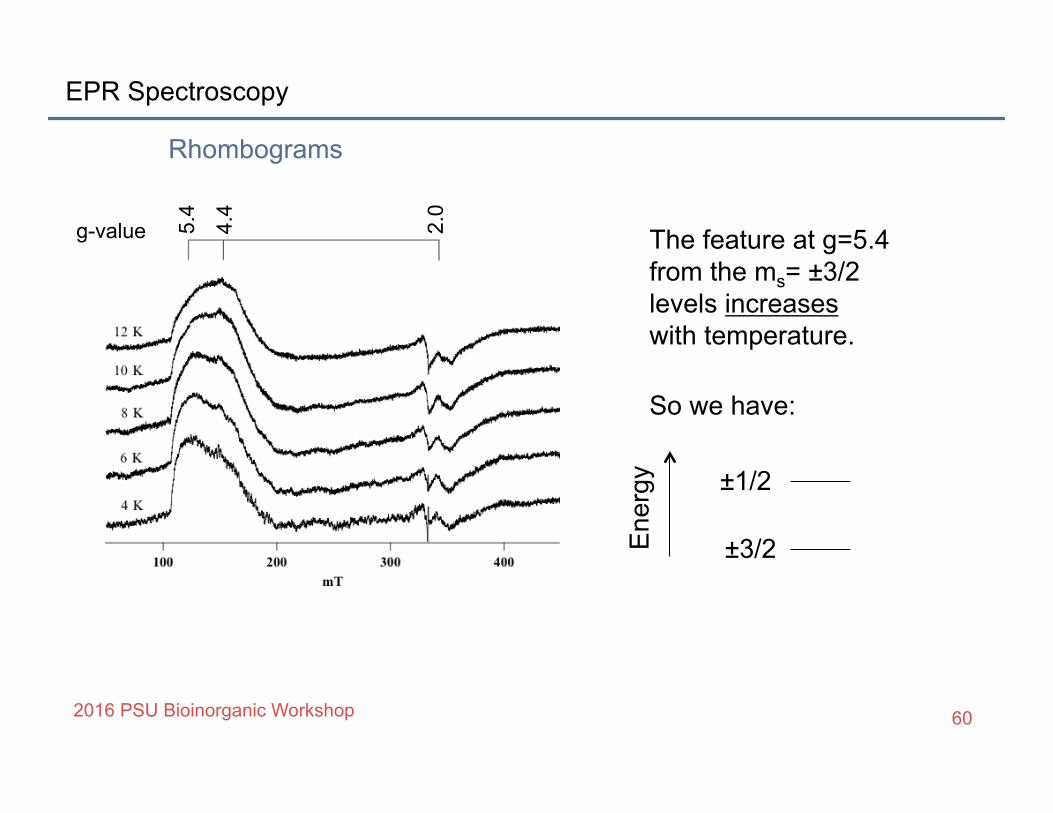
Rhombograms
The positions of the features in the spectrum depend on the ratio of the zero field splitting parameters D and E. The expected peak positions can be calculated as a function of E/D in a so-called Rhombogram

EPR Spectroscopy
2016 PSU Bioinorganic Workshop 58
Rhombograms 5.
4
4.4
2.0
effective g-value
EPR spectrum of the reduced iron-sulfur cluster FX in the reaction centre of heliobacteria
Golbeck and van der Est (2013) in “Molecular Biophysics for the Life Sciences”, Allewell, Nahri & Rayment, Eds.

EPR Spectroscopy
2016 PSU Bioinorganic Workshop 59
0
2
4
6
effe
ctiv
e g-
valu
e0 0.1 0.2 0.3
E/D
0
2
4
6
effe
ctiv
e g-
valu
e
ms =±32
ms =±12
x
xy
z
zy
Rhombograms 5.
4
4.4
2.0
g-value
The main features in the spectrum correspond to E/D = ~0.2 for a spin 3/2 system.
EPR Spectroscopy
2016 PSU Bioinorganic Workshop 60
Rhombograms 5.
4
4.4
2.0
g-value The feature at g=5.4 from the ms= ±3/2 levels increases with temperature.
So we have:
±3/2
±1/2
Ene
rgy

EPR Spectroscopy
2016 PSU Bioinorganic Workshop 61
!
geff=6
geff=2
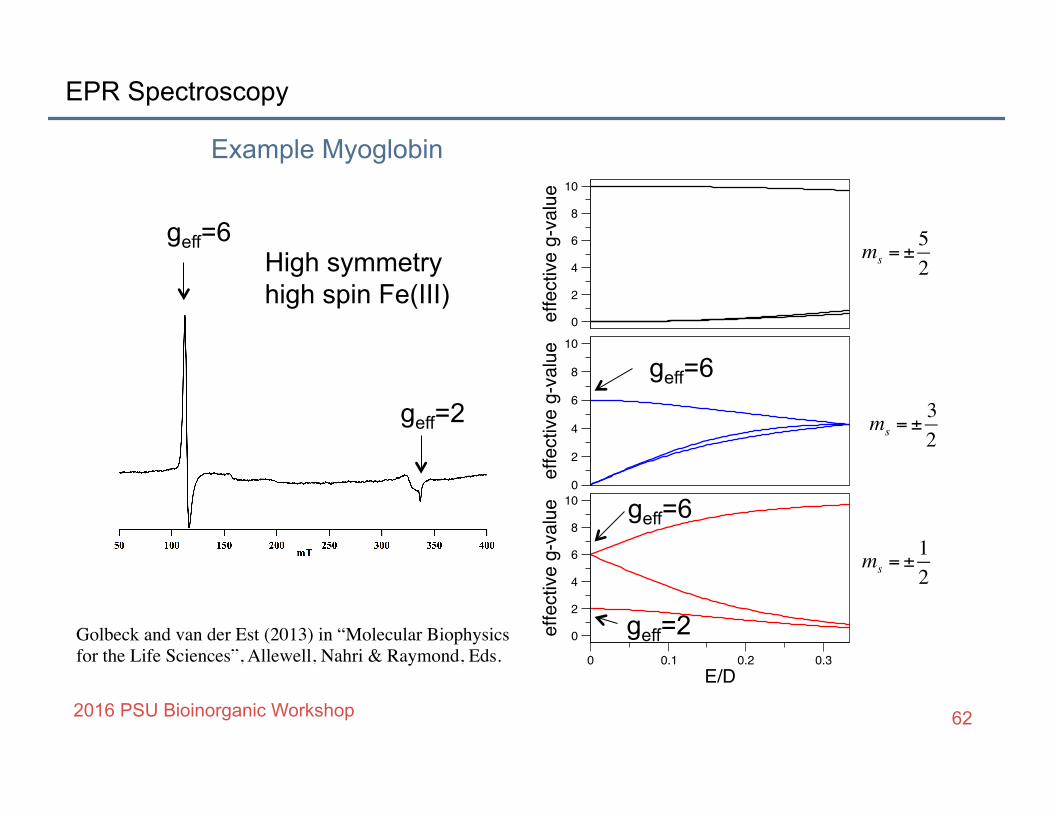
Example Myoglobin
High spin Fe(III) of Heme proteins
Golbeck and van der Est (2013) in “Molecular Biophysics for the Life Sciences”, Allewell, Nahri & Rayment, Eds.
Heme
EPR Spectroscopy
2016 PSU Bioinorganic Workshop 62
!
geff=6
geff=2
Example Myoglobin
High symmetry high spin Fe(III)
0
2
4
6
8
10
effe
ctiv
e g-
valu
e
0
2
4
6
8
10
effe
ctiv
e g-
valu
e
0 0.1 0.2 0.3E/D
0
2
4
6
8
10
effe
ctiv
e g-
valu
e
ms =±32
ms =±12
ms =±52
Golbeck and van der Est (2013) in “Molecular Biophysics for the Life Sciences”, Allewell, Nahri & Raymond, Eds.
geff=6
geff=6
geff=2

EPR Spectroscopy
0
2
4
6
8
10
effe
ctiv
e g-
valu
e
0
2
4
6
8
10
effe
ctiv
e g-
valu
e
0 0.1 0.2 0.3E/D
0
2
4
6
8
10
effe
ctiv
e g-
valu
e
2016 PSU Bioinorganic Workshop 63
“Junk Iron”
g=4.3
Many biological samples show a signal at g=4.3 from non-specifically bound “junk” Fe(III).
Fadeeva et al, Biochem. (Moscow) (2008),73,123–129
NADH:quinone oxidoreductase
flavin radical

EPR Spectroscopy
• Basics of the EPR experiment
• Orientation dependence g-anisotropy, single crystals
• Hyperfine coupling
• Couplings between electrons, Zero Field Splitting
• High spin systems and Rhombograms
2016 PSU Bioinorganic Workshop 64
Summary