Introduction to Electricity Supply Monitoring Initiative (ESMI)
12
Electricity Supply Monitoring Initiative Prayas (Energy Group) Pune March 2015
-
Upload
prayas-energy-group -
Category
Services
-
view
831 -
download
1
Transcript of Introduction to Electricity Supply Monitoring Initiative (ESMI)

Electricity Supply Monitoring Initiative
Prayas (Energy Group)
PuneMarch 2015

About Prayas …
Activities:• Research & intervention (regulatory, policy)• Civil Society training, awareness, and support
www.prayaspune.org/peg
Energy (Policy,
Planning & Governance)
ElectricityRegulation
Rural Energy
Renewable Energy
Coal, Natural
Gas Regulation
Energy security, Climate Change
Energy Efficiency
2

Electricity Supply Monitoring Initiative (ESMI)
ESMI is an initiative of Prayas, a Pune, India based energy think thank and consumer organisation.
It aims to provide evidence based feedback about the actual electricity supply quality -voltage and interruptions - experienced by consumers in urban and rural areas across the country.
For this purpose Prayas has deployed Electricity Supply Monitors (ESM) at number of locations.
ESM is a state-of-art, internet of things (IoT) technology and is a plug-in device that combines a voltage recorder and a communication modem. It can be easily installed at any location in an ordinary power supply socket. The ESM records voltage every minute at its location and sends the data to a central server using a standard mobile data network. ESMs are currently deployed at 60 locations across India and supply quality data is made available in user friendly manner at ESMI portal –
watchyourpower.org
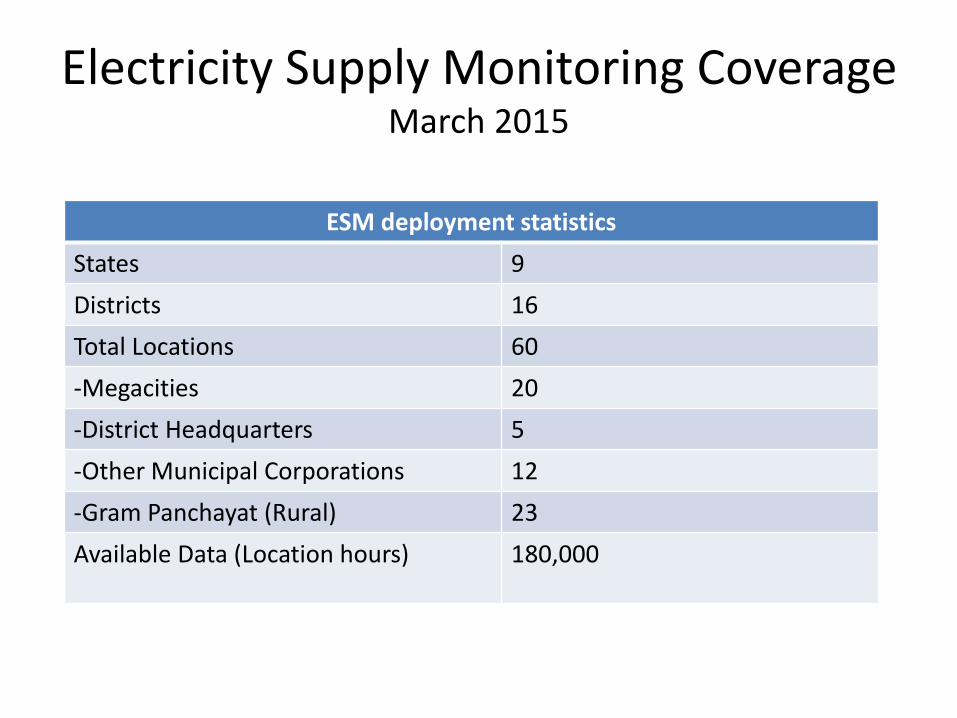
Electricity Supply Monitoring CoverageMarch 2015
ESM deployment statistics
States 9
Districts 16
Total Locations 60
-Megacities 20
-District Headquarters 5
-Other Municipal Corporations 12
-Gram Panchayat (Rural) 23
Available Data (Location hours) 180,000

Sample Location report available watchyourpower.org
The website allows all users to select an ESMI location, view and download reports showing quality of supply during the selected time period
The pie chart displays supply quality (Low voltage, Normal Voltage, High Voltage and No supply) for the selected period.
The interruptions profile table details the duration and number of interruptions
The bar chart shows the daily supply quality during evening hours ( 5 PM- 11 PM )
The final line graph shows the minute by minute voltage profile for the selected duration

Compare data across locations watchyourpower.org
The website allows a user to compare voltage supply quality across two or three locations simultaneously. This can help analyze variations in supply quality during the same time interval across multiple locations.

Number of interruptions (>15 min) and no supply hours during February 2015
The chart shows supply quality for different urban and rural (Gram Panchayat) areas covered by ESMI. Nearly 60% of these locations experienced more than 5 interruptions (>15 min) leading to more than 10 hours of outage during the month. Note that most of these locations are in other municipal corporations or gram panchayat areas.
Prayas (Energy Group)
ID : AL15001Source : www.watchyourpower.org
0:00:00
12:00:00
24:00:00
36:00:00
48:00:00
60:00:00
72:00:00
84:00:00
96:00:00
0 10 20 30 40 50 60
Ho
urs
of
Inte
rru
pti
on
Number of Interruptions
Mega Cities District Headquarters Municipal Corporation Gram Panchayat
Sample analysis using ESMI Data

Number of supply interruptions (>15 min) at various ESMI locations during February 2015The chart shows number of ESMI locations in different states and the rural and urban locations. It also shows total number of supply interruptions at each location during the month.
Prayas (Energy Group)
ID : ALS150001Data Source : www.watchyourpower.org
0
10
20
30
40
50
60
Nu
mb
er
of
Inte
rru
pti
on
s
State Capital/Mega Cities District Headquarter Other Municipal Areas Gram Panchayat
Sample analysis using ESMI Data
0
2
4
6
01
-Feb
03
-Feb
05
-Feb
07
-Feb
09
-Feb
11
-Feb
13
-Feb
15
-Feb
17
-Feb
19
-Feb
21
-Feb
23
-Feb
25
-Feb
27
-Feb
Ajekar-Dheputtu
0
2
4
6
01
-Feb
03
-Feb
05
-Feb
07
-Feb
09
-Feb
11
-Feb
13
-Feb
15
-Feb
17
-Feb
19
-Feb
21
-Feb
23
-Feb
25
-Feb
27
-Feb
Guddiangadi
0
2
4
6
01
-Feb
03
-Feb
05
-Feb
07
-Feb
09
-Feb
11
-Feb
13
-Feb
15
-Feb
17
-Feb
19
-Feb
21
-Feb
23
-Feb
25
-Feb
27
-Feb
Idu
0
2
4
6
01
-Feb
03
-Feb
05
-Feb
07
-Feb
09
-Feb
11
-Feb
13
-Feb
15
-Feb
17
-Feb
19
-Feb
21
-Feb
23
-Feb
25
-Feb
27
-Feb
Karkala
0
2
4
6
01
-Feb
03
-Feb
05
-Feb
07
-Feb
09
-Feb
11
-Feb
13
-Feb
15
-Feb
17
-Feb
19
-Feb
21
-Feb
23
-Feb
25
-Feb
27
-Feb
Kundapur
0
2
4
6
01
-Feb
03
-Feb
05
-Feb
07
-Feb
09
-Feb
11
-Feb
13
-Feb
15
-Feb
17
-Feb
19
-Feb
21
-Feb
23
-Feb
25
-Feb
27
-Feb
Mudur
0
2
4
6
01
-Feb
03
-Feb
05
-Feb
07
-Feb
09
-Feb
11
-Feb
13
-Feb
15
-Feb
17
-Feb
19
-Feb
21
-Feb
23
-Feb
25
-Feb
27
-Feb
Nakre
0
2
4
6
01
-Feb
03
-Feb
05
-Feb
07
-Feb
09
-Feb
11
-Feb
13
-Feb
15
-Feb
17
-Feb
19
-Feb
21
-Feb
23
-Feb
25
-Feb
27
-Feb
Shirva
0
2
4
6
01
-Feb
03
-Feb
05
-Feb
07
-Feb
09
-Feb
11
-Feb
13
-Feb
15
-Feb
17
-Feb
19
-Feb
21
-Feb
23
-Feb
25
-Feb
27
-Feb
Siddhapura
0
2
4
6
01
-Feb
03
-Feb
05
-Feb
07
-Feb
09
-Feb
11
-Feb
13
-Feb
15
-Feb
17
-Feb
19
-Feb
21
-Feb
23
-Feb
25
-Feb
27
-Feb
Yadthare
0
2
4
6
01
-Feb
03
-Feb
05
-Feb
07
-Feb
09
-Feb
11
-Feb
13
-Feb
15
-Feb
17
-Feb
19
-Feb
21
-Feb
23
-Feb
25
-Feb
27
-Feb
Brahmavar
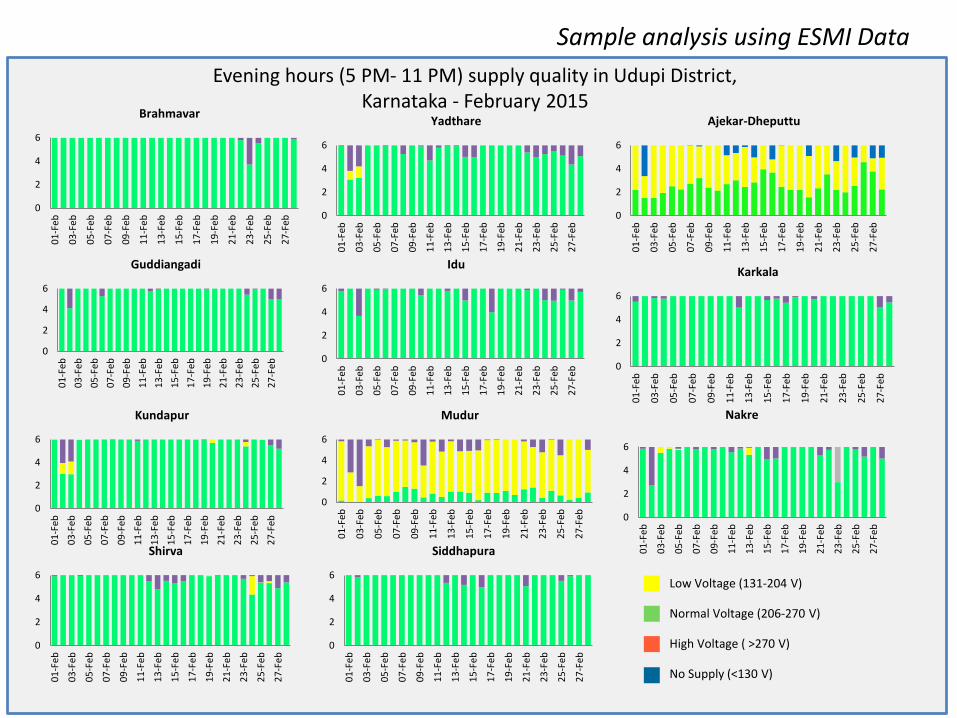
Evening hours (5 PM- 11 PM) supply quality in Udupi District, Karnataka - February 2015
Sample analysis using ESMI Data
Normal Voltage (206-270 V)
High Voltage ( >270 V)
No Supply (<130 V)
Low Voltage (131-204 V)
What next..We are happy to share with you supply quality data from 60 locations as of now. A few hundred more locations will be covered in the coming months.
We hope you find ESMI useful and relevant, and request you to visit the ESMI website – www. watchyourpower.org to view and use the available information.
The information will be useful to build awareness and provide evidence based feedback to policy makers , distribution companies and regulatory commissions to facilitate improvement in power supply quality. Such information can also be used to study linkages between electricity supply and people’s health and livelihood and many other aspects relating to power supply.
To know more about ESMI or for comments and feedback please write to us at [email protected].

Acknowledgments
ESMI has been possible with the support of our ESM device manufacturers , deployment partners, IT consultants and location volunteers hosting ESMs. We appreciate the support of all these partners.
The Electricity Supply Monitoring Initiative (ESMI) was selected as a finalist for the Google Impact Challenge, India, 2013 given to NGOs using technology for social impact, which provided an impetus for the initiative to expand.