
Decision Analysis Problem Solving and Decision Making Decision
Introduction to DecisionAnalysis
Presentation toNCAR WAS*IS Workshop 1
Boulder, CONovember 10, 2005
Jennie Spelman Rice
2
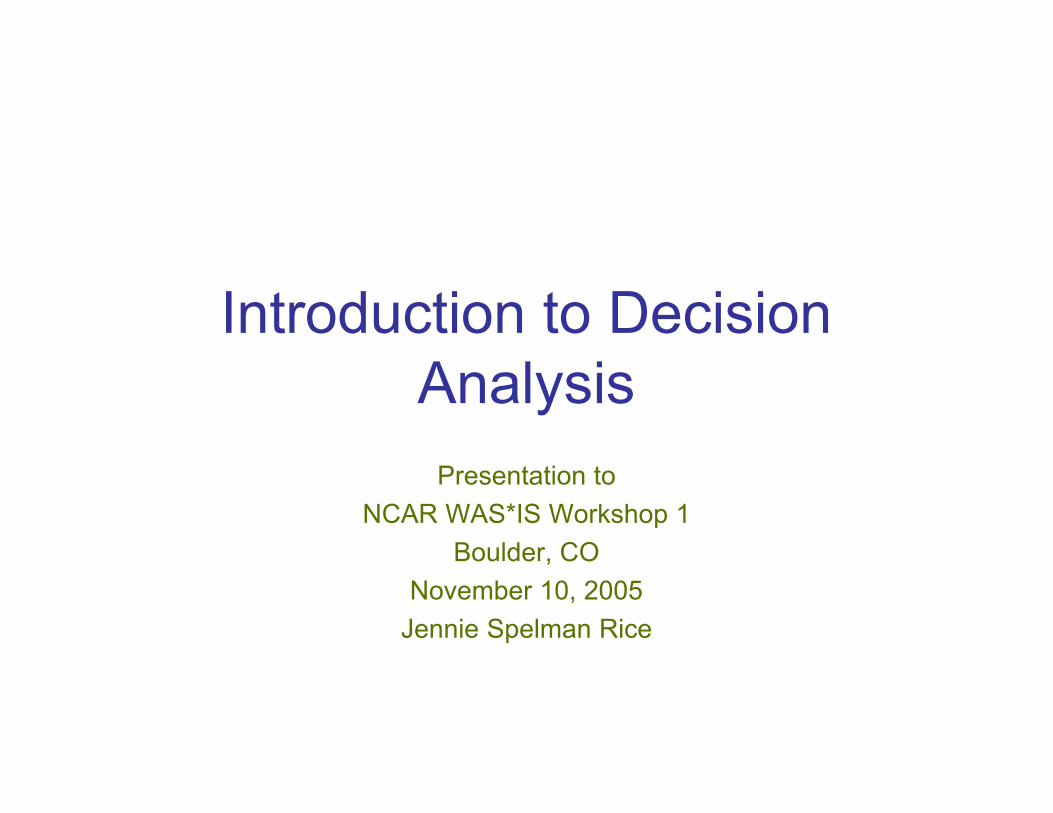
When to Use Decision Analysis?
When decisions are made difficult by:• Uncertainty: e.g., meteorological phenomena; cost,
effectiveness, and lead time of alternatives• Complexity: e.g., many variables, alternatives, regulations,
institutional/organizational levels, political, and social issues• Risk: e.g., potential for loss of life, large financial/property
impacts, large environmental impacts, etc.• Tradeoffs: e.g., minimizing ratepayer costs vs. environmental
damage
Decision analysis is a proven methodology to address theseissues.
3
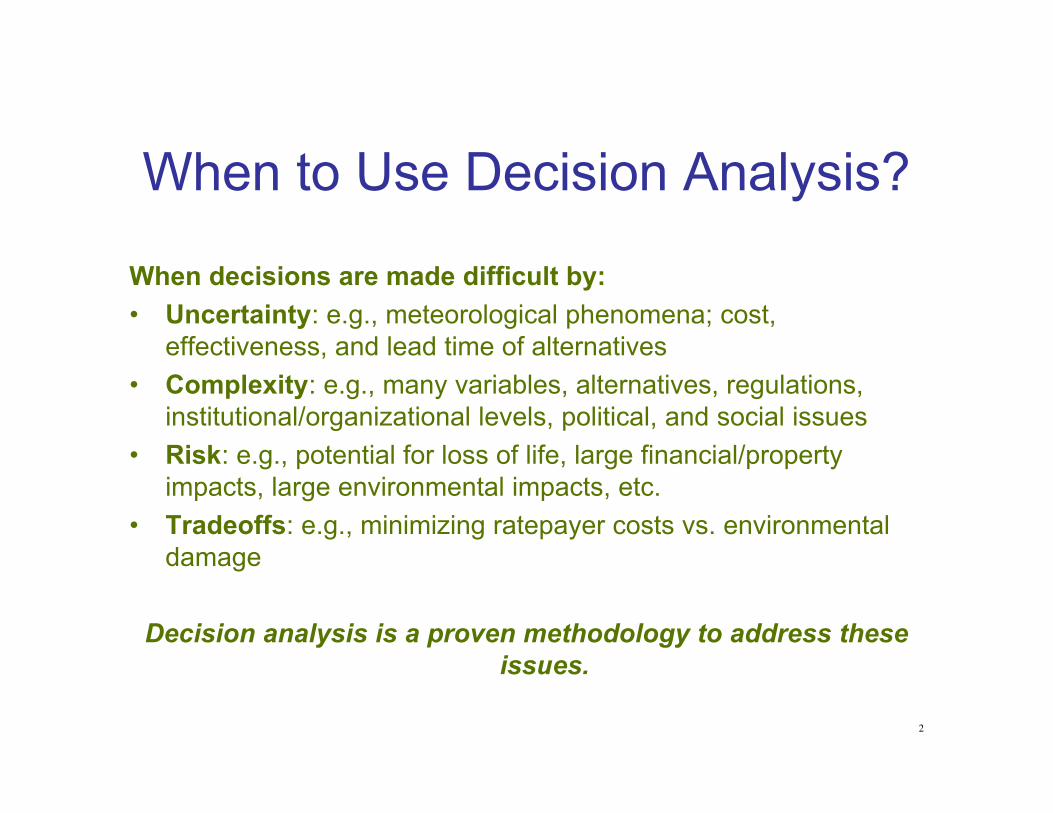
The Decision Analysis Cycle
ProblemStructuring
DeterministicAnalysis
ProbabilisticAnalysis
InformationalAnalysis
Clarify alternatives,information, values
Build math-ematical modelof the decision;Sensitivity analysis toidentify keyvariables
Represent keyvariables withprobabilityassessments;Determine bestplan
Determine valueof additionalresearch anddata gatheringfor each keyvariable
Decision
Iteration
A simple example illustratesthe DA cycle
5
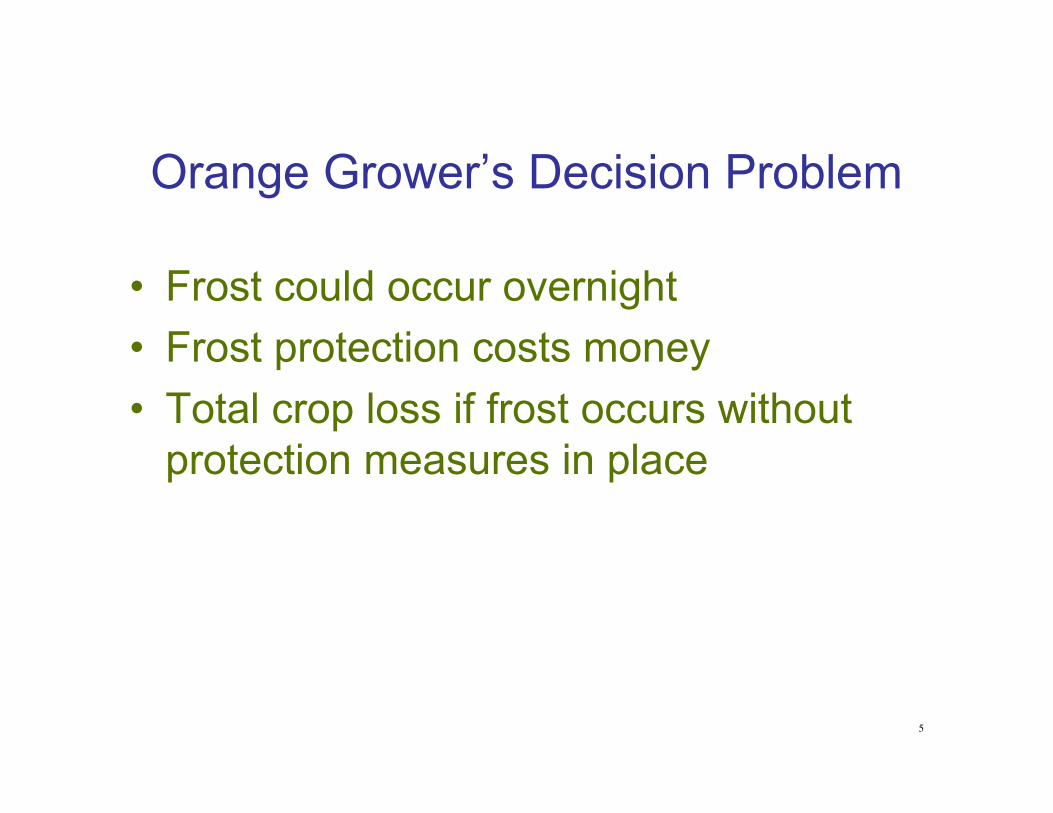
Orange Grower’s Decision Problem
• Frost could occur overnight• Frost protection costs money• Total crop loss if frost occurs without
protection measures in place
6
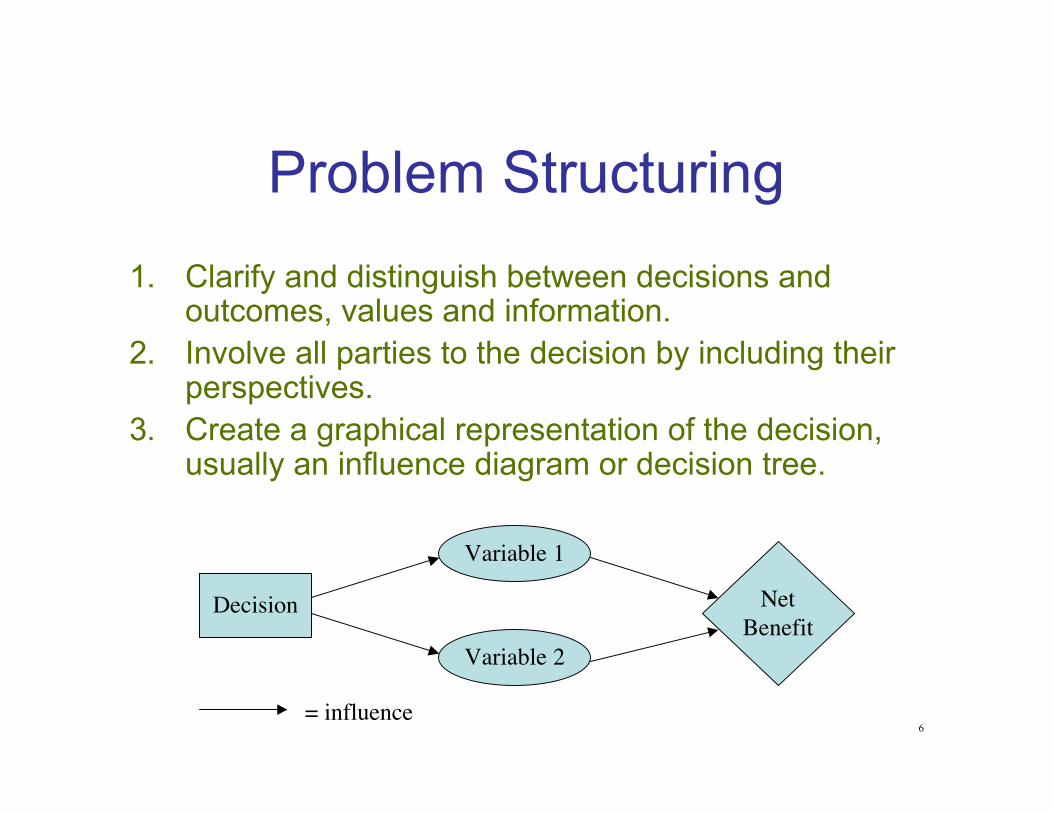
Problem Structuring1. Clarify and distinguish between decisions and
outcomes, values and information.2. Involve all parties to the decision by including their
perspectives.3. Create a graphical representation of the decision,
usually an influence diagram or decision tree.
Decision
Variable 1
Variable 2
NetBenefit
= influence
7
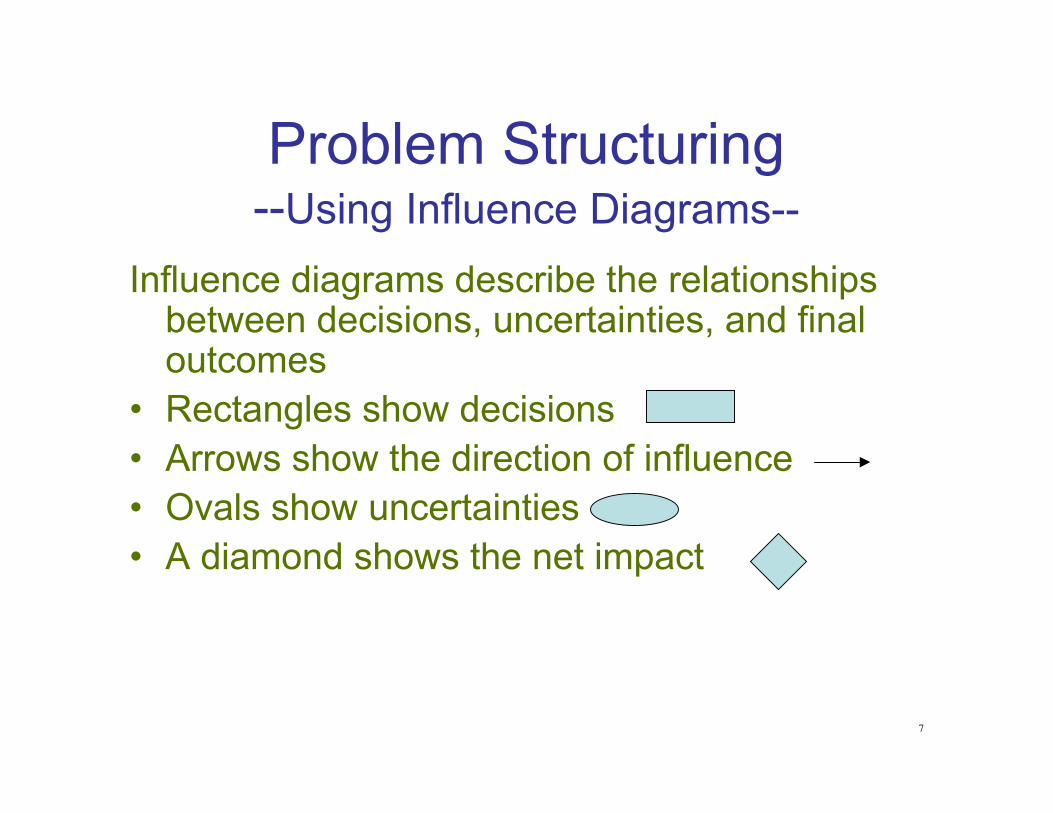
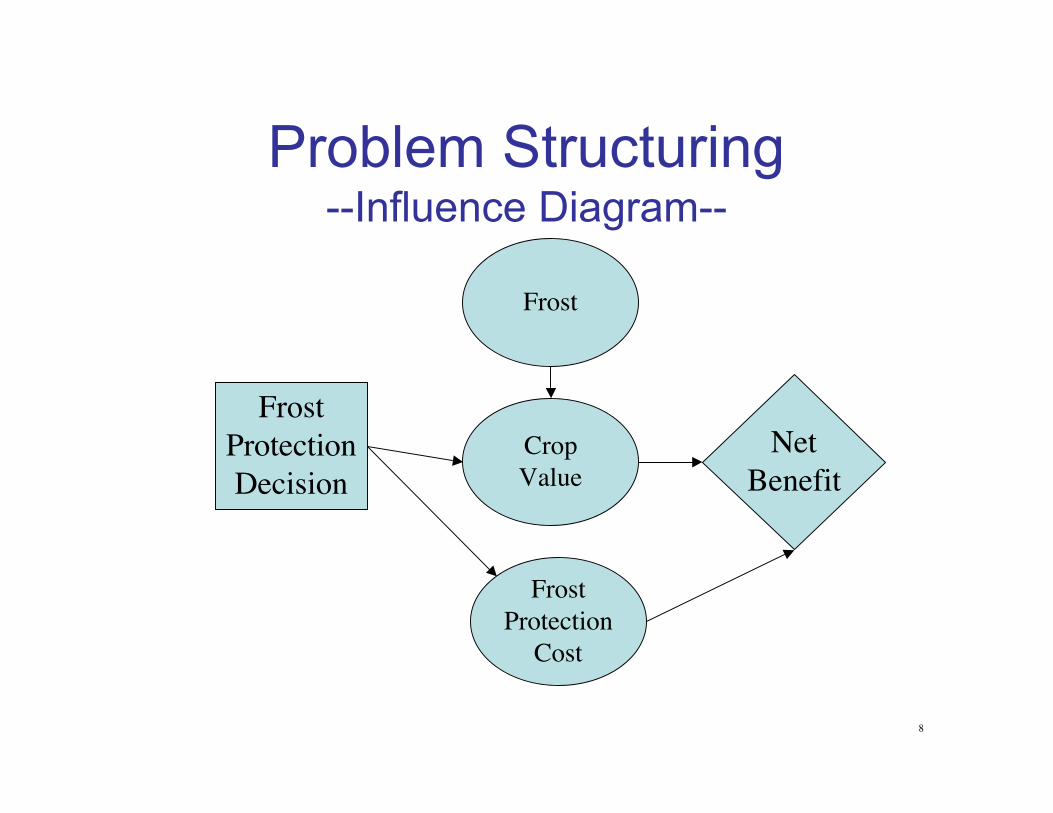
Problem Structuring--Using Influence Diagrams--
Influence diagrams describe the relationshipsbetween decisions, uncertainties, and finaloutcomes
• Rectangles show decisions• Arrows show the direction of influence• Ovals show uncertainties• A diamond shows the net impact
8
Problem Structuring--Influence Diagram--
FrostProtectionDecision
Frost
FrostProtection
Cost
CropValue
NetBenefit
9
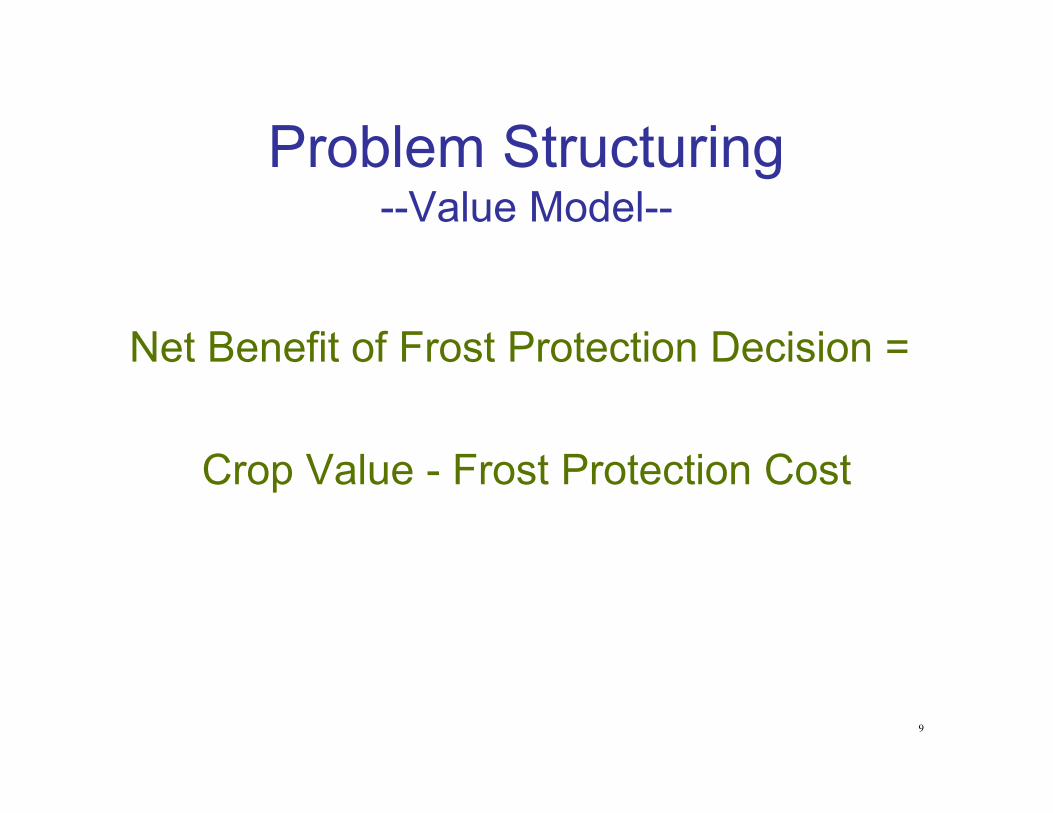
Problem Structuring--Value Model--
Net Benefit of Frost Protection Decision =
Crop Value - Frost Protection Cost
10
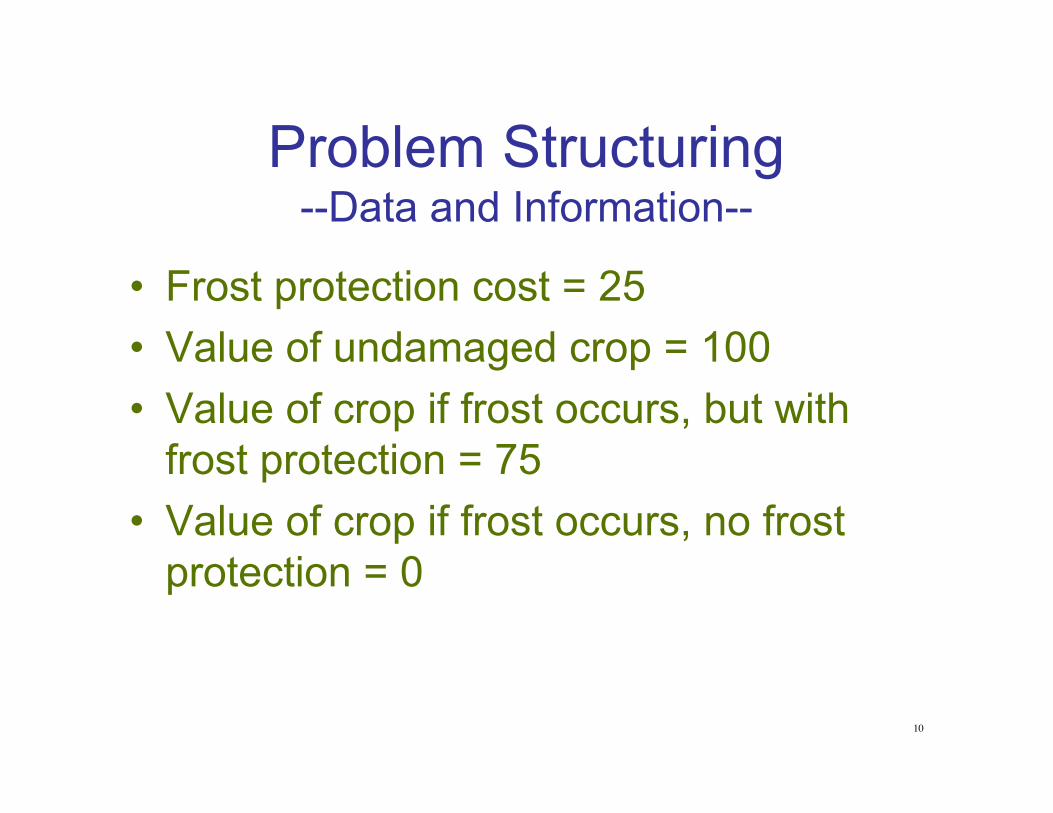
Problem Structuring--Data and Information--
• Frost protection cost = 25• Value of undamaged crop = 100• Value of crop if frost occurs, but with
frost protection = 75• Value of crop if frost occurs, no frost
protection = 0
11
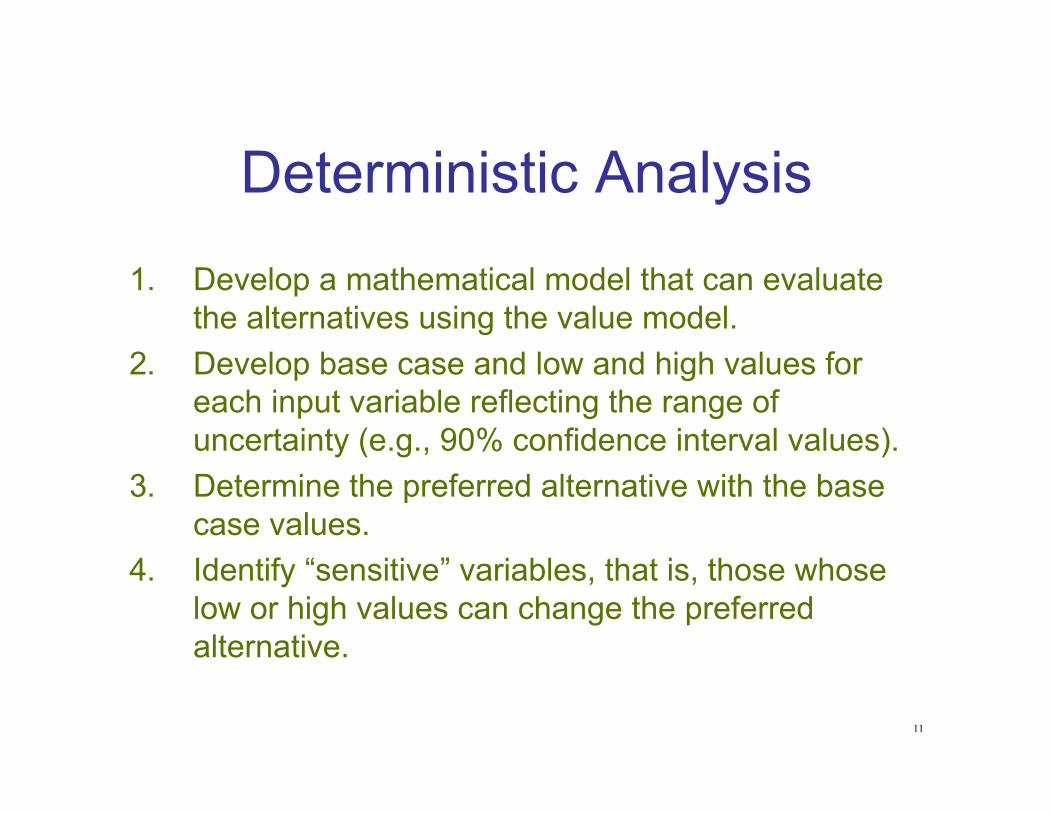
Deterministic Analysis
1. Develop a mathematical model that can evaluatethe alternatives using the value model.
2. Develop base case and low and high values foreach input variable reflecting the range ofuncertainty (e.g., 90% confidence interval values).
3. Determine the preferred alternative with the basecase values.
4. Identify “sensitive” variables, that is, those whoselow or high values can change the preferredalternative.

12
Deterministic Analysis--Sensitivity Analysis--
1000No FrostProtection
7550FrostProtection
No FrostFrostNetBenefit
The frost uncertainty changes the decision: it is a sensitive variableand should be modeled probabilistically
13
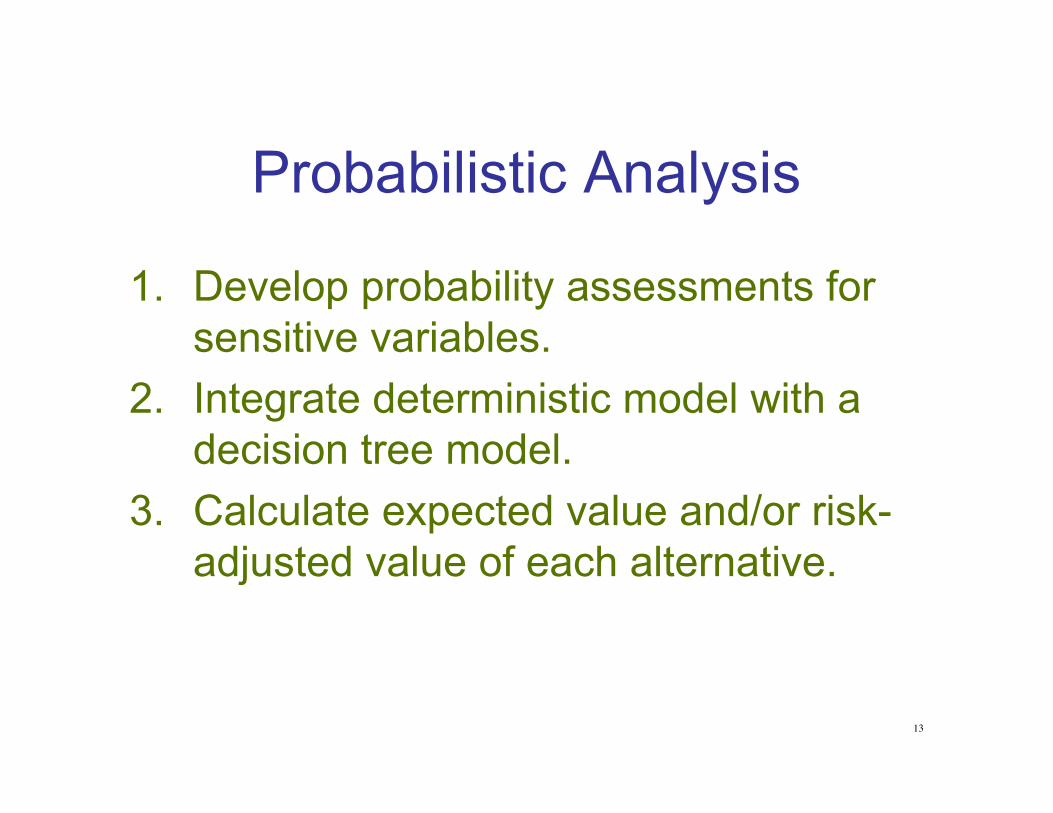
Probabilistic Analysis
1. Develop probability assessments forsensitive variables.
2. Integrate deterministic model with adecision tree model.
3. Calculate expected value and/or risk-adjusted value of each alternative.
14
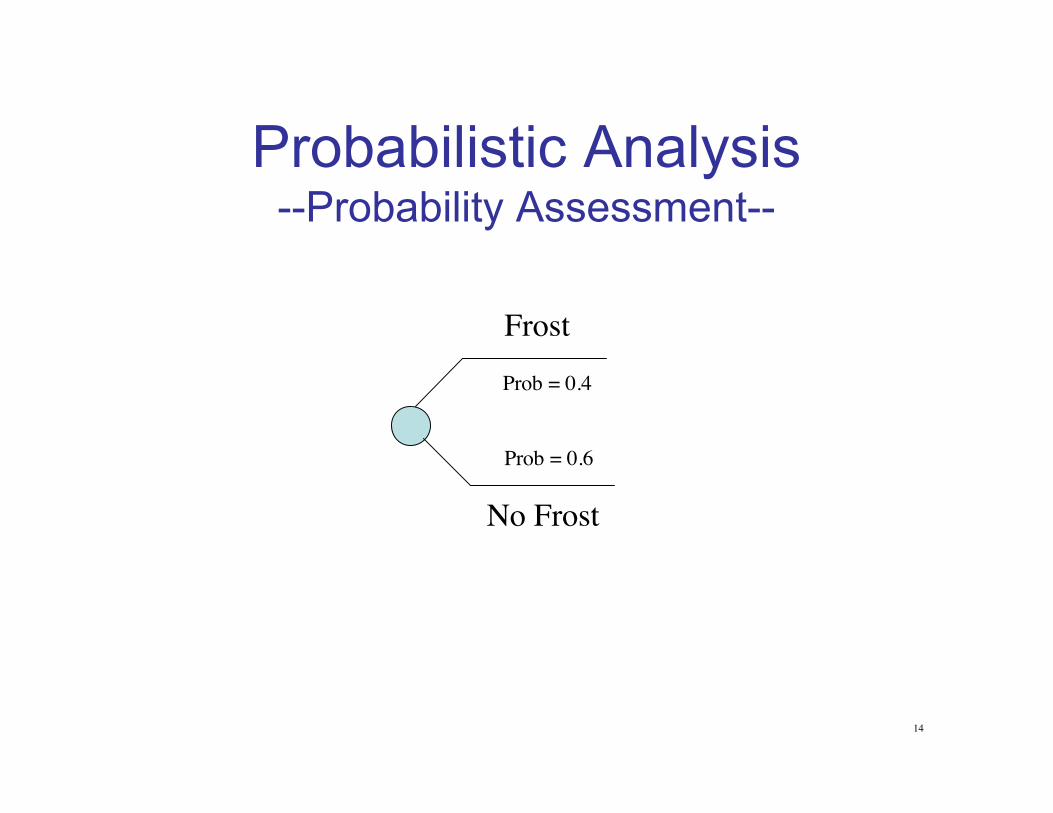
Probabilistic Analysis--Probability Assessment--
Frost
No Frost
Prob = 0.4
Prob = 0.6
15
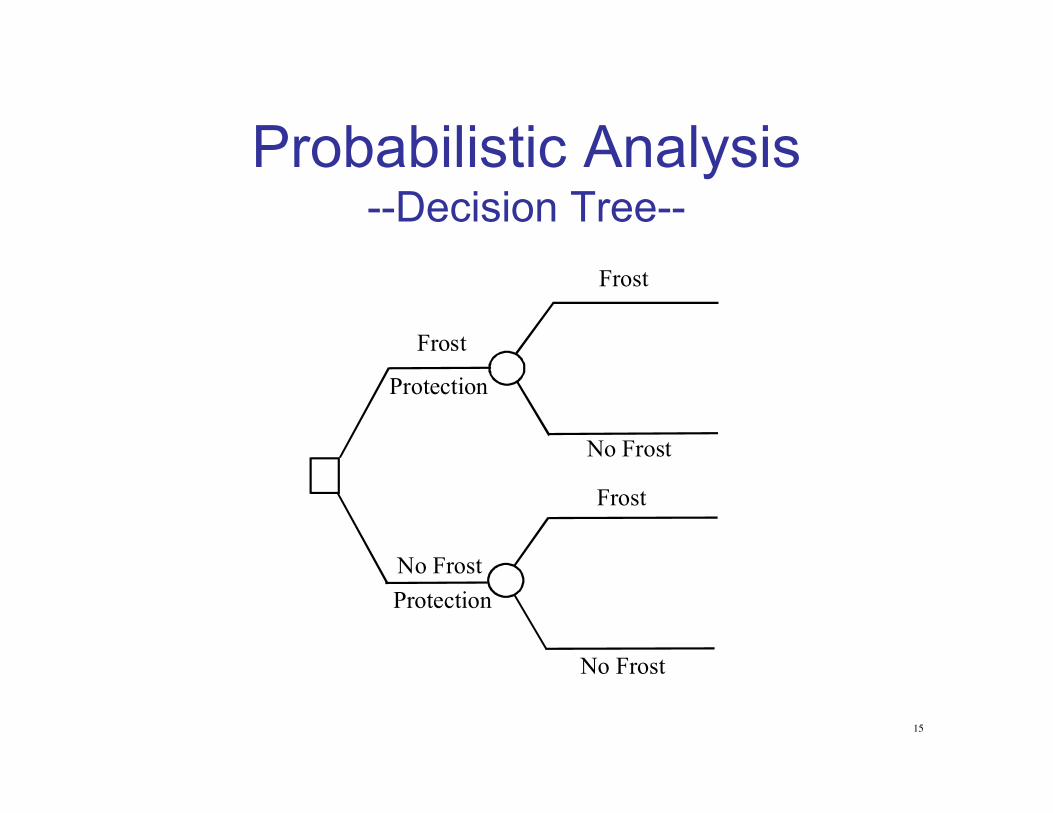
Probabilistic Analysis--Decision Tree--
Frost
No Frost
Frost
No Frost
Protection
No Frost
Frost
Protection

16
Probabilistic Analysis
Frost
No Frost
Frost
No Frost
Protection
No Frost
Frost
Protection
p = 0.4
p = 0.6
p = 0.6
p = 0.4
75 - 25 = 50
100 - 25 = 75
0 - 0 = 0
100 - 0 = 100
Net Benefit = Crop Value - Protection Cost
Expected Value =0.4 x 50 + 0.6 x 75 = 65
Expected Value =0.4 x 0 + 0.6 x 100 = 60
17
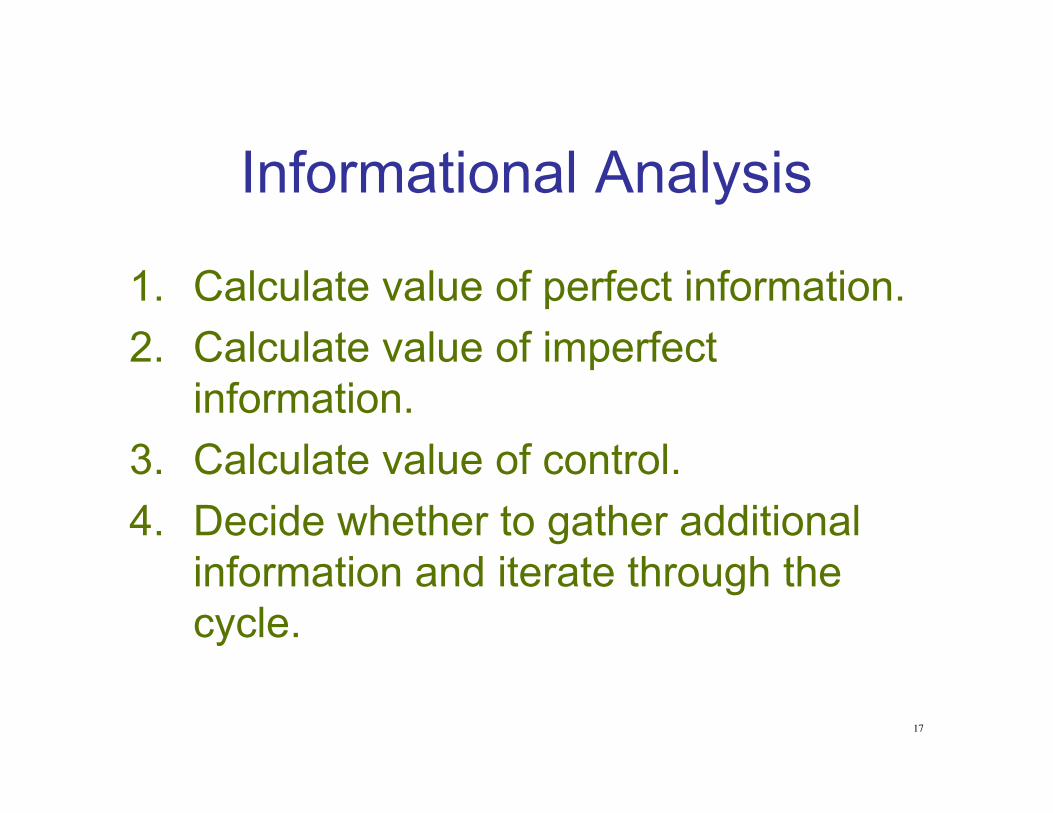
Informational Analysis
1. Calculate value of perfect information.2. Calculate value of imperfect
information.3. Calculate value of control.4. Decide whether to gather additional
information and iterate through thecycle.
18
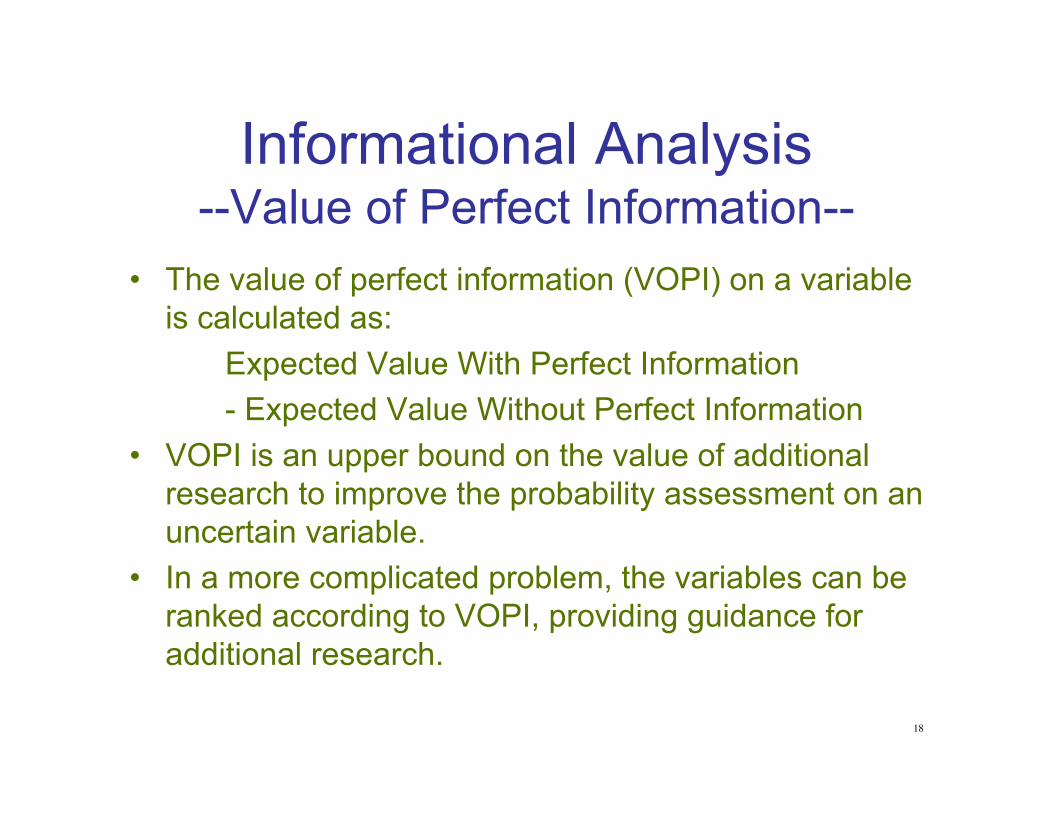
Informational Analysis--Value of Perfect Information--
• The value of perfect information (VOPI) on a variableis calculated as:
Expected Value With Perfect Information- Expected Value Without Perfect Information
• VOPI is an upper bound on the value of additionalresearch to improve the probability assessment on anuncertain variable.
• In a more complicated problem, the variables can beranked according to VOPI, providing guidance foradditional research.
19
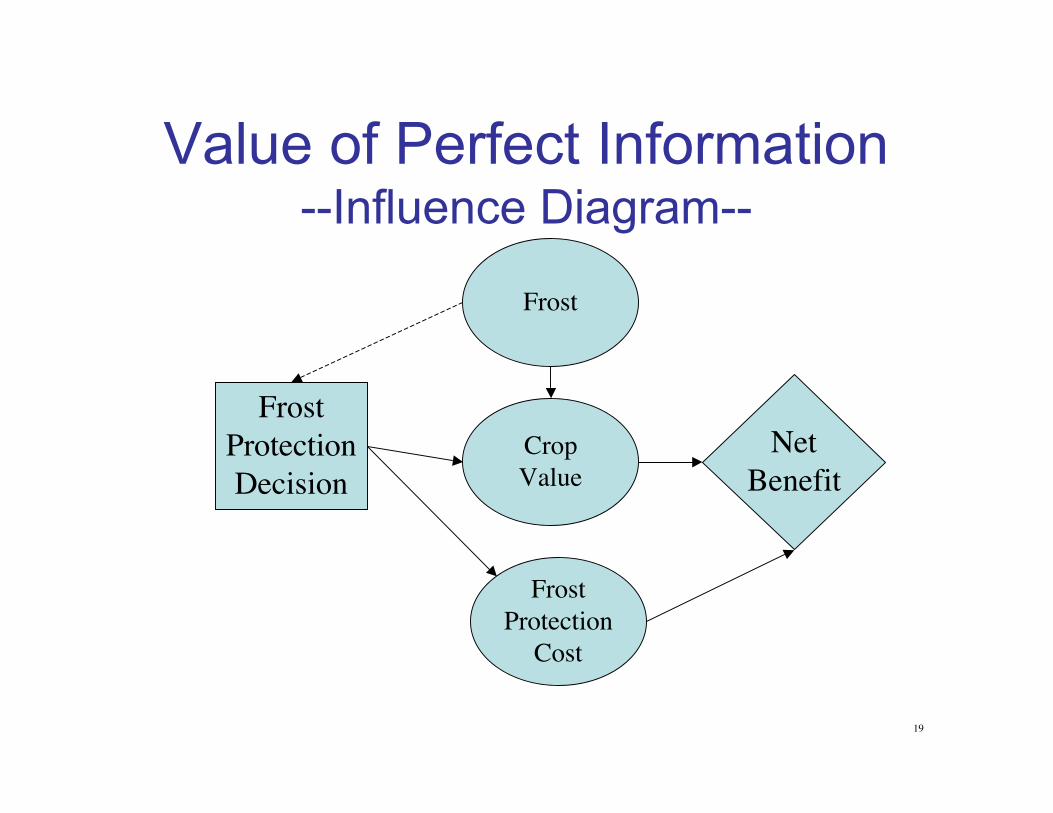
Value of Perfect Information--Influence Diagram--
FrostProtectionDecision
Frost
FrostProtection
Cost
CropValue
NetBenefit
20
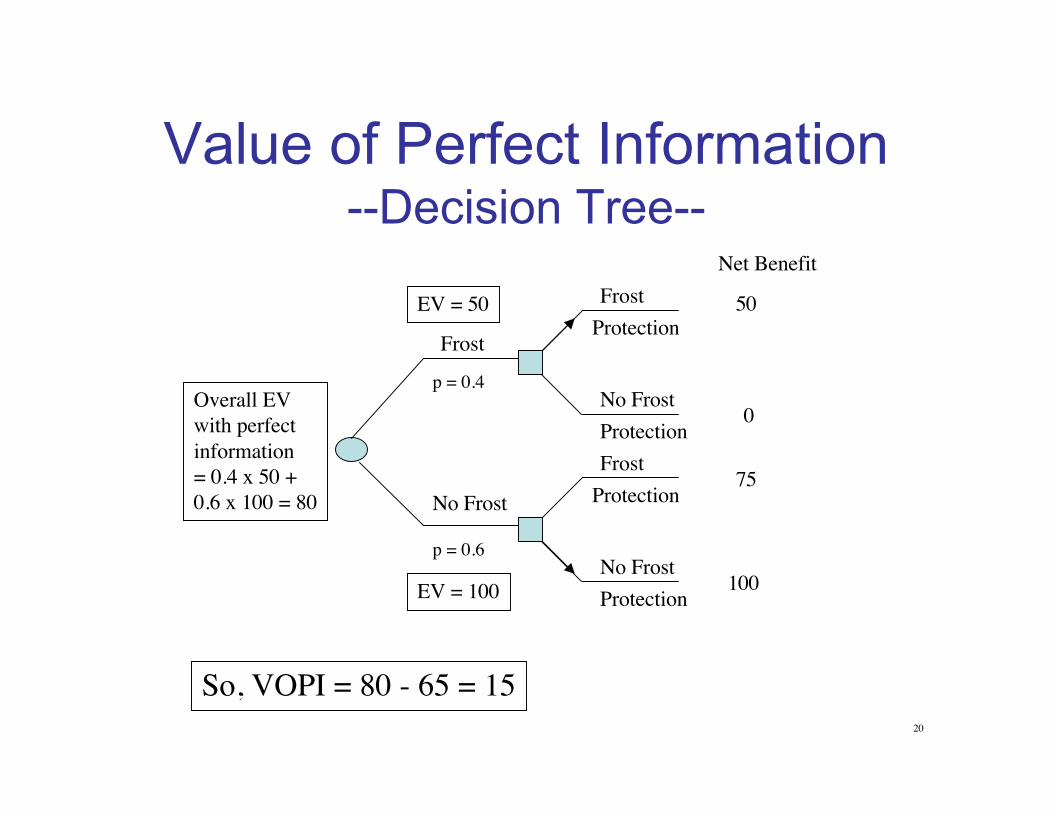
Value of Perfect Information--Decision Tree--
So, VOPI = 80 - 65 = 15
FrostProtection
No FrostProtectionFrost
Protection
No FrostProtection
Frost
No Frost
p = 0.4
p = 0.6
Net Benefit
50
0
75
100
EV = 50
EV = 100
Overall EVwith perfectinformation= 0.4 x 50 +0.6 x 100 = 80

21
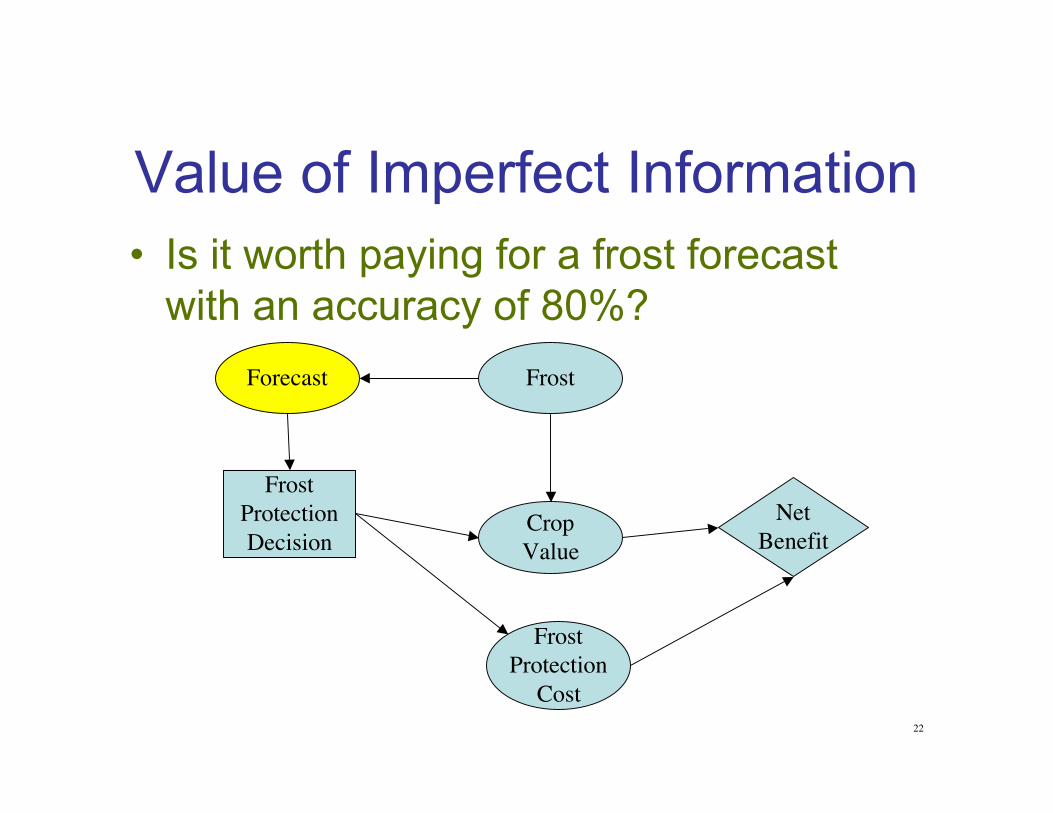
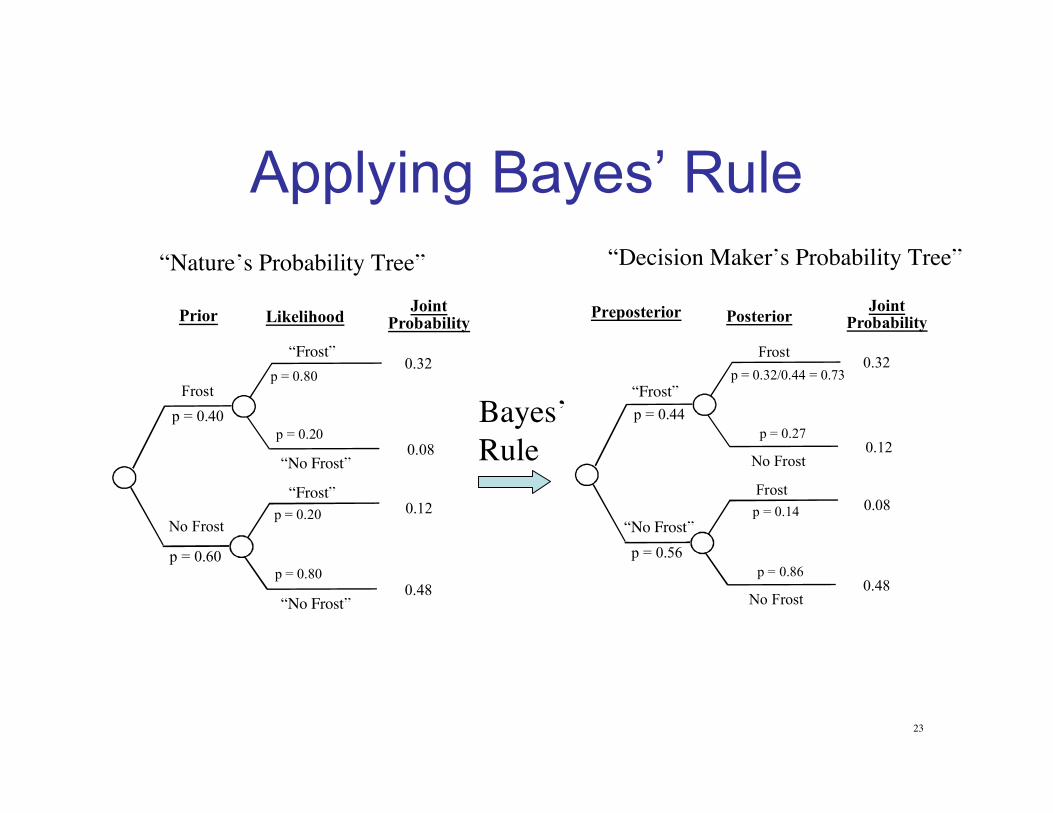
Informational Analysis--Value of Imperfect Information--
• The value of imperfect information (e.g.,a frost forecast) can also be determinedwith decision analysis.
• This is a more complex calculation andrequires the use of Bayesian updating.
22
Value of Imperfect Information• Is it worth paying for a frost forecast
with an accuracy of 80%?
FrostProtectionDecision
Frost
FrostProtection
Cost
CropValue
NetBenefit
Forecast
23
Applying Bayes’ Rule
Frost
No Frost
“Frost”
p = 0.40
Prior Likelihood JointProbability
p = 0.80
p = 0.20
0.32
0.08“No Frost”
p = 0.60
0.12
0.48“No Frost”
“Frost”
p = 0.80
p = 0.20
Frost
No Frost
“Frost”
p = 0.44
Preposterior Posterior JointProbability
p = 0.32/0.44 = 0.73
p = 0.27
0.32
0.12
Frost
No Frost
“No Frost”p = 0.56
p = 0.14
p = 0.86
0.08
0.48
Bayes’Rule
“Nature’s Probability Tree” “Decision Maker’s Probability Tree”
“Frost”
“Frost”
“No Frost”
“No Frost”
“Frost”
“No Frost”
24
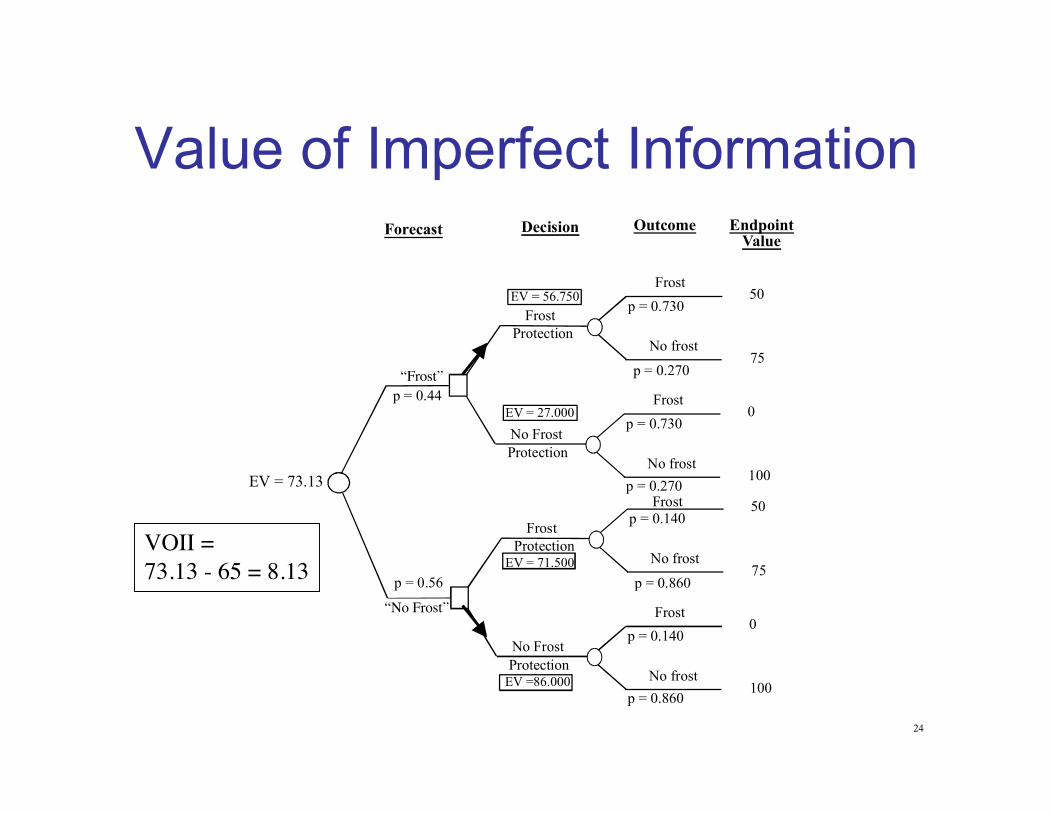
Value of Imperfect Information
Frost
No frost
p = 0.73050
75p = 0.270
Frost
No frost
p = 0.7300
100p = 0.270
Frost
No Frost
EV = 56.750
EV = 27.000
Protection
Protection
“Frost”
p = 0.44
Frost
No frost
p = 0.14050
75p = 0.860
Frost
No frost
p = 0.1400
100p = 0.860
Frost
No Frost
EV = 71.500
EV =86.000Protection
Protection
“No Frost”
p = 0.56
EV = 73.13
Forecast Decision Outcome EndpointValue
VOII = 73.13 - 65 = 8.13
“Frost”
“No Frost”

25
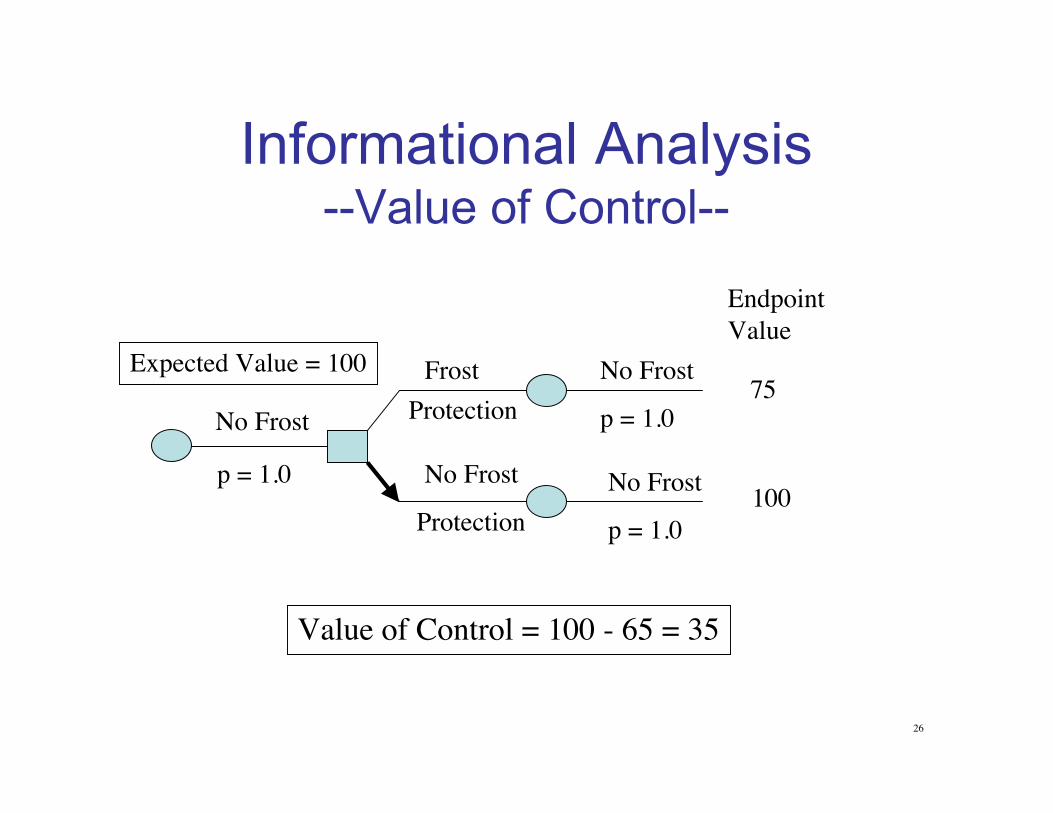
Informational Analysis--Value of Control--
• The value of control determines the upperbound on the value of controlling anuncertainty (e.g., frost).
• Value of Control = Expected Value WithControl - Expected Value Without Control
• This value can be used to gauge the cost-effectiveness of new alternatives (e.g.,greenhouses).
26
Informational Analysis--Value of Control--
No Frost
p = 1.0
p = 1.0
p = 1.0
No Frost
No FrostFrostProtection
Protection
No Frost
EndpointValue
75
100
Expected Value = 100
Value of Control = 100 - 65 = 35
27
Potential Weather-Related DAApplications
• Value of new or improved warning systems (e.g.,louder tornado sirens, earlier notification due to betterdata collection)
• Value of improved forecasts/better modeling (i.e.,what meteorological data are most worth chasing?)
• Value of improved public response capability (e.g.,police, transportation, health vis a vis flooding)
• Value of infrastructure improvements (e.g., buildingcodes, levy construction, sea walls, etc.)
28
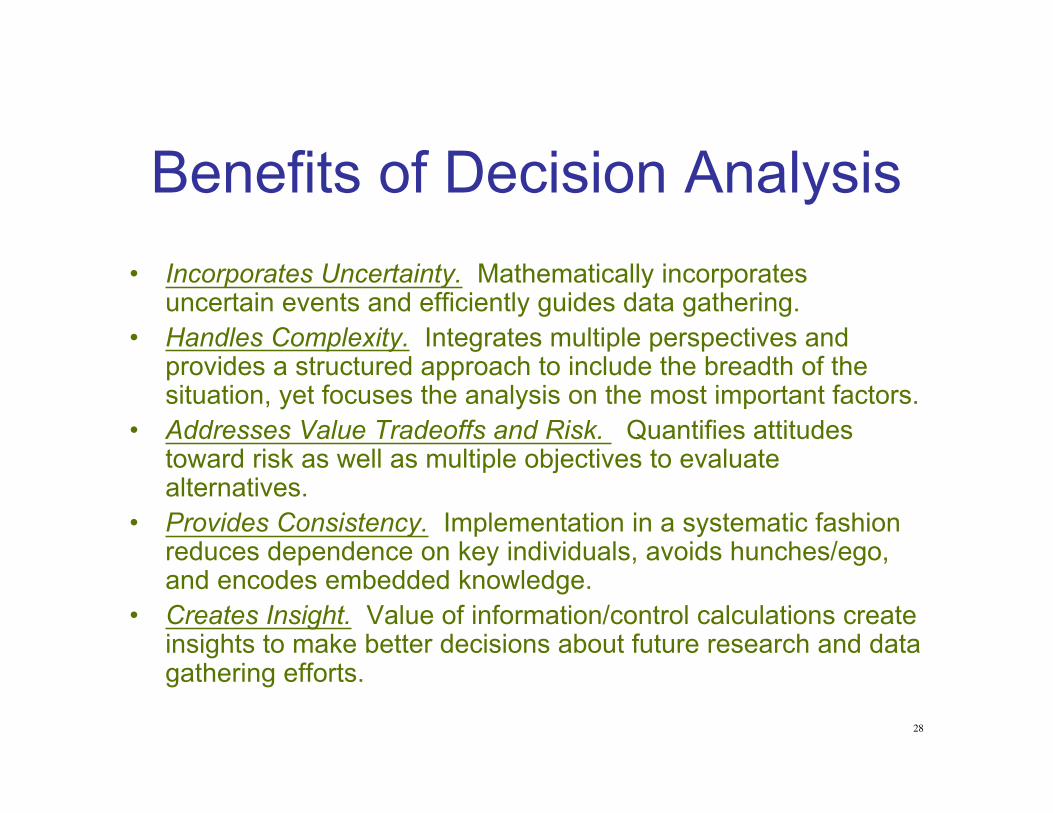
Benefits of Decision Analysis• Incorporates Uncertainty. Mathematically incorporates
uncertain events and efficiently guides data gathering.• Handles Complexity. Integrates multiple perspectives and
provides a structured approach to include the breadth of thesituation, yet focuses the analysis on the most important factors.
• Addresses Value Tradeoffs and Risk. Quantifies attitudestoward risk as well as multiple objectives to evaluatealternatives.
• Provides Consistency. Implementation in a systematic fashionreduces dependence on key individuals, avoids hunches/ego,and encodes embedded knowledge.
• Creates Insight. Value of information/control calculations createinsights to make better decisions about future research and datagathering efforts.