Introduction to Bowtie Methodology for a Laboratory Setting · 2016-03-20 · Introduction to...
56
SAFER, SMARTER, GREENER DNV GL © 2016 Introduction to Bowtie Methodology for a Laboratory Setting 1 ACS 251st National Meeting Division of Chemical Health and Safety Developing, Implementing & Teaching Hazard Assessment Tools Mary Beth Mulcahy, Ph.D., U.S. Chemical Safety & Hazard Investigation Board Chris Boylan, DNV GL 15 March 2016
Transcript of Introduction to Bowtie Methodology for a Laboratory Setting · 2016-03-20 · Introduction to...

DNV GL © 2016 15 March 2016 SAFER, SMARTER, GREENER DNV GL © 2016
Introduction to Bowtie Methodology for a Laboratory Setting
1
ACS 251st National Meeting
Division of Chemical Health and Safety
Developing, Implementing & Teaching Hazard Assessment Tools
Mary Beth Mulcahy, Ph.D., U.S. Chemical Safety & Hazard Investigation Board
Chris Boylan, DNV GL
15 March 2016

DNV GL © 2016 15 March 2016
Accident

DNV GL © 2016 15 March 2016
Culture
Commitment Policies and
Procedures to Improve Safety

DNV GL © 2016 15 March 2016
Poor Commitment Good Commitment
Good Safety Policies and Procedures
Poor Policies and Procedures
Safety Culture

DNV GL © 2016 15 March 2016
Good Commitment
Good Safety Policies and Procedures
Safety Culture

DNV GL © 2016 15 March 2016
Accident

DNV GL © 2016 15 March 2016
Loss of Control

DNV GL © 2016 15 March 2016
Top Event
Loss of Control
Hazard/Top Event
Hazard • Health Hazard (carcinogen, toxin, etc.) • Physical Hazard
(flammable, explosive, etc.)
When do you have to change your response? • Threshold amount • Loss of containment • Loss of utilities

DNV GL © 2016 15 March 2016
Barriers
Major Accident
Top Event
Loss of Control

DNV GL © 2016 15 March 2016
Barriers
Alarms
Preventative Maintenance
Back-up Systems
PPE
Evacuation
Automatic Shutdown
System
Preventative Mitigative
Major Accident
Top Event
Loss of Control

DNV GL © 2016 15 March 2016
Management Systems
Preventative Barriers
Mitigative Barriers
• Hazard Identification • Procedures • Incident Investigations • Indicators
Top Event
Loss of Control

DNV GL © 2016 15 March 2016
Loss of Control

DNV GL © 2016 15 March 2016
About DNV GL
13
350
offices
100 countries
16,000
employees
150 years

DNV GL © 2016 15 March 2016
DNV GL Organization
14
OIL & GAS
MARITIME
ENERGY
BUSINESS
ASSURANCE
SOFTWARE
RESEARCH & INNOVATION
MARINE CYBERNETICS

DNV GL © 2016 15 March 2016
Together we will cover
2:30pm - Overview of Bowtie
3pm-5:30pm - Workshop
! Basic principles
! Best practices (do’s and don’ts)
! Plenary and group exercises – develop bowties
! Link to organizational and safety culture

DNV GL © 2016 15 March 2016
What is a bowtie, and how can it be used?
16
Excellent communication tool
Not good for hazard identification

DNV GL © 2016 15 March 2016
Bowtie Risk Process
17
Identify – Assess – Control – Recover
Identify
Recover
Identify and Assess
Control and Recover

DNV GL © 2016 15 March 2016
Bowties link physical controls to your management system
18
Regulatory
University
Laboratory
Persons accountable (job titles)

DNV GL © 2016 15 March 2016
Accident Causation Model – James Reason

DNV GL © 2016 15 March 2016
Bowties – Brief History
20
1979
1988
1990s
2000s 2016

DNV GL © 2016 15 March 2016
Bowties - History
21
! It is said that the first ‘real’ Bowtie diagrams appeared in the (Imperial Chemistry Industry) course notes of a lecture on HAZAN (Hazard Analysis) given at The University of Queensland, Australia (in 1979), but how and when the method found its exact origin is not completely clear.
! The catastrophic incident on the Piper Alpha platform in 1988 awoke the oil & gas industry. After the report of Lord Cullen, who concluded that there was far too little understanding of Hazards and their accompanying risks that are part of operations, the urge rose to gain more insight in the causality of seemingly independent events and conditions and to develop a systematic/systemic way of assuring Barrier over these Hazards.
! In the early nineties the Royal Dutch / Shell Group adopted the Bowtie method as company standard for analysing and managing risks. Shell facilitated extensive research in the application of the Bowtie method and developed a strict rule set for the definition of all parts, based on their ideas of best practice. The primary motivation of Shell was the necessity of assurance that appropriate risk Barriers are consistently in place throughout all worldwide operations.
! Following Shell, the Bowtie method rapidly gained support throughout the industry, as Bowtie diagrams appeared to be a suitable visual tool to keep overview of risk management practices, rather than replacing any of the commonly used systems.
! In the last decade the Bowtie method also spread outside of the oil & gas industry to include aviation, mining, maritime, chemical and health care to name a few.
DNV GL © 2016 15 March 2016
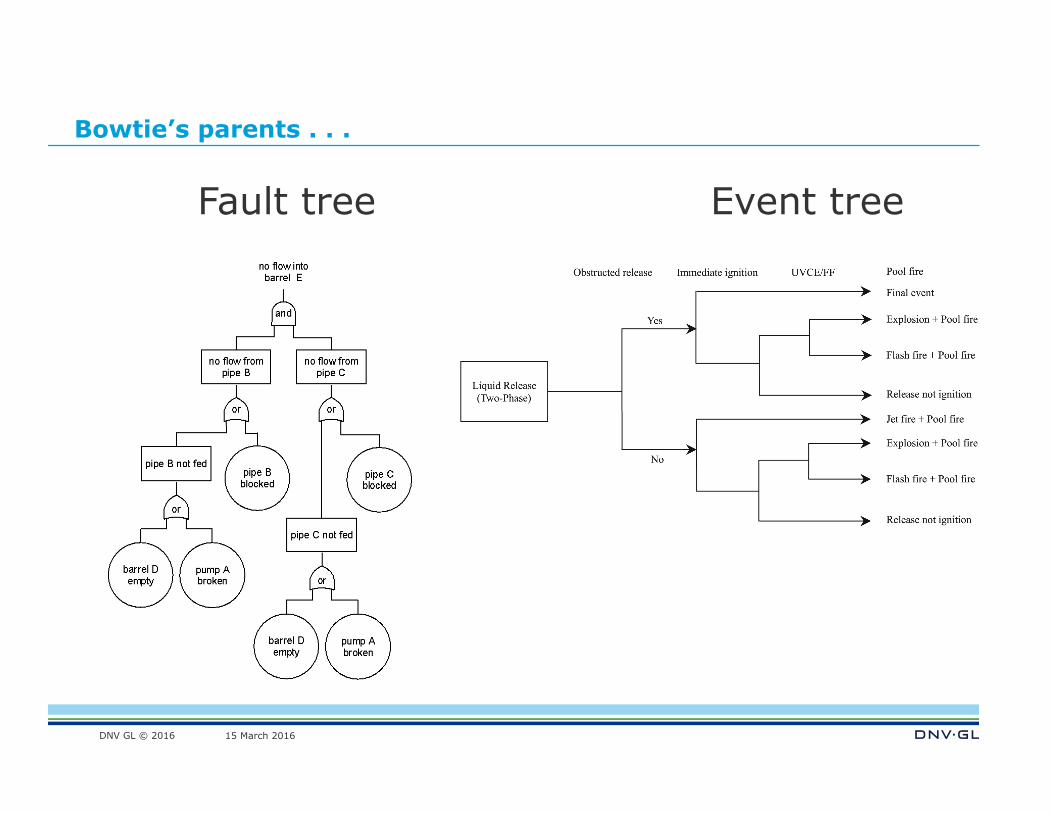
Bowtie’s parents . . .
Event tree Fault tree

DNV GL © 2016 15 March 2016
. . . Connect them
Causation Top Event Consequences

DNV GL © 2016 15 March 2016
. . . Flatten them out = Bowtie
Threats ⇒ Prevention barriers ⇒ Top Event ⇒ Mitigation Barriers ⇒ Consequences

DNV GL © 2016 15 March 2016
Next
! Discuss bowtie elements ! Best practices, do’s and don’ts
! Class exercise – identify the bowtie faults
25

DNV GL © 2016 15 March 2016
Example Bowtie diagram
! Underpinned by Fault Tree and Event Tree methodology ! Excellent tool for hazard and risk communication
– Simple for a diverse team to understand
– But easy to get it wrong
26

DNV GL © 2016 15 March 2016
Best practices
! Construct in order: 1. Hazard / Top Event (most important step) 2. All Consequences
3. All Threats
4. Preventive Barriers 5. Mitigation Barriers
6. Escalation Factors

DNV GL © 2016 15 March 2016
Example – Do’s and Don’ts
28
ISO 17776, Haz-01.02 Hydrocarbons in Formation
Anything wrong?

DNV GL © 2016 15 March 2016
Example – Do’s and Don’ts
29
ISO 17776, Haz-01.02 Hydrocarbons in Formation
(Expanded)
What are you communicating? Who is your audience?

DNV GL © 2016 15 March 2016
What’s wrong with this bowtie? - Driving
30

DNV GL © 2016 15 March 2016
What’s wrong with this bowtie? - Driving
31
Better?

DNV GL © 2016 15 March 2016
What’s wrong with this bowtie? - Titanic
32

DNV GL © 2016 15 March 2016
What’s wrong with this bowtie? - Titanic
Hazard / Top Event are better - what about the barriers?
33

DNV GL © 2016 15 March 2016
What’s wrong with this bowtie? - Titanic
34
Corrected Bowtie

DNV GL © 2016 15 March 2016
What is wrong with this Bowtie? - Chemical
35

DNV GL © 2016 15 March 2016
What is wrong with this Bowtie? - Chemical
36

DNV GL © 2016 15 March 2016
What is wrong with this Bowtie? - Chemical
37

DNV GL © 2016 15 March 2016
What is wrong with this Bowtie? - Chemical
38

DNV GL © 2016 15 March 2016
What is wrong with this Bowtie? – Laboratory
39

DNV GL © 2016 15 March 2016
What is wrong with this Bowtie? – Laboratory
40

DNV GL © 2016 15 March 2016
Next
! Group workshops – Instructors will assign groups
– 15mins to work on 1st exercise + 5mins class discussion
– 30mins for 2nd exercise
– Then review CSB investigation of laboratory incident and final group work
41

DNV GL © 2016 15 March 2016
Exercise 1 – Example solution
42

DNV GL © 2016 15 March 2016
Exercise 2 – Copper Digestion
43

DNV GL © 2016 15 March 2016
Exercise 2 – Example solution
44

DNV GL © 2016 15 March 2016
Exercise 3 – TTU Incident
45

DNV GL © 2016 15 March 2016
Exercise 3 – Example TTU Solution
46

DNV GL © 2016 15 March 2016
Exercise 3 – Example TTU Solution - Barrier Incident Diagram
47

DNV GL © 2016 15 March 2016
Conclusions
48

DNV GL © 2016 15 March 2016
SAFER, SMARTER, GREENER
www.dnvgl.com
End
49

DNV GL © 2016 15 March 2016
Bowtie Risk Model
Prevention Mitigation
50

DNV GL © 2016 15 March 2016
What is wrong with this Bowtie? - Mechanical
51

DNV GL © 2016 15 March 2016
What is wrong with this Bowtie? - Mechanical
52

DNV GL © 2016 15 March 2016
Crane Ops - Are these Controls independent?
53

DNV GL © 2016 15 March 2016
Crane Ops - Are these Controls independent?
54

DNV GL © 2016 15 March 2016
Bowtie Analysis – What it really looks like
! Large number of routes ! Large number of barriers ! Only some are critical
! Easier to analyze ! Easier to communicate
55

DNV GL © 2016 15 March 2016
Bowtie Example - Driving Vehicle
56