Introduction to Biostatistics Dr. M. H. Rahbar Professor of Biostatistics Department of Epidemiology...
34
Introduction to Biostatistics Dr. M. H. Rahbar Professor of Biostatistics Department of Epidemiology Director, Data Coordinating Center College of Human Medicine Michigan State University
-
Upload
wendy-dawson -
Category
Documents
-
view
224 -
download
1
Transcript of Introduction to Biostatistics Dr. M. H. Rahbar Professor of Biostatistics Department of Epidemiology...
Introduction to Biostatistics
Dr. M. H. RahbarProfessor of Biostatistics
Department of Epidemiology
Director, Data Coordinating Center
College of Human Medicine
Michigan State University
What does “STATISTICS” mean?
The word “Statistics” has several meanings:2. It is frequently used in referring to recorded
data 3. Statistics also denotes characteristics calculated
for a set of data, for example, sample mean 4. Statistics also refers to statistical methodology,
techniques and procedures dealing with the design of experiments, collection, organization, analysis of the information contained in a data set to make inferences about the population parameters
What do statisticians do?
• To guide the design of an experiment or survey prior to the data collection
2. To analyze data using proper statistical
procedures and techniques
3. To present and interpret results to the researchers and other decision makers including the government and industries
WHY STUDY STATISTICS? • Knowledge of statistics is essential for people
going into research, management or graduate study
• Basic understanding of statistics is useful for conducting investigations and an effective presentation
• Understanding of statistics can help anyone discriminate between fact and fancy in daily life
• A course in statistics should help one know when, and for what, a statistician should be consulted
Definition of Population & Sample A population is a set of measurements of interest to the researcher.Examples:1. Income of households living in Karachi 2. The number of children in families living Pakistan 3. The health status of adults in a community
A subset of the population is called sample. A sample is usually selected such that it is representative of the population
Descriptive & Inferential Statistics 1. Descriptive Statistics deal with the enumeration, organization and graphical representation of data 2. Inferential Statistics are concerned with reaching conclusions from incomplete information, that is, generalizing from the specific sample
An example of inferential statistics include using available information about the health status of people in a sample to draw inferences about the underlying population from which the sample is selected
INFERENTIAL STATISTICS
The objective of inferential statistics is to make inference about the population parameters based on the information contained in the sample.
1. Estimation (e.g., Estimating the prevalence of hypertension among adults living in Karachi)
2. Testing Hypothesis (e.g., Testing the effectiveness of a new drug for reducing cholesterol levels)
Sources of Data Data may come from different sources: 1. Surveillance systems (e.g., NIH) 2. Planned surveys (Government, Universities,
NGOs)3. Experiments (Pharmaceutical Companies)4. Health Organizations (Administrative Data sets)5. Private sector (Banks, Companies, etc) 6. Government (All government agencies)
Here we will focus on surveys and experiments What is the difference between a survey and an
experiment?
Difference between Surveys & Experiments
A Survey Data represent observations of events or phenomena over which few, if any, controls are imposed.
(e.g., Assessing the association between different lifestyles and heart disease)
In an experiment we design a research plan purposely to impose controls over the amount of exposure (treatment) to a drug. (e.g., Clinical Trials)
Sampling Methods
• Random Sampling (Simple)
• Systematic Sampling
• Stratified Sampling
4. Cluster Sampling
5. Convenience Sampling
6. More complex sampling

Some Epidemiologic StudiesRetrospective Studies:Retrospective Studies gather past data from selected cases and controls to determine difference, if any, in the exposure to a suspected factor. They are commonly referred to as case-control studiesProspective Studies:Prospective studies are usually cohort studies in which one enrolls a group of healthy people and follows them over a certain period to determine the frequency with which a disease develops
Qualitative and Quantitative Variables
Examples of qualitative variables are occupation, sex, marital status, and etc
Variables that yield observations that can be measured are considered to be quantitative variables. Examples of quantitative variables are weight, height, and age Quantitative variables can further be classified as discrete or continuous
VARIABLES TYPES
1. Categorical variables (e.g., Sex, Marital Status, income category)
2. Continuous variables (e.g., Age, income, weight, height, time to achieve an outcome)
3. Discrete variables (e.g.,Number of Children in a family)
4. Binary or Dichotomous variables (e.g., response to all Yes or No type of questions)
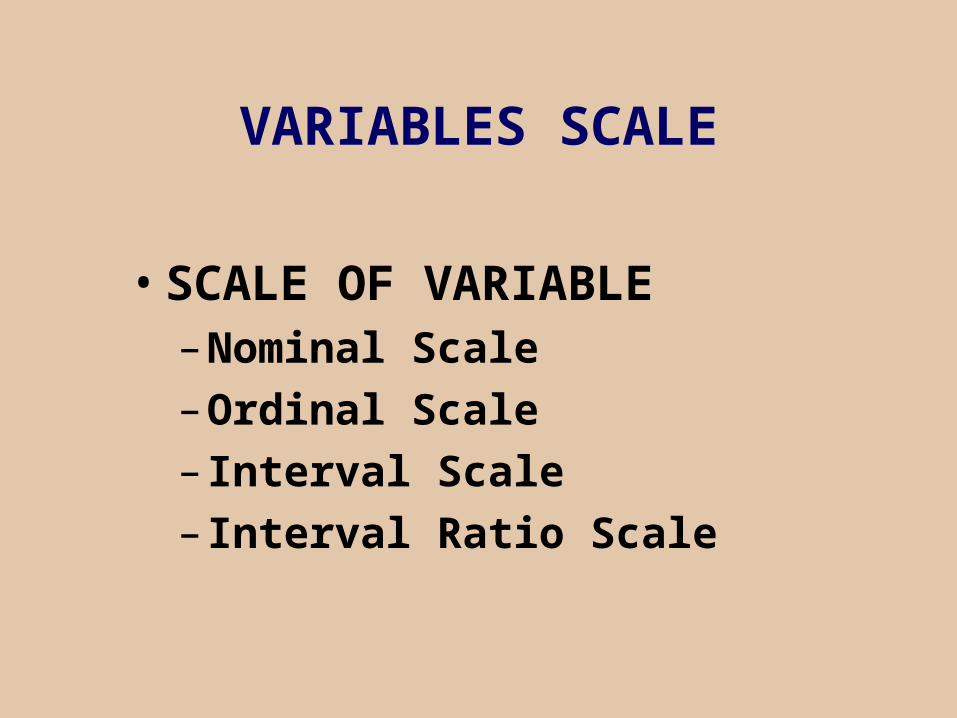
VARIABLES SCALE
• SCALE OF VARIABLE– Nominal Scale
– Ordinal Scale
– Interval Scale
– Interval Ratio Scale
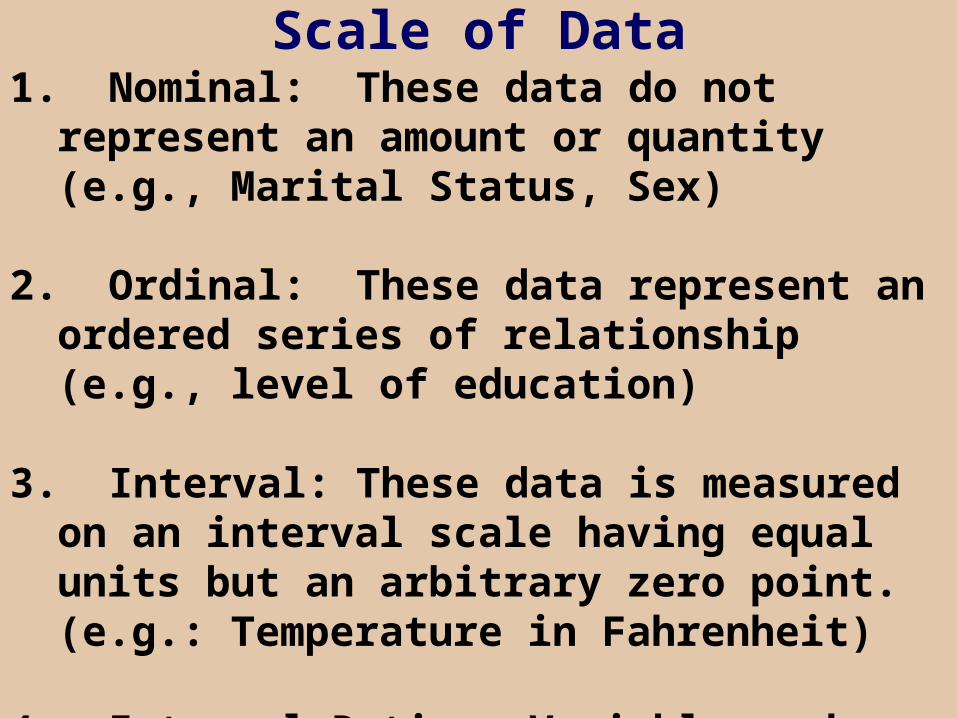
Scale of Data1. Nominal: These data do not represent an amount
or quantity (e.g., Marital Status, Sex)
2. Ordinal: These data represent an ordered series of relationship (e.g., level of education)
3. Interval: These data is measured on an interval scale having equal units but an arbitrary zero point. (e.g.: Temperature in Fahrenheit)
4. Interval Ratio: Variable such as weight for which we can compare meaningfully one weight versus another (say, 100 Kg is twice 50 Kg)

VARIABLES IN THE PROTOCOL
• TYPES OF VARIABLE– independent
– dependent
– intermediate
– confounding
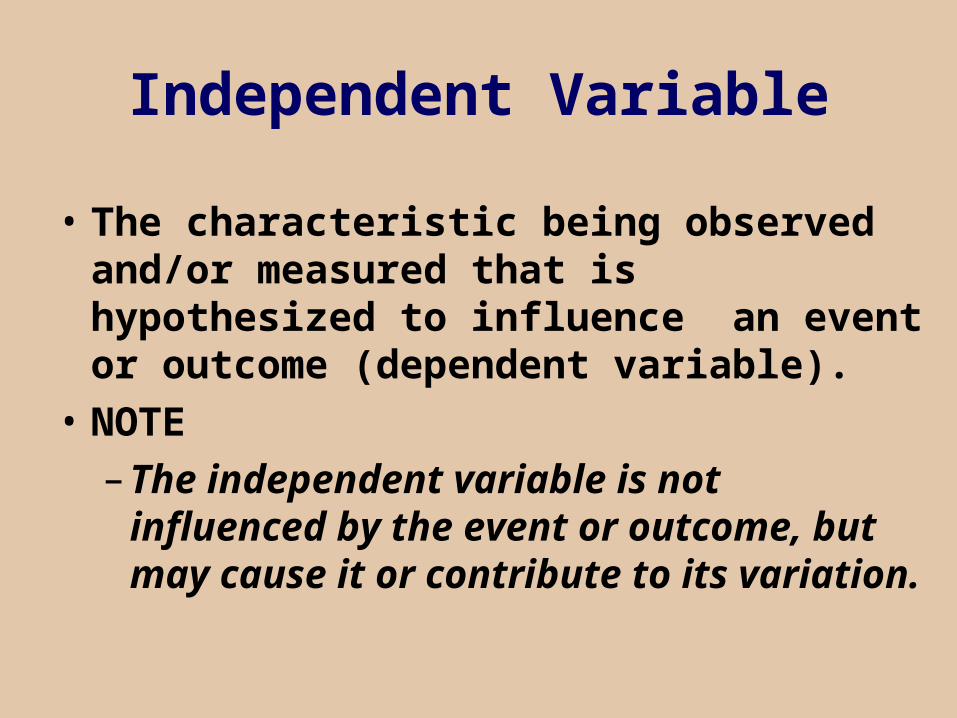
Independent Variable
• The characteristic being observed and/or measured that is hypothesized to influence an event or outcome (dependent variable).
• NOTE
– The independent variable is not influenced by the event or outcome, but may cause it or contribute to its variation.

Dependent Variable
• A variable whose value is dependent on the effect of other variables (ie., “independent variables”) in the relationship being studied. Synonyms: outcome or response variable.
• NOTE– an event or outcome whose variation we
seek to explain or account for by the influence of independent variables.
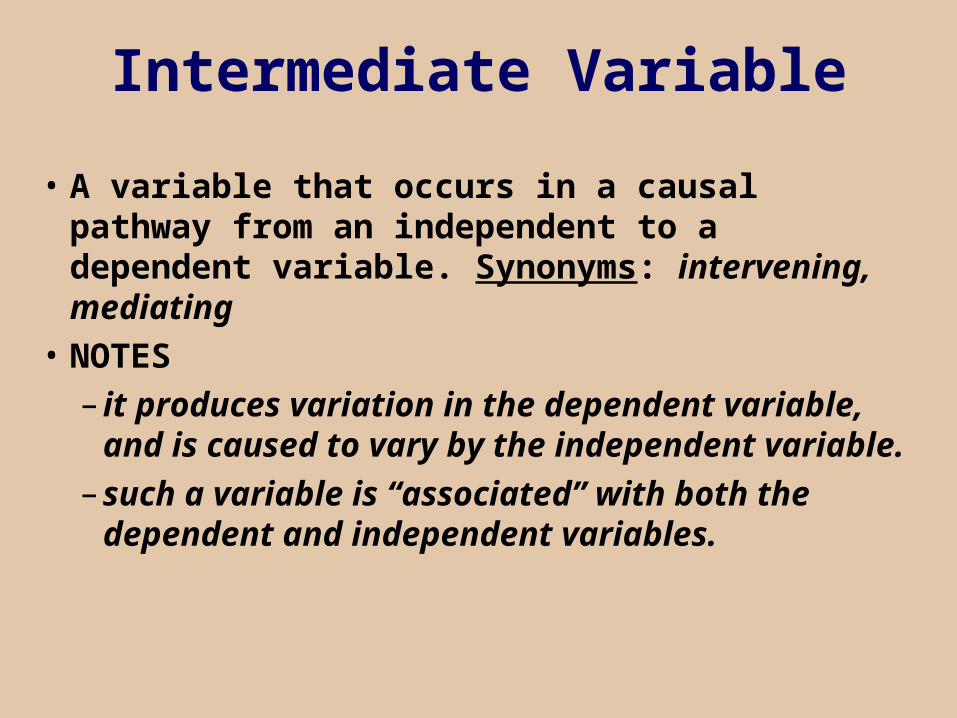
Intermediate Variable
• A variable that occurs in a causal pathway from an independent to a dependent variable. Synonyms: intervening, mediating
• NOTES
– it produces variation in the dependent variable, and is caused to vary by the independent variable.
– such a variable is “associated” with both the dependent and independent variables.
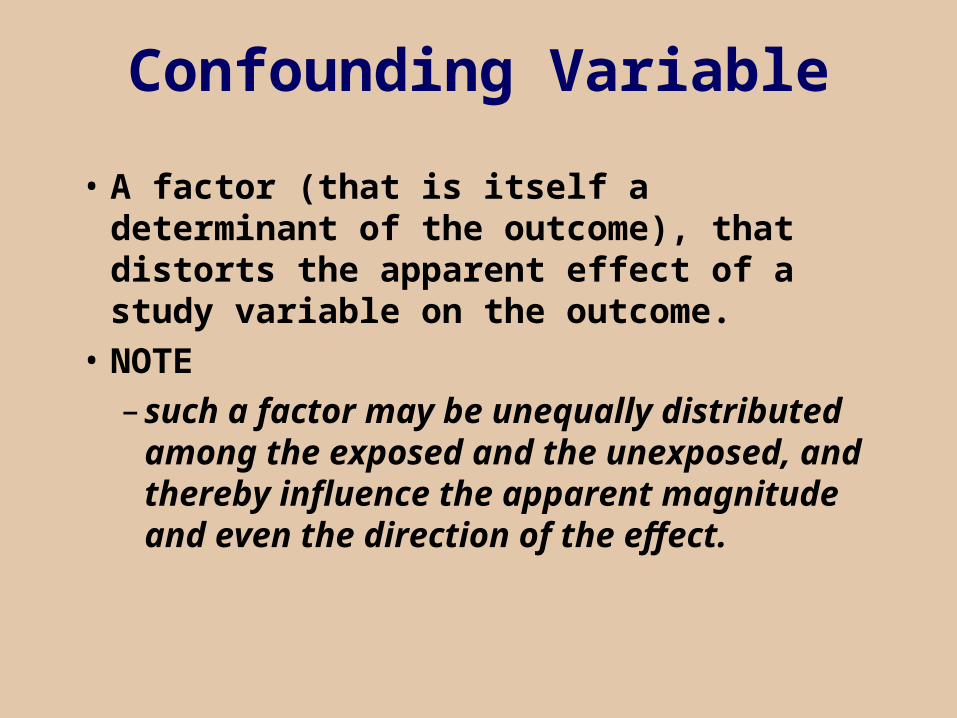
Confounding Variable
• A factor (that is itself a determinant of the outcome), that distorts the apparent effect of a study variable on the outcome.
• NOTE
– such a factor may be unequally distributed among the exposed and the unexposed, and thereby influence the apparent magnitude and even the direction of the effect.
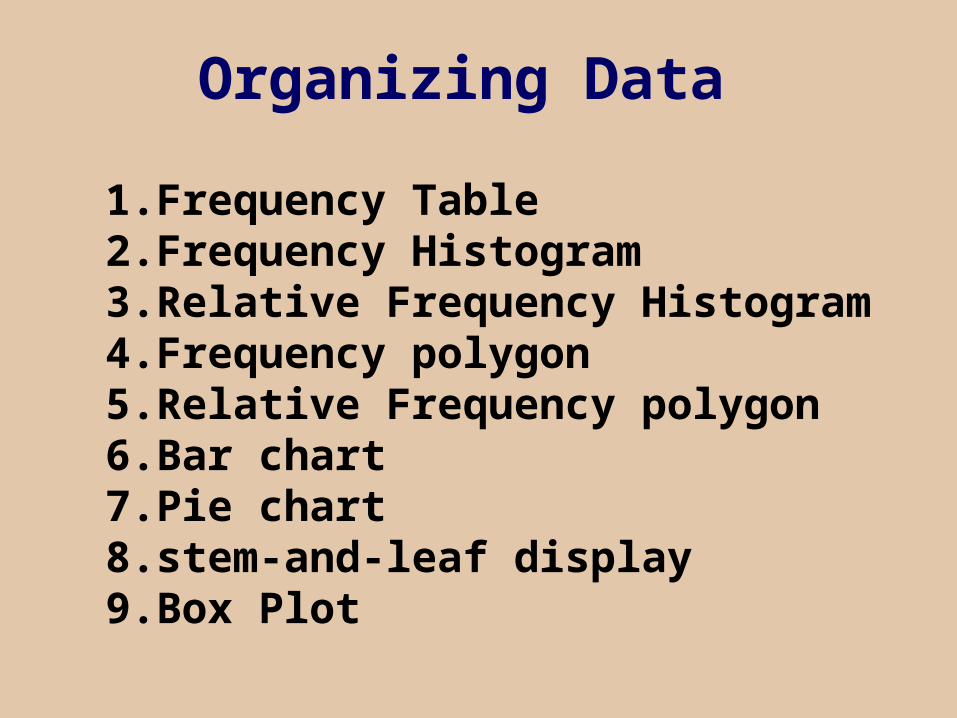
Organizing Data
1. Frequency Table 2. Frequency Histogram 3. Relative Frequency Histogram4. Frequency polygon5. Relative Frequency polygon6. Bar chart7. Pie chart 8. stem-and-leaf display9. Box Plot
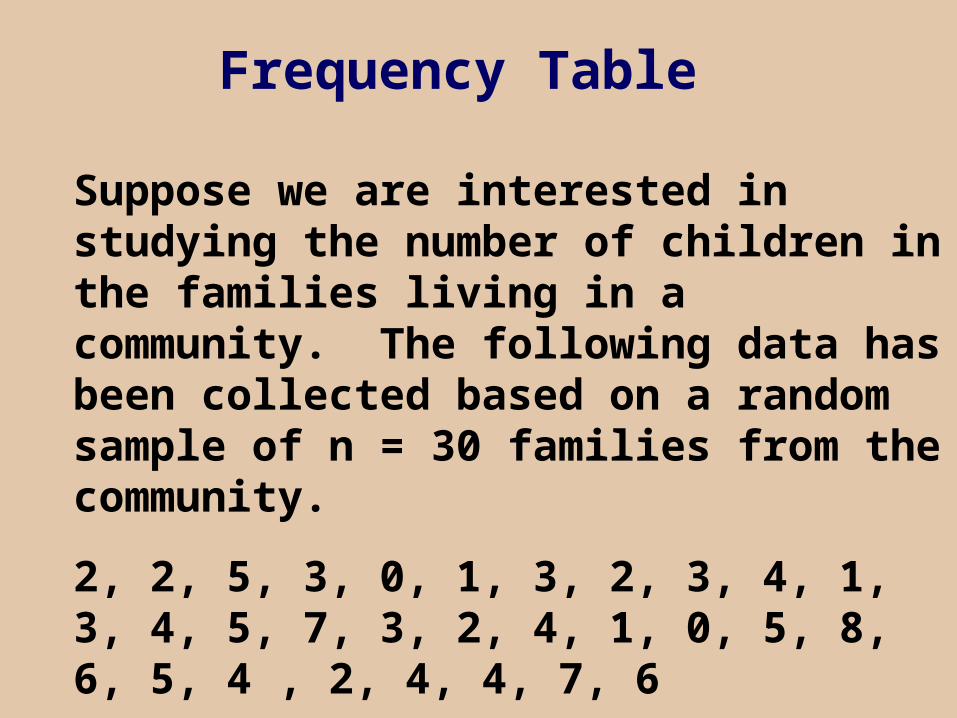
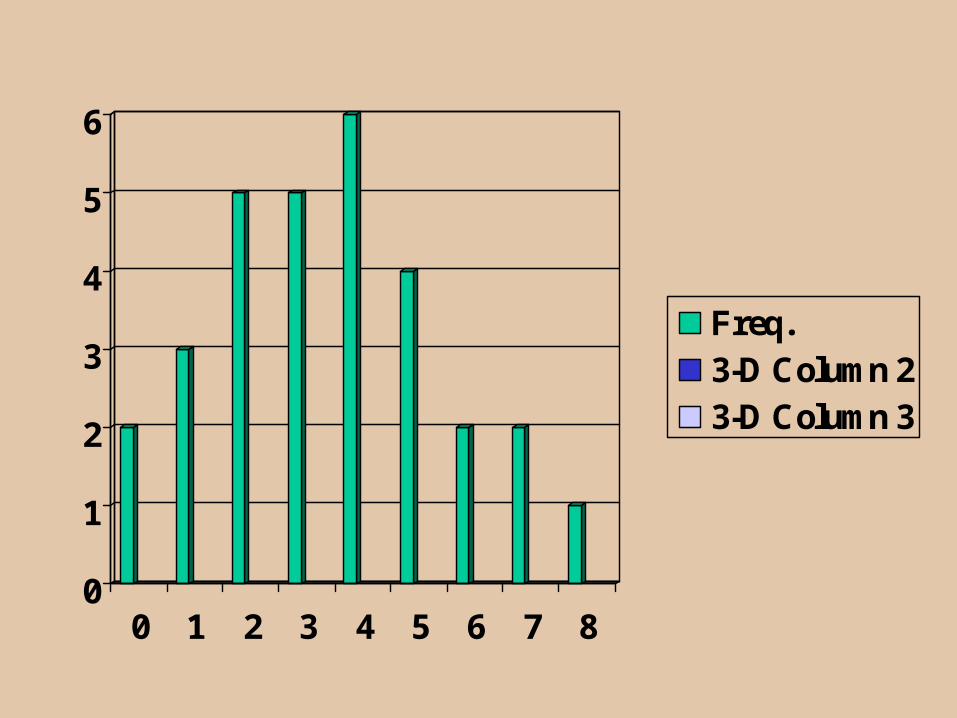
Frequency Table
Suppose we are interested in studying the number of children in the families living in a community. The following data has been collected based on a random sample of n = 30 families from the community.
2, 2, 5, 3, 0, 1, 3, 2, 3, 4, 1, 3, 4, 5, 7, 3, 2, 4, 1, 0, 5, 8, 6, 5, 4 , 2, 4, 4, 7, 6
Organize this data in a Frequency Table!
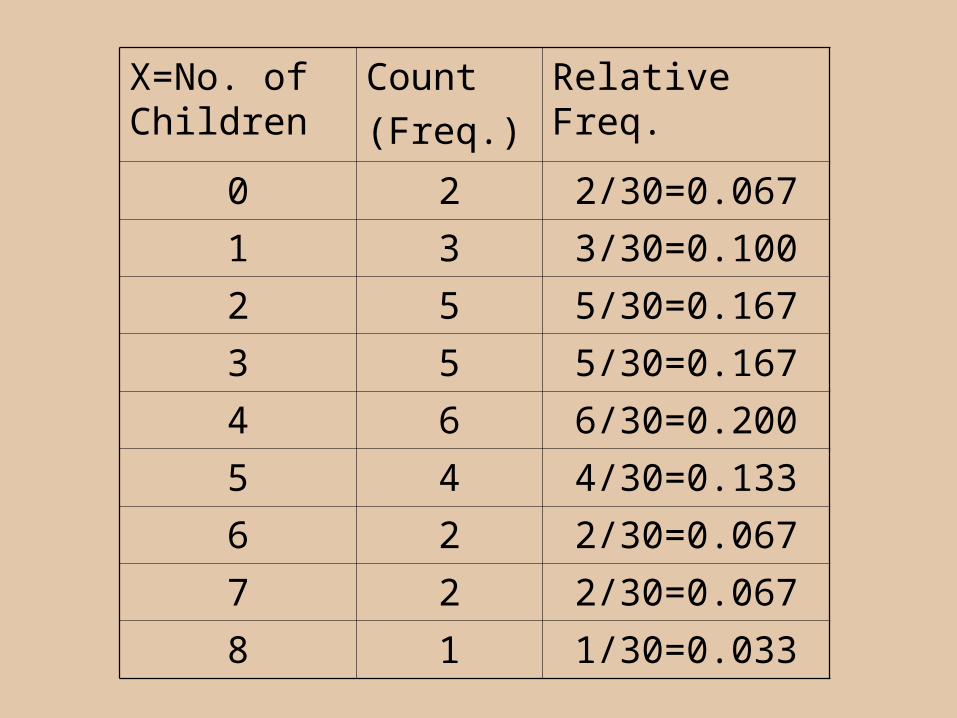
X=No. of Children
Count
(Freq.)
Relative Freq.
0 2 2/30=0.067
1 3 3/30=0.100
2 5 5/30=0.167
3 5 5/30=0.167
4 6 6/30=0.200
5 4 4/30=0.133
6 2 2/30=0.067
7 2 2/30=0.067
8 1 1/30=0.033
0
1
2
3
4
5
6
0 1 2 3 4 5 6 7 8
Freq.3-D Column 23-D Column 3
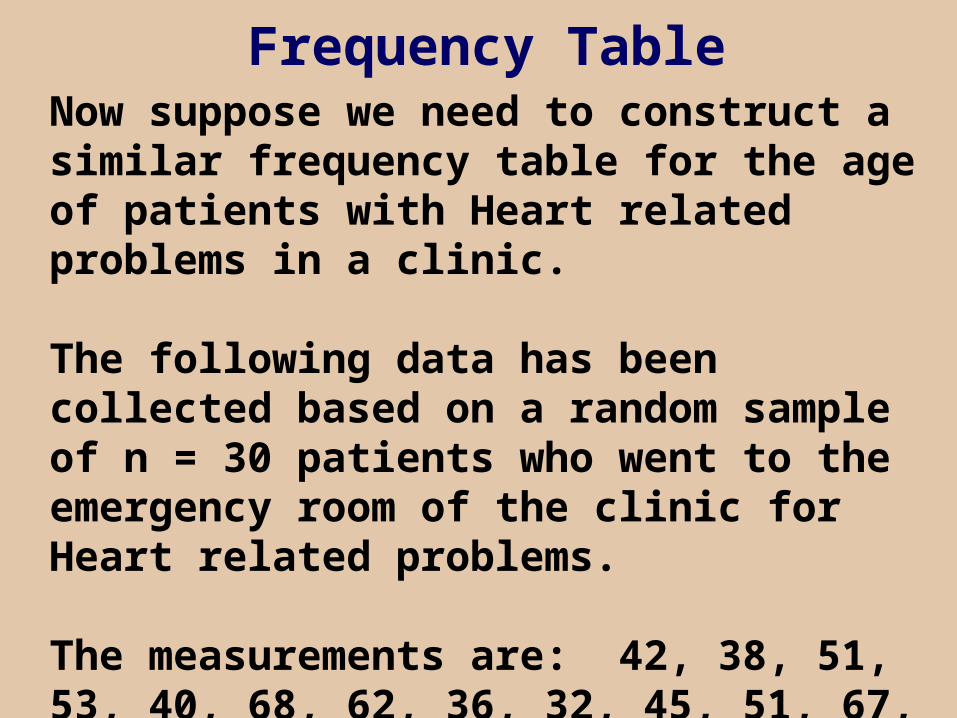
Frequency TableNow suppose we need to construct a similar frequency table for the age of patients with Heart related problems in a clinic.
The following data has been collected based on a random sample of n = 30 patients who went to the emergency room of the clinic for Heart related problems.
The measurements are: 42, 38, 51, 53, 40, 68, 62, 36, 32, 45, 51, 67, 53, 59, 47, 63, 52, 64, 61, 43, 56, 58, 66, 54, 56, 52, 40, 55, 72, 69.
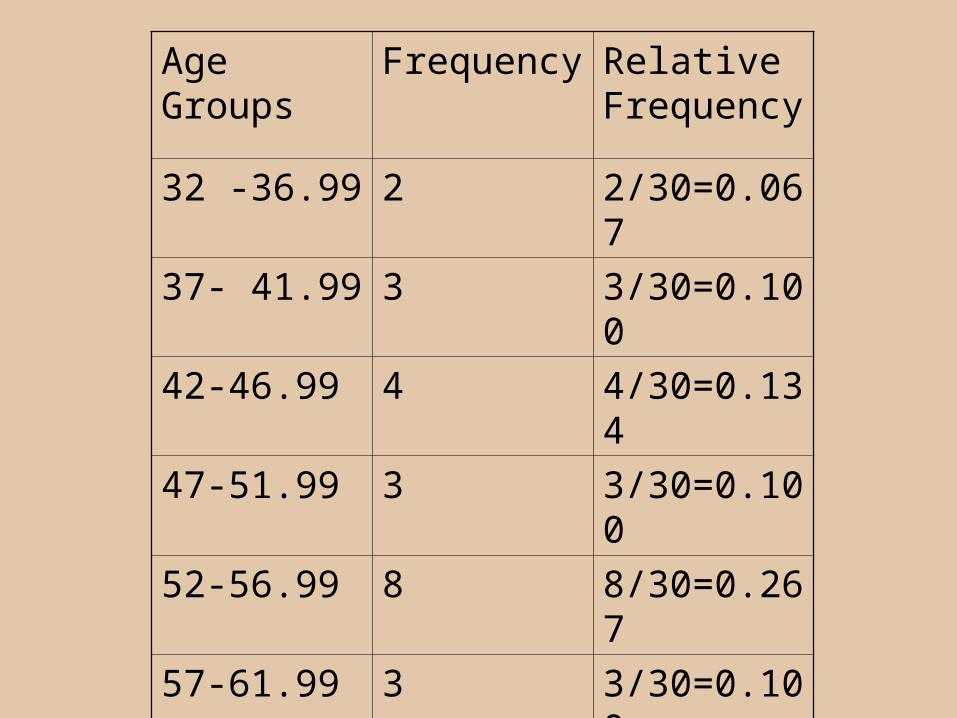
Age Groups Frequency Relative Frequency
32 -36.99 2 2/30=0.067
37- 41.99 3 3/30=0.100
42-46.99 4 4/30=0.134
47-51.99 3 3/30=0.100
52-56.99 8 8/30=0.267
57-61.99 3 3/30=0.100
62-66.99 4 4/30=0.134
67-72 3 3/30=0.100
Total n=30 1.00
Measures of Central Tendency
Where is the heart of distribution?
1. Mean 2. Median
3. Mode
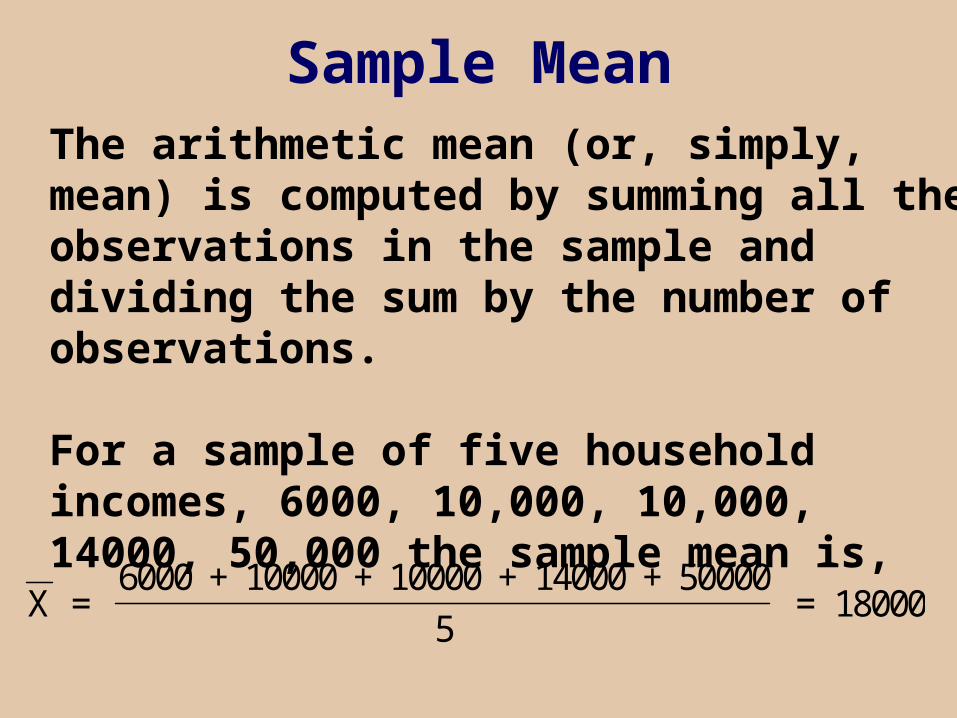
Sample MeanThe arithmetic mean (or, simply, mean) is computed by summing all the observations in the sample and dividing the sum by the number of observations.
For a sample of five household incomes, 6000, 10,000, 10,000, 14000, 50,000 the sample mean is,
X =
6000 + 10000 + 10000 + 14000 + 50000
5 = 18000
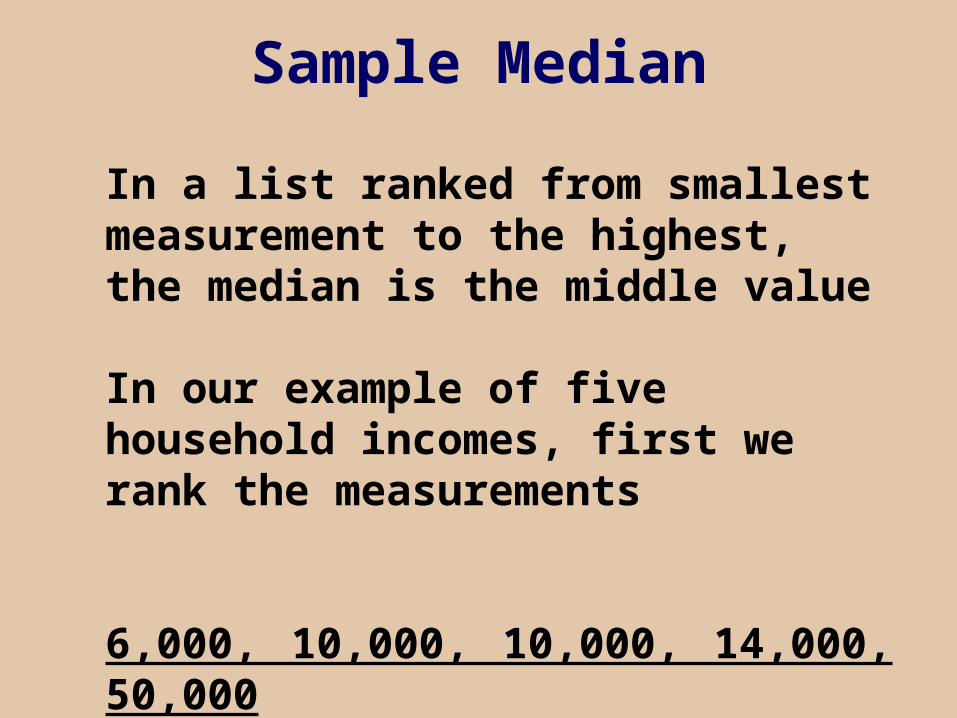
Sample Median
In a list ranked from smallest measurement to the highest, the median is the middle value
In our example of five household incomes, first we rank the measurements
6,000, 10,000, 10,000, 14,000, 50,000 Sample Median is 10,000
Measures of Dispersion or Variability
1. Range
2. Variance
3. Standard deviation
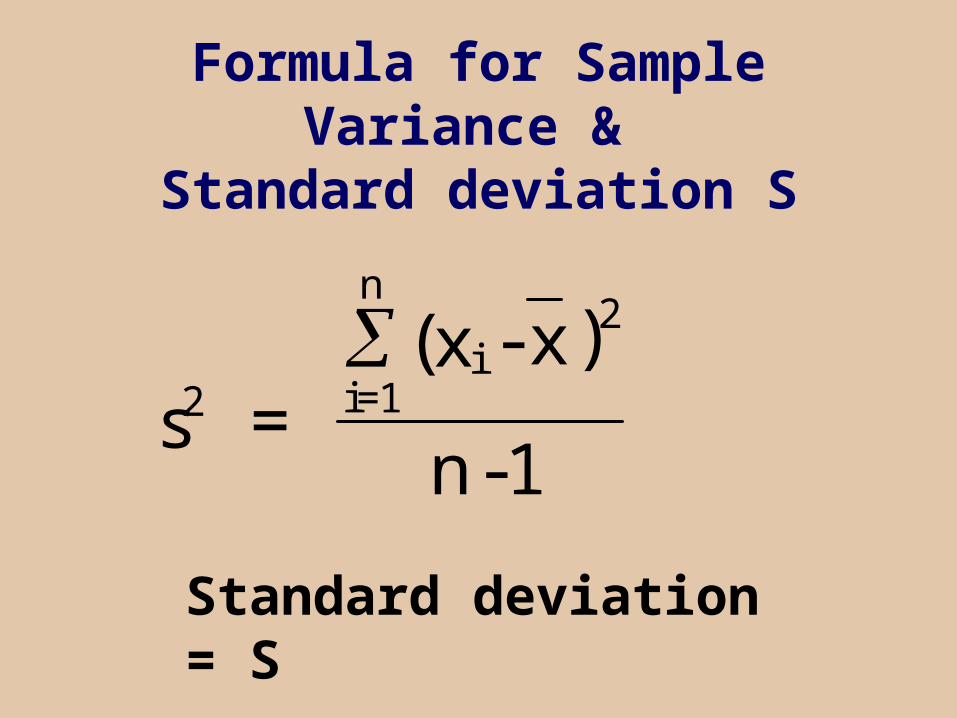
Formula for Sample Variance & Standard deviation S
2 i=1
n
i2
s = (x - x )
n -1
Standard deviation = S

Calculation of Variance and Standard deviation
2 2 2 22 (6000 -18000 +(10000 -18000 +(10000 -18000 +(14000 -18000)+(50000 -18000) ) ) ) = =S
5 -1
2 = 328,000,000SS 18110.77
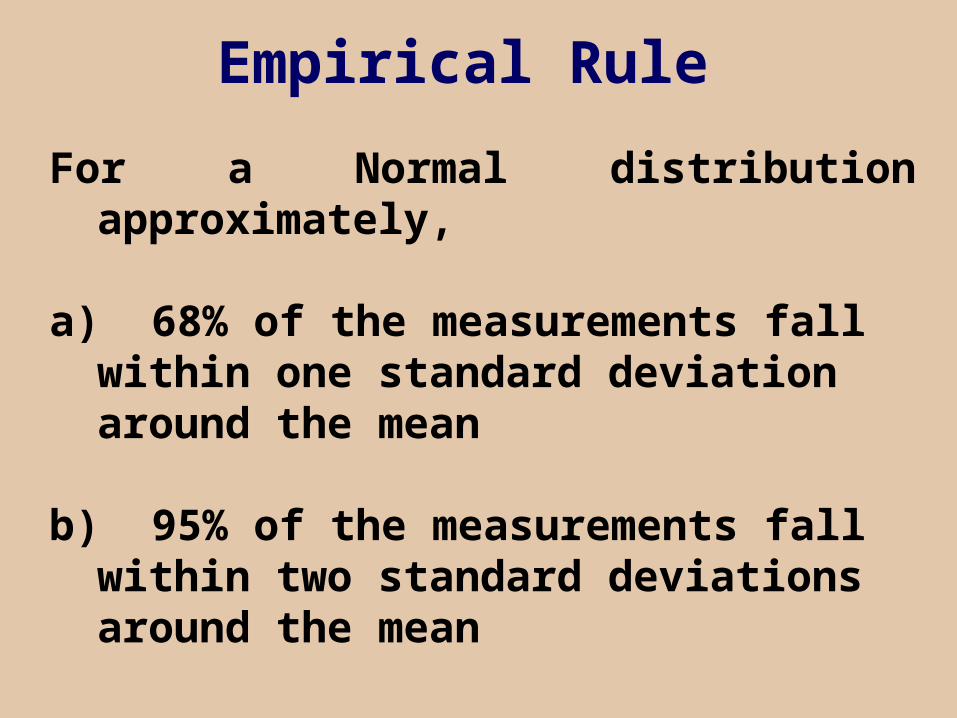
Empirical Rule
For a Normal distribution approximately, a) 68% of the measurements fall within one
standard deviation around the mean
b) 95% of the measurements fall within two standard deviations around the mean
c) 99.7% of the measurements fall within three standard deviations around the mean
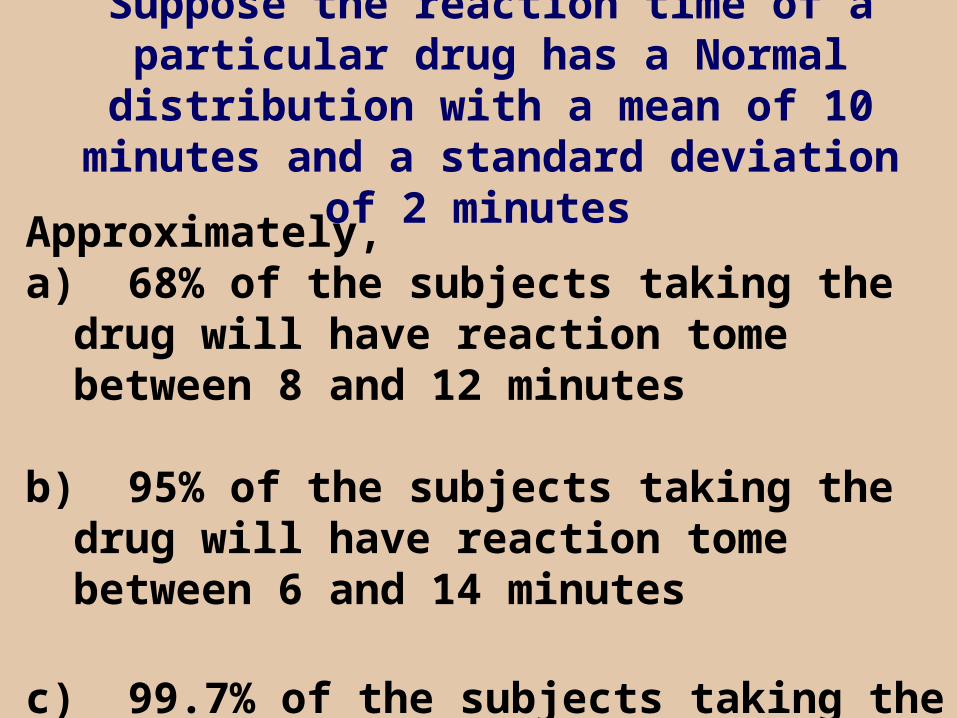
Suppose the reaction time of a particular drug has a Normal distribution with a mean of 10
minutes and a standard deviation of 2 minutes
Approximately,a) 68% of the subjects taking the drug will have
reaction tome between 8 and 12 minutes
b) 95% of the subjects taking the drug will have reaction tome between 6 and 14 minutes
c) 99.7% of the subjects taking the drug will have reaction tome between 4 and 16 minutes