Introduction of Mobility laboratory & Collaboration with CALTECH Noriko Shimomura Nissan Mobility...
35
Introduction of Mobility Introduction of Mobility laboratory laboratory & & Collaboration with CALTECH Collaboration with CALTECH Noriko Shimomura Nissan Mobility Laboratory
-
Upload
georgina-walker -
Category
Documents
-
view
219 -
download
0
Transcript of Introduction of Mobility laboratory & Collaboration with CALTECH Noriko Shimomura Nissan Mobility...

Introduction of Mobility laboratory Introduction of Mobility laboratory & &
Collaboration with CALTECHCollaboration with CALTECH
Noriko ShimomuraNissan Mobility Laboratory

Objective of this presentation
1. Mobility laboratory & our aims
2. Examples of our research
3. Collaboration with CALTECH by Sep. 2008
- Introduce Nissan’s researches and needs- have good collaboration by Sep. 2008
Contents
Alarm Controller
Sensor
Mobility Laboratory - Vehicle control
- Human machine interface
- Object detection, Road environment recognition
Our aim - Reducing traffic accidents
- Providing new driving assistance systems
- Improving autonomous vehicle technology
Mobility Laboratory & our aims

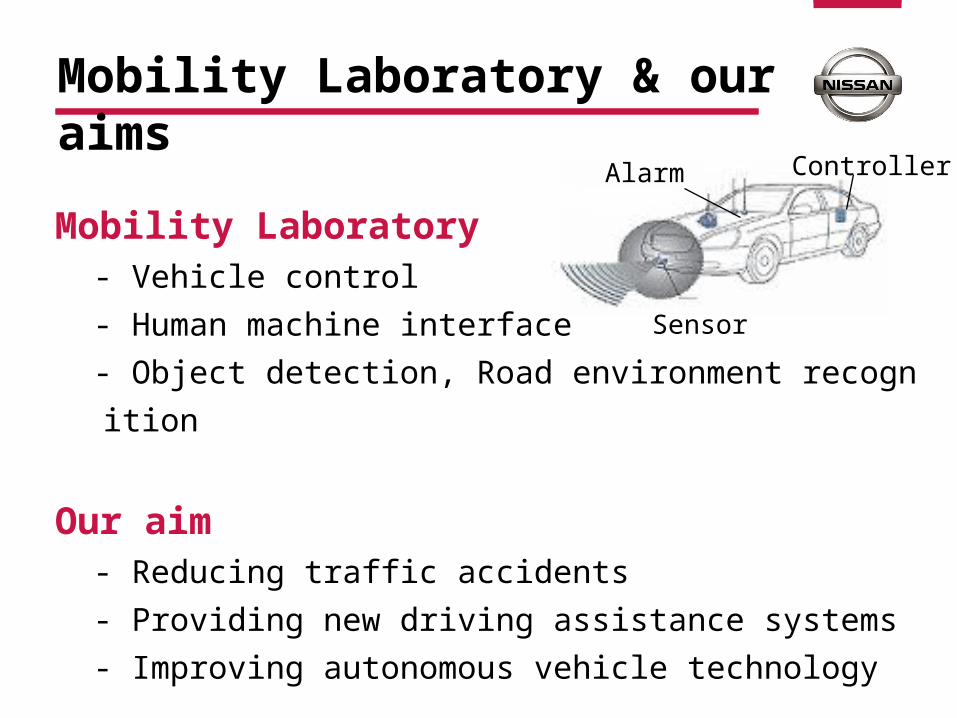
Camera
Laser radar
1. Forward environment recognition using laser radar and camera
2. Nighttime driving support system using infra-red camera
!
Examples of our research
Z
X
YAxis of lens
Camera
Scanning Laser Radar
Scan area
Sensor Configuration
Forward environment recognition

Example of Observed Sensor Data

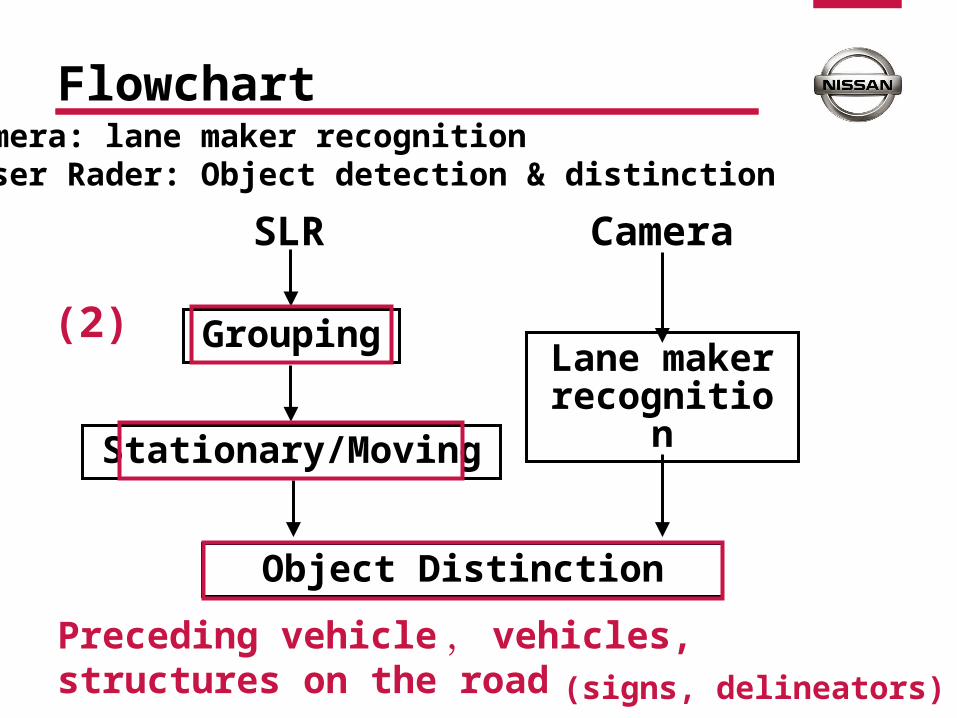
SLR
Lane maker recognition
Camera
Grouping
Stationary/Moving
Object Distinction
Preceding vehicle , vehicles, structures on the road
(2) (1)
(signs, delineators)
Camera: lane maker recognitionLaser Rader: Object detection & distinction
Flowchart

Outline of Lane Maker Recognition
Y
P(x,y,z)
YI
OX
Axis of lensZ
fCamera
X I
Height from the road surfaceDy
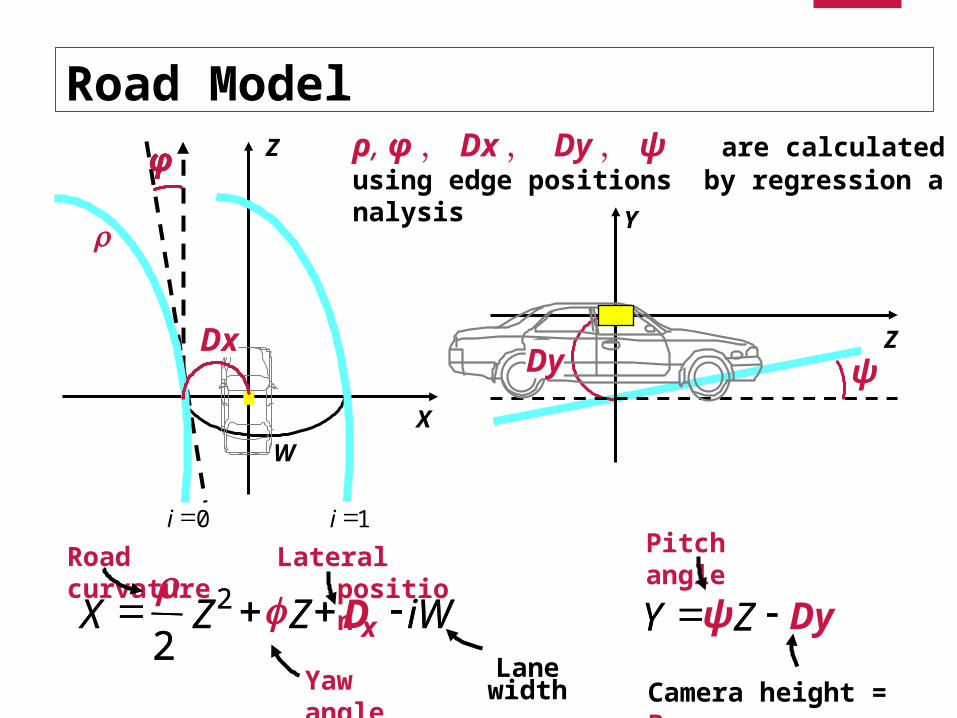
Road Model : X = (ρ/2)・ Z2 + φ・ Z – Dx+ i・ W
( i=0,1)
Y = ψ・ Z + Dy
Camera position : Dx, Dy, θ , φ , ψ ( θ=0 )
Dx
W
ρ, φ, Dx, Dy, ψ are calculated using edge positions by regression analysis
Lane width edge positions
i=0left line right line
image example
i=1

Image input
Detection region determination
edge point detection
Parameters on the previous image
Lane maker detection
Edge image by Sobel operator
Parameter estimation
Edge image
CurvaturesPitch angleYaw angle
Lateral positionBounce
edge point on lane maker
Flowchart & edge point detection
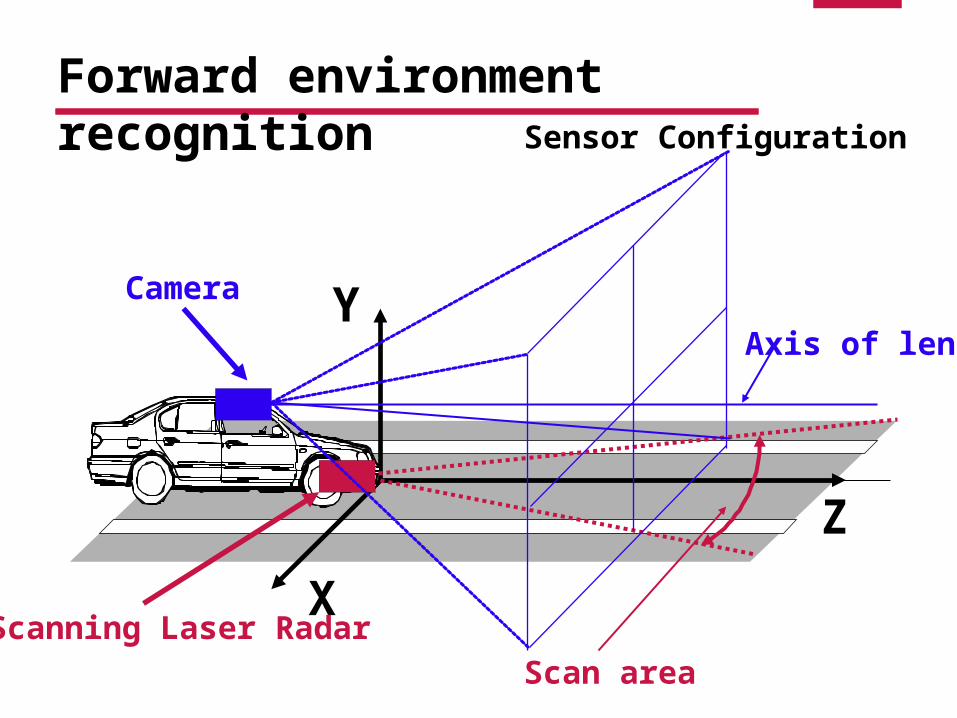
Recognition result

Recognition result (rainy day)
SLR
Lane maker recognition
Camera
Grouping
Stationary/Moving
Object Distinction
Preceding vehicle , vehicles, structures on the road
(2)
(signs, delineators)
Camera: lane maker recognitionLaser Rader: Object detection & distinction
Flowchart

Object Detection by SLR
Grouping1
Grouping2
Detected points
Delineators
Vehicles
Sign(overhead)
Z
XSLR
~ Grouping method ~
- located closely
- in the same distance- in the same direction
Delineator Vehicle

Solution to the Difficulty→ Delineator DistinctionTagging → Tag check
Z
X
Δx-
Δz+
Δz-
Δx+
Tagged objects are detected along the lane.The relative speed is not estimated correctly.
Tag
Tag

Object Distinction
Preceding vehicle
Based on ・ Stationary/Moving ・ Delineator recognition ・ Width of objects ・ Relative position to lanes
Vehicles
Road structures

(Before applying the proposed method)
Detection and Discrimination with Relative speed and Grouping
-- Preceding vehicle, vehicles, road structures --

Detection and distinction result with the proposed method-- Preceding vehicle, other vehicles, road structures --
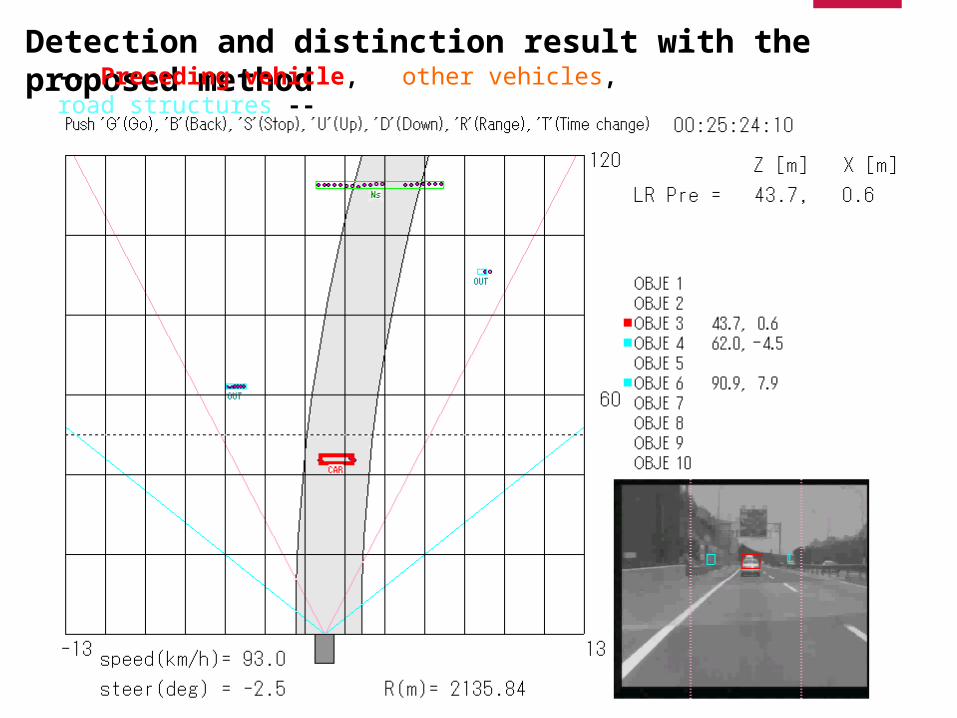
Detection and distinction result with the proposed method-- Preceding vehicle, other vehicles, road structures --

Camera
Laser radar
1. Forward environment recognition using laser radar and camera
2. Nighttime driving support system using infra-red camera
!
Examples of our researches

!
~ Adaptive Front lighting System with Infra-Red camera~Nighttime driving support system
IR CameraAFS
IR image (temperature)
IR-AFS
→ Illuminate the pedestrian by Adaptive Front lighting System
The driver can find the pedestrian easily at night
including some objects that may be pedestrians

Effect of IR-AFS

Difficulty in IR based pedestrian detection
Summer night (27℃)
Ordinary approach of pedestrian detection with IR camera
Large area has the same temperature as human
Binary image →
IR image
25 - 37℃
Binary image →
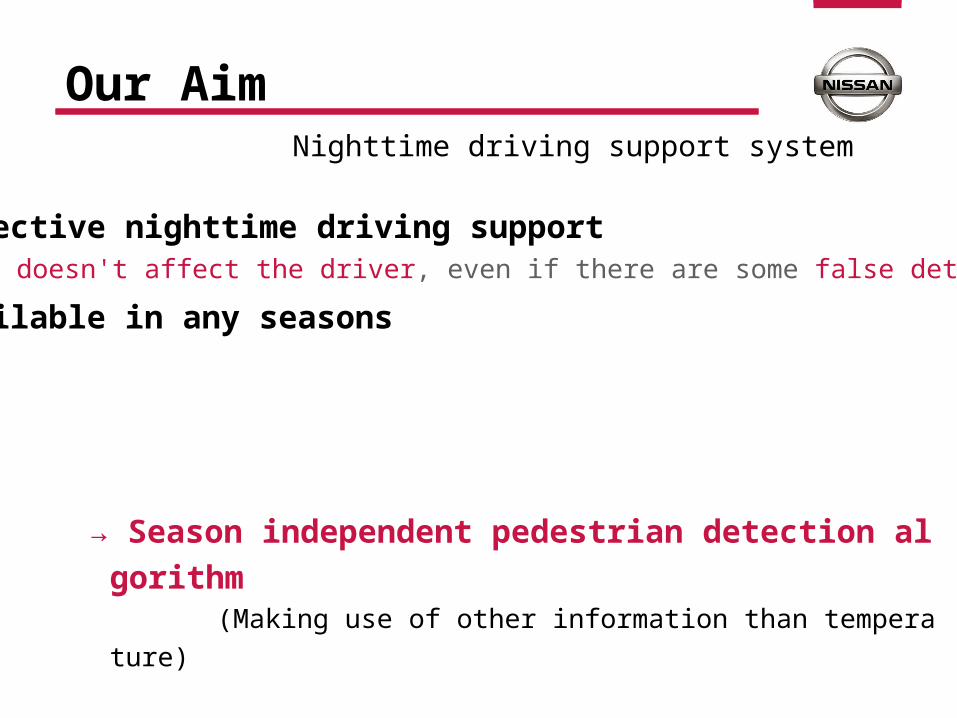
Our AimNighttime driving support system
→ Season independent pedestrian detection algorithm (Making use of other information than temperature)
• Effective nighttime driving support (It doesn't affect the driver, even if there are some false detection)
• Available in any seasons
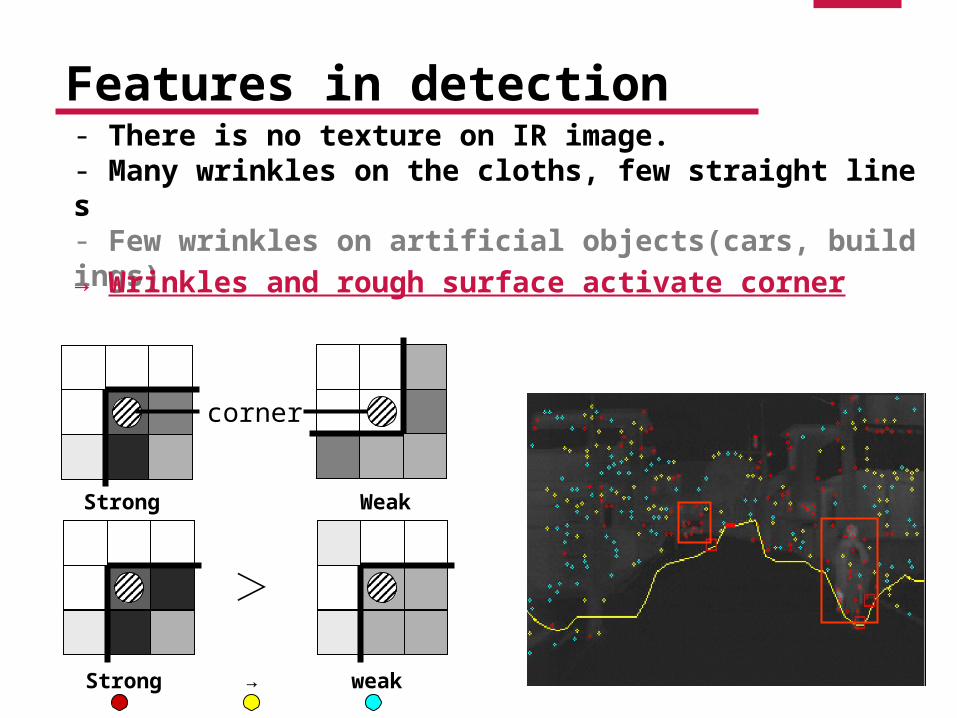
Features in detection- There is no texture on IR image.- Many wrinkles on the cloths, few straight lines- Few wrinkles on artificial objects(cars, buildings)
→ Wrinkles and rough surface activate corner filters
corner
Strong
>
Weak
weakStrong →

: Illumination Target : Detected pedestrian
Explanation of our Algorithm
: feature point
VideoVideo

Collaboration with Caltech in 2007
1. CALTECH’s technologies
2. Nissan’s needs recognition methods that we have to improve
including extension term
Collaboration w/ Vision Lab:
Want to make collaboration better
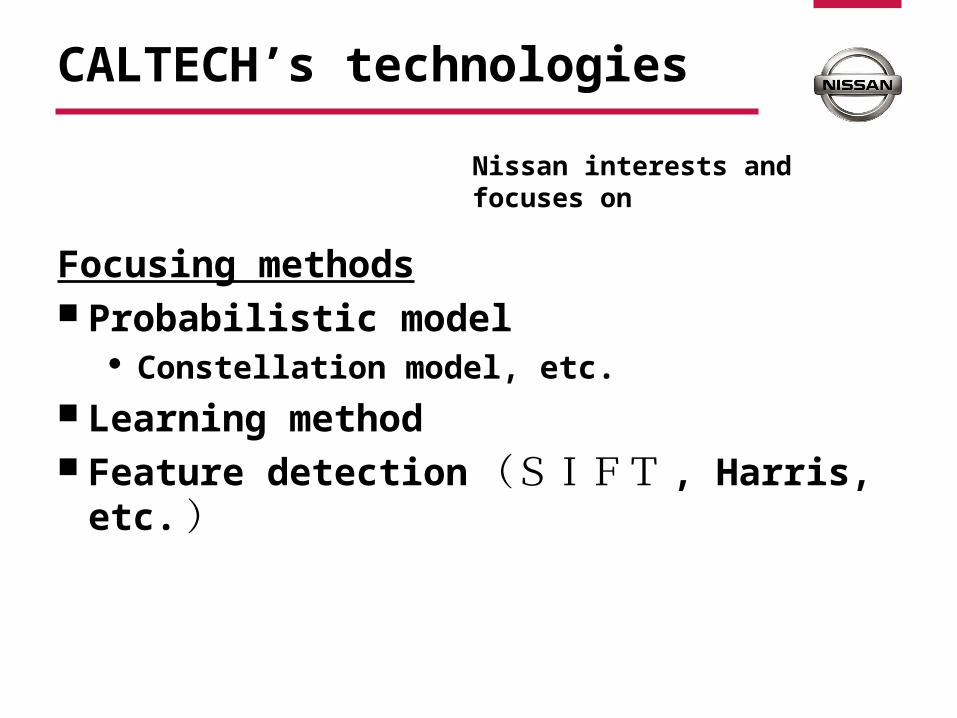
CALTECH’s technologies
Focusing methods Probabilistic model
Constellation model, etc.
Learning method Feature detection (SIFT , Harris, etc. )
Nissan interests and focuses on

Nissan needs and requirement
pedestrian detection road region recognition
(without lane markers) improved lane marker recognition
(available for many types of lane markers)

pedestrian detection

improved lane marker recognition (available for many types of lanes)
Botts' dots

road region recognition(without lane marker)

Idea for collaboration /w no cost extensionIdea for collaboration /w no cost extension
Caltech Pedestrian detection
Nissan Road region detection
Requirement for Pedestrian detection Accuracy: more than 75% False Alarm: less than 5% Min target size: 10x20 Processing time: up to 500ms (e.g. 100ms)

Schedule and Target in Sep. 2008Schedule and Target in Sep. 2008
Dataset (provided by Nissan, AVI, VGA) First dataset: by the end of Aug. 2007 Second dataset: in Jan. 2008, for validation
Deliverable in Sep. 2008 Documents of proposed method Result of experiment, detection ratio
Mit-term report & information exchange (Jan. 2008) mid-term report(minimun target size, processing time etc.) provide additional dataset for validation
75%
min target size
ROC
brain stormingstart developing new method
Sep. 07 Jan. 08
develop & improve the method
Sep. 09
validation using dataset

DeliverbleDeliverble
end of Sep.2007 Singniture of Dr. Perona on the first page Report written by Seigo Watanabe.
Jan. 2008 Mid-term report written by Post Dr. in Caltech
more concrete target(minimun target size etc.)
end of Sep. 2008 final report witten by Post Dr. in Caltech
Documents of proposed method and validation results
Road Model
iWDZZX x 2
2DyZY
Z
Y
φ
0i 1i
Z
X
W
φ
Road curvature
Yaw angle
Lateral position
Lane width
Pitch angle
Camera height = Bounce
ρ, φ, Dx, Dy, ψ are calculated using edge positions by regression analysis
iWZZX 2
2ZY ψ
ψDyDx