IntroductIon - NTEN | Connect · NTEN, a 501(c)(3) nonprofit, is the membership organization of...
9
Talking about data is not a new conversation for the NTEN community. We are glad to see that more organizations and more staff, regardless of job title or department, are engaging in conversations about data, evaluation, and impact. It is inspiring to see the eagerness to find better processes for collecting and sharing data, implement more effective tools for analyzing and reporting, and integrate impact storytelling across departments. In 2013, NTEN partnered with Idealware to create Getting Started With Data-Driven Decision Making: A Workbook. The workbook has since been downloaded and used by diverse organizations in the U.S. and beyond. We frequently use the workbook and processes it outlines in NTEN Labs, one-day, hands-on workshops. We even use the workbook internally here at NTEN. After a year of using the workbook, we’ve identified four areas that frequently emerge as organizations work to build data management and evaluation programs. In these new worksheets, you’ll identify technologies that can help you collect and understand your organization’s outcomes data, as well as strategies for incenting the highest-quality data you can collect. You’ll also explore how your metrics can combine to tell a story about your organization’s programs that can be presented to your stakeholders or core constituents. Finally, you’ll learn how to tailor that story to better address different stakeholder groups—how do you make the same story relevant to both your donors and your volunteers? While these worksheets are presented together, and complement each other, you don’t have to work through them all together—feel free to pick-and-choose the worksheets most applicable to your organization’s needs. If you do not yet have defined set of metrics for your organization, get started by working through the full Getting Started With Data-Driven Decision Making: A Workbook first! About NTEN NTEN, a 501(c)(3) nonprofit, is the membership organization of nonprofit technology professionals. As a community of nonprofit professionals, we aspire to a world where nonprofit groups of all types and sizes use technology strategically and confidently to fulfill their missions. Together, the NTEN community helps members put technology to work so they can bring about the change they want to see in the world. NTEN facilitates the exchange of knowledge and information within our community. We connect our members to each other, provide professional development opportunities, educate our constituency on issues of technology use in nonprofits, and spearhead groundbreaking research, advocacy, and education on technology issues affecting our entire community. About Idealware Idealware, a 501(c)(3) nonprofit, provides thoroughly researched, impartial and accessible resources about software to help nonprofits make smart software decisions. By synthesizing vast amounts of original research into credible and approachable information, Idealware helps nonprofits make the most of their time and financial resources. Idealware specializes in combining traditional research techniques like interviews and surveys with softwareselection methodologies—like detailed ratings of software tools against a rubric—to generate important new knowledge on affordable budgets. We then package our findings into approachable reports, articles, and trainings that help nonprofits make the on-the-ground decisions important to them. INTRODUCTION PAGE 1 THOUGHTS FOR NTEN OUTCOMES INDICATORS • OCTOBER 2014
Transcript of IntroductIon - NTEN | Connect · NTEN, a 501(c)(3) nonprofit, is the membership organization of...

Talking about data is not a new conversation for the NTEN community. We are glad to see that more organizations and more staff, regardless of job title or department, are engaging in conversations about data, evaluation, and impact. It is inspiring to see the eagerness to find better processes for collecting and sharing data, implement more effective tools for analyzing and reporting, and integrate impact storytelling across departments.
In 2013, NTEN partnered with Idealware to create Getting Started With Data-Driven Decision Making: A Workbook. The workbook has since been downloaded and used by diverse organizations in the U.S. and beyond. We frequently use the workbook and processes it outlines in NTEN Labs, one-day, hands-on workshops. We even use the workbook internally here at NTEN.
After a year of using the workbook, we’ve identified four areas that frequently emerge as organizations work to build data management and evaluation programs. In these new worksheets, you’ll identify technologies that can help you collect and understand your organization’s outcomes data, as well as strategies for incenting the highest-quality data you can collect. You’ll also explore how your metrics can combine to tell a story about your organization’s programs that can be presented to your stakeholders or core constituents. Finally, you’ll learn how to tailor that story to better address different stakeholder groups—how do you make the same story relevant to both your donors and your volunteers?
While these worksheets are presented together, and complement each other, you don’t have to work through them all together—feel free to pick-and-choose the worksheets most applicable to your organization’s needs. If you do not yet have defined set of metrics for your organization, get started by working through the full Getting Started With Data-Driven Decision Making: A Workbook first!
About NTEN NTEN, a 501(c)(3) nonprofit, is the membership organization of nonprofit technology professionals. As a community of nonprofit professionals, we aspire to a world where nonprofit groups of all types and sizes use technology strategically and confidently to fulfill their missions. Together, the NTEN community helps members put technology to work so they can bring about the change they want to see in the world.
NTEN facilitates the exchange of knowledge and information within our community. We connect our members to each other, provide professional development opportunities, educate our constituency on issues of technology use in nonprofits, and spearhead groundbreaking research, advocacy, and education on technology issues affecting our entire community.
About Idealware Idealware, a 501(c)(3) nonprofit, provides thoroughly researched, impartial and accessible resources about software to help nonprofits make smart software decisions. By synthesizing vast amounts of original research into credible and approachable information, Idealware helps nonprofits make the most of their time and financial resources.
Idealware specializes in combining traditional research techniques like interviews and surveys with softwareselection methodologies—like detailed ratings of software tools against a rubric—to generate important new knowledge on affordable budgets. We then package our findings into approachable reports, articles, and trainings that help nonprofits make the on-the-ground decisions important to them.
IntroductIon
PAGE 1 ThoUghTS For NTEN oUTcomES INdIcATorS • ocToBEr 2014

There are a number of systems and technologies you can use to collect and track your indicators without breaking the bank. We’ll help you brainstorm what you already have and how you could use techniques like surveys, mobile data collection, or bar code scanners to get started without a sizable technology investment.
To begin, pick some indicators or metrics to start with (you can always repeat this for multiple sets of metrics) and write them in the spaces below:
Now, brainstorm how you might use each of the below technologies to help collect those metrics. Try to think out-of-the-box, and brainstorm for even those technologies that seem unrelated. Trying to connect things that aren’t obviously connected can lead to some of your most compelling and innovative ideas.
MobilE DEvicEs AnD ForMsSmartphones, tablets, and other
mobile devices provide portable
access to online databases through
either the browser or apps.
survEys, Polls, AnD FEEDbAck ForMsonline surveys and quick polls let you
collect feedback on your programs
from constituents. (Ex: Surveymonkey,
Polldaddy)
MAPPinG or MAniPulAtinG your currEnt DAtA data is only useful to your organization
if you can make sense of it. charts,
maps, graphs, and other visualization
tools can help. (Ex: microsoft Excel,
google maps, mapPoint)
EMAil, WEb, AnD sociAl MEDiA AnAlyticshow much traffic are certain pages on
your site getting? What’s your bounce
rate, open rate, click-through rate on
broadcast email? What tweets or
posts reach more people?
(Ex: google Analytics, hootSuite,
Facebook Insights)
onlinE ForMsLess involved than a survey, forms let
you easily collect feedback online.
(Ex: Wufoo, Formsite, google Forms)
scAnninG bAr coDEs on An iD or lAbElQr codes and other barcodes are
easily scanned by smartphones or
inexpensive hardware.
defInIng StraIghtforward technologIeS to collect Your outcomeS IndIcatorS
PAGE 2 ThoUghTS For NTEN oUTcomES INdIcATorS • ocToBEr 2014
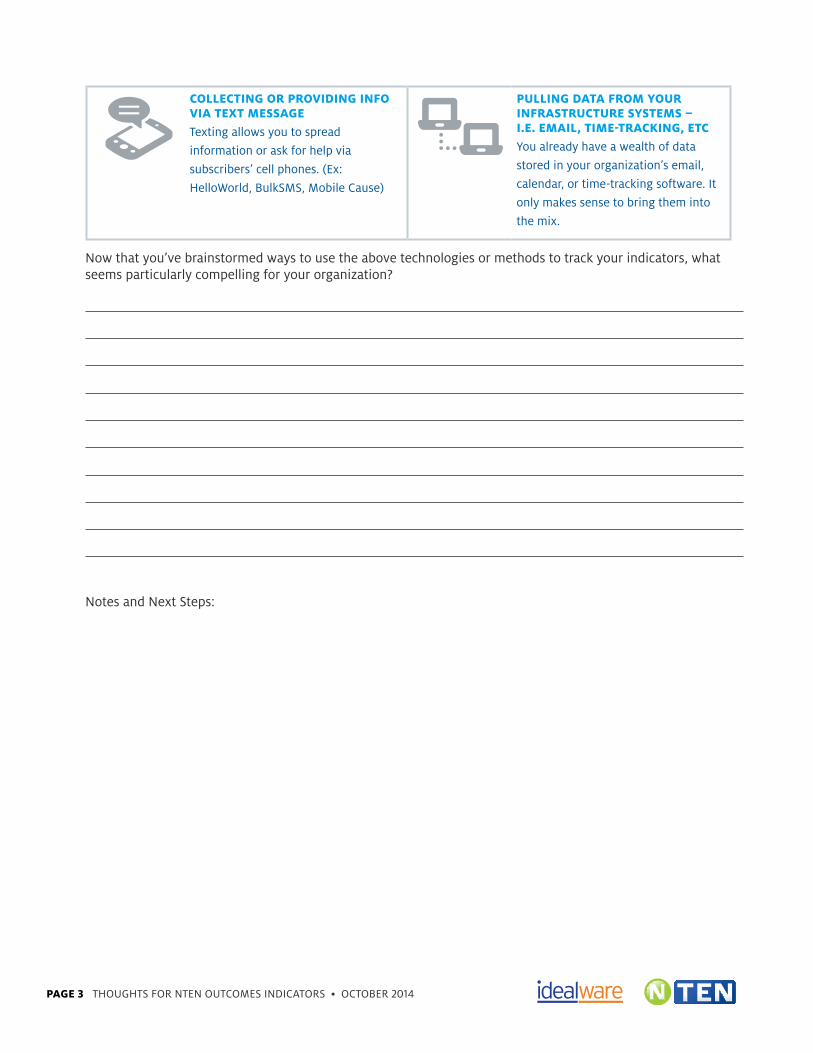
collEctinG or ProviDinG inFo viA tExt MEssAGETexting allows you to spread
information or ask for help via
subscribers’ cell phones. (Ex:
helloWorld, BulkSmS, mobile cause)
PullinG DAtA FroM your inFrAstructurE systEMs – i.E. EMAil, tiME-trAckinG, EtcYou already have a wealth of data
stored in your organization’s email,
calendar, or time-tracking software. It
only makes sense to bring them into
the mix.
Now that you’ve brainstormed ways to use the above technologies or methods to track your indicators, what seems particularly compelling for your organization?
Notes and Next Steps:
PAGE 3 ThoUghTS For NTEN oUTcomES INdIcATorS • ocToBEr 2014

You can have the best-defined indicators in the world and it won’t matter if the data that you’re using to determine them is not accurate or relatively thorough. We’ll help you think through the different ways that you can incent high quality data.
To begin, pick some indicators or metrics to start with (you can always repeat this for multiple sets of metrics) and write them in the spaces below:
Below, brainstorm the possible ways you could incent high quality data. We’ve provided a high-level list to get you started, but go beyond that list to tailor it to your own organization.
PossiblE ProcEssEs brAinstorM thE DEtAils
how could you get data without your staff entering it? For instance:
• gate counting
• Web or email analytics
• counting emails or tasks completed
• getting constituents to enter it themselves
• What else?
how could you make it super easy for staff to enter high quality data? For instance:
• give them detailed training
• Let them enter data through a mobile device
• Let them enter data on site
• create an easy form just to collect data
• give them a manual clicker
• Automatically checking data quality on entry
• What else?
IncentIng hIgh QualItY data
PAGE 4 ThoUghTS For NTEN oUTcomES INdIcATorS • ocToBEr 2014

PossiblE ProcEssEs brAinstorM thE DEtAils
how can you make it clear it’s important to the mission? For instance:
• Provide data back that’s useful to them
• report back on data to make it clear it’s used
• Specifically tie data to your objectives
• What else?
specifically incent them to provide good data. For instance:
• make quality data part of their job descriptions
• have contests or provide prizes
• Include data quality in performance reviews
• Tie data quality to salary incentives
• recognize a weekly or monthly “data hero”
• What else?
While it might seem desirable to collect as much data as possible, that approach can actually cause problems once you start analyzing the data. more data is better than none at all, but the emphasis should be on the quality of that data, not the quantity.
Looking back through what you’ve brainstormed, what seems particularly compelling for your organization?
PAGE 5 ThoUghTS For NTEN oUTcomES INdIcATorS • ocToBEr 2014

While your metrics are very useful on their own, they become even more so once you’ve defined the “story” that they’re telling. Whether it’s for internal or external audiences, a story helps people to put the numbers in context and understand quickly how they relate to your organization and themselves.
Start by thinking through what metrics you want to use to build a story. Pick one, two, or three metrics which seem related to each other that describe an overall program or your organization and write them in the spaces below:
It’s the change in metrics over time that often tells a key part of the story. Think through the changes either month-over-month or year-over-year—whichever makes the most sense for you. If you don’t have actual numbers, just estimate so you have something to work with.
MEtric 1:
MEtric 2:
MEtric 3:
yEAr or Month 1:
yEAr or Month 2:
yEAr or Month 3:
defInIng the StorY In Your metrIcS
PAGE 6 ThoUghTS For NTEN oUTcomES INdIcATorS • ocToBEr 2014

Looking at the metrics and changes over time, brainstorm based on some key questions:
A. If you’ve chosen multiple metrics, what is the tie that binds them together?
B. What has, at a high level, changed over time?
c. What do these changes mean to your organization?
d. What action have you taken or might you take based on these changes?
Look back through the answers to A through d above and circle the words and phrases that seem particularly important, meaningful, or compelling to the message you want to convey.
Now, try to pull together a cohesive story using those words and phrases you’ve circled. You might want to start with a sentence about what the metrics say and then a sentence about what the metrics mean for your organization. Keep in mind, however, that you’re telling the story that the metrics tell, not forcing your numbers to support the narrative you would want them to.
PAGE 7 ThoUghTS For NTEN oUTcomES INdIcATorS • ocToBEr 2014

The language of the story you’re telling obviously needs to change depending on who you’re telling it to. While the metrics and the content won’t change, you will need to tailor the messaging to appeal to different stakeholders.
Start by looking at your metrics and identifying the stories that each tells about your organization—the Defining the Story in Your Metrics worksheet can help you think this through, if needed. Now, pick just one of those stories that seems particularly compelling and write it below, and we’ll focus on just that story for this worksheet. (You can always repeat this for each of multiple stories.)
What story will you start with?
What stakeholders do you want to tailor this story to? Use the box to the right to help you get started in thinking through the possibilities. Pick two stakeholders you want to start with and write them down in the stakeholder 1 and stakeholder 2 lines below. (You can always repeat the exercise for more stakeholders).
stakeholder 1:
What do you want this stakeholder to do?
Now, for each category below, brainstorm your key talking points in the area. What are the core talking points that make this stakeholder different than others?
1
2
3
taIlorIng the StorY to Your audIence
PAGE 8 ThoUghTS For NTEN oUTcomES INdIcATorS • ocToBEr 2014
2 thInk obStacleS What are the obstacles
that keep this constituent from acting?
3 thInk InSpIratIon how can you inspire them
to act? how can they be the hero of this story?
1 thInk StakeholderS What would you want this
stakeholder to share with others about your story?

stakeholder 2:
What do you want this stakeholder to do?
Now, for each category below, brainstorm your key talking points in the area. What are the core talking points that make this stakeholder different than others?
Based on that brainstorm, how will you change your story for this stakeholder?
PAGE 9 ThoUghTS For NTEN oUTcomES INdIcATorS • ocToBEr 2014
1
2
3
2 thInk obStacleS What are the obstacles
that keep this constituent from acting?
3 thInk InSpIratIon how can you inspire them
to act? how can they be the hero of this story?
1 thInk StakeholderS What would you want this
stakeholder to share with others about your story?