Introduction Membrane Issues Other Issues
83
Outline Outline • • Introduction Introduction • • Membrane Issues Membrane Issues • • Other Issues Other Issues
Transcript of Introduction Membrane Issues Other Issues

OutlineOutline
•• IntroductionIntroduction
•• Membrane IssuesMembrane Issues
•• Other IssuesOther Issues
OutlineOutline
•• IntroductionIntroduction
•• Membrane IssuesMembrane Issues
––General foulingGeneral fouling
––Impact of SRT or F/MImpact of SRT or F/M
––Impact of MLSSImpact of MLSS
––Impact of wet weatherImpact of wet weather
•• Other IssuesOther Issues

What is membrane fouling?What is membrane fouling?
•• Membrane fouling is the loss of permeability with Membrane fouling is the loss of permeability with
timetime
•• In practice, this is observed as an increase in the In practice, this is observed as an increase in the
TMP required to maintain flow through the MBRTMP required to maintain flow through the MBR
•• For engineers, the increase in TMP For engineers, the increase in TMP
needs to be related to the flux rate needs to be related to the flux rate
and normalized for temperature and normalized for temperature --
this is called a temperature this is called a temperature
corrected corrected ““PermeabilityPermeability”” or or
““Specific FluxSpecific Flux””

Definition of termsDefinition of terms
A
J = Q/A = membrane flux (m/s)
Po
Pe TMP = Po-Pe (Pa)
Membrane permeability = J/TMP
Membrane fouling:
time
TMP
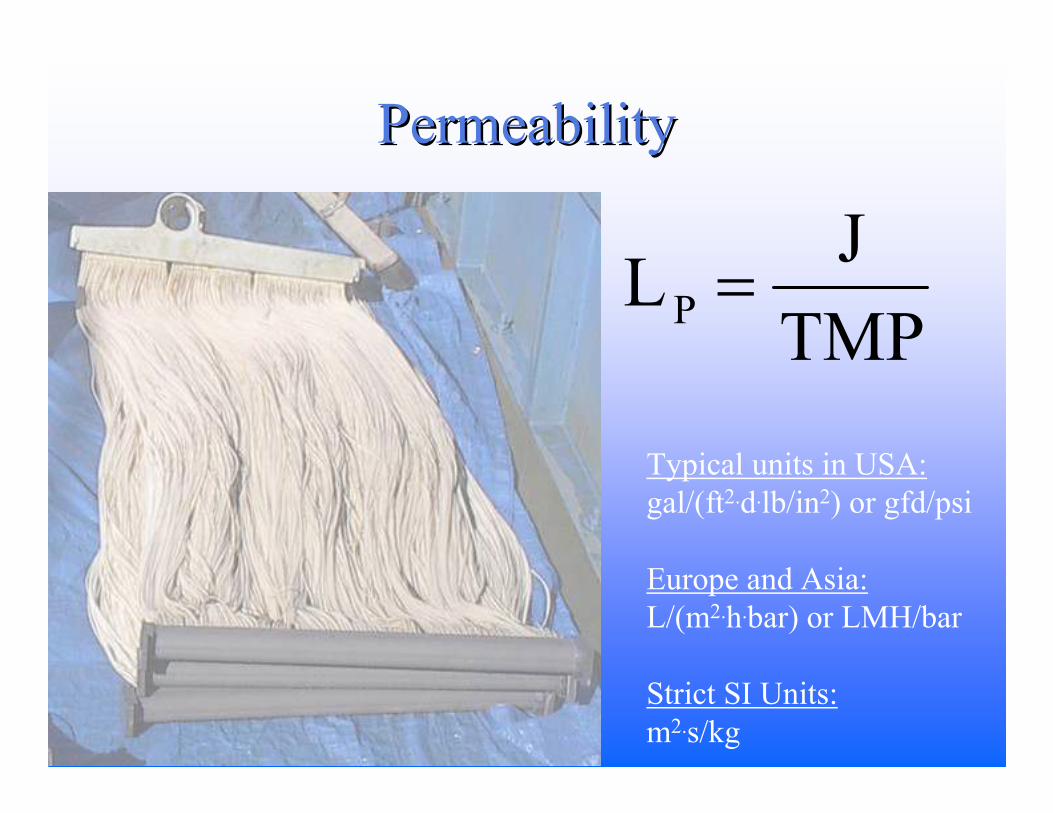
PermeabilityPermeability
LP =J
TMP
Typical units in USA:
gal/(ft2.d.lb/in2) or gfd/psi
Europe and Asia:
L/(m2.h.bar) or LMH/bar
Strict SI Units:
m2.s/kg

Temperature corrected permeabilityTemperature corrected permeability
LP
20o C =J ⋅ e
-0.0239 T -20( )( )
TMPThe above equation corrects for
temperature effects on the viscosity of
water. This equation is accurate within
5% for a temperature range of 5 to 40oC.
WHY DO WE DO THIS??
Because changes in the viscosity of water directly impact TMP

0.0
0.2
0.4
0.6
0.8
1.0
1.2
1.4
1.6
1.8
2.0
0 5 10 15 20 25 30 35 40 45
Temperature, ºC
Absolute viscosity of water, m
Pa•s
Actual
Calculated
Temperature correctionTemperature correction
Need touse a different equation As water temperature decreases -
viscosity of water increases
All other conditions equal -
this increases the TMP

Key MBR
Research Projects
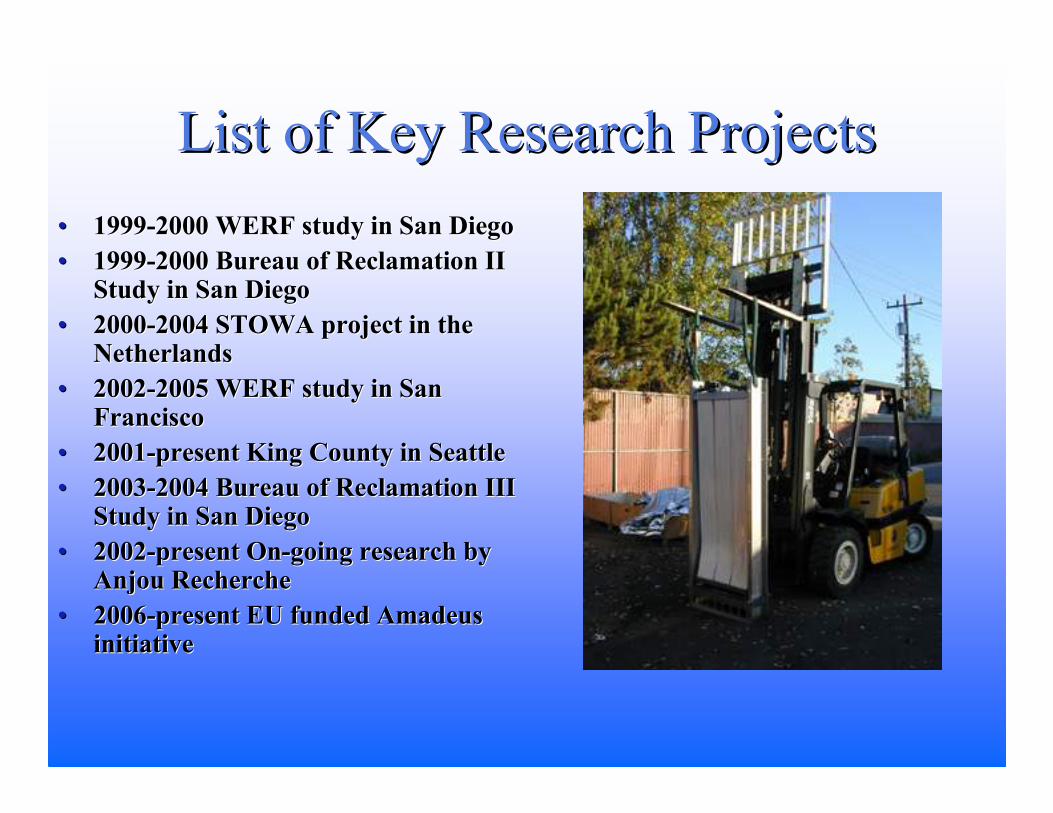
List of Key Research ProjectsList of Key Research Projects
•• 19991999--2000 WERF study in San Diego2000 WERF study in San Diego
•• 19991999--2000 Bureau of Reclamation II 2000 Bureau of Reclamation II Study in San DiegoStudy in San Diego
•• 20002000--2004 STOWA project in the 2004 STOWA project in the NetherlandsNetherlands
•• 20022002--2005 WERF study in San 2005 WERF study in San FranciscoFrancisco
•• 20012001--present King County in Seattlepresent King County in Seattle
•• 20032003--2004 Bureau of Reclamation III 2004 Bureau of Reclamation III Study in San DiegoStudy in San Diego
•• 20022002--present Onpresent On--going research by going research by Anjou Anjou RechercheRecherche
•• 20062006--present EU funded Amadeus present EU funded Amadeus initiativeinitiative

Understanding
MBR Fouling

MBR fouling theoryMBR fouling theory
•• Basic fundamentals of membrane fouling in Basic fundamentals of membrane fouling in MBRsMBRs are the same are the same
regardless of the manufacturer or configuration (Pressure or regardless of the manufacturer or configuration (Pressure or
Vacuum)Vacuum)
•• Membrane fouling results from the interaction between the mixed Membrane fouling results from the interaction between the mixed
liquor and membrane materialliquor and membrane material
–– Complex mixture of organicsComplex mixture of organics
–– Metabolic byproducts and possibly influent substrate or partiallMetabolic byproducts and possibly influent substrate or partially y
degraded influent substratedegraded influent substrate
–– Cells and microbesCells and microbes
–– Cellular and microbial debrisCellular and microbial debris
–– Inert suspended solidsInert suspended solids
–– Dissolved Dissolved inorganicsinorganics (possible precipitants)(possible precipitants)

Resistance inResistance in--series modelseries model
J =TMP
µw ⋅RT
•• Simplistic modelSimplistic model
•• Widely used with lowWidely used with low--pressure membranes pressure membranes (MF/UF/MBR)(MF/UF/MBR)
•• Can be used to provide powerful insights to Can be used to provide powerful insights to MBR foulingMBR fouling
J = membrane flux, m/s
TMP = trans-membrane pressure, Pa
µw = absolute viscosity of water, kg/m.s
RT = total resistance to filtration, m-1

Resistance inResistance in--series modelseries model
•• RRTT=R=RMM+R+RFF+R+RCC
•• RRTT = Total resistance= Total resistance
•• RRMM = Membrane= Membrane
•• RRCC = Cake Layer= Cake Layer
•• RRFF = = FoulantsFoulants–– Organic AdsorptionOrganic Adsorption
–– Inorganic PrecipitationInorganic Precipitation
–– Pore blockingPore blocking
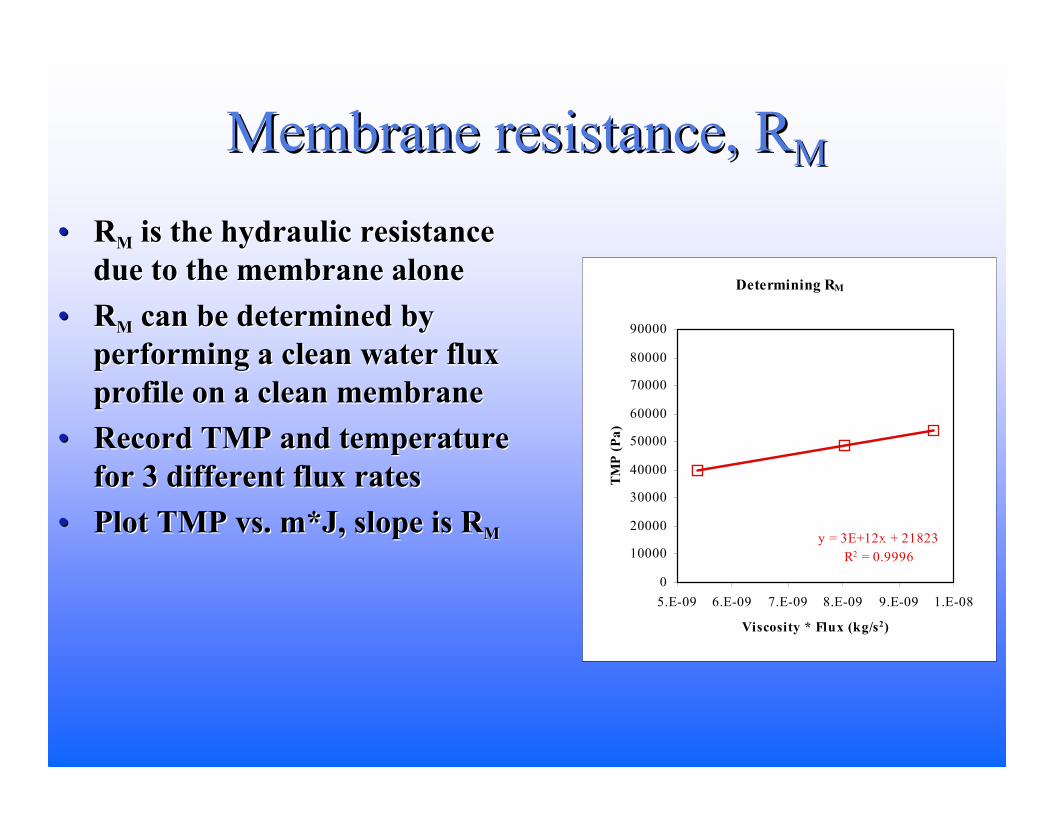
Determining RM
y = 3E+12x + 21823
R2 = 0.9996
0
10000
20000
30000
40000
50000
60000
70000
80000
90000
5.E-09 6.E-09 7.E-09 8.E-09 9.E-09 1.E-08
Viscosity * Flux (kg/s2)TMP (Pa)
Membrane resistance, RMembrane resistance, RMM
•• RRMM is the hydraulic resistance is the hydraulic resistance
due to the membrane alonedue to the membrane alone
•• RRMM can be determined by can be determined by
performing a clean water flux performing a clean water flux
profile on a clean membraneprofile on a clean membrane
•• Record TMP and temperature Record TMP and temperature
for 3 different flux ratesfor 3 different flux rates
•• Plot TMP vs. m*J, slope is RPlot TMP vs. m*J, slope is RMM
RM = 3x10¹² m-1

Other resistance termsOther resistance terms
•• RRTT is obtained during normal MBR operationis obtained during normal MBR operation
–– Increases with time or total volume filteredIncreases with time or total volume filtered
–– Influenced by resistance of the filtration cake, RInfluenced by resistance of the filtration cake, RCC
–– Influenced by the degree of Influenced by the degree of foulantfoulant present on the membrane, Rpresent on the membrane, RFF
•• RRFF can be roughly estimated at any point in an operation can be roughly estimated at any point in an operation cyclecycle
–– Drain the mixed liquor from the membrane tank (air off)Drain the mixed liquor from the membrane tank (air off)
–– Fill the membrane tank with membrane permeate and perform Fill the membrane tank with membrane permeate and perform flux profile flux profile -- this provides Rthis provides RMM+R+RFF (possibly some residual R(possibly some residual RC C --thatthat’’s why this is an s why this is an estimateestimate))
•• Subtract RSubtract RM M (this was obtained before run began(this was obtained before run began) and you ) and you can approximate the amount of can approximate the amount of foulantfoulant, R, RFF
•• Remainder of RRemainder of RTT is attributed to Ris attributed to RCC
RT =TMP
µw ⋅ J
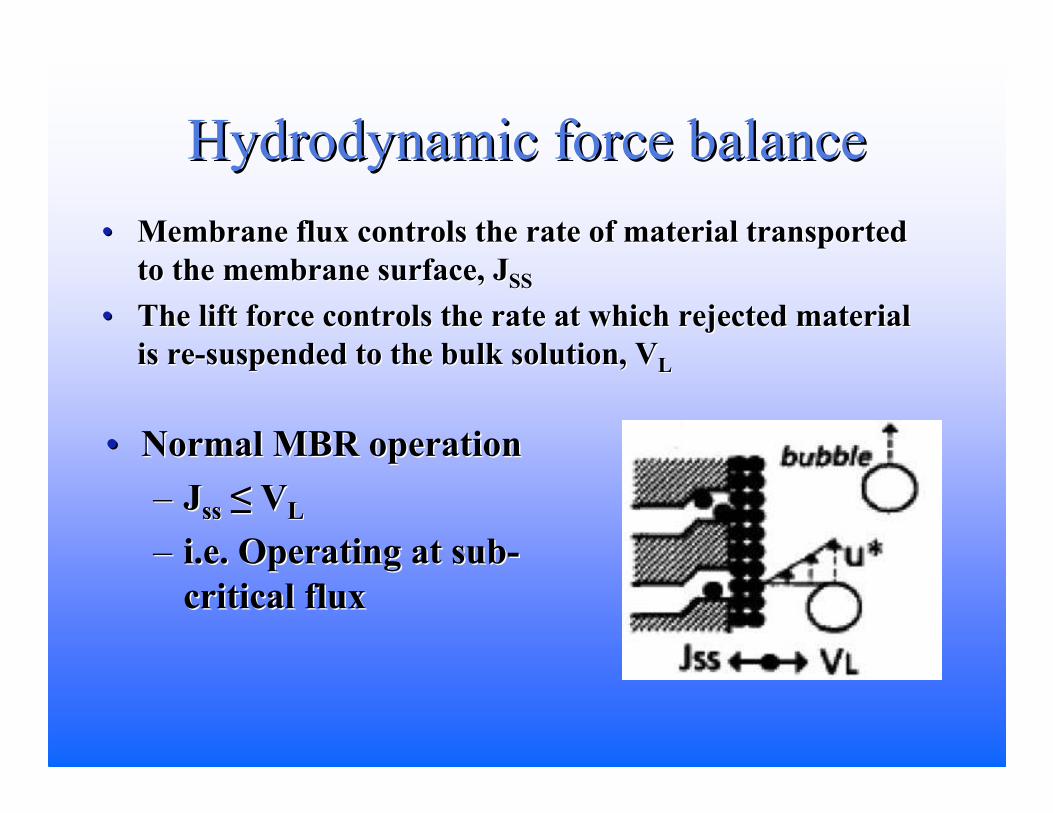
Hydrodynamic force balanceHydrodynamic force balance
•• Membrane flux controls the rate of material transported Membrane flux controls the rate of material transported
to the membrane surface, Jto the membrane surface, JSSSS
•• The lift force controls the rate at which rejected material The lift force controls the rate at which rejected material
is reis re--suspended to the bulk solution, Vsuspended to the bulk solution, VLL
•• Normal MBR operationNormal MBR operation
–– JJssss ≤≤ VVLL
–– i.e. Operating at subi.e. Operating at sub--
critical fluxcritical flux

Critical
Flux

Critical fluxCritical flux
•• Conventionally denotes flux below which fouling does Conventionally denotes flux below which fouling does
not take placenot take place
–– Membrane permeability remains as it was in pure waterMembrane permeability remains as it was in pure water
•• Strict critical flux definition does not apply to MBRStrict critical flux definition does not apply to MBR
•• Field et al., 1995 first adapted this concept to low Field et al., 1995 first adapted this concept to low
pressure membranespressure membranes
•• LeLe--ClechClech et al., 2003 et al., 2003 further developed the critical flux further developed the critical flux
concept for concept for MBRsMBRs

0
2
4
6
8
10
12
14
16
18
20
0 2 4 6 8 10
Time, minutes
Vacuum Pressure, in Hg
gfd 8.7
gfd 10.9
gfd 13.1
gfd 15.3
gfd 17.5
Illustration of critical fluxIllustration of critical flux
MLSS = 8 g/L
SCFM = 30 scfm
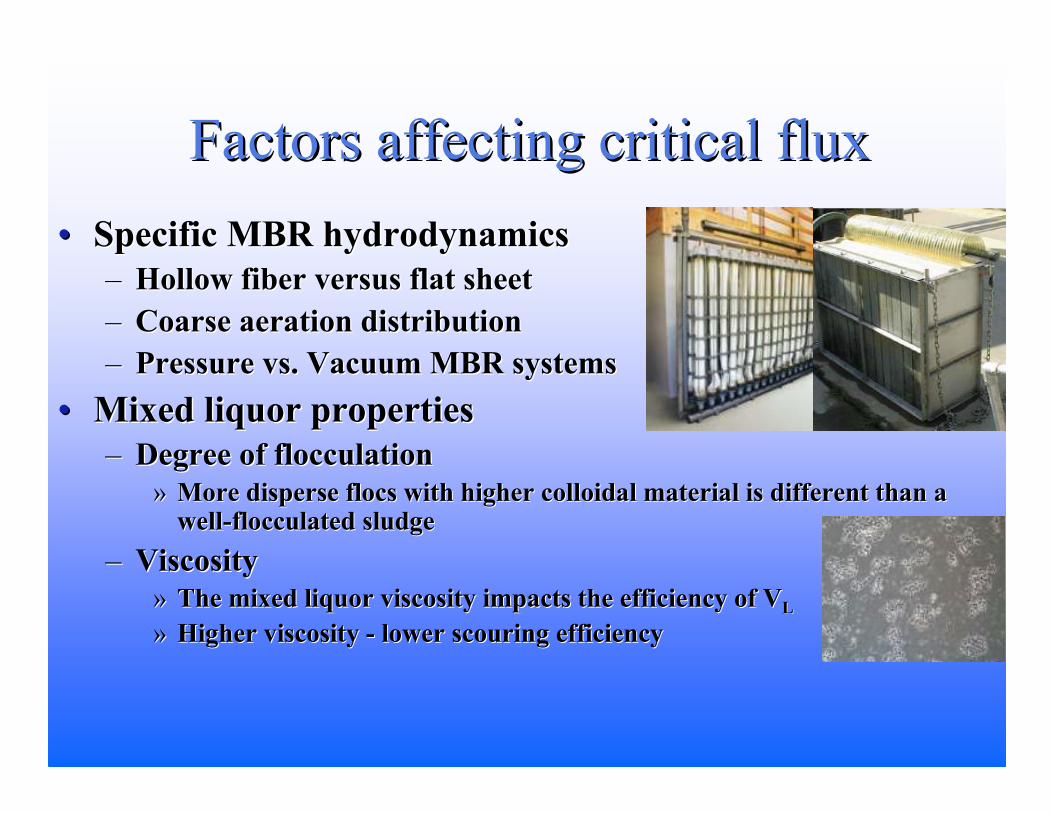
Factors affecting critical fluxFactors affecting critical flux
•• Specific MBR hydrodynamicsSpecific MBR hydrodynamics
–– Hollow Hollow fiberfiber versus flat sheetversus flat sheet
–– Coarse aeration distributionCoarse aeration distribution
–– Pressure vs. Vacuum MBR systemsPressure vs. Vacuum MBR systems
•• Mixed liquor propertiesMixed liquor properties
–– Degree of flocculationDegree of flocculation
»» More disperse More disperse flocsflocs with higher colloidal material is different than a with higher colloidal material is different than a wellwell--flocculated sludgeflocculated sludge
–– ViscosityViscosity
»» The mixed liquor viscosity impacts the efficiency of VThe mixed liquor viscosity impacts the efficiency of VLL
»» Higher viscosity Higher viscosity -- lower scouring efficiency lower scouring efficiency

Importance of coarse bubble airImportance of coarse bubble air
Adapted from Bérubé et al., 2005 AWWA MTC
Constant flux experiments
Single Phase = Water alone
Dual Phase = Air/Water
Conclusion: Maintaining clean, well-functioning,
and well-distributed coarse bubble air is critical
Cross-flow
velocity

Sludge PropertiesSludge Properties
Filamentous
Microorganisms
Extracellular Polymeric
Substances (EPS)
Colloidal
Material
Particle Size

Critical Flux IllustrationCritical Flux Illustration
MLSS = 10-12 g/L
Air = 30 scfm
Adapted from Fan et al., 2006 Water Research V40
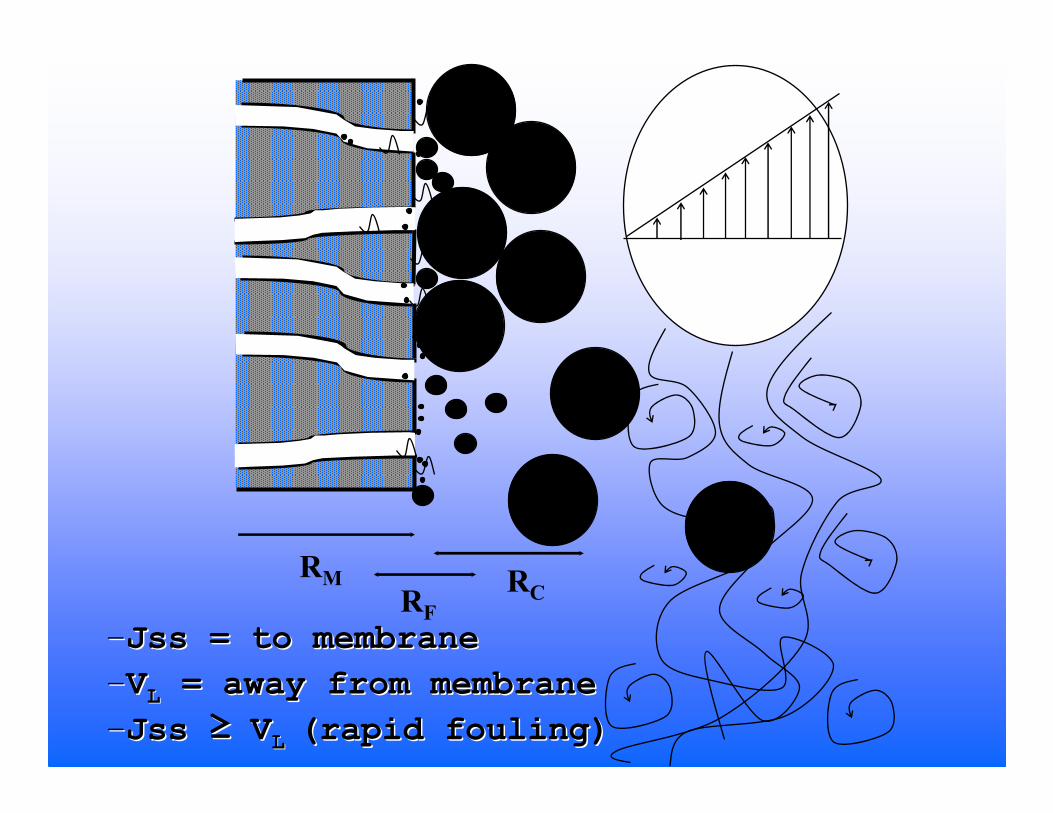
RM
RF
RC
––JssJss = to membrane= to membrane
––VVLL = away from membrane= away from membrane
––JssJss ≥≥ VVL L (rapid fouling)(rapid fouling)

“Typical” MBR
Fouling Mechanisms
Photos adapted from Miura et al., 2007

““TypicalTypical”” MBR fouling mechanismsMBR fouling mechanisms
•• Organics are the most common Organics are the most common foulantfoulant under normal under normal operating conditions in operating conditions in MBRsMBRs
–– Conservative fluxConservative flux
–– Well functioning/distributed coarse aerationWell functioning/distributed coarse aeration
–– Controlled MLSSControlled MLSS
•• Organic fouling is Organic fouling is primarilyprimarily attributed to the soluble or attributed to the soluble or colloidal organics present in the mixed liquorcolloidal organics present in the mixed liquor
–– Particles Particles ≤≤ 6 6 µµµµµµµµmm
–– Not incorporate into larger flocNot incorporate into larger floc
–– Not yet clear whether colloidal or soluble is culprit (likely boNot yet clear whether colloidal or soluble is culprit (likely both)th)
»» Research has highlighted the importance of soluble carbohydrate Research has highlighted the importance of soluble carbohydrate or or polysaccharides, but there is also literature to the contrarypolysaccharides, but there is also literature to the contrary
•• Increased soluble/colloidal organic content results in Increased soluble/colloidal organic content results in increased membrane fouling ratesincreased membrane fouling rates

ExtracellularExtracellular Polymeric Substances Polymeric Substances (EPS) and Soluble Microbial Products (EPS) and Soluble Microbial Products
(SMP)(SMP)
Active Cell SMP
EPSHydrolysis
Substrate
Diffusion/Shear
Adsorption andflocculation

Organic foulingOrganic fouling
Adapted from Lesjean et al., 2005 Water Science and Technology
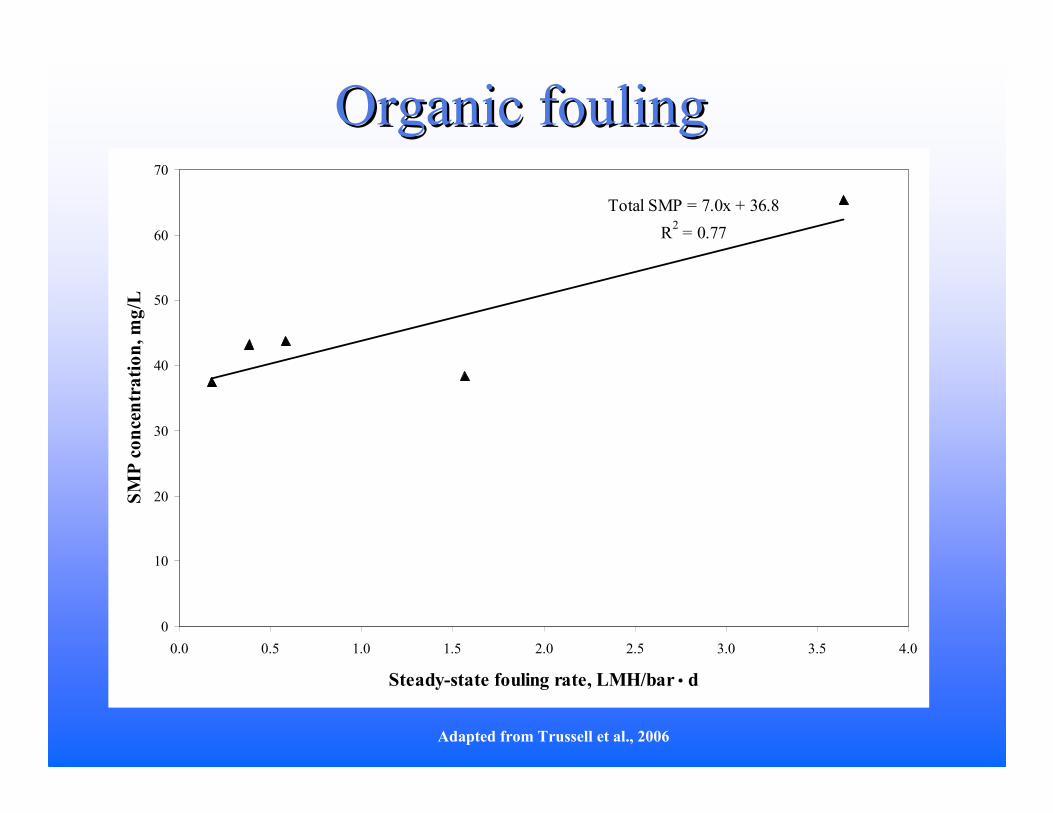
Total SMP = 7.0x + 36.8
R2 = 0.77
0
10
20
30
40
50
60
70
0.0 0.5 1.0 1.5 2.0 2.5 3.0 3.5 4.0
Steady-state fouling rate, LMH/bar • d
SMP concentration, mg/L
Organic foulingOrganic fouling
Adapted from Trussell et al., 2006
SMP = soluble microbial products
(soluble protein + soluble carbohydrate)

Inorganic Inorganic foulantsfoulants
•• Less severe than organic fouling for most municipal MBR Less severe than organic fouling for most municipal MBR applicationsapplications
•• Certain waters (e.g. hard waters) can slowly develop an Certain waters (e.g. hard waters) can slowly develop an inorganic fouling layerinorganic fouling layer
–– Low pH clean (most common is citric acid) will control thisLow pH clean (most common is citric acid) will control this
–– This clean can be done as infrequently as annually at many This clean can be done as infrequently as annually at many facilitiesfacilities
•• Coagulants are typically used in municipal wastewater Coagulants are typically used in municipal wastewater treatment facilitiestreatment facilities
–– High coagulant doses create hydroxide precipitants (e.g. High coagulant doses create hydroxide precipitants (e.g. Fe(OH)Fe(OH)33), or coagulant carryover (e.g. colloids not bound up in ), or coagulant carryover (e.g. colloids not bound up in mixed liquor) that will result in inorganic foulingmixed liquor) that will result in inorganic fouling
–– It appears that an occasional low dose of coagulant can help It appears that an occasional low dose of coagulant can help reduce soluble and colloidal organic foulingreduce soluble and colloidal organic fouling

Coagulant AdditionCoagulant Addition
Adapted from Holbrook et al., 2004 Water Environment Research
Polymer AdditionPolymer Addition
•• Benefits of specialized polymer addition or Benefits of specialized polymer addition or ““flux flux
enhancersenhancers”” are currently being researchedare currently being researched
–– Reduces mixed liquor organic content (SMP)Reduces mixed liquor organic content (SMP)
–– Allows for increase in membrane flux by reducing colloidal Allows for increase in membrane flux by reducing colloidal
organicsorganics
•• Benefits have not been demonstrated on longBenefits have not been demonstrated on long--term term
basisbasis
–– ShortShort--term increase in mixed liquor filterability occursterm increase in mixed liquor filterability occurs
–– High doses required for longer run timesHigh doses required for longer run times
–– LongLong--term impacts on sludge properties (e.g. postterm impacts on sludge properties (e.g. post--polymer polymer
addition) have not been demonstratedaddition) have not been demonstrated
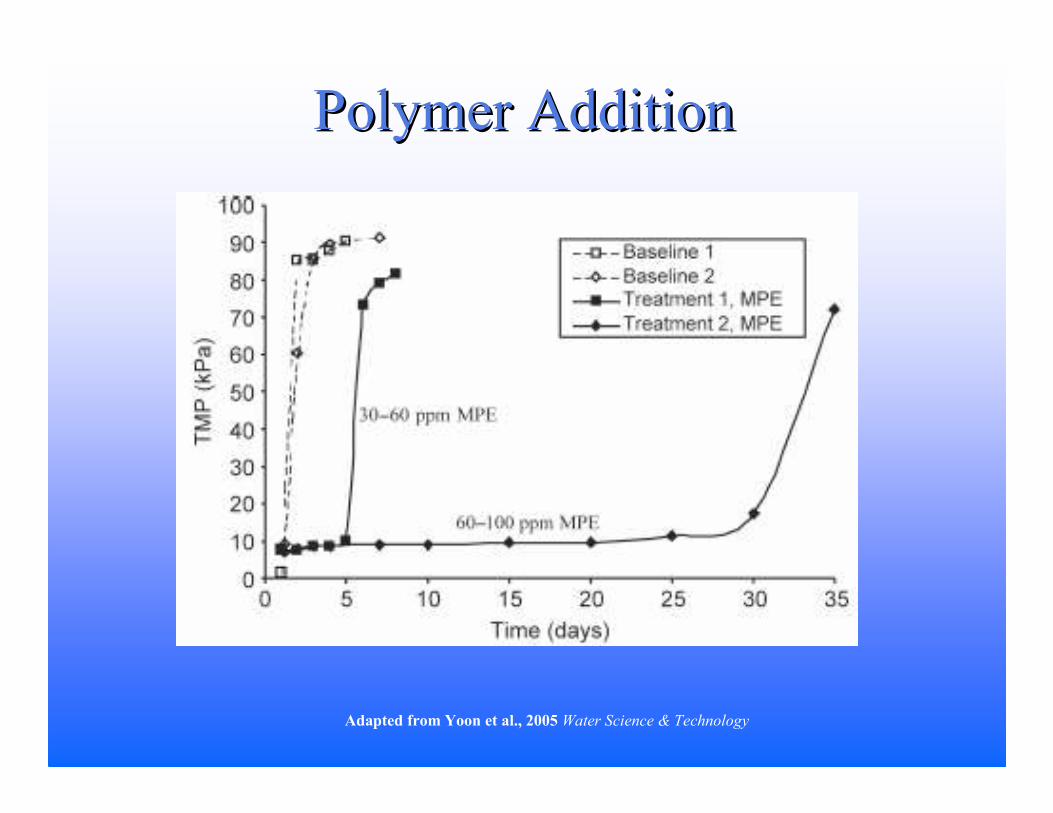
Polymer AdditionPolymer Addition
Adapted from Yoon et al., 2005 Water Science & Technology

Other Important
Fouling Mechanisms

Changes in MLSS concentrationChanges in MLSS concentration
•• Increases in the MLSS concentration are importantIncreases in the MLSS concentration are important
–– Increases the JIncreases the JSSSS to the membrane surfaceto the membrane surface
–– Increases the mixed liquor viscosityIncreases the mixed liquor viscosity
–– Combination can result in operation above the critical flux Combination can result in operation above the critical flux without changing the membrane fluxwithout changing the membrane flux
•• Different researchers have reached different conclusions Different researchers have reached different conclusions on the on the ““maximummaximum”” MLSS concentration for membrane MLSS concentration for membrane foulingfouling
•• This is because the This is because the ““maximummaximum”” MLSS depends onMLSS depends on
–– Membrane hydrodynamics (e.g. flat sheet, hollow fiber, pressure Membrane hydrodynamics (e.g. flat sheet, hollow fiber, pressure vs. vacuum, etc.)vs. vacuum, etc.)
–– Membrane flux rateMembrane flux rate
–– ReRe--suspending efficiency (e.g. air rate, no air? suspending efficiency (e.g. air rate, no air? -- cross flow cross flow velocity, velocity, ““jetjet””, mixed liquor viscosity), mixed liquor viscosity)

Changes in mixed liquor propertiesChanges in mixed liquor properties
•• Mixed liquor viscosity can change dramatically without Mixed liquor viscosity can change dramatically without the MLSS concentration changing!the MLSS concentration changing!
–– Mixed liquor viscosity has been > 2 times greater depending on Mixed liquor viscosity has been > 2 times greater depending on properties (e.g. 200 vs. 400 properties (e.g. 200 vs. 400 mPamPa..ss at 18 g/L)at 18 g/L)
–– Mixed liquor viscosity depends upon the degree of flocculation, Mixed liquor viscosity depends upon the degree of flocculation, extracellularextracellular polymeric substance (EPS) concentration, and polymeric substance (EPS) concentration, and filament concentrationfilament concentration
•• Mixed liquor filterability can change without changing Mixed liquor filterability can change without changing MLSS concentrationMLSS concentration
–– If deIf de--flocculation occurs, a dramatic increase in the Rflocculation occurs, a dramatic increase in the RCC will occurwill occur
»» Increase in colloidal contentIncrease in colloidal content
»» Disperse Disperse flocsflocs and single cellsand single cells
»» Dramatic changes can be quantified by time to filter (TTF)Dramatic changes can be quantified by time to filter (TTF)
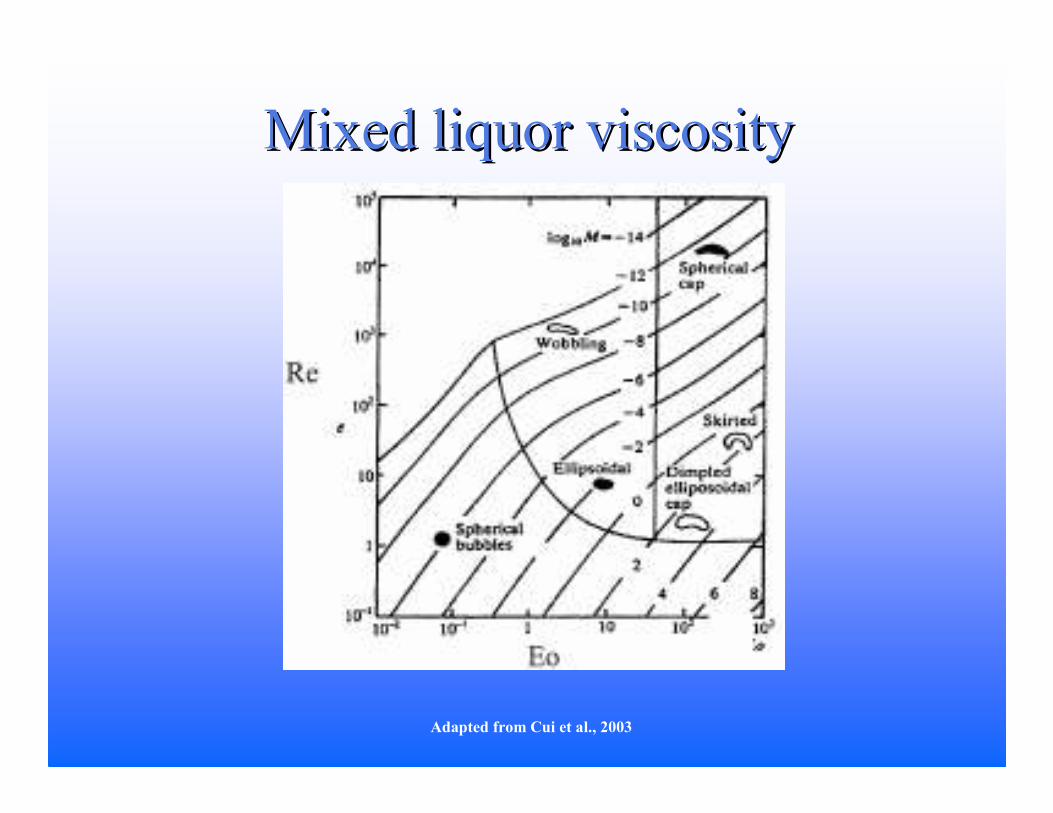
Mixed liquor viscosityMixed liquor viscosity
Adapted from Cui et al., 2003

Other important mixed liquor Other important mixed liquor properties for MBR foulingproperties for MBR fouling
•• Key Key foulantsfoulants arise from biomass, termed arise from biomass, termed extracellularextracellular
polymeric substances (EPS)polymeric substances (EPS)
–– unbound fraction often referred to as soluble microbial product unbound fraction often referred to as soluble microbial product
(SMP)(SMP)
–– bound fraction (EPS)bound fraction (EPS)
•• These can be further fractionated into chemical types, These can be further fractionated into chemical types,
namely:namely:
–– polysaccharide (or carbohydrate)polysaccharide (or carbohydrate)
–– proteinprotein

Chemical Chemical foulantfoulant studiesstudies
•• Difficult to ubiquitously identify key Difficult to ubiquitously identify key foulantfoulant
•• Generally, high concentrations of SMP are a significant concernGenerally, high concentrations of SMP are a significant concern
–– Membrane fouling will increaseMembrane fouling will increase
–– New research is showing importance of molecular weight of solublNew research is showing importance of molecular weight of soluble organic e organic
(e.g. >10 (e.g. >10 kDakDa and < 100 and < 100 kDakDa))
•• High concentrations of EPS do not always result in increased fouHigh concentrations of EPS do not always result in increased fouling ling
ratesrates
–– High EPS can be a sign of good flocculation (e.g. low colloidal High EPS can be a sign of good flocculation (e.g. low colloidal and soluble and soluble
organic content)organic content)
–– ““StickySticky”” EPS can result at low EPS concentrations and produce high REPS can result at low EPS concentrations and produce high RCC

Is Pore Size Important?
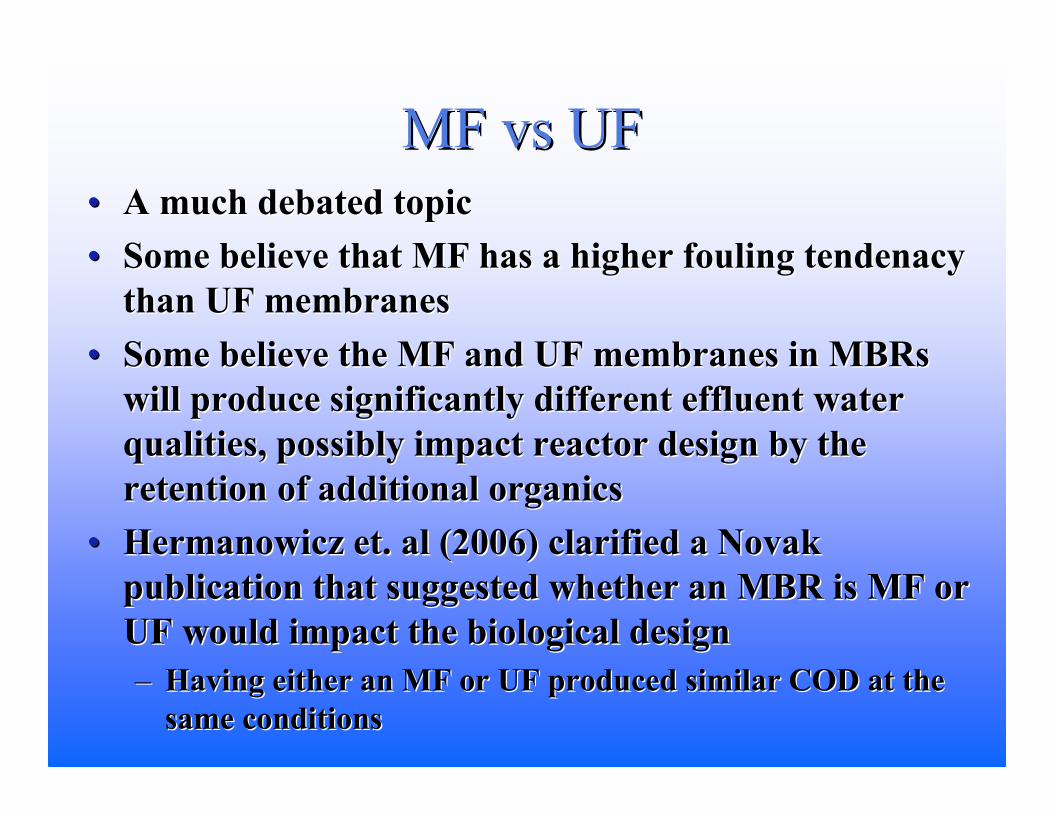
MF MF vsvs UFUF
•• A much debated topicA much debated topic
•• Some believe that MF has a higher fouling Some believe that MF has a higher fouling tendenacytendenacy
than UF membranesthan UF membranes
•• Some believe the MF and UF membranes in Some believe the MF and UF membranes in MBRsMBRs
will produce significantly different effluent water will produce significantly different effluent water
qualities, possibly impact reactor design by the qualities, possibly impact reactor design by the
retention of additional organicsretention of additional organics
•• HermanowiczHermanowicz et. al (2006) clarified a Novak et. al (2006) clarified a Novak
publication that suggested whether an MBR is MF or publication that suggested whether an MBR is MF or
UF would impact the biological designUF would impact the biological design
–– Having either an MF or UF produced similar COD at the Having either an MF or UF produced similar COD at the
same conditionssame conditions

Dynamic Cake Layer Dynamic Cake Layer (Lee et al. 2001)(Lee et al. 2001)
•• Solids (microbial Solids (microbial flocfloc) protect the ) protect the membrane from direct membrane from direct exposure to organicsexposure to organics
•• Acts as a Acts as a ““secondarysecondary”” membranemembrane
•• Membrane fouling Membrane fouling rate will increase rate will increase with a less with a less effective dynamic effective dynamic cake layercake layer
–– Poor flocculationPoor flocculation

US Bureau of Rec. Report US Bureau of Rec. Report (2000)(2000)
Rapid fouling Rapid fouling
attributed to MF attributed to MF
modulemodule

Impact of SRT or F/M on
Membrane Fouling
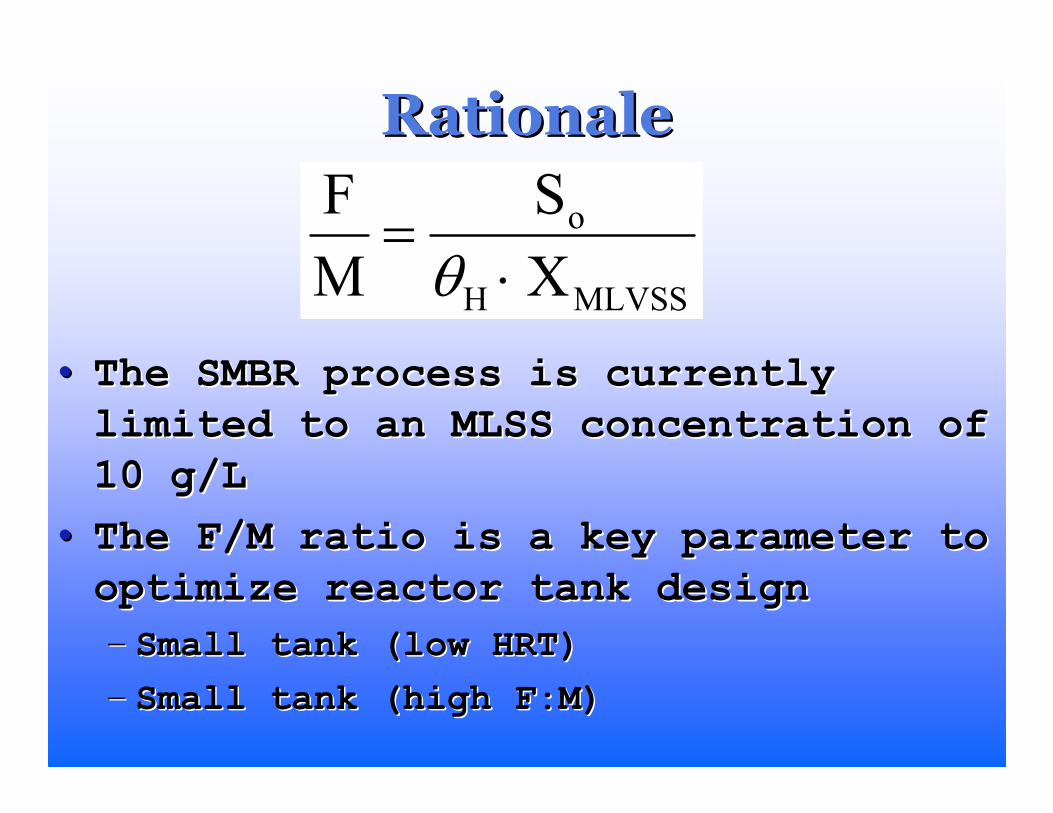
RationaleRationale
•• The SMBR process is currently The SMBR process is currently
limited to an MLSS concentration of limited to an MLSS concentration of
10 g/L10 g/L
•• The F/M ratio is a key parameter to The F/M ratio is a key parameter to
optimize reactor tank designoptimize reactor tank design
–– Small tank (low HRT)Small tank (low HRT)
–– Small tank (high F:M)Small tank (high F:M)
F
M=
So
θH ⋅XMLVSS

RationaleRationalePresent Worth, $
θθθθH, time
Capital
O&M

Equipment and ApparatusEquipment and Apparatus
•• PilotPilot--scale scale
SMBRSMBR
•• Treating Treating
primary primary
effluent from effluent from
the City of San the City of San
FranciscoFrancisco’’s SEPs SEP
–– COD = 325 mg/LCOD = 325 mg/L
–– TSS = 98 mg/LTSS = 98 mg/L

Membrane Operation and Membrane Operation and CharacteristicsCharacteristics
•• Zenon 500C ModuleZenon 500C Module
•• Nominal = 0.035 Nominal = 0.035 µµµµµµµµmm
•• Flux = 30 L/mFlux = 30 L/m2.2.hh
•• Air = 14 L/sAir = 14 L/s
•• Intermittent Intermittent
aerationaeration
•• 9 min operating 9 min operating
cycle followed by cycle followed by
30 sec relax30 sec relax

Experimental MethodsExperimental Methods
•• Initial operating conditions:Initial operating conditions:
MCRT = 10 d (F/M = 0.34 gCOD/gVSSMCRT = 10 d (F/M = 0.34 gCOD/gVSS..d)d)
•• Dissolved oxygen > 2 mg/LDissolved oxygen > 2 mg/L
•• Constant MLSS = 8g/LConstant MLSS = 8g/L
•• SteadySteady--state data collection began state data collection began
after 3 MCRTsafter 3 MCRTs
•• 2 week steady2 week steady--state data collection state data collection
periodperiod
•• MCRT was steadily decreased (5, 4, 3, 2 MCRT was steadily decreased (5, 4, 3, 2
d)d)
–– F/M (0.53, 0.73, 0.84, 1.4 gCOD/gVSS.d)F/M (0.53, 0.73, 0.84, 1.4 gCOD/gVSS.d)

Membrane Performance at 10Membrane Performance at 10--d d MCRT MCRT (F/M=0.34 gCOD/gVSS(F/M=0.34 gCOD/gVSS..d)d)
0
5
10
15
20
25
30
35
40
50 70 90 110 130 150 170 190
Days of Operation
0
50
100
150
200
250
300
Specific Flux @
20oC, LMH/bar
Flux Specific Flux
Large Foam EventChemical CleanStart-up

Membrane Performance at 5Membrane Performance at 5--d MCRT d MCRT (F/M=0.53 gCOD/gVSS(F/M=0.53 gCOD/gVSS..d)d)
0
5
10
15
20
25
30
35
40
180 190 200 210 220 230 240 250 260 270 280
Days of Operation
0
50
100
150
200
250
300
Specific Flux @
20oC, LMH/bar
Flux Specific Flux

Membrane Performance at 4Membrane Performance at 4--d MCRT d MCRT (F/M=0.73 gCOD/gVSS(F/M=0.73 gCOD/gVSS..d)d)
0
5
10
15
20
25
30
35
40
270 280 290 300 310 320 330
Days of Operation
0
50
100
150
200
250
300
Specific Flux @
20oC, LMH/bar
Flux Specific Flux
Intermittent Coarse Air Failure Foam Event

Membrane Performance at 3Membrane Performance at 3--d MCRT d MCRT (F/M=0.84 gCOD/gVSS(F/M=0.84 gCOD/gVSS..d)d)
0
5
10
15
20
25
30
35
40
355 360 365 370 375 380 385 390 395
Days of Operation
0
50
100
150
200
250
300
Specific Flux @
20oC, LMH/bar
Flux Specific Flux
Intermittent CoarseAir Failure
Routine FeedLine Cleaning
Routine FeedLine Cleaning

Membrane Performance at 2Membrane Performance at 2--d MCRT d MCRT (F/M=1.4 gCOD/gVSS(F/M=1.4 gCOD/gVSS..d)d)
0
5
10
15
20
25
30
35
40
390 395 400 405 410 415
Days of Operation
0
50
100
150
200
250
300
Specific Flux @
20oC, LMH/bar
Flux Specific Flux
Foam Event

Effect of F/M on SteadyEffect of F/M on Steady--State Fouling RateState Fouling Rate
y = 1.661x2.1977
R2 = 0.9517
0.0
0.5
1.0
1.5
2.0
2.5
3.0
3.5
4.0
0.0 0.2 0.4 0.6 0.8 1.0 1.2 1.4 1.6
F/M, g COD/g VSS.d
3 210 5 4
MCRT, d
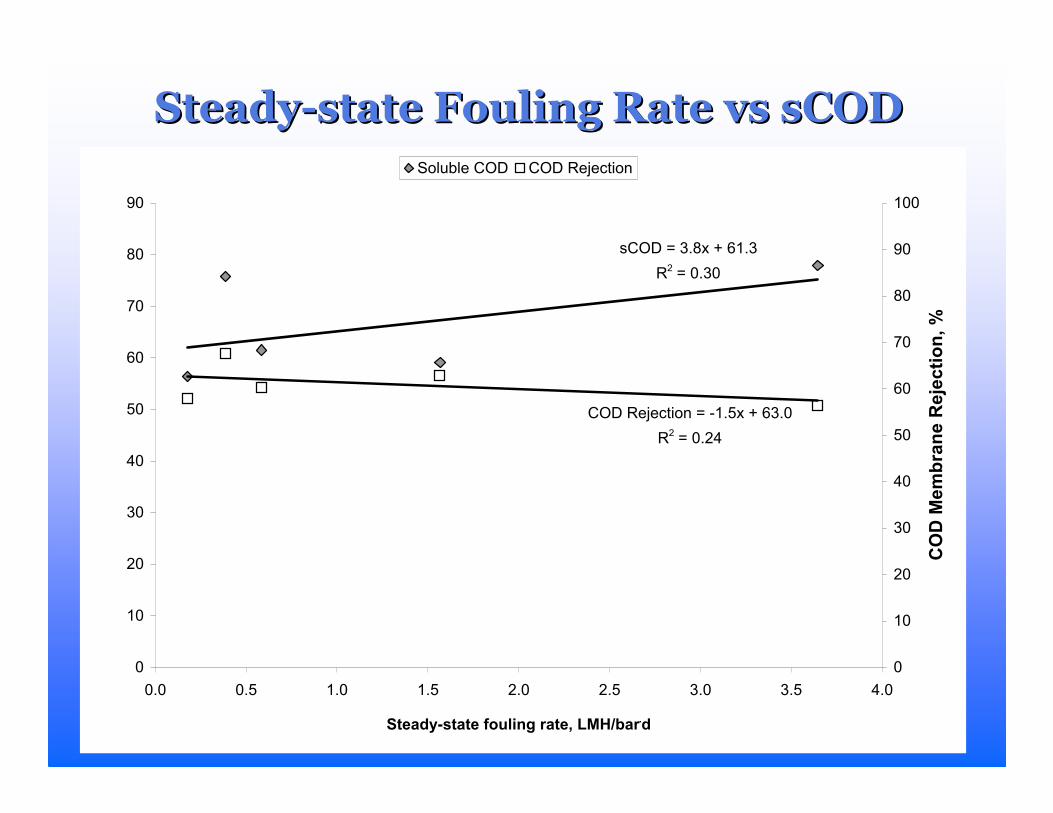
SteadySteady--state Fouling Rate state Fouling Rate vsvs sCODsCOD
sCOD = 3.8x + 61.3
R2 = 0.30
COD Rejection = -1.5x + 63.0
R2 = 0.24
0
10
20
30
40
50
60
70
80
90
0.0 0.5 1.0 1.5 2.0 2.5 3.0 3.5 4.0
Steady-state fouling rate, LMH/bar.d
0
10
20
30
40
50
60
70
80
90
100
COD Membrane Rejection, %
Soluble COD COD Rejection

SteadySteady--state Fouling Rate state Fouling Rate vsvs SMPSMP
SMPc = 4.2x + 16.2
R2 = 0.72
Total SMP = 7.0x + 36.8
R2 = 0.77
SMPp = 2.8x + 20.5
R2 = 0.36
0
10
20
30
40
50
60
70
0.0 0.5 1.0 1.5 2.0 2.5 3.0 3.5 4.0
Steady-state fouling rate, LMH/bar.d
Protein Carbohydrate Total
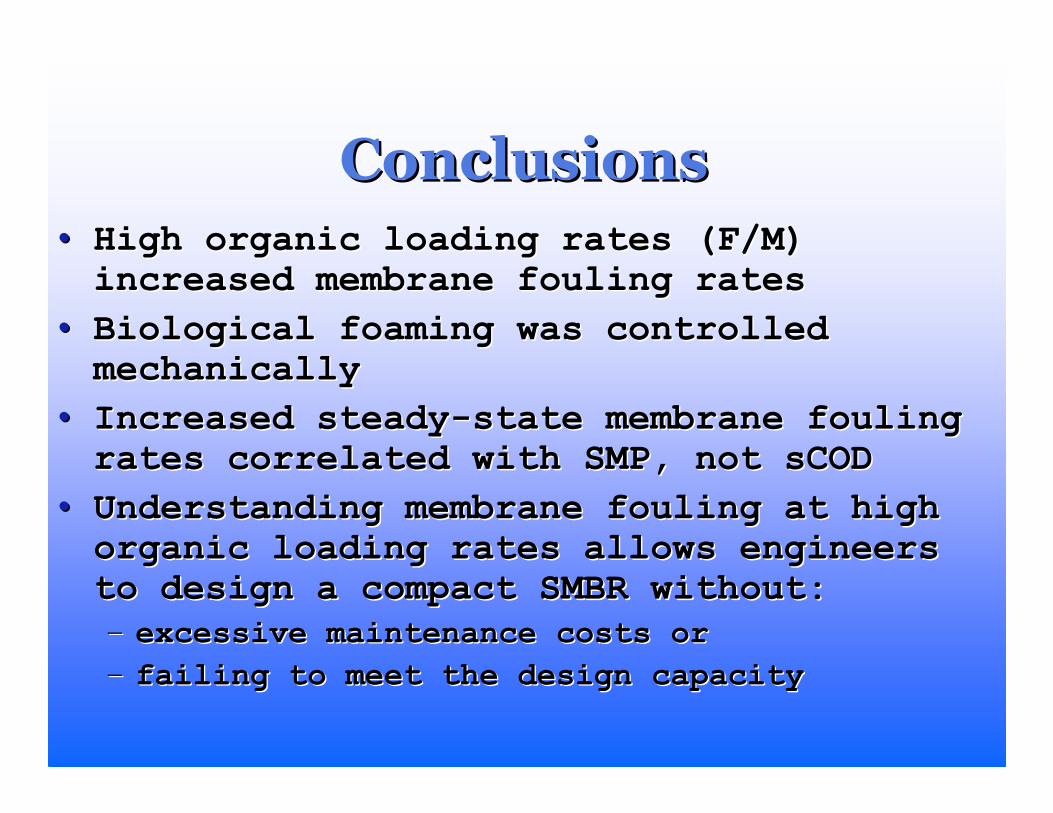
ConclusionsConclusions
•• High organic loading rates (F/M) High organic loading rates (F/M) increased membrane fouling ratesincreased membrane fouling rates
•• Biological foaming was controlled Biological foaming was controlled mechanicallymechanically
•• Increased steadyIncreased steady--state membrane fouling state membrane fouling rates correlated with SMP, not sCODrates correlated with SMP, not sCOD
•• Understanding membrane fouling at high Understanding membrane fouling at high organic loading rates allows engineers organic loading rates allows engineers to design a compact SMBR without:to design a compact SMBR without:
–– excessive maintenance costs orexcessive maintenance costs or
–– failing to meet the design capacityfailing to meet the design capacity
Why does high F/M cause
membrane fouling
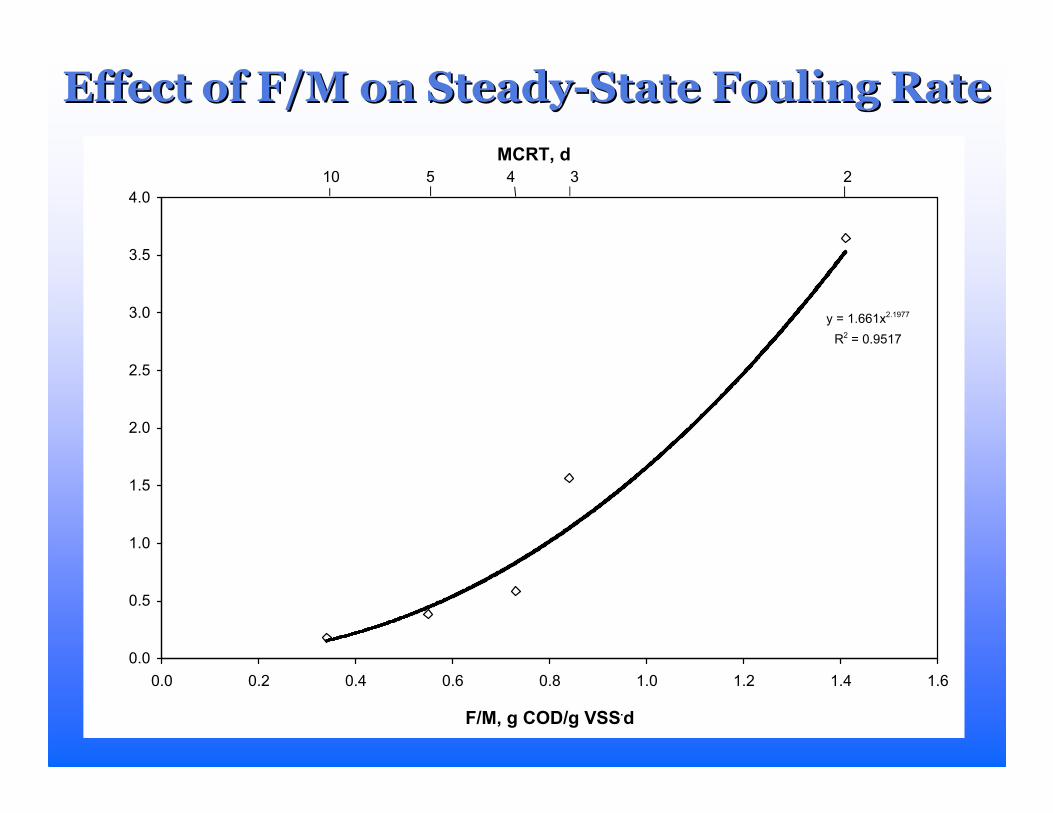
Effect of F/M on SteadyEffect of F/M on Steady--State Fouling RateState Fouling Rate
y = 1.661x2.1977
R2 = 0.9517
0.0
0.5
1.0
1.5
2.0
2.5
3.0
3.5
4.0
0.0 0.2 0.4 0.6 0.8 1.0 1.2 1.4 1.6
F/M, g COD/g VSS.d
3 210 5 4
MCRT, d

Equipment and ApparatusEquipment and Apparatus
•• BenchBench--scale scale
SMBRSMBR
•• Treating Treating
primary primary
effluent from effluent from
the City of San the City of San
FranciscoFrancisco’’s SEPs SEP
–– COD = 325 mg/LCOD = 325 mg/L
–– TSS = 98 mg/LTSS = 98 mg/L
Membrane Operation and Membrane Operation and CharacteristicsCharacteristics
•• Mitsubishi Mitsubishi
SteraporeSterapore®®
•• Nominal pore size Nominal pore size
= 0.4 = 0.4 µµµµµµµµmm
•• Membrane flux = 18 Membrane flux = 18
L/mL/m2.2.hh
•• Coarse bubble air Coarse bubble air
= 0.4 L/s= 0.4 L/s
•• 9 min operating 9 min operating
cycle followed by cycle followed by
30 sec relax30 sec relax
Experimental MethodsExperimental Methods
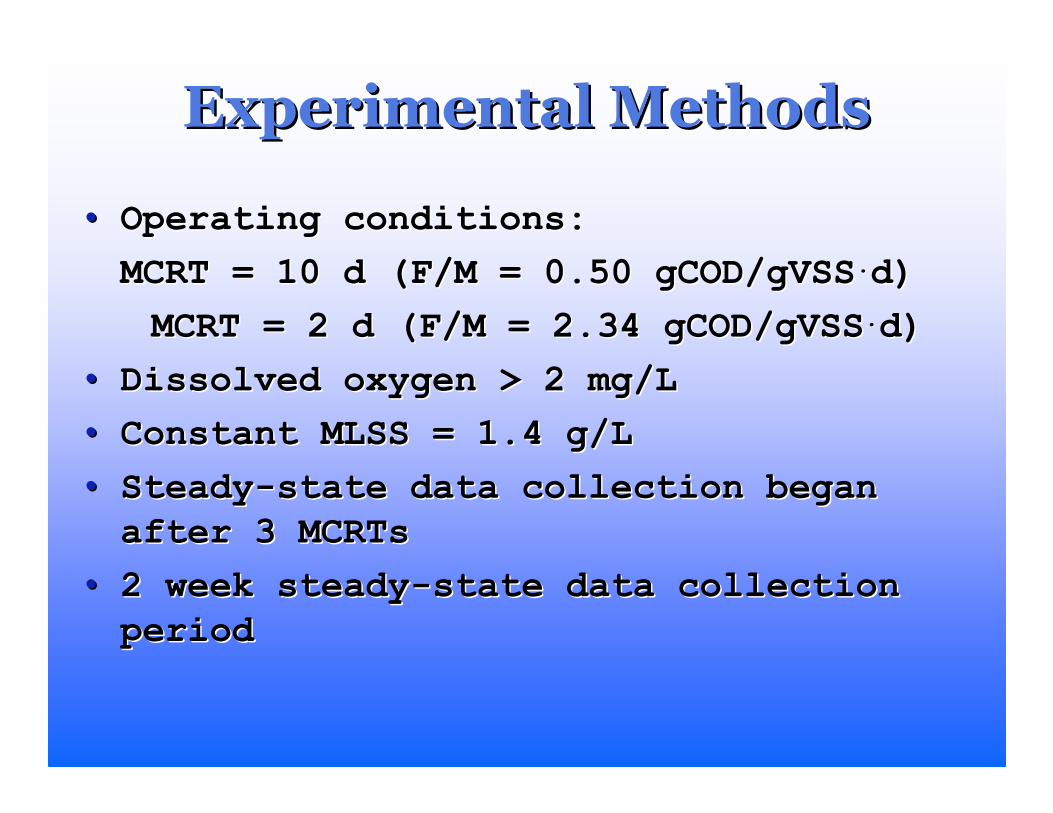
•• Operating conditions:Operating conditions:
MCRT = 10 d (F/M = 0.50 gCOD/gVSSMCRT = 10 d (F/M = 0.50 gCOD/gVSS..d)d)
MCRT = 2 d (F/M = 2.34 MCRT = 2 d (F/M = 2.34 gCOD/gVSSgCOD/gVSS..dd))
•• Dissolved oxygen > 2 mg/LDissolved oxygen > 2 mg/L
•• Constant MLSS = 1.4 g/LConstant MLSS = 1.4 g/L
•• SteadySteady--state data collection began state data collection began
after 3 MCRTsafter 3 MCRTs
•• 2 week steady2 week steady--state data collection state data collection
periodperiod

Tools Used to Understand Tools Used to Understand Membrane FoulingMembrane Fouling
•• SteadySteady--state membrane fouling rate during state membrane fouling rate during
operationoperation
•• Molecular weight distribution of influent, Molecular weight distribution of influent,
SMP and effluentSMP and effluent
•• FTIR of clean and fouled membranesFTIR of clean and fouled membranes
•• Batch filtration experiments expressed as Batch filtration experiments expressed as
Modified Fouling Index (MFI)Modified Fouling Index (MFI)
–– Stir cell filtration of steady state mixed liquor Stir cell filtration of steady state mixed liquor
with UF (NMWCO = 300 with UF (NMWCO = 300 kDakDa, PES), PES)
–– Data presented as MFI at 20Data presented as MFI at 20ooC and 210 C and 210 kPakPa
•• Fouled membrane resistancesFouled membrane resistances

Fouled Membrane Resistance Fouled Membrane Resistance TermsTerms
•• R=RR=RMM+R+RFF+R+RCC
•• RR = Total = Total
resistanceresistance
•• RRMM = Membrane= Membrane
•• RRCC = Cake Layer= Cake Layer
•• RRFF = Foulants= Foulants–– Organics AdsorptionOrganics Adsorption
–– Inorganic Inorganic
PrecipitationPrecipitation

Membrane Performance at 10Membrane Performance at 10--d d MCRT MCRT (F/M=0.50 gCOD/gVSS(F/M=0.50 gCOD/gVSS..d)d)
0
5
10
15
20
25
30
35
40
0 10 20 30 40 50 60 70 80
Days of Operation
0
100
200
300
400
500
600
Specific Flux @
20oC, LMH/bar
Flux Specific Flux
Chemical Cleaning
Start up 66 Days at 10-d MCRT
(F/M = 0.50 gCOD/gVSS.d)
Steady-state fouling rate

Membrane Performance at 2Membrane Performance at 2--d MCRTd MCRT(F/M=2.34 gCOD/gVSS(F/M=2.34 gCOD/gVSS..d)d)
0
5
10
15
20
25
30
35
40
75 80 85 90 95 100 105
Days of Operation
0
100
200
300
400
500
600
Specific Flux @
20oC, LMH/bar
Flux Specific Flux
ImproperWastingVolumes
Chemical Cleaning Chemical CleaningChemicalCleaning
25 Days at 2-d MCRT
(F/M = 2.34 gCOD/gVSS.d)
Steady-state
SteadySteady--State Membrane State Membrane Fouling RatesFouling Rates
•• Membrane fouling rates increased Membrane fouling rates increased
with F/Mwith F/M
•• Total SMP concentration increased Total SMP concentration increased
with F/Mwith F/M
•• Unlike pilotUnlike pilot--scale work, scale work, SMPcSMPc did did
not increase with increasing F/Mnot increase with increasing F/M
F/M MCRTSteady-state Fouling
Rate @ 20oC
SMPc SMPp Total SMP
gCOD/gVSS.d d LMH/bar
.d mg/L mg/L mg/L
0.50 10 2.60 24 14 38
2.34 2 59.0 10 49 59

Carbohydrate Molecular Weight Carbohydrate Molecular Weight Increased at Low MCRT (High F/M)Increased at Low MCRT (High F/M)
0
5
10
15
20
25
Influent SMP - 10 d SMP - 2 d Effluent - 10 d Effluent - 2 d
> 10 kDa 10 kDa - 1 kDa < 1 kDa
Carbohydrate concentration, mg/L
Sample

Protein Molecular Weight Increased Protein Molecular Weight Increased at Low MCRT (High F/M)at Low MCRT (High F/M)
0
10
20
30
40
50
60
70
Influent SMP - 10 d SMP - 2 d EFF - 10 d EFF - 2 d
> 10 kDa 10 kDa - 1 kDa < 1 kDaProtein Concentration, mg/L
Sample

1 0
1 0 0
2 0
4 0
6 0
8 0
4 0 0 0 6 5 01 0 0 02 0 0 03 0 0 0
%T
W a ve num be r[cm -1]
Fouled Membrane FTIR ResultsFouled Membrane FTIR Results
2-d MCRT
10-d MCRT (Green) Virgin (Blue)
3380 - indicates OH stretching
1660 and 1540 - indicates NH and COO- (protein)
1060 - indicates CO stretching of polysaccharides

Fouled Membrane ResistanceFouled Membrane Resistance1010--d MCRTd MCRT
Fouling Resistance During 10 days MCRT Operation
y = 0.4014x
R2 = 0.5914y = 4.0956x
R2 = 0.9757
y = 4.2319x
R2 = 0.9979
0
5
10
15
20
25
0 5 10 15 20 25 30 35 40
Viscosity * Flux
(µµµµg/s2)
Chemical Physical
Before cleaning
After 66 d of operation without a chemical clean
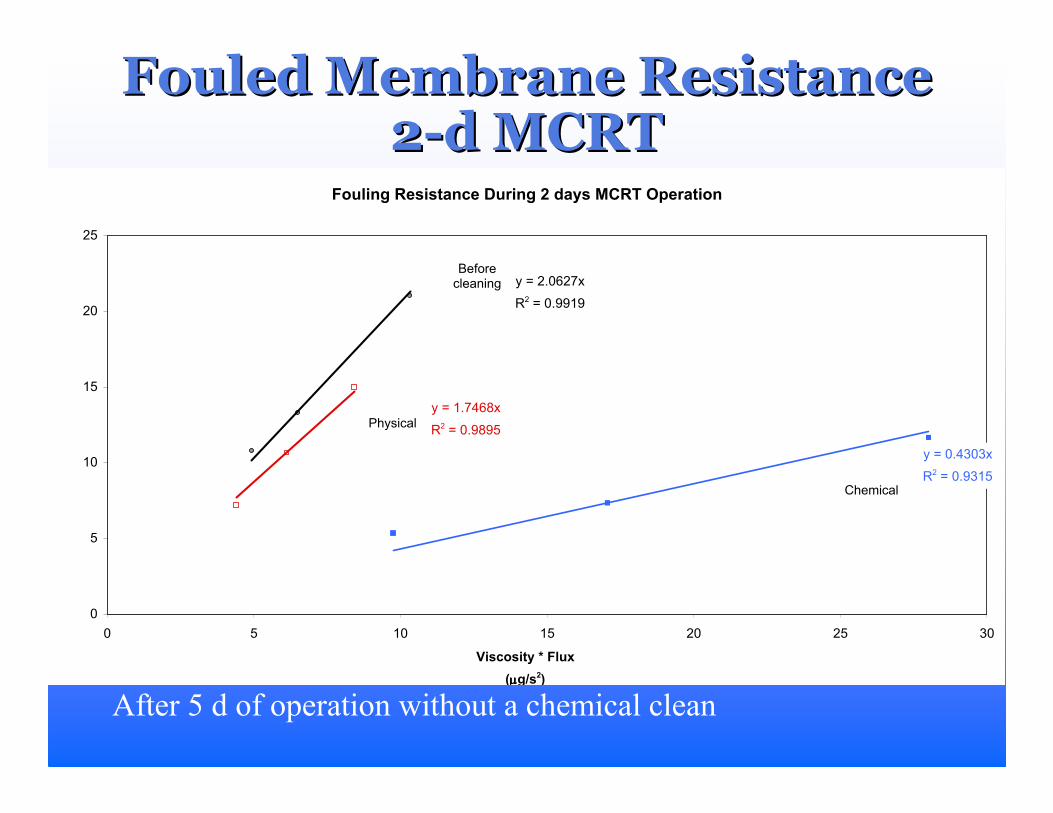
Fouled Membrane ResistanceFouled Membrane Resistance22--d MCRTd MCRT
After 5 d of operation without a chemical clean
Fouling Resistance During 2 days MCRT Operation
y = 0.4303x
R2 = 0.9315
y = 1.7468x
R2 = 0.9895
y = 2.0627x
R2 = 0.9919
0
5
10
15
20
25
0 5 10 15 20 25 30
Viscosity * Flux
(µµµµg/s2)
Chemical
Physical
Before cleaning

Fouled Membrane Resistance Fouled Membrane Resistance TermsTerms
RMembrane
9%
RCake
3%
RFoulant
88%
R = 4.23x10¹² m-1
A
RMembrane
21%
RCake
15%RFoulant
64%
R = 2.07x10¹² m-1
B
Fouled membrane R distribution for SMBR:
A) 10-d MCRT (0.5 gCOD/gVSS.d)
B) 2-d MCRT (2.34 gCOD/gVSS.d)

Batch Filtration ResultsBatch Filtration Results•• Operating membrane permeability Operating membrane permeability
was similar when analyzed 63 and was similar when analyzed 63 and 71 LMH/bar for the 271 LMH/bar for the 2--d and 10d and 10--d d MCRTsMCRTs
•• Factor of 2 in total fouled Factor of 2 in total fouled resistanceresistance
•• Used a batch filtration test to Used a batch filtration test to better understand these better understand these differences and importance of differences and importance of various components to foulingvarious components to fouling
•• Stir cell filtration of steady Stir cell filtration of steady state mixed liquor with UF state mixed liquor with UF (NMWCO = 300 (NMWCO = 300 kDakDa, PES), PES)
•• Data presented as MFI at 20Data presented as MFI at 20ooC C and 210 and 210 kPakPa
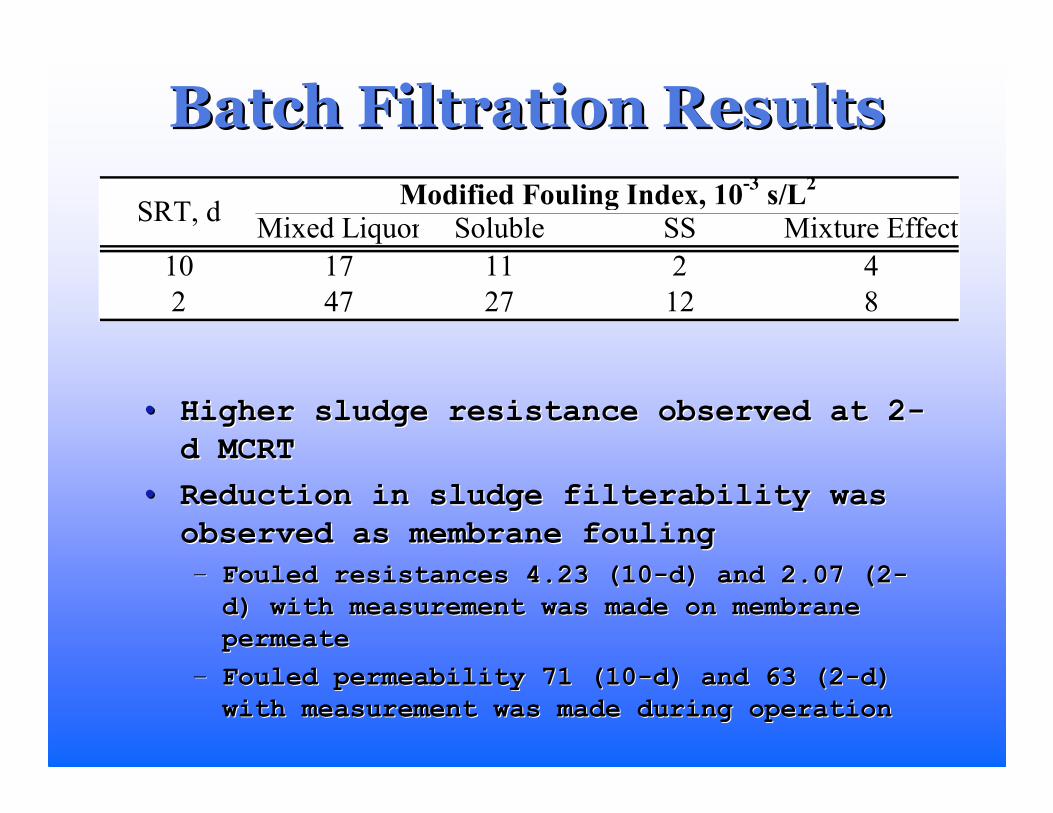
Batch Filtration ResultsBatch Filtration Results
•• Higher sludge resistance observed at 2Higher sludge resistance observed at 2--
d MCRTd MCRT
•• Reduction in sludge filterability was Reduction in sludge filterability was
observed as membrane foulingobserved as membrane fouling
–– Fouled resistances 4.23 (10Fouled resistances 4.23 (10--d) and 2.07 (2d) and 2.07 (2--
d) with measurement was made on membrane d) with measurement was made on membrane
permeatepermeate
–– Fouled permeability 71 (10Fouled permeability 71 (10--d) and 63 (2d) and 63 (2--d) d)
with measurement was made during operationwith measurement was made during operation
Mixed Liquor Soluble SS Mixture Effect
10 17 11 2 4
2 47 27 12 8
SRT, dModified Fouling Index, 10
-3 s/L
2

Batch Filtration ResultsBatch Filtration Results
•• MFI was higher for all fractions at MCRT = 2 dMFI was higher for all fractions at MCRT = 2 d
•• Sludge was centrifuges at 12,000 g for 15 Sludge was centrifuges at 12,000 g for 15 minutesminutes
–– Soluble fraction was supernatantSoluble fraction was supernatant
–– Suspended solids (SS) fraction was pelletSuspended solids (SS) fraction was pellet
•• SS was measured by SS was measured by resuspendingresuspending pellet with pellet with batch stir cell permeate batch stir cell permeate
•• Soluble MFI was almost 3 times higher at low Soluble MFI was almost 3 times higher at low MCRTMCRT
•• SS MFI increased 6 times at low MCRT (sticky SS MFI increased 6 times at low MCRT (sticky cake)cake)
•• Mixture effect was observed at both conditionsMixture effect was observed at both conditions
Mixed Liquor Soluble SS Mixture Effect
10 17 11 2 4
2 47 27 12 8
SRT, dModified Fouling Index, 10
-3 s/L
2

SMBR Sludge- Low EPS/High Colloidal Material
Activated Sludge- High EPS/Low Colloidal Material

EPS DataEPS Data
< 1 kDa 10 kDa - 1 kDa > 10 kDa Total
10 4.3 17.6 7.8 29.7
2 5.5 6.8 18.3 30.6
10 30.6 46.2 14.4 91.2
2 48.5 11.3 60.9 120.7
Mean Concentration, mg/gVSS
Carbohydrate
Protein
MCRT, d
No difference in total carbohydrate concentrationNo difference in total carbohydrate concentration
most commonly cited most commonly cited foulantfoulant
More total protein at low MCRTMore total protein at low MCRT
More high molecular weight organics at low MCRTMore high molecular weight organics at low MCRT

Carbohydrate EPSCarbohydrate EPS
Dramatic shift between the >10kDa and 10-1 kDa range
A) 10-d MCRT (0.5 gCOD/gVSS.d)
B) 2-d MCRT (2.34 gCOD/gVSS.d)
> 10 kDa
26%
10 kDa - 1
kDa
60%
< 1 kDa
14%
Carbohydrate
Total Concentration: 29.7±1.7 mg/gVSS
A
> 10 kDa
60%
10 kDa - 1
kDa
22%
< 1 kDa
18%
Carbohydrate
Total Concentration: 30.6±1.5 mg/gVSS
B
Protein EPSProtein EPS
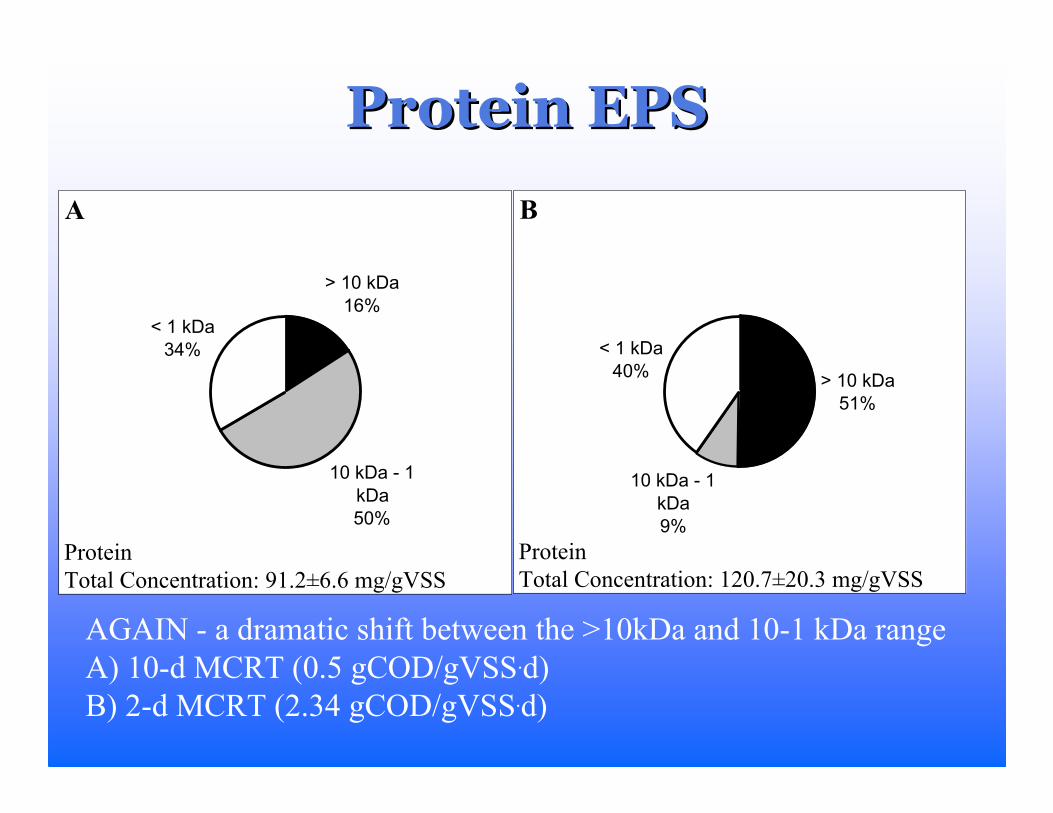
AGAIN - a dramatic shift between the >10kDa and 10-1 kDa range
A) 10-d MCRT (0.5 gCOD/gVSS.d)
B) 2-d MCRT (2.34 gCOD/gVSS.d)
> 10 kDa
16%
10 kDa - 1
kDa
50%
< 1 kDa
34%
Protein
Total Concentration: 91.2±6.6 mg/gVSS
A
> 10 kDa
51%
10 kDa - 1
kDa
9%
< 1 kDa
40%
Protein
Total Concentration: 120.7±20.3 mg/gVSS
B

ConclusionsConclusions
•• High organic loading rates (F/M) High organic loading rates (F/M) increased membrane fouling ratesincreased membrane fouling rates
•• Increased steadyIncreased steady--state membrane fouling state membrane fouling rates correlated with total SMPrates correlated with total SMP
•• MW of carbohydrate and protein SMP MW of carbohydrate and protein SMP increased with F/Mincreased with F/M
•• Membrane rejected higher MW SMPMembrane rejected higher MW SMP
•• FTIR indicated protein and carbohydrate FTIR indicated protein and carbohydrate presence on fouled membranes with presence on fouled membranes with stronger adsorptions resulting from the stronger adsorptions resulting from the 22--d MCRT conditiond MCRT condition

ConclusionsConclusions
•• Membrane fouling was primarily due to Membrane fouling was primarily due to the adsorption of organics and Rthe adsorption of organics and RFF was was dominate resistance term of fouled dominate resistance term of fouled membranesmembranes
•• RRCC increased with F/M and this was increased with F/M and this was attributed to changes in attributed to changes in flocfloc properties properties that result in a that result in a ““stickysticky”” cakecake
•• Sludge filtration resistance (MFI) Sludge filtration resistance (MFI) increased with F/Mincreased with F/M
•• MFI of suspended solids increased 6 MFI of suspended solids increased 6 times, supporting the increasing times, supporting the increasing importance of the cake layer with importance of the cake layer with increasing F/Mincreasing F/M