INTRODUCTION AND OVERVIEW COPYRIGHTED...
26
1 INTRODUCTION AND OVERVIEW DAVID L. KIRCHMAN College of Marine and Earth Studies, University of Delaware, Lewes, DE 19958, U.S.A. Marine microbes are capable of flourishing in all oceanic habitats, from several kilometers below the seafloor to the top millimeter of the ocean surface. They thrive in environmental conditions where other organisms cannot, ranging from supercooled brine channels of Arctic ice floes to near-boiling waters of hydrothermal vents. Consequently, marine microbes are the most numerous group of organisms on the planet. In addition to being abundant, the many different types of marine microbes carry out many different types of metabolism. As a consequence of this diversity, marine microbes are involved in virtually all geochemical reactions occur- ring in the oceans. Many of these microbes, the ecological interactions among them, and the bio- geochemical processes they mediate are the topics covered by this book. What is marine microbial ecology? A complicated answer is given in the first edition of this book (Kirchman and Williams 2000). A simple answer is that it is the study of the ecology of microbes in marine systems. “Microbes” includes all organisms smaller than about 100 mm, which can be seen only with a microscope. These organisms include bacteria, archaea, and protists (single-celled eukaryotes). Chapter 12 examines the ecological roles of viruses and phages, things that arguably are not living and thus are not microbes. Colleagues outside the field sometimes assume that “microbe” and “microorganisms” refer only to bac- teria, even just heterotrophic bacteria. Certainly these microbes are quite abundant and ecologically important in the oceans, and readers will see several chapters Microbial Ecology of the Oceans, Second Edition. Edited by David L. Kirchman Copyright # 2008 John Wiley & Sons, Inc. 1 COPYRIGHTED MATERIAL
-
Upload
duongduong -
Category
Documents
-
view
214 -
download
0
Transcript of INTRODUCTION AND OVERVIEW COPYRIGHTED...

1INTRODUCTION AND OVERVIEW
DAVID L. KIRCHMANCollege of Marine and Earth Studies, University of Delaware, Lewes, DE 19958, U.S.A.
Marine microbes are capable of flourishing in all oceanic habitats, from severalkilometers below the seafloor to the top millimeter of the ocean surface. Theythrive in environmental conditions where other organisms cannot, ranging fromsupercooled brine channels of Arctic ice floes to near-boiling waters of hydrothermalvents. Consequently, marine microbes are the most numerous group of organisms onthe planet. In addition to being abundant, the many different types of marinemicrobes carry out many different types of metabolism. As a consequence of thisdiversity, marine microbes are involved in virtually all geochemical reactions occur-ring in the oceans.
Many of these microbes, the ecological interactions among them, and the bio-geochemical processes they mediate are the topics covered by this book.
What is marine microbial ecology? A complicated answer is given in the firstedition of this book (Kirchman and Williams 2000). A simple answer is that itis the study of the ecology of microbes in marine systems. “Microbes” includesall organisms smaller than about 100 mm, which can be seen only with amicroscope. These organisms include bacteria, archaea, and protists (single-celledeukaryotes). Chapter 12 examines the ecological roles of viruses and phages,things that arguably are not living and thus are not microbes. Colleagues outsidethe field sometimes assume that “microbe” and “microorganisms” refer only to bac-teria, even just heterotrophic bacteria. Certainly these microbes are quite abundantand ecologically important in the oceans, and readers will see several chapters
Microbial Ecology of the Oceans, Second Edition. Edited by David L. KirchmanCopyright # 2008 John Wiley & Sons, Inc.
1
COPYRIG
HTED M
ATERIAL

about them. But there is more to microbial ecology than just the study ofheterotrophic bacteria.
The purpose of this chapter is to provide an overview of the book and of someimportant marine microbes and the parts of biogeochemical processes theymediate. The summary by Sherr and Sherr (2000) remains relevant today, andyou are urged to read it. This chapter will take a complementary approach. In fact,much of the entire first edition of this book remains relevant today, and readers areurged to look it over. Table 1.1 summarizes some of the functional groups ofmicrobes discussed here and in the book as a whole.
TABLE 1.1 Functional Groups of Microbes in the Oceans Discussed in this Book
Functional Group Function Type of MicrobeDiscussed in
Chapters
Primary producers Fix CO2 to produce organicmaterial using light energy
Eukaryotes andcyanobacteria
2, 3, 5, 6, 13,14
Photoheterotrophs Use organic material, aided bylight energy
Cyanobacteria andother bacteriaa
3, 5, 10
Heterotrophicprokaryotes
Mineralize and oxidizedissolved organic matter(DOM) to produce biomassand inorganic byproducts
Bacteria andarchaea
2–5, 7–11,13, 14
Grazers Control prey populations andrelease dissolved material
Eukaryotes 2, 6, 8, 11
Viruses Control prey populations,release dissolved material,and mediate geneticexchange
Not applicable 3, 8, 12
N2 fixers(diazotrophs)
Reduce N2 to ammonium Cyanobacteriab 3, 13, 14
Nitrifiers Oxidization of ammonium tonitrate
Bacteria andarchaea
3, 4, 14
Denitrifiersc Release of N2 or N2O duringoxidation of ammonium orreduction of nitrate
Bacteria andarchaea
14
aMany protists are mixotrophs (see Chapters 6 and 11) and some eukaryotic phytoplankton are capable ofusing DOM, but heterotrophic bacteria and archaea usually dominate DOM fluxes.bSome heterotrophic bacteria and archaea are capable of fixing N2, but cyanobacteria dominate N2, fixationin the oceans.cThe term “denitrification” is often reserved for the production of N2 or N2O by dissimilatory nitratereduction. Here the anammox reaction (oxidation of ammonium) is included because it too results in theloss of N as N2 gas from the system. See Chapter 14 for more on these definitions.
2 INTRODUCTION AND OVERVIEW

EUKARYOTIC PHYTOPLANKTON AND CYANOBACTERIA
A starting point for the carbon cycle is carbon fixation or the transformation of CO2 toa “fixed,” nongaseous form—organic carbon (Fig. 1.1). Unlike terrestrial ecosystems,carbon fixation in marine systems is nearly exclusively by free-floating microbial“plants.” The exceptions include a few near-shore environments such as saltmarshes and mangrove stands where higher-plant production dominates, and insome shallow marine environments where much of the primary production can beby benthic algae (Behringer and Butler 2006; Gattuso et al. 2006; Segal et al.2006). Aquatic ecologists use the term “phytoplankton” (or algae) rather than“plants,” but in fact there are some important similarities between plants on landand phytoplankton in lakes and the oceans. (Algae are found in terrestrial environ-ments, but here I use “land plants” to mean larger, higher plants, which dominateterrestrial primary production.) Both land plants and phytoplankton are autotrophs(CO2 is their carbon source) and are the main primary producers in their respectiveecosystems, using the same mechanism for fixing CO2, the Calvin–Benson–Bassham cycle. Both have chlorophyll a in reaction centers where light energy is con-verted to chemical energy. However, unlike land plants, in marine phytoplankton themain pigments absorbing light energy, “the light-harvesting pigments,” are not chloro-phylls. An example of these other pigments include the carotenoids, one beingfucoxanthin, which is abundant in diatoms. For this reason, many phytoplanktonare not green, because their dominant light-harvesting pigments absorb light withwavelengths (color) that differ from that absorbed by land plants.
The most important difference, however, between land plants and phytoplanktonis the most obvious one: land plants, such as California coastal redwoods and giantsequoias that tower 100 m above the ground, are among the largest creatures on the
Figure 1.1 The role of microbes in the oceanic carbon cycle. The numbers in parentheses arestanding stocks of carbon with units of pgC (1 pgC ¼ 1015 gC). The other numbers are rateswith units of pgC per year. The numbers are from Hedges and Oades (1997) and from estimatesof the average fraction of primary production routed through dissolved organic carbon (DOC)to bacteria (Chapter 9), assuming a growth efficiency of 15 percent.
EUKARYOTIC PHYTOPLANKTON AND CYANOBACTERIA 3

planet, while phytoplankton are among the smallest, some as tiny as a micrometer orless (1026 m). This difference in size has many implications for how marine andindeed all aquatic ecosystems are structured. By “structured,” I mean the size andnumber of organisms, biochemical composition, phylogenetic diversity, growthrates and net changes in population sizes, and trophic interactions (who is eatingwhom). Size matters for many of the processes discussed in this book.
Another huge difference between terrestrial plants and phytoplankton is that thelatter includes cyanobacteria, in addition to eukaryotic algae. Cyanobacteria are dis-cussed in Chapters 3 and 5. Especially in the nutrient-poor, oligotrophic oceans,cyanobacteria can account for a high fraction (nearly 90 percent) of primary pro-duction and of total phytoplankton biomass. Estimates for cyanobacteria maydecrease as we learn more about small eukaryotic phytoplankton (see Chapter 6),but cyanobacteria will undoubtedly remain important in the oceans. Two groups ofcyanobacteria are especially large contributors to primary production and phyto-plankton biomass: Synechococcus and Prochlorococcus (Table 1.2). The cells inboth cyanobacterial groups are small (1 mm in diameter or less), smaller than eukary-otic phytoplankton. Phylogenetically, cyanobacteria are bacteria; they lack a nucleus,and their cell wall and membranes are like those of Gram-negative bacteria (Hoiczykand Hansel 2000). Functionally, however, both Synechococcus and Prochlorococcusare members of the phytoplankton community because they are mainly photoauto-trophic and use light energy to fix CO2 by similar mechanisms (e.g., both have theCalvin–Benson cycle) as found in eukaryotic phytoplankton.
Cyanobacteria and Blue–Green Algae
The old term for cyanobacteria is “blue–green algae,” which hints at the mainpigments of some of these microbes. The green is due to chlorophyll a, whilethe blueish tinge comes from phycocyanin. When isolated from other pigments,the striking blue color of phycocyanin emerges. Marine Synechococcus, oneof the main cyanobacteria found in the ocean, has phycocyanin, but thismicrobe in pure cultures is blood-red due to phycoerythrin.
TABLE 1.2 Comparison of the Two Major Coccoid Cyanobacterial GeneraFound in the Oceans
Property Synechococcus Prochlorococcus
Size (diameter) 0.9 mm 0.7 mmChlorophyll a Yes Yes, but modifiedChlorophyll b No Yes, but modifiedPhycobilinsa Yes VariableDistributionb Cosmopolitan Oceanic gyresN2 fixation Some species No
aPhycobilins are the major light-harvesting pigments in cyanobacteria.bNeither group of cyanobacteria is found in cold, high-latitude oceans. Synechococcus can be abundant incoastal waters, unlike Prochlorococcus.
4 INTRODUCTION AND OVERVIEW

Microbiologists knew about cyanobacteria for over a century, but the highabundances of oceanic Synechococcus and Prochlorococcus were discovered onlyaround 1977 and 1986, respectively (Chisholm et al. 1988; Waterbury et al. 1979).Since then, we have learned much about these organisms. In contrast to mostother marine bacteria, marine cyanobacteria have convenient markers, theirpigments, for studying them. These unique pigments make it possible to examineProchlorococcus by flow cytometry and Synechococcus by microscopy as well asby flow cytometry (see Chapter 6 for a description of flow cytometry). Againunlike many other marine bacteria, ecologically relevant representatives from thetwo cyanobacterial groups can be isolated and grown alone in pure culture in the lab-oratory. Consequently, we have learned much about the physiology and biochemistryof these microbes, and the genomes of several of them have been completelysequenced (Dufresne et al. 2003; Palenik et al. 2007; Rocap et al. 2003).
The eukaryotic members of the phytoplankton community are also important inmany oceanic waters. The large species (10–100 mm, which is large in the microbialworld) are relatively easy to identify because they have distinctive shapes and sizes,in addition to their distinctive light-harvesting pigments. Large phytoplankton, suchas diatoms and coccolithophorids, have been studied for years, and are well knownfor their importance in coastal waters, especially in spring when they form denseblooms. But often, much smaller eukaryotic phytoplankton species are much moreabundant and dominate phytoplankton biomass, along with the cyanobacteria.These small eukaryotes are only slightly larger than bacteria and are members ofthe “picoplankton” community, which includes all microbes 2 mm or less in size(see Chapter 2). Unlike large phytoplankton, the picophytoplankton are hard toidentify by traditional methods, because of their size and lack of distinguishing fea-tures. In Chapter 6, Worden and Not discuss these important microbes and the use ofmolecular tools and other methods for examining them.
PHOTOHETEROTROPHIC BACTERIA
All microbes, not just eukaryotic phytoplankton and cyanobacteria, are affected bylight directly or indirectly in the surface layer of the oceans (Moran and Zepp2000). An example of an indirect effect is the photochemical modification of dis-solved organic matter (DOM) used by heterotrophic bacteria. The direct effectsinclude the damage of microbial DNA by short-wavelength light, especially in theultraviolet region (200–400 nm). These types of light effects are well known.
Less well known is the use of light by phototrophic bacteria to drive adenosinetriphosphate (ATP) synthesis while also obtaining energy from other sources, mostprominently the oxidation of organic material (Table 1.3). Chapter 5 discussesphotoheterotrophic bacteria in the oceans, including cyanobacteria, proteorhodopsin-bearing bacteria and aerobic anoxygenic phototrophic bacteria (AAP bacteria, orAAnP in Chapter 5). Except for cyanobacteria, these bacteria are not autotrophicand do not contribute to primary production. We think that they can synthesisATP via both phototrophic and heterotrophic mechanisms, hence making them
PHOTOHETEROTROPHIC BACTERIA 5
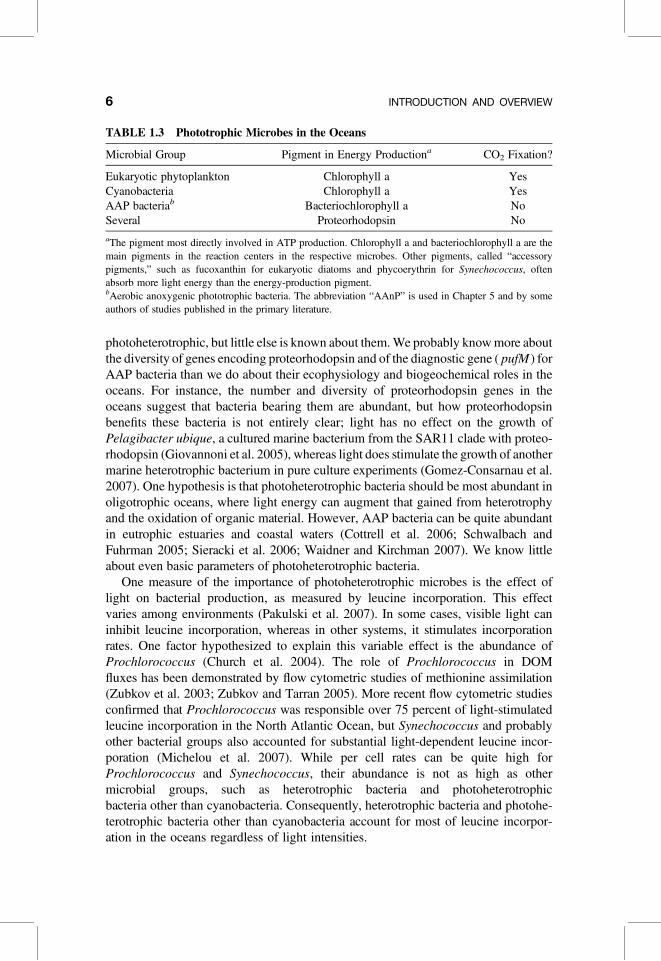
photoheterotrophic, but little else is known about them. We probably know more aboutthe diversity of genes encoding proteorhodopsin and of the diagnostic gene ( pufM ) forAAP bacteria than we do about their ecophysiology and biogeochemical roles in theoceans. For instance, the number and diversity of proteorhodopsin genes in theoceans suggest that bacteria bearing them are abundant, but how proteorhodopsinbenefits these bacteria is not entirely clear; light has no effect on the growth ofPelagibacter ubique, a cultured marine bacterium from the SAR11 clade with proteo-rhodopsin (Giovannoni et al. 2005), whereas light does stimulate the growth of anothermarine heterotrophic bacterium in pure culture experiments (Gomez-Consarnau et al.2007). One hypothesis is that photoheterotrophic bacteria should be most abundant inoligotrophic oceans, where light energy can augment that gained from heterotrophyand the oxidation of organic material. However, AAP bacteria can be quite abundantin eutrophic estuaries and coastal waters (Cottrell et al. 2006; Schwalbach andFuhrman 2005; Sieracki et al. 2006; Waidner and Kirchman 2007). We know littleabout even basic parameters of photoheterotrophic bacteria.
One measure of the importance of photoheterotrophic microbes is the effect oflight on bacterial production, as measured by leucine incorporation. This effectvaries among environments (Pakulski et al. 2007). In some cases, visible light caninhibit leucine incorporation, whereas in other systems, it stimulates incorporationrates. One factor hypothesized to explain this variable effect is the abundance ofProchlorococcus (Church et al. 2004). The role of Prochlorococcus in DOMfluxes has been demonstrated by flow cytometric studies of methionine assimilation(Zubkov et al. 2003; Zubkov and Tarran 2005). More recent flow cytometric studiesconfirmed that Prochlorococcus was responsible over 75 percent of light-stimulatedleucine incorporation in the North Atlantic Ocean, but Synechococcus and probablyother bacterial groups also accounted for substantial light-dependent leucine incor-poration (Michelou et al. 2007). While per cell rates can be quite high forProchlorococcus and Synechococcus, their abundance is not as high as othermicrobial groups, such as heterotrophic bacteria and photoheterotrophicbacteria other than cyanobacteria. Consequently, heterotrophic bacteria and photohe-terotrophic bacteria other than cyanobacteria account for most of leucine incorpor-ation in the oceans regardless of light intensities.
TABLE 1.3 Phototrophic Microbes in the Oceans
Microbial Group Pigment in Energy Productiona CO2 Fixation?
Eukaryotic phytoplankton Chlorophyll a YesCyanobacteria Chlorophyll a YesAAP bacteriab Bacteriochlorophyll a NoSeveral Proteorhodopsin No
aThe pigment most directly involved in ATP production. Chlorophyll a and bacteriochlorophyll a are themain pigments in the reaction centers in the respective microbes. Other pigments, called “accessorypigments,” such as fucoxanthin for eukaryotic diatoms and phycoerythrin for Synechococcus, oftenabsorb more light energy than the energy-production pigment.bAerobic anoxygenic phototrophic bacteria. The abbreviation “AAnP” is used in Chapter 5 and by someauthors of studies published in the primary literature.
6 INTRODUCTION AND OVERVIEW

Chapter 5 calls cyanobacteria “operational heterotrophs” because they appear touse relatively few organic compounds in experiments with laboratory cultures.However, we really do not know which DOM compounds are used by cyanobacteriain the oceans. These microbes are probably mainly photoautotrophic, but they couldstill contribute substantially to the uptake of some DOM components.
DISSOLVED ORGANIC MATERIAL
This chapter is focused on organisms and viruses, but DOM is the “800-poundgorilla” in the ocean, making it hard to ignore: it is the largest pool of organiccarbon in the ocean and one of the largest in the biosphere. Concentrations ofDOM are not measured directly, but rather the key components are examined,given here in decreasing concentration and order of our understanding: dissolvedorganic carbon (DOC), dissolved organic nitrogen (DON), and dissolved organicphosphorus (DOP). The amount of C in the DOC pool is nearly equivalent tothe carbon in atmospheric CO2 (Hedges and Oades 1997), but concentrations ofindividual DOM components are very low, often nanomolar (1029 mol/L). Thebook edited by D. Hansell and C. Carlson provides an excellent overview of DOMin the oceans (Hansell and Carlson 2002) and another book discusses DOM–microbe interactions in several aquatic environments (Findlay and Sinsabaugh2003). Chapter 7 also discusses DOM extensively.
The large size of the DOC pool is perhaps the most obvious reason why it isincluded in oceanic carbon budgets and climate change models, but the fluxthrough this pool is also quite large and in many ways is a more important parameter.By “flux,” I mean the rate (usually expressed as mgC/m2/d or mmol-C/m2/d) atwhich DOM components are produced or utilized. Chapter 7 discusses what weknow about the fluxes of different components of the DOM pool. In spite of mostoceanic DOC being old and refractory, the rest of the DOC pool is sufficientlylabile (used readily by bacteria) that overall DOC fluxes are usually equivalent toabout 50 percent of primary production, and in some marine systems, the fraction iseven higher (Chapter 9). Some DOM comes directly from phytoplankton, forexample via release of small compounds or the sloughing off of large polymers associ-ated with the outside of phytoplankton cells. However, most of the DOM appears to beproduced by grazers (Nagata 2000), but every organism (and virus) in the oceancontributes to the production of DOM. Organic carbon from terrestrial sources canbe a substantial fraction of total DOM in lakes and estuaries (Cauwet 2002).
The high fluxes of DOM help explain many features of biological communities inmarine water columns. One important feature is the retention of material in the surfacelayer of the oceans. Because most of the DOC used by bacteria is respired andbecause of the small size of microbes, as much as 90 percent of primary productionis mineralized by grazers and heterotrophic bacteria in the upper surface layer of theopen oceans and only 10 percent or less sinks out to deeper waters. These percentagesvary greatly, especially in coastal waters where less primary production is mineralizedin the surface layer and more is exported to deep waters or horizontally to less
DISSOLVED ORGANIC MATERIAL 7

productive waters. Figure 1.2 illustrates the fates of primary production and thepossible relationships between DOM fluxes and export. At the risk of oversimplifyingcomplex relationships, the figure suggests that any carbon going into the microbialfood webs is less likely to end up in larger organisms and higher trophic levels orto sink out of the surface layer, leading to the prediction that there should be aninverse relationship between DOM fluxes and export out of the surface layer. Anyorganic carbon going into the dissolved pool has to pass through too many transfersamong trophic levels before it reaches organisms large enough to produce largeparticles that sink out of the surface layer.
“Mineralization” is the transformation of organic material back to its inorganicstarting material (“minerals”), most importantly CO2, NH4
þ and PO432.
There are some data supporting the inverse relationship between DOM fluxes andexport (Cho et al. 2001). Cho et al. (2001) examined bacterial biomass production inthe Yellow Sea, off the coast of South Korea, and calculated the ratio of bacterial pro-duction to primary production, which is a useful index of the relative size of the DOMflux. Heterotrophic bacteria are the main users of DOM in the oceans, as discussedbelow, although respiration by bacteria (oxidation of organic carbon back to CO2)is usually much larger than biomass production by bacteria (Chapters 8 and 9).Cho and colleagues found an inverse relationship between an index of organiccarbon export (the f-ratio—see text box) and the ratio of bacterial production toprimary production (Fig. 1.3), consistent with the negative relationship betweenexport and the phytoplankton–DOC–bacteria pathway implied by Figure 1.2.
While photochemical and other abiotic reactions can modify and even mineralizeDOM (especially from terrestrial sources) back to CO2 and other inorganic com-pounds (e.g., NH4
þ), the dominant reactions affecting marine DOM are catalyzedby microbes. Phytoplankton, grazers, and viral lysis all contribute to DOM pro-duction, and heterotrophic bacteria are the main users of DOM. Microbes thus setwhat goes into the DOM pool and what remains.
Figure 1.2 Main trophic interactions and the fate of primary production in the oceans.“DOC” is dissolved organic carbon. “Higher trophic levels” refers to organisms much largerthan microbes, such as zooplankton and fish. “Export” is the sinking of organic material outof the surface layer.
8 INTRODUCTION AND OVERVIEW

The f-Ratio, New Production, and Export
These three interrelated terms are used to describe relationships among nutrientsources, nutrient uptake, and export of material out of the surface mixed layer.The f-ratio is simply the ratio of nitrate uptake to total N use. New productionrefers to primary production supported by nutrients “new” to the surface layer(Dugdale and Goering 1967). The archetypal new nutrient is nitrate, because itwas thought that its only source was from nitrification in deep waters, whereasammonium was released by grazers and microbes in surface waters. If so, thenthe upward flux of nutrients would bring in nitrate but not ammonium, hencemaking nitrate the “new” nutrient for the surface layer. At steady state, nitrateuptake should equal export of N. While they have their uses, these terms haveseveral problems, and they seem to be falling out of use. One problem is that nitri-fication in euphotic zone could introduce nitrate to the surface layer that would notbe new (Yool et al. 2007), and N2 fixation would produce ammonium that wouldbe new, not regenerated. Whereas biological oceanographers once thought that N2
fixation rates were slow enough to be ignored, we now think that these rates arehigh relative to total N uptake and regeneration (Chapter 13).
Figure 1.3 An example of the relationship between export and the ratio of bacterial pro-duction to primary production. Export was estimated from the f-ratio, which is the ratio ofnitrate uptake to total N assimilation. Export and the f-ratio are equal at steady state. Datataken from Cho et al. (2001).
DISSOLVED ORGANIC MATERIAL 9

HETEROTROPHIC BACTERIA
More chapters of this book touch on heterotrophic bacteria than on any other group ofmicrobes (Table 1.1), for good reason. After viruses, heterotrophic bacteria are themost abundant organisms in the ocean and the entire biosphere. Their biomass canbe substantial as well (see below). More importantly, heterotrophic bacteria dominateDOM assimilation in the oceans, although DOM can be used by several typesof microbes, including cyanobacteria (see above), eukaryotic phytoplankton(Mulholland et al. 2002), protists, and perhaps even larger eukaryotes. The mainreason for the dominance by bacteria is size, more specifically the relationshipbetween surface area and volume. Large organisms have more surface area thansmall organisms and thus more transport systems in membranes for taking up dis-solved compounds from the surrounding water. However, large organisms have aneven more biomass or volume to support, the reason being surface area (SA) increasesonly as the square of the radius (SA ¼ 4pr2) whereas volume (V ) increases as thecube (V ¼ 4/3pr3). Consequently, the smallest microbes, bacteria, have the largestsurface area-to-volume ratio of all microbes and thus are able to out-compete allother microbes for dissolved compounds. Figure 1.4 gives a rough idea about thesizes of the major microbial groups in the oceans and in addition shows how abun-dance increases with decreasing size.
Figure 1.4 Cell abundance and size of major microbial groups in surface waters of aquatichabitats. These estimates are provided as a rough guide to the size and abundance of thesemicrobes. Here “bacteria” refers to heterotrophic bacteria and “zooplankton” to zooplanktonsuch copepods. Abundances can deviate greatly from the numbers provided here, as cansizes. Some protists can be as large as 50 mm and some eukaryotic phytoplankton are assmall as 1 mm.
10 INTRODUCTION AND OVERVIEW

Chapter 9 concentrates on the most important fate of the DOC taken up bybacteria: respiration. Most of the organic carbon taken up by bacteria is respired toCO2, and the associated organic nitrogen and phosphorus and the other elementsalso may or may not, depending on the need for these elements, be mineralizedback to NH4
þ, PO432, and so on (Kirchman 2000). Here I will make only a few
points about biomass and growth of these microbes to complement Chapter 9. Thereader is urged to review Ducklow (2000).
First, although heterotrophic bacteria are small, each having as little as 12 fgC(1.2� 10214 gC) per cell in the open ocean (Fukuda et al. 1998), their sheer numbersadd up such that the total biomass of heterotrophic bacteria (gC of bacterial cell massper liter) can be quite large, sometimes rivaling that of phytoplankton, especially in oli-gotrophic waters. (As discussed in Chapter 3, microbes in the other prokaryotic domain,archaea, are only abundant in deep waters (.500 m), where their biomass is roughlyequal to that of bacteria.) Estimates of bacterial biomass depend on conversion factors,such as the amount of carbon per cell or biovolume (Ducklow 2000), but these problemsdo not affect the general trends. Unlike terrestrial systems and eutrophic waters, thebiomass of primary producers is smaller than that of all heterotrophs (not just bacteria)in oligotrophic marine systems such as the open ocean gyres (Gasol et al. 1997).Chapter 10 discusses how bacterial biomass alone becomes a larger portion of totalbiomass in oligotrophic systems where phytoplankton biomass is low.
This large bacterial biomass sets some limits on growth rates for bacteria. Mostheterotrophic bacteria grow rapidly in laboratory pure cultures, with doubling timesas short as about 30 minutes. (Doubling time is the time needed for a cell to divideand the population to double.) However, in most natural aquatic systems, bacterialgeneration times are longer than a day, and sometimes are even weeks long inoligotrophic oceans, at least when calculated for the entire community. Thesegeneration times are set by the concentrations and supply of labile DOM and otherfactors, as discussed in Chapter 10.
Community Growth Rates
The growth rates and generation time discussed here are for the entire bacterialassemblage. One common method for estimating these rates in aquatic ecosystemsis to divide cell or biomass production by cell numbers of bacterial biomass,making sure that the units agree such that the end result has units of per time(e.g., per day). This approach and any other one that lumps all bacteria togetheryields a composite estimate, not necessarily an average rate. It is quite likelythat some microbes grow much faster than this composite estimate, whereasothers may grow more slowly or not at all (see Chapter 8).
Low bacterial growth rates are consistent with current estimates of bacterialbiomass (again, for the entire bacterial community). Biomass (Bb) is connected togrowth rates (m, roughly the inverse of generation time) via bacterial production (BP):
mb ¼ BP=Bb (1)
HETEROTROPHIC BACTERIA 11

A similar equation can be written for phytoplankton biomass (Bp), growth rates (mb)and primary production (PP). Since bacterial respiration (R) must be less than primaryproduction over sufficiently long time and space scales, an upper bound for bacterialproduction is then
BP , PPBGE
1� BGE
� �(2)
since respiration and BP are linked by the bacterial growth efficiency (BGE) (seeChapters 8 and 9). Combining Equation (1), the corresponding equation for phyto-plankton growth rates, and Equation (2) yields
mb
mp,
Bp
Bb
BGE1 � BGE
� �(3)
As illustrated in Figure 1.5, Equation (3) indicates that bacterial growth rates cannotexceed phytoplankton growth rates, except for low ratios of bacterial to phytoplank-ton biomass or high bacterial growth efficiencies, or some combination of both.However, even if the growth efficiency is high (50 percent), much higher than thebest estimate for the oceans (approximately 15 percent), and unless bacterialbiomass is substantially less than that of phytoplankton, bacterial growth rates haveto be slower than that for phytoplankton. Figure 1.6 gives some data from the
Figure 1.5 Theoretical relationship among growth rates and biomass levels for phytoplank-ton and heterotrophic bacteria. BGE is bacterial growth efficiency. The horizontal and verticaldashed lines indicate equal rates or biomass levels for phytoplankton and bacteria.
12 INTRODUCTION AND OVERVIEW

Yellow Sea indicating that this is the case. Although Cho et al. (2001) found a posi-tive correlation between bacterial and phytoplankton growth rates, bacteria grew moreslowly by about twofold on average than phytoplankton, with generation timesranging from about 4 to nearly 14 days (Fig. 1.6). Bacteria also grow more slowlythan phytoplankton in most of the open oceans examined to date (Ducklow 2000).
MARINE ARCHAEA
Archaea share some rather superficial similarities with bacteria, the other majordomain of prokaryotes. Bacteria and archaea cannot be distinguished by simplemicroscopy, and cells in both microbial groups do not have a nucleus and lack theorganelles found in eukaryotes. The old term for these microbes, archaebacteria,hints at this commonality. However, in many respects, archaea are as differentfrom bacteria as both prokaryotic groups are from eukaryotes. In fact, archaea maybe phylogenetically more closely related to eukaryotes than to bacteria. Of themany differences between bacteria and archaea, perhaps the most important one isthe composition of the cell wall and membrane. Archaea do not have the peptido-glycan found in bacterial cell walls, and the archaeal membrane has unique lipidsnot found in either bacteria or eukaryotes.
Oceanic archaea had been discovered in the early 1990s, but their abundance andbiogeochemical role in the oceanic water column were unknown until recently
Figure 1.6 Example of generation times for bacteria and phytoplankton. Data are communitygeneration times averaged over the euphotic in the Yellow Sea (Cho et al. 2001) and select openoceans (Ducklow 2000). The diagonal line is the 1 : 1 line.
MARINE ARCHAEA 13

(Ingalls et al. 2006; Karner et al. 2001), as discussed in Chapter 3. These studiesfound that archaea are everywhere, but may be particular abundant, relative to bac-teria, in the deep ocean. Even more surprising has been the evidence that theseoceanic archaea are chemolithoautotrophs that oxidize ammonium (chemolitho-trophy) to drive CO2 fixation (chemoautotrophy). Natural-abundance 14C data andincorporation of 13CO2 into archaeal lipids provided some of the first clues thatmarine archaea are autotrophs and derive their biomass C from CO2 rather thanfrom organic material (Pearson et al. 2001; Wuchter et al. 2003). Subsequent micro-autoradiographic studies demonstrated fixation of 14CO2 by archaea from the deepNorth Atlantic Ocean, albeit in decompressed samples (Herndl et al. 2005). Ingallset al. (2006) suggested that over 80 percent of archaeal carbon is from CO2 assimi-lated via chemoautotrophy in 670 m water of the North Pacific gyre.
We still know very little about marine archaea, about chemolithoautotrophy, andabout the many other microbes and processes in the deep ocean. Like most biologicaloceanographers, microbial ecologists have focused on the surface layer and theeuphotic zone where sunlight is available for primary producers. The water massesbelow the euphotic zone—the “dark ocean”—are greatly undersampled, especiallyconsidering their vastness. Over 75 percent of the ocean is below 1000 m, makingthe dark ocean the largest habitat in the biosphere.
HETEROTROPHIC PROTISTS
Marine protists, which are single-celled eukaryotes, are very diverse, in both form andfunction. Some are members of the phytoplankton community and contribute sub-stantially to primary production and phytoplankton biomass, especially in oligo-trophic oceanic regimes. Others are heterotrophic and eat other microbes byphagotrophy; they engulf other microbes into food vacuoles, where the prey isdigested. Grazing is discussed in Chapter 11. Still other eukaryotic microbes probablyare mixotrophic (Adolf et al. 2006), carrying out both light-driven photosynthesis(like a plant) and grazing (like an animal). Some protists used to be called protozoa,but this term, which refers to the lowest division of the animal kingdom, is misleadingbecause many of these microbes are mixotrophic, if not strict autotrophs.
As discussed in Chapter 6, we are beginning to understand the phylogeneticdiversity of eukaryotic picoplankton and other protists, but we know little abouttheir ecological roles in the oceans. However, we do know some things about therole of several protist groups that are distinguishable by size and other characteristicsobservable by simple microscopy (Sherr and Sherr 2000). Figure 1.7 gives just a fewexamples of the many shapes taken on by protists in the oceans, and Chapter 11provides several other examples.
Nanoflagellates (2–20mm)
Microscopy studies revealed that the oceans harbor a large number of smalleukaryotic cells without any chlorophyll, bearing one or more flagella. These
14 INTRODUCTION AND OVERVIEW

microbes have been called “colorless microflagellates,” “heterotrophic nanoplankton”(HNAN), or simply “flagellates.” As with all such groups, nanoflagellates aretaxonomically diverse, with probably equally diverse ecological and biogeochemicalroles. Given the cell size of nanoflagellates, they probably graze on heterotrophic bac-teria, cyanobacteria, and picoeukaryotes because these potential prey have roughlythe same size. As discussed in Chapter 11, similar-sized prey are likely eaten bythe same predator, although a predator may choose among prey based on “taste” orchemical properties of the prey surface (Strom 2000).
Figure 1.7 Some examples of heterotrophic protists. (a) Cafeteria roenbergensis Fencheland Patterson 1988; (b) Salpingoeca infusorium Kent 1880; (c) Strombidium capitatum,including small flagellated prey; and (d ) Stoeckeria algicida. Cafeteria and Salpingoecaare nanoflagellates (about 5 and 20 mm, respectively), whereas Strombidium is a ciliateand Stoeckeria is a dinoflagellate. (a) and (b) are from Sherr and Sherr (2000), (c) ismodified from (Montagnes 1996), and (d ) was provided by Hae Jin Jeong (see Jeonget al. 2005).
HETEROTROPHIC PROTISTS 15

Microzooplanktonic Protists (20–200mm)
Microbial ecologists first focused on one group of microzooplankton protists, tintin-nids, a type of ciliate with elaborate houses (loricae) surrounding them (Sherr andSherr 2000). However, improved methods for studying microzooplankton protistsled to the discovery of many “aloricate” or “naked” ciliates. These microbes canbe abundant in the microzooplankton community and are quite important asgrazers of phytoplankton (herbivory) and predators of flagellates that in turn feedon bacteria, cyanobacteria, and picoeukaryotes in the oceans. Ciliates are criticallinks in the microbial food chain and are likely important prey for carnivorous zoo-plankton. Some ciliates, such as Laboea spiralis, are mixotrophic and carry outphotosynthesis with the help of chloroplasts from phytoplankton ingested (but notcompletely digested) by the ciliate (McManus and Fuhrman 1986). Still others,such as Mesodinium rubrum, are strictly autotrophic and can form large blooms incoastal waters (Sherr and Sherr 2000). The term “ciliate” gives a general ideaabout the appearance and mode of locomotion for these protists, but their ecologicalroles in the oceans vary greatly.
Dinoflagellates
These fascinating microbes vary greatly in size and shape and in their roles in estu-aries, coastal waters, and the oceans. The size of dinoflagellates ranges from unar-mored dinoflagellates, such as Gymnodinium, which are 8–15 mm, to Noctilucawhich are 200–2000 mm. A “typical” dinoflagellate is armored by cellulose plates(theca) with two grooves to accommodate the two flagellates that are used for loco-motion. Many dinoflagellates, such as Gymnodinium, are pigmented photoautotrophsand are members of the phytoplankton community. However, about 50 percent ofdinoflagellates, including Noctiluca, are colorless and probably are heterotrophic.Along with ciliates, heterotrophic dinoflagellates are important members of themicrozooplankton community, and can account for a large fraction of grazing on phy-toplankton (Strom et al. 2007). Some heterotrophic dinoflagellates feed on microbialprey by phagocytosis, but others use feeding tubes to suck out the cytoplasm of theirprey, and still other dinoflagellates capture their prey with a feeding veil.Dinoflagellates include several pathogens of higher marine life and humans. Redtides are well known to be caused by dinoflagellates such as Gonyaulax polyhedraand Gymnodinium splendens, which secrete potent neurotoxins called saxotoxins.Less well understood are the dinoflagellates, such as Pfiesteria piscicida, that arepotential fish pathogens. Some are even parasites. Amoebophrya, for example, is agenus of dinoflagellates that parasitize other dinoflagellates (Coats and Park 2002).These topics and the original literature are discussed by Sherr and Sherr (2000).
Marine Fungi
Filamentous fungi and yeasts are found in the oceans, but these heterotrophiceukaryotes do not appear to be abundant and are not ecologically important in
16 INTRODUCTION AND OVERVIEW
aquatic ecosystems, except as decomposers of dry detritus from vascular plants incoastal regions (Newell 2003). Fungi and yeasts live on DOM or particulateorganic detritus, and thus would have to compete with heterotrophic bacteria andarchaea in the oceans. The low abundance of fungi and yeasts indicate that they donot fare well in this competition, probably because they are larger than prokaryotesand thus have much higher surface area-to-volume ratios, putting them at a disadvan-tage in transporting dissolved compounds. Filamentous fungi do well in the standingdead (above the water line) plants in salt marshes, because their hyphae are able topenetrate and propagate up the dry, dead plant, something that prokaryotes cannotdo. A similar reason explains why fungi are so important in the carbon cycle ofterrestrial systems.
MARINE VIRUSES
In addition to grazing by protists, lysis by viruses is the other main type of mortalityinflicted upon marine microbes. As pointed out earlier and emphasized in Chapter 12,viruses are the most abundant biological entity in the biosphere, and even though theyare small, much smaller than bacteria, their biomass in the oceans is substantial.There are probably viruses for every micro- and macroorganism on the planet.Since viral abundance follows host abundance, viruses for heterotrophic bacteria(bacteriophages or just phages) are probably the most common type in the oceans.However, viruses also attack eukaryotic phytoplankton, and there is some evidenceof viruses stopping phytoplankton blooms from growing even further (Suttle2005). Viruses may be especially critical in controlling blooms of harmful algae incoastal waters (Lawrence and Suttle 2004).
Chapter 12 mentions that viral lysis and grazing are about equal in causingbacterial mortality, but in fact the percentages probably vary greatly. We expectviral lysis to be the dominant form of bacterial mortality in anaerobic environmentssuch as sediments (Fischer et al. 2006) where few protists can grow. In contrast, virallysis may be lower in oligotrophic environments where bacterial abundance is low(Strom 2000). In support of the latter hypothesis, Strom (2000) pointed out that esti-mates of grazing rates matched bacterial production in oligotrophic systems, but notso in eutrophic environments, where bacterial growth exceeded grazing, necessitatinganother form of bacterial mortality, such as viral lysis. Very few studies have exam-ined both grazing and viral lysis, in part because the methods for both are difficult andtime-consuming.
Viruses and protists have similar but also different impacts on bacteria and othermicrobial prey. Chapter 12 points out that the release of DOM from cells lysed byviruses probably leads to higher growth rates for the surviving bacteria. Like virallysis, grazing also can release potentially limiting organic carbon and inorganic nutri-ents, but any released DOM is probably more altered, due to enzymatic attack in foodvacuoles, than the DOM released by viruses. However, unlike viruses, grazers mayhave a direct negative effect on bacterial growth rates. Since grazing rates varywith prey size and since bacterial cells must get bigger before dividing, grazers
MARINE VIRUSES 17

should tend to graze more heavily on rapidly growing cells (see Chapter 11). Thismechanism could explain why growth rates are often higher in treatmentsthat minimize grazing (e.g., dilution and filtration), although artificial breakage ofcells and other DOM contamination during sample preparation would have thesame effect.
Laboratory experiments provide more insights into how grazers and protists affecttheir microbial prey. In the absence of larger organisms and other predators, a protistgrazer will reduce prey numbers to vanishingly low levels, although some bacteriacan form filaments and flocs that are resistant to grazing (Chapter 11). In contrast,viruses can apparently keep bacterial abundance constant over time (Wilcox andFuhrman 1994), but they cannot reduce their host numbers to low levels, unlike agrazer feeding on bacteria. The difference is because microbes develop resistanceagainst viruses. A field study of Synechococcus provides a good example of thiscoexistence (Waterbury and Valois 1993). In the end, mortality via viral lysis orgrazing matches bacterial growth most of the time, since bacterial abundancevaries relatively little over time and space in the oceans.
N2 FIXERS
Just as the carbon cycle starts with the fixation of CO2 to organic C, so too can thenitrogen cycle be said to start with the fixation of N2 to ammonium (Fig. 1.8).There the similarity between carbon and nitrogen fixation ends. Unlike carbon fix-ation, N2, fixation is carried out only by prokaryotes and in the oceans mainly bysome cyanobacteria. Fixation by heterotrophic bacteria is thought to be rare in theoceans because the supply of labile DOM is too low to support the high expenseof N2 reduction to ammonium. Once N2 is fixed, there are several similaritiesbetween the exchange of C and N among trophic levels and between fixed inorganic
Figure 1.8 The nitrogen cycle in the oceans. DON is dissolved organic nitrogen.Nitrification, which is oxidization of ammonium to nitrite (NO2
2) and eventually to nitrate(NO3
2), requires oxygen, whereas dissimilatory nitrate reduction (reduction of NO32 to N2)
occurs only when oxygen is very low. Likewise, the anammox reaction also occurs onlywhen oxygen is absent.
18 INTRODUCTION AND OVERVIEW

and organic compounds. Similar to C, N is transferred to the rest of the marine biotaby a variety of mechanisms, ranging from the direct release of ammonium and DONto grazing on diazotrophs by protist grazers and zooplankton. Chapter 13 discussesthe genetics, microbiology, and biogeochemistry of N2 fixation in the oceans.
Definition of Diazotrophs
N2 fixers are also called diazotrophs. The prefix “diazo-” is derived from “di”(two) and “azote,” from the Greek word (“no life”) used by Antoine Lavoisier(1743–1794) for the gas we now call nitrogen. “Troph” is from the Greek wordtrophe for food.
Chapter 13 also discusses possible limits of N2 fixation and why diazotrophs arenot more abundant than they are. Two elements other than N are thought to poten-tially control N2 fixation and microbial production in some oceans. Chemical ocean-ographers have always argued that phosphorus is the ultimate limiting element in theoceans, and now biological oceanographers have recognized the importance of Plimitation in regimes such as the Mediterranean Sea (Thingstad et al. 2005) andthe North Pacific Gyre, arguably the largest biome on the planet (Karl 1999). Thesecond element, iron, has also been examined extensively by both oceanographersand microbial ecologists. The role of Fe in limiting primary production in highnutrient–low chlorophyll (HNLC) oceans is now well established (de Baar et al.2005). The impact of low Fe and P concentrations in the oceans on N2 fixation isbeing intensively examined (Chapter 13). Chapter 10 also discusses the role ofthese two elements in regulating the growth of the total bacterial community.
NITRIFIERS AND OTHER CHEMOLITHOTROPHS
We have assumed that oceanic bacteria gain energy either from light, which fuels themetabolism of cyanobacteria and drives the synthesis of organic material from CO2,or from the oxidation of organic material back to CO2, which defines what hetero-trophic bacteria do. But already we have seen that some of these bacteria mayreally be photoheterotrophic and fuel ATP synthesis with light energy as well asby organic carbon oxidation. Another possible mechanism for ATP synthesis is bychemolithotrophy, which is the oxidation of reduced inorganic compounds coupledwith the reduction of an electron acceptor, which is often oxygen. We have encoun-tered one form of chemolithotrophy, the oxidation of ammonium. Other inorganiccompounds used by chemolithotrophic bacteria include various reduced sulfur com-pounds, carbon monoxide, and methane. Ammonium oxidizers were discovereddecades ago, but microbial ecologists thought bacteria carrying out this reactionwere not abundant in the surface ocean because of slow growth rates (Ward 2000).Other forms of chemolithotrophy had been found previously only close to sourcesof reduced inorganic compounds, such as anoxic sediments. These bacteria were
NITRIFIERS AND OTHER CHEMOLITHOTROPHS 19

not thought to be common in the surface ocean, because concentrations of reducedinorganic compounds are very low in the oceans.
Genomic and experimental data are changing this picture. In addition to the work onammonium oxidation by archaea in the deep ocean, new data now suggest that marinebacteria may be mixotrophic, harvesting energy from whatever reduced compound,organic or inorganic, they can obtain (Moran et al. 2004). While concentrations ofreduced inorganic compounds are very low in the oceans, so too are concentrationsof labile DOM components. Chemolithotrophy is one of several fascinating findingsfrom genomic studies of marine microbes, as discussed in Chapter 4.
DENITRIFIERS
The microbes and processes discussed in this book are found mainly in the uppersurface layer of the oceans, but the organisms discussed in Chapter 14 are excep-tions. Chapter 14 focuses on N-cycle reactions and associated microbes that arefound mainly in sediments and anoxic water columns, oxygen-deficient zones inthe eastern tropical Pacific and the Arabian Sea, and in basins such as the BlackSea and the Cariaco Basin. Oxygen supply and concentrations are key to under-standing these microbes. While factors such as DOM quantity and quality,grazing, and viral lysis all affect the activity and composition of microbial commu-nities, oxygen has probably an even more dramatic impact. The lack of oxygenexcludes nearly all eukaryotes from anoxic systems, the exceptions being someprotists, and there are large shifts at the division (phylum) level in bacteria aswell. The shift is due in part to the rise in organisms that use inorganic sulfur com-pounds in ATP synthesis, the most important being the sulfate-reducing bacteria.Many of these bacteria are Deltaproteobacteria (Llobet-Brossa et al. 2002;Ravenschlag et al. 2000), which are common in anoxic systems but not in oxicwaters. Although sulfate as an electron acceptor (analogous to oxygen) is not energe-tically favorable (Table 1.4), the high concentrations of sulfate ensure the dominance ofsulfate reduction in the mineralization of organic carbon in anoxic marine systems.After oxygen is depleted, sulfate reduction often accounts for a large fraction(20 percent . 50 percent) of organic carbon oxidation in salt marshes, estuaries, andshallow coastal sediments (Table 1.4). In contrast to sulfate, nitrate respiration doesnot oxidize much organic carbon in most ecosystems, because nitrate concentrationsare too low, even though it is an energetically-favorable electron acceptor (Table 1.4).
These forms of anaerobic respiration with nitrate and sulfate have been well knownfor several years. More recent was the discovery of ANaerobic AMMoniumOXidation (anammox), as discussed in Chapter 14. In contrast to nitrification, inwhich ammonium is oxidized aerobically, in anammox, ammonium is oxidizedusing nitrite instead of oxygen as the electron acceptor. Because it produces N2
gas, this process could be called a form of denitrification. Chapter 14, however,reserves that term for heterotrophic dissimilatory nitrate reduction when the endpro-ducts are N2 or N2O. Table 1.5 summarizes the differences between these two mech-anisms by which the oceans lose N.
20 INTRODUCTION AND OVERVIEW

CONCLUDING REMARKS
The subheadings in this chapter refer to the various functional groups of microbes(and viruses and DOM) listed in Table 1.1, but these subheadings could have aseasily been the associated biogeochemical processes. This combination of both
TABLE 1.4 Summary of Electron Acceptors Used by Bacteria and Archaeain Marine Environmentsa
ElectronAcceptor
Energetic Yield(kJ/mol)b
% of Total OrganicCarbon Oxidationc Comments
Oxygen 23190 33 100% in most watercolumns
Nitrate 23030 ,10 Higher in polluted watersMn(IV) 23090 ,10 90–100% in Skagerrak and
Panama BasinFe(III) 21410 23 Needs replenishment of Fe
oxidesSulfate 2380 31 Less important in deep
watersCO2 2350 ,10 More important in
freshwaters
aThe electron acceptor accounting for all or nearly all organic carbon oxidation is oxygen in the open oceanand in most coastal waters. The percentages given above are for marine systems where oxygen supply canbe insufficient.bThese changes in Gibbs free energy (DG80) represent the oxidation of 1 mol glucose, and were taken fromNealson and Saffarini (1994). The authors did the calculations assuming that glucose was the electrondonor, although glucose is not oxidized by organisms using metal oxides, sulfate, and CO2 as electronacceptors.cValues are averages taken from a wide range of systems summarized by Canfield et al. (2005).
TABLE 1.5 Comparison of the Two Processes Producing N Gases (N2 and N2O)a
Dissimilatory NO32 Reduction Anammoxb
Starting N compound NO32 NH4
þ and NO22
Electron donor Organic carbon NH4þ
Electron acceptor NO32 NO2
2
N endproduct N2 or N2Oc N2
Energetic yield (kJ/mol) 2631d 2357Carbon source Organic carbon CO2
Growth rates Fast SlowPhylogenetic distribution Many species PlanctomycetesUnique biomarkers None Ladderane (a lipid)
aInformation mainly from Canfield et al. (2005). See also Chapter 14.bAnaerobic oxidation of ammonium.cDissimilatory NO3
2 reduction can also produce NH4þ and NO2
2 but when these nongaseous N endproductsare produced, it is not denitrification.dEnergy yield per mole of nitrate, assuming glucose is the electron donor and N2 is the N endproduct.
CONCLUDING REMARKS 21

organisms and processes is what separates marine microbial ecology from marinemicrobiology and biogeochemistry. The first chapter in the first edition of thisbook (Kirchman and Williams 2000) argued that the most important advances inmicrobial ecology were made initially by scientists who focused on biogeochemicalprocesses without being bothered by their inability to identify the microbes. Althoughmuch remains to be done, this identification problem and the “great plate countanomaly” have been solved by the application of 16S rRNA-based technology andnovel cultivation approaches. Application of this technology made up the nextgreat wave of microbial ecology. We are now in the middle of still another wave,really a tsunami of genomic sequence data from isolated microbes and metagenomicstudies of oceanic environments. The challenge facing microbial ecologists is to usethese data to understand not only the organisms but the biogeochemical processes aswell. It is the integration of these disciplines and approaches that makes microbialecology so exciting today and so important for understanding current problems inthe oceans and for predicting what the future holds for the entire biosphere.
SUMMARY
1. Marine microbial ecology is an important field of science because of the abun-dance and diversity of marine microbes, but also because these microbes areessential in mediating various biochemical cycles and other processes thatcontrol greenhouse gases.
2. Marine microbes include all organisms that smaller than about 100 mm, includ-ing cyanobacteria, heterotrophic bacteria, archaea, eukaryotic phytoplankton,and a diverse array of autotrophic, heterotrophic and mixotrophic protists.Microbial ecologists study all of these, as well as viruses, the most numerousbiological entities in the oceans.
3. Microbial ecologists have discovered new organisms (e.g., coccoid cyano-bacteria and archaea) carrying out well-known reactions (N2 fixation andnitrification), as well as entirely novel microbes and processes (the anammoxreaction) contributing to important biogeochemical fluxes (N loss).
4. Microbial ecology is being changed by genomics and the huge increase insequence data from isolated microbes and metagenomic studies of oceanichabitats. Microbial ecologists now face the challenge of using these data tounderstand microbes and biogeochemical processes important in the ocean.
ACKNOWLEDGMENTS
I would like to thank the following colleagues who commented on this chapter andoffered information and feedback: Ev and Barry Sherr, Suzanne Strom, BoThramdrup, and Alex Worden. I also thank David Montagues and Hae Jin Jeongfor their drawings of some protists. The writing of this chapter was supported by agrant from the National Science Foundation (MCB-0453993).
22 INTRODUCTION AND OVERVIEW

REFERENCES
Adolf, J. E., D. K. Stoecker, and L. W. Harding, Jr. 2006. The balance of autotrophy andheterotrophy during mixotrophic growth of Karlodinium micrum (Dinophyceae).J. Plankton Res. 28: 737–751.
Behringer, D. C., and M. J. Butler. 2006. Stable isotope analysis of productionand trophic relationships in a tropical marine hard-bottom community. Oecologia148: 334–341.
Canfield, D. E., B. Thamdrup, and E. Kristensen. 2005. Aquatic Geomicrobiology. ElsevierAcademic Press.
Cauwet, G. 2002. DOM in the coastal zone. In D. A. Hansell and C. A. Carlson (eds.),Biogeochemistry of Marine Dissolved Organic Matter. Academic Press, pp. 579–609.
Chisholm, S. W., R. J. Olson, E. R. Zettler, R. Goericke, J. B. Waterbury, andN. A. Welschmeyer. 1988. A novel free-living prochlorophyte abundant in the oceaniceuphotic zone. Nature 334: 340–343.
Cho, B. C., M. G. Park, J. H. Shim, and D. H. Choi. 2001. Sea-surface temperature and f-ratioexplain large variability in the ratio of bacterial production to primary production in theYellow Sea. Mar. Ecol. Prog. Ser. 216: 31–41.
Church, M. J., H. W. Ducklow, and D. M. Karl. 2004. Light dependence of [3H]leucine incor-poration in the oligotrophic North Pacific Ocean. Appl. Environ. Microbiol. 70:4079–4087.
Coats, D. W., and M. G. Park. 2002. Parasitism of photosynthetic dinoflagellates by threestrains of Amoebophrya (Dinophyta): Parasite survival, infectivity, generation time, andhost specificity. J. Phycol. 38: 520–528.
Cottrell, M. T., A. Mannino, and D. L. Kirchman. 2006. Aerobic anoxygenic phototrophicbacteria in the Mid-Atlantic Bight and the North Pacific Gyre. Appl. Environ. Microbiol.72: 557–564.
de Baar, H. J. W., P. W. Boyd, K. H. Coale, et al. 2005. Synthesis of iron fertilizationexperiments: From the Iron Age in the Age of Enlightenment. J. Geophys. Res. (Oceans)110: C09S16.
Ducklow, H. 2000. Bacterial production and biomass in the oceans. In D. L. Kirchman (ed.),Microbial Ecology of the Oceans, 1st edn. Wiley-Liss, pp. 85–120.
Dufresne, A., M. Salanoubat, F. Partensky, et al. 2003. Genome sequence of the cyanobacter-ium Prochlorococcus marinus SS120, a nearly minimal oxyphototrophic genome. Proc.Natl. Acad. Sci. USA 100: 10020–10025.
Dugdale, R. C., and J. J. Goering. 1967. Uptake of new and regenerated forms of nitrogen inprimary productivity. Limnol. Oceanogr. 12: 196–206.
Findlay, S. E. G., and R. L. Sinsabaugh (eds.). 2003. Aquatic Ecosystems: Interactivity ofDissolved Organic Matter. Academic Press.
Fischer, U. R., C. Wieltschnig, A. K. T. Kirschner, and B. Velimirov. 2006. Contribution ofvirus-induced lysis and protozoan grazing to benthic bacterial mortality estimated simul-taneously in microcosms. Environ. Microbiol. 8: 1394–1407.
Fukuda, R., H. Ogawa, T. Nagata, and I. Koike. 1998. Direct determination of carbon and nitro-gen contents of natural bacterial assemblages in marine environments. Appl. Environ.Microbiol. 64: 3352–3358.
Gasol, J. M., P. A. del Giorgio, and C. M. Duarte. 1997. Biomass distribution in marineplanktonic communities. Limnol. Oceanogr. 42: 1353–1363.
REFERENCES 23

Gattuso, J. P., B. Gentili, C. M. Duarte, J. A. Kleypas, J. J. Middelburg, and D. Antoine. 2006.Light availability in the coastal ocean: Impact on the distribution of benthic photosyntheticorganisms and their contribution to primary production. Biogeosciences 3: 489–513.
Giovannoni, S. J., L. Bibbs, J. C. Cho, et al. 2005. Proteorhodopsin in the ubiquitous marinebacterium SAR11. Nature 438: 82–85.
Gomez-Consarnau, L., J. M. Gonzalez, M. Coll-Llado, P. Gourdon, T. Pascher, R. Neutze,C. Pedros-Alio, and J. Pinhassi. 2007. Light stimulates growth of proteorhodopsin-contain-ing marine Flavobacteria. Nature 445: 210–213.
Hansell, D. A., and C. A. Carlson (eds.). 2002. Biogeochemistry of Marine Dissolved OrganicMatter. Academic Press.
Hedges, J. I., and J. M. Oades. 1997. Comparative organic geochemistries of soils and marinesediments. Org. Geochem. 27: 319–361.
Herndl, G. J., T. Reinthaler, E. Teira, H. Van Aken, C. Veth, A. Pernthaler, and J. Pernthaler.2005. Contribution of archaea to total prokaryotic production in the deep Atlantic Ocean.Appl. Environ. Microbiol. 71: 2303–2309.
Hoiczyk, E., and A. Hansel. 2000. Cyanobacterial cell walls: News from an unusual prokaryo-tic envelope. J. Bacteriol. 182: 1191–1199.
Ingalls, A. E., S. R. Shah, R. L. Hansman, L. I. Aluwihare, G. M. Santos, E. R. M. Druffel, andA. Pearson. 2006. Quantifying archaeal community autotrophy in the mesopelagic oceanusing natural radiocarbon. Proc. Natl. Acad. Sci. USA 103: 6442–6447.
Jeong, H. J., J. S. Kim, J. Y. Park, et al. 2005. Stoeckeria algicida n. gen., n. sp (Dinophyceae)from the coastal waters off Southern Korea: Morphology and small subunit ribosomal DNAgene sequence. J. Eukaryot. Microbiol. 52: 382–390.
Karl, D. M. 1999. A sea of change: Biogeochemical variability in the North Pacific subtropicalgyre. Ecosystems 2: 181–214.
Karner, M. B., E. F. DeLong, and D. M. Karl. 2001. Archaeal dominance in the mesopelagiczone of the Pacific Ocean. Nature 409: 507–510.
Kirchman, D. L. 2000. Uptake and regeneration of inorganic nutrients by marine heterotrophicbacteria. In D. L. Kirchman (ed.), Microbial Ecology of the Oceans, 1st edn. Wiley-Liss,pp. 261–288.
Kirchman, D. L., and P. J. L. B. Williams. 2000. Introduction. In D. L. Kirchman (ed.),Microbial Ecology of the Oceans, 1st edn. Wiley-Liss, pp. 1–11.
Lawrence, J. E., and C. A. Suttle. 2004. Effect of viral infection on sinking rates ofHeterosigma akashiwo and its implications for bloom termination. Aquat. Microb. Ecol.37: 1–7.
Llobet-Brossa, E., R. Rabus, M. E. Bottcher, et al. 2002. Community structure and activity ofsulfate-reducing bacteria in an intertidal surface sediment: a multi-method approach. Aquat.Microb. Ecol. 29: 211–226.
McManus, G. B., and J. A. Fuhrman. 1986. Photosynthetic pigments in the ciliate Laboeastrobila from Long Island Sound, USA. J. Plankt. Res. 8: 317–327.
Michelou, V. K., M. T. Cottrell, and D. L. Kirchman. 2007. Light-stimulated bacterialproduction and amino acid assimilation by cyanobacteria and other microbes in theNorth Atlantic Ocean. Appl. Environ. Microbiol. 73: 5539–5546.
Montagnes, D. J. S. 1996. Growth responses of planktonic ciliates in the genera Strobilidiumand Strombidium. Mar. Ecol. Prog. Ser. 130: 241–254.
24 INTRODUCTION AND OVERVIEW

Moran, M. A., and R. G. Zepp. 2000. UV radiation effects on microbes and microbialprocesses. In D. L. Kirchman (ed.), Microbial Ecology of the Oceans, 1st edn. Wiley-Liss, pp. 201–228.
Moran, M. A., A. Buchan, J. M. Gonzalez, et al. 2004. Genome sequence of Silicibacterpomeroyi reveals adaptations to the marine environment. Nature 432: 910–913.
Mulholland, M. R., C. J. Gobler, and C. Lee. 2002. Peptide hydrolysis, amino acidoxidation, and nitrogen uptake in communities seasonally dominated by Aureococcusanophagefferens. Limnol. Oceanogr. 47: 1094–1108.
Nagata, T. 2000. Production mechanisms of dissolved organic matter. In D. L. Kirchman (ed.),Microbial Ecology of the Oceans, 1st edn. Wiley-Liss, pp. 121–152.
Nealson, K. H., and D. Saffarini. 1994. Iron and manganese in anaerobic respiration: Environ-mental significance, physiology, and regulation. Annu. Rev. Microbiol. 48: 311–343.
Newell, S. Y. 2003. Fungal content and activities in standing-decaying leaf blades of plants ofthe Georgia Coastal Ecosystems research area. Aquat. Microb. Ecol. 32: 95–103.
Pakulski, J. D., A. Baldwin, A. L. Dean, et al. 2007. Responses of heterotrophic bacteria tosolar irradiance in the eastern Pacific Ocean. Aquat. Microb. Ecol. 47: 153–162.
Pearson, A., A. P. Mcnichol, B. C. Benitez-Nelson, J. M. Hayes, and T. I. Eglinton.2001. Origins of lipid biomarkers in Santa Monica Basin surface sediment: A casestudy using compound-specific delta C-14 analysis. Geochem. Cosmochim. Acta 65:3123–3137.
Ravenschlag, K., K. Sahm, C. Knoblauch, B. B. Jørgensen, and R. Amann. 2000. Communitystructure, cellular rRNA content, and activity of sulfate-reducing bacteria in marine Arcticsediments. Appl. Environ. Microbiol. 66: 3592–3602.
Rocap, G., F. W. Larimer, J. Lamerdin, et al. 2003. Genome divergence in twoProchlorococcus ecotypes reflects oceanic niche differentiation. Nature 424: 1042–1047.
Schwalbach, M. S., and J. A. Fuhrman. 2005. Wide-ranging abundances of aerobic anoxygenicphototrophic bacteria in the world ocean revealed by epifluorescence microscopy andquantitative PCR. Limnol. Oceanogr. 50: 620–628.
Segal, R. D., A. M. Waite, and D. P. Hamilton. 2006. Transition from planktonic to benthicalgal dominance along a salinity gradient. Hydrobiologia 556: 119–135.
Sherr, E. B., and B. F. Sherr. 2000. Marine microbes: An overview. In D. L. Kirchman (ed.),Microbial Ecology of the Oceans, 1st edn. Wiley-Liss, pp. 13–46.
Sieracki, M. E., I. C. Gilg, E. C. Thier, N. J. Poulton, and R. Goericke. 2006. Distribution ofplanktonic aerobic anoxygenic photoheterotrophic bacteria in the northwest Atlantic.Limnol. Oceanogr. 51: 38–46.
Strom, S. L. 2000. Bacterivory: Interactions between bacteria and their grazers. InD. L. Kirchman (ed.), Microbial Ecology of the Oceans, 1st edn. Wiley-Liss, pp. 351–386.
Strom, S. L., E. L. Macri, and M. B. Olson. 2007. Microzooplankton grazing in the coastal Gulfof Alaska: Variations in top-down control of phytoplankton. Limnol. Oceanogr. 52.
Suttle, C. A. 2005. Viruses in the sea. Nature 437: 356–361.
Thingstad, T. F., M. D. Krom, R. F. C. Mantoura, et al. 2005. Nature of phosphorus limitationin the ultraoligotrophic eastern Mediterranean. Science 309: 1068–1071.
Waidner, L. A., and D. L. Kirchman. 2007. Aerobic anoxygenic phototrophic bacteria attachedto particles in turbid waters of the Delaware and Chesapeake estuaries. Appl. Environ.Microbiol. 73: 3936–3944.
REFERENCES 25

Ward, B. B. 2000. Nitrification and the marine nitrogen cycle. In D. L. Kirchman (ed.),Microbial Ecology of the Oceans, 1st edn. Wiley-Liss, pp. 427–453.
Waterbury, J. B., and F. W. Valois. 1993. Resistance to co-occurring phages enables marineSynechococcus communities to coexist with cyanophages abundant in seawater. Appl.Environ. Microbiol. 59: 3393–3399.
Waterbury, J. B., S. W. Watson, R. R. L. Guillard, and L. E. Brand. 1979. Widespread occur-rence of a unicellular, marine, planktonic, cyanobacterium. Nature 277: 293–294.
Wilcox, R. M., and J. A. Fuhrman. 1994. Bacterial viruses in coastal seawater: Lytic rather thanlysogenic production. Mar. Ecol. Prog. Ser. 114: 35–45.
Wuchter, C., S. Schouten, H. T. S. Boschker, and J. S. S. Damste. 2003. Bicarbonate uptake bymarine Crenarchaeota. FEMS Microb. Let. 219: 203–207.
Yool, A., A. P. Martin, C. Fernandez, and D. R. Clark. 2007. The significance of nitrificationfor oceanic new production. Nature 447: 999–1002.
Zubkov, M. V., and G. A. Tarran. 2005. Amino acid uptake of Prochlorococcus spp. in surfacewaters across the South Atlantic subtropical front. Aquat. Microb. Ecol. 40: 241–249.
Zubkov, M. V., B. M. Fuchs, G. A. Tarran, P. H. Burkill, and R. Amann. 2003. High rate ofuptake of organic nitrogen compounds by Prochlorococcus cyanobacteria as a key to theirdominance in oligotrophic oceanic waters. Appl. Environ. Microbiol. 69: 1299–1304.
26 INTRODUCTION AND OVERVIEW