Introduction · 2020-04-29 · INTRODUCTION ost Introduction Letter of Transmittal Letter from the...
80
“I am not a teacher, but an awakener.” Robert Frost INTRODUCTION Introduction Letter of Transmittal Letter from the Chairperson Board of Trustees Administrative Organization Professional Services Mason Crest Principal, Brian Butler, has a goal to make Mason Crest the model of excellence in education, where every student experiences the success that they deserve. Butler brings 24 years of experience as an educator and a wealth of knowledge regarding collaborative practices that advance student achievement. He leads by example and encourages his staff and parent community to share their visions for developing a strong school whose fundamental purpose is to ensure high levels of learning for all.Catiore nempore autate qui tem et faccum aut omni quis mod ute nonsequiam aut ad qui velias a nus, sequis
Transcript of Introduction · 2020-04-29 · INTRODUCTION ost Introduction Letter of Transmittal Letter from the...

INTR
OD
UCT
ION
INTR
OD
UCT
ION
“I am not a teacher, but an awakener.” Robert Frost
INTR
OD
UCT
ION
IntroductionLetter of Transmittal
Letter from the Chairperson
Board of Trustees
Administrative Organization
Professional Services
Mason Crest Principal, Brian Butler, has a goal to make Mason Crest the model of excellence in education, where every student
experiences the success that they deserve. Butler brings 24 years of experience as an educator and a wealth of knowledge
regarding collaborative practices that advance student achievement. He leads by example and encourages his staff and
parent community to share their visions for developing a strong school whose fundamental purpose is to ensure high levels of
learning for all.Catiore nempore autate qui tem et faccum aut omni quis mod ute nonsequiam aut ad qui velias a nus, sequis

Educ ational EmployEEs’ supplEmEntary rEtirEmEnt systEm of fairfa x count y
Letter of Transmittal
INTRODUCTION 2
November 25, 2013
The Board of Trustees Educational Employees’ Supplementary Retirement System of Fairfax County (ERFC) Springfield, VA
Dear Chairperson and Members of the Board of Trustees:
It is our privilege to submit the Comprehensive Annual Financial Report (CAFR) for the Educational Employees’ Supplementary Retirement System of Fairfax County (“ERFC” or “System”) for the fiscal year ended June 30, 2013. The ERFC management holds responsibility for the financial information presented in this report. Proper internal accounting controls exist to provide reasonable, but not absolute, assurance for both the safekeeping of assets and the fair presentation of the financial statements. The concept of reasonable assurance recognizes that costs of controls should not exceed the anticipated benefits these controls provide. This CAFR reflects the careful stewardship of the System’s assets, and dedicated service provided by the Board and staff. For financial reporting purposes, the ERFC is considered a component unit of the Fairfax County Public Schools, Fairfax County, Virginia. As such, this report is designed to comply with the reporting requirements of Sections 3-4-6(a)(8) of the Fairfax County Code and the Virginia Code. We believe this report also conforms to the Government Finance Officers Association’s (GFOA) requirements.
The following provides a summary of the System’s historical background, and outlines significant achievements for the Board and management during the fiscal year. A management discussion and analysis (MD&A) narrative is also provided in the Finance Section, immediately following the independent auditors’ report.
Plan History
The ERFC was established on July 1, 1973 through negotiations conducted between the Fairfax County School Board and the Fairfax Education Association (FEA). The terms under which ERFC operates were later incorporated in a Fairfax County ordinance and the ERFC Plan Document. Historically, ERFC benefits have been designed specifically to supplement the benefits of two primary retirement plans: the Virginia Retirement System (VRS) and the federal Social Security System. In 1987, the VRS introduced major increases to the state’s early retirement benefits, which required the ERFC to thoroughly re-examine the complementary structure of its supplemental benefits plan. Effective July 1, 1988, the ERFC significantly altered its Legacy Plan benefit structure in order to re-balance the benefit amounts payable to future ERFC members, while also maintaining and protecting the rights of current members. Thirteen years later, the School Board approved further refinements to the ERFC supplemental
8001 Forbes Place, Suite 300 Springfield, VA 22151

Educ ational EmployEEs’ supplEmEntary rEtirEmEnt systEm of fairfa x count y
Letter of Transmittal
3 INTRODUCTION
INTR
OD
UCT
ION
INTR
OD
UCT
ION
retirement program with the introduction of a second retirement plan, ERFC 2001 – a streamlined and stand-alone retirement plan structure, provided for all eligible FCPS employees hired on or after July 1, 2001. With prudent management oversight and sustained support from the School Board, the ERFC Legacy and ERFC 2001 plans continue to provide a valuable and secure defined benefit retirement program for over twenty-thousand full-time educational, administrative and support employees of Fairfax County Public Schools (FCPS).
Administration and Technology Updates
The ERFC staff continued its promotion of the ERFCDirect online service during the year. Over six thousand active members and three thousand retirees now use this service to estimate future benefits, plan for retirement and monitor monthly benefit payments. The staff explored additional technology innovations that resulted in improved efficiencies or cost savings. Three of these initiatives are slated for completion in the current fiscal year: posting of member benefit statements on-line, improved general ledger reporting and redesign of the manual benefit estimation verification and audit process to an automated process.
Earlier this year, the ERFC staff welcomed Jasper Baldwin to its administrative leadership team, as the System’s new Retirement Specialist. Prior to her appointment, Baldwin spent seven years as a senior benefits specialist with a government contracting firm and one year as an educator with the Monroe County, Florida School District. ERFC’s prior Retirement Specialist, Allison Kelly, was promoted to Investment Accounting Analyst. Stephanie Thomas joined ERFC as its Information Systems Management Analyst. Prior to her promotion, Thomas served as an FCPS School Based Technology Specialist since 1999 and was Director of the Automated Information Systems Division at the US Department of Agriculture for ten years.
Strategic Plan
The Board of Trustees adopted its 2013 Strategic Plan in July, completing its initiatives outlined in the 2011 Strategic Plan. The 2013 Strategic Plan emphasizes enhancement of ERFC’s communication and education program through expanded presence in schools, development of targeted communications to members at different phases in their careers, improved website content and a liaison role with the Virginia Retirement System on communication of its hybrid plan. The Board included creation of a Board Education policy under its governance initiatives and review of its Funding policy in light of the new GASB standards. Under ERFC Services and Internal Management initiatives, staff was directed to finalize the transition of the retiree newsletter and member statements to paperless, implement the new GASB 67 and 68 standards and conduct an operational audit.
Plan Financial Condition
The ERFC achieved an 11.2 percent return for fiscal year 2013, a rebound from the low .4 percent return earned during fiscal year 2012. For the year, ERFC exceeded its policy index by two percent due to the strong equity returns. ERFC has achieved a

double-digit return in three out of the last four fiscal years.
ERFC’s independent actuary reported that the System’s funding ratio declined slightly from 75.6 percent to 75.4 percent for the valuation period ending December 31, 2012 due to continued phase-in of the 2011 market experience. As a result, the employer contribution rate increased from 5.34 percent to 5.60 percent of payroll for fiscal year 2014.
The Financial, Actuarial, and Statistical sections of this report provide detailed information regarding the Fund’s overall financial condition. In addition, the Schedule of Funding Progress, included in the Financial Section, presents historical data for the ERFC’s funding ratio.
Investment Activity
The ERFC’s 11.2 percent return for FY 2013 significantly outperformed its benchmark index but slightly underperformed its peer systems for the fiscal year with the median fund returning 11.7 percent. This peer system underperformance is not unexpected as the Fund’s 23.8 percent U.S. equity allocation was lower than the median fund’s 36.3 percent allocation and domestic equity was the best performing sector during the fiscal year. As explained in previous reports, the Board reduced the domestic equity risk in the portfolio in recent years. The Fund’s longer-term return, however, remained strong, with the ten year return ranked in the fifteenth percentile.
The Board continued implementation of its private equity program during the fiscal year. It committed $10 million to the Private Advisors Buyout Fund V. The Board anticipates that ERFC will meet its long-term investment objectives by taking these prudent measures to add further diversification in the portfolio with less reliance on the domestic equity markets. The Investment Section of this report provides further details regarding the Fund’s activities and performance.
Professional Services
The ERFC Board of Trustees appoints professional services to provide aid in the efficient management of the System. New England Pension Consultants (NEPC), based in Boston, Massachusetts, provides investment consulting services, and Gabriel, Roeder, Smith & Company, of Southfield, Michigan, provides actuarial services. In accordance with county code, the Fairfax County Board of Supervisors appointed KPMG LLP, Certified Public Accountants, Washington, D.C., to audit the System’s financial statements.
Awards
The System proudly announces that the Government Finance Officers Association of the United States and Canada (GFOA) recently awarded ERFC the Certificate of Achievement for Excellence in Financial Reporting for its FY 2012 Comprehensive Annual Financial Report (CAFR). This is the 16th consecutive year ERFC has earned the award. The GFOA certification remains valid for a period of one year, and requires,
INTRODUCTION 4
Educ ational EmployEEs’ supplEmEntary rEtirEmEnt systEm of fairfa x count y
Letter of Transmittal

Educ ational EmployEEs’ supplEmEntary rEtirEmEnt systEm of fairfa x count y
Letter of Transmittal
at minimum, that each CAFR satisfy both generally accepted accounting principles and legal requirements. For the first time, the FY 2012 CAFR received the Award of Excellence from the National School Public Relations Association (NSPRA).
The Public Pension Coordinating Council also honored the ERFC recently, granting the System the Public Pension Standards’ 2013 Award. The ERFC earned the award in recognition for meeting or exceeding professional standards for plan design and administration, as set forth in the Public Pension Standards. The ERFC Retirement Counseling Team received honorable mention for the Collaborative Team Excellence Award, sponsored by the FCPS Department of Human Resources.
Conclusion
This report is produced through the combined efforts of the ERFC staff and advisors functioning under your leadership. It is intended to provide complete and reliable information that will advance the management decision process, serve as a means for determining compliance with legal requirements, and allow for an assessment of the stewardship of the System’s funds. We extend our sincere appreciation to all those who contributed to the production of this document.
ERFC distributes this annual report to the members of the Fairfax County School Board, the Fairfax County Public Schools’ Leadership Team, its Government Finance Offices, and other interested parties. Copies are made available in print and electronically, with the full report posted on the ERFC website. We hope that all recipients find the report informative and useful.
Respectfully submitted,
Jeanne Carr, CFA Michael Lunter Executive Director Finance Coordinator and CIO
INTR
OD
UCT
ION
5 INTRODUCTION
INTR
OD
UCT
ION
INTR
OD
UCT
ION

November 25, 2013
Dear ERFC Members,
On behalf of the Board of Trustees of the Educational Employees’ Supplementary Retirement System of Fairfax County (ERFC), it is a privilege to present the Comprehensive Annual Financial Report for the fiscal year ending June 30, 2013. The ERFC Board and staff is committed to maintaining the financial integrity of the fund, and adhering to best practices in all areas of customer service. As we celebrate the 40th anniversary of ERFC’s inception, the participants and stakeholders in ERFC can be proud of the legacy created to emphasize retirement security and to protect the System’s assets in order to provide the supplemental retirement benefits promised to you by Fairfax County Public Schools.
The fiscal year introduced one change to the composition of ERFC’s Board. Nitin Chital left the Board after serving ERFC as the individual Trustee for nine years. The Board thanks Mr. Chittal for his dedicated service to ERFC. Upon Mr. Chittal’s departure, the School Board appointed Michael Burke as the individual Trustee. Mr. Burke is Managing Director and Mid-Atlantic Regional Manager for the Wealth and Investment Management division of Barclays. He brings more than 25 years of investment experience to the Board. I was re-elected to a fourth three-year term by the membership in spring 2013 and was re-elected as Chairperson in July, 2013.
The ERFC Board continues to emphasize that ERFC members and retirees should receive the fullest possible range of support services and again made communication activities a high priority in the 2013 Strategic Plan which it adopted earlier this year. To increase the understanding and appreciation of the value of ERFC and the total retirement program among our members, the Board included action plans to increase ERFC’s presence at schools, create targeted communications for members at different phases of their careers and enhance ERFC website content. The personal counseling sessions offered by the ERFC staff, the ERFCDirect online service, and the retirement workshops remain as critical components of the communications program. The Board of Trustees gratefully acknowledges the teamwork and commitment provided by the entire ERFC staff during the prior fiscal year.
This annual report details the ERFC system and investment activities specific to the 2013 fiscal year period ending June 30th. The Board is pleased with the 11.2 percent return for the 2013 fiscal year period and the double-digit returns in the last three out of four fiscal years which helped mitigate the results of the 2008-09 downturn. The Board continues to work closely with the ERFC staff and investment advisors to achieve a well-diversified asset mix, driven by risk-balanced strategies, and managed
INTRODUCTION 6
Educ ational EmployEEs’ supplEmEntary rEtirEmEnt systEm of fairfa x count y
Letter from the Chairperson
8001 Forbes Place, Suite 300 Springfield, VA 22151

Educ ational EmployEEs’ supplEmEntary rEtirEmEnt systEm of fairfa x count y
Letter from the Chairperson
with the disciplined oversight required to meet the System’s long-term investment goals.
ERFC’s defined benefit plan provides a valuable supplement to FCPS’ employee members. The ERFC was designed specifically to reward educational professionals with a pension to supplement the primary benefits they earn and receive separately from the Virginia Retirement System (VRS) and Social Security. In April, 2012 the Virginia Governor signed into law significant changes to the VRS including reduced pension benefits for employees with less than five years of service and a new hybrid plan for new employees hired on or after January 1, 2014. The ERFC staff intends to act as a liaison with VRS in assisting existing members with the opt-in decision into the hybrid plan early in 2014.
The School Board increased FCPS’ employer contribution rate from 5.34 percent of covered payroll to 5.60 percent for the 2014 fiscal year. The combined employee and employer contributions comprise the initial platform for the ERFC. However, it is the System’s investment earnings that provide the essential factor necessary to fulfill the guarantee of defined member benefits. Although concerned about the continued market volatility, the Board believes ERFC will continue to thrive by implementing prudent long-term investment strategies designed to spread pension costs over the full span of the employees’ careers, during both strong and weak investment periods.
The ERFC Board and staff value your opinions and welcome your feedback. We encourage you to visit the website at: www.fcps.edu/erfc/ or contact us directly with any questions regarding your pension fund or payable retirement benefits.
Yours sincerely,
Michael Hairston Chairperson ERFC Board of Trustees
7 INTRODUCTION
INTR
OD
UCT
ION
INTR
OD
UCT
ION

INTRODUCTION 8
Educ ational EmployEEs’ supplEmEntary rEtirEmEnt systEm of fairfa x count y
Board of Trustees
The Board of Trustees is the governing body of the Educational Employees’ Supplementary Retirement System of Fairfax County. The ERFC Board comprises seven members: three appointed by the School Board, three elected by the System’s active membership, and one trustee who is neither affiliated with, nor employed by Fairfax County, the Fairfax County School Board, nor by any union or similar organization representing teachers or other Fairfax County
employees. The initial six trustees annually select and recommend a seventh ERFC Board member, or “individual Trustee,” for approval by the Fairfax County School Board. The ERFC executive committee comprises the chairperson and treasurer. The Board meets monthly throughout the year, excluding August. ERFC trustees receive no compensation, but are reimbursed for business-related expenses.
Michael A. Hairston Chairperson/Trustee Elected Member
Leonard Bumbaca Vice Chairperson/Trustee Elected Member
Susan Quinn Treasurer/Trustee Appointed Member
Nancy Hammerer Trustee Elected Member
Richard Moniuszko Trustee Appointed Member
Nitin M. Chittal Individual Trustee Appointed Member
De Hawley Brown Trustee Appointed Member

Educ ational EmployEEs’ supplEmEntary rEtirEmEnt systEm of fairfa x count y
ERFC Administrative Organization
9 INTRODUCTION
INTR
OD
UCT
IONERFC BOARD OF TRUSTEES SCHOOL BOARD
Jeanne CarrExecutive Director and CIO
INFORMATION SYSTEMS
MEMBERSERVICES
FINANCIALSERVICES
Lisa B. Scott Communications SpecialistDina Boulette
Administrative Assistant
Evelyn Morgan Business Operations Assistant
Allison Kelly Investment Accounting Analyst
Francisco Tavarez Functional
ApplicationsSpecialist II
Mussie HagosFunctional
ApplicationsSpecialist I
Jim Roehner Deputy Executive Director
Patricia Church Retirement Coordinator
Jasper Baldwin Retirement Specialist
Jeff Franklin
Kristin Harrison
Amanda Stewart
Tammy Martin
Leslie Chappell
RETIREMENT
ASSISTANTS
Joanna Coles
Sethe Eckstein
Susan Chait
Jason Mohler
Carrie Holmes
RETIREMENT
COUNSELORS
Adolfo Cespedes
Kevin McCarty
Helen Shiflett
FINANCIAL
ANALYSTS
Lisa Grigsby
Colleen Collins
ACCOUNTING
TECHNICIANS
Michael Lunter Finance Coordinator
Stephanie ThomasInformation
Systems ManagementAnalyst

INTRODUCTION 10
Educ ational EmployEEs’ supplEmEntary rEtirEmEnt systEm of fairfa x count y
Professional Services
Investment Managers*DOMESTIC EQUITY
Aronson Johnson Ortiz, LP Philadelphia, Pennsylvania
Epoch Investment Partners, Inc. New York, New York
Lazard Asset Management New York, New York
Mellon Capital Management Corporation San Francisco, California
Turner Investment Partners, Inc. Berwyn, Pennsylvania
Westfield Capital Management Boston, Massachusetts
FIXED INCOMELoomis-Sayles & Company Boston, Massachusetts
Mellon Capital Management Corporation San Francisco, California
Mondrian Investment Group, Inc. London, England
Pacific Investment Management Company Newport Beach, California
GLOBAL ASSET ALLOCATIONBridgewater Associates, Inc. Westport, Connecticut
Wellington Management Boston, Massachusetts
Pacific Investment Managment Company Newport Beach, California
HEDGE FUNDGrosvenor Institutional Partners, L.P. Chicago, Illinois
Permal Group, Inc. New York, New York
PRIVATE EQUITYAudax Management Company, LLC New York, New York
Harbourvest Partners, LLC Boston, Massachusetts
Lexington Partners New York, New York
Newstone Capital Partners, LLC Los Angeles, California
Permal Capital Management, LLC Boston, Massachusetts
Private Advisors Richmond, Virginia
INTERNATIONAL EQUITYAcadian Asset Management Boston, Massachusetts
AllianceBernstein New York, New York
Causeway Capital Management, LLC 1 Los Angeles, California
William Blair and Company, LLC Chicago, Illinois
REAL ESTATEJP Morgan Asset Management New York, New York
Prudential Investment Management Parsippany, New Jersey
Center Square Investment Management Plymouth Meeting, Pennsylvania
UBS Global Asset Management Hartford, Connecticut
Other Service Providers ACTUARY
Gabriel, Roeder, Smith & Company Southfield, Michigan
AUDITORKPMG LLP Certified Public Accountants Washington, D.C.
INVESTMENT CONSULTANTNew England Pension Consultants Boston, Massachusetts
LEGAL COUNSELBredhoff & Kaiser, P.L.L.C. Washington, D.C.
Groom Law Group, Chartered Washington, D.C.
MASTER CUSTODIANBNY Mellon Pittsburgh, Pennsylvania
1 Hired in fiscal year 2013* See page 47 in the Investment Section

FIN
AN
CIA
L
“Play is the highest form of research.” Albert Einstein
Mason Crest Principal, Brian Butler, has a goal to make Mason Crest the model of excellence in education, where every student
experiences the success that they deserve. Butler brings 24 years of experience as an educator and a wealth of knowledge
regarding collaborative practices that advance student achievement. He leads by example and encourages his staff and
parent community to share their visions for developing a strong school whose fundamental purpose is to ensure high levels of
learning for all.Catiore nempore autate qui tem et faccum aut omni quis mod ute nonsequiam aut ad qui velias a nus, sequis
Financial SectionIndependent Auditors’ Report
Management Discussion and Analysis (Unaudited)
Statement of Fiduciary Net Position
Statement of Changes in Fiduciary Net Position
Notes to the Financial Statements
Required Supplementary Information (Unaudited)
Notes to the Schedules of Required Supplementary Information (Unaudited)
Other Supplementary Information
FIN
AN
CIA
L

FINANCIAL SECTION 12
Educ ational EmployEEs’ supplEmEntary rEtirEmEnt systEm of fairfa x count y
Independent Auditors’ Report

FIN
AN
CIA
L
13 FINANCIAL SECTION
Educ ational EmployEEs’ supplEmEntary rEtirEmEnt systEm of fairfa x count y
Independent Auditors’ Report
FINANCIAL SECTION 14
Educ ational EmployEEs’ supplEmEntary rEtirEmEnt systEm of fairfa x count y
Management Discussion and Analysis(Unaudited)
This discussion and analysis of the Educational Employees’ Supplementary Retirement System of Fairfax County
(ERFC) financial performance provides an over-view of the financial activities for the fiscal year ended June 30, 2013. The information contained in this section should be reviewed in conjunction with the letter of transmittal provided in the Introduction Section of this document.
Financial Overview
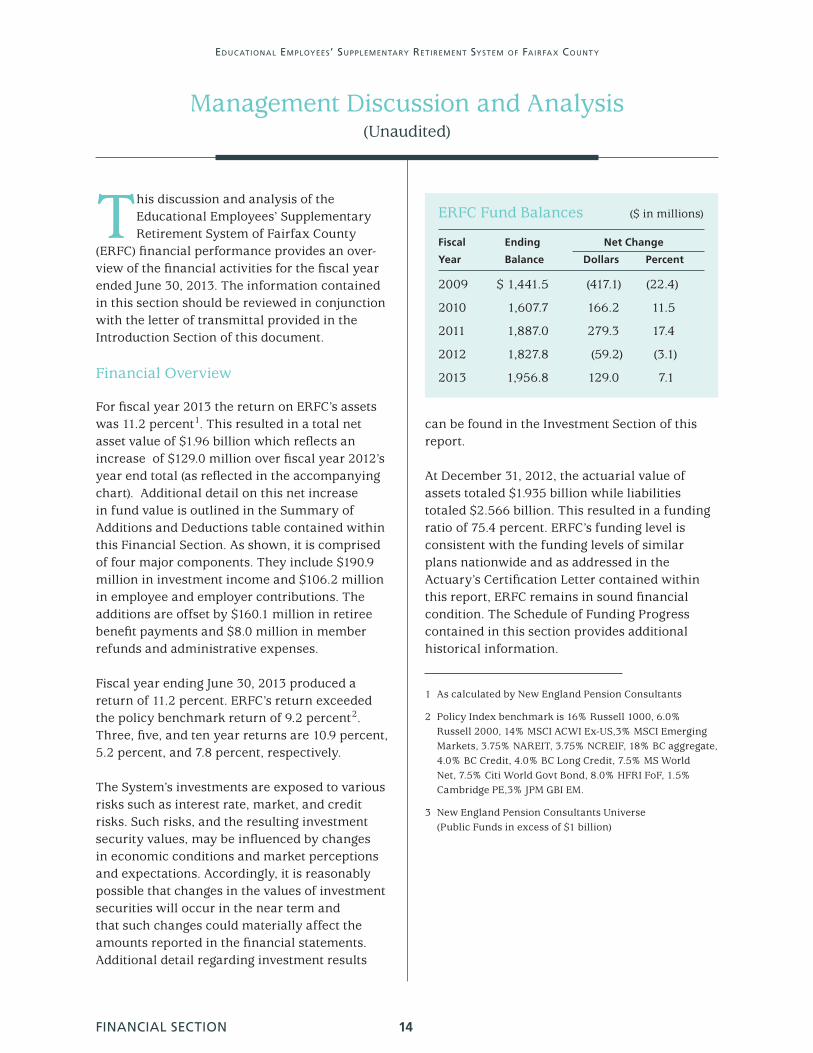
For fiscal year 2013 the return on ERFC’s assets was 11.2 percent1. This resulted in a total net asset value of $1.96 billion which reflects an increase of $129.0 million over fiscal year 2012’s year end total (as reflected in the accompanying chart). Additional detail on this net increase in fund value is outlined in the Summary of Additions and Deductions table contained within this Financial Section. As shown, it is comprised of four major components. They include $190.9 million in investment income and $106.2 million in employee and employer contributions. The additions are offset by $160.1 million in retiree benefit payments and $8.0 million in member refunds and administrative expenses.
Fiscal year ending June 30, 2013 produced a return of 11.2 percent. ERFC’s return exceeded the policy benchmark return of 9.2 percent2. Three, five, and ten year returns are 10.9 percent, 5.2 percent, and 7.8 percent, respectively.
The System’s investments are exposed to various risks such as interest rate, market, and credit risks. Such risks, and the resulting investment security values, may be influenced by changes in economic conditions and market perceptions and expectations. Accordingly, it is reasonably possible that changes in the values of investment securities will occur in the near term and that such changes could materially affect the amounts reported in the financial statements. Additional detail regarding investment results
can be found in the Investment Section of this report.
At December 31, 2012, the actuarial value of assets totaled $1.935 billion while liabilities totaled $2.566 billion. This resulted in a funding ratio of 75.4 percent. ERFC’s funding level is consistent with the funding levels of similar plans nationwide and as addressed in the Actuary’s Certification Letter contained within this report, ERFC remains in sound financial condition. The Schedule of Funding Progress contained in this section provides additional historical information.
1 As calculated by New England Pension Consultants
2 Policy Index benchmark is 16% Russell 1000, 6.0% Russell 2000, 14% MSCI ACWI Ex-US,3% MSCI Emerging Markets, 3.75% NAREIT, 3.75% NCREIF, 18% BC aggregate, 4.0% BC Credit, 4.0% BC Long Credit, 7.5% MS World Net, 7.5% Citi World Govt Bond, 8.0% HFRI FoF, 1.5% Cambridge PE,3% JPM GBI EM.
3 New England Pension Consultants Universe (Public Funds in excess of $1 billion)
ERFC Fund Balances ($ in millions)
Fiscal Ending Net Change
Year Balance Dollars Percent
2009 $ 1,441.5 (417.1) (22.4)
2010 1,607.7 166.2 11.5
2011 1,887.0 279.3 17.4
2012 1,827.8 (59.2) (3.1)
2013 1,956.8 129.0 7.1

Educ ational EmployEEs’ supplEmEntary rEtirEmEnt systEm of fairfa x count y
Management Discussion and Analysis(Unaudited)
FIN
AN
CIA
L
15 FINANCIAL SECTION
In addition, detailed information regarding actuarial assumptions and methods can be found in the Actuarial Section of this report.
Using this Annual Report
ERFC financial statements are comprised of the Statement of Fiduciary Net Position, Statement of Changes in Fiduciary Net Position, and Notes to the Financial Statements. Also contained in the Financial Section is other supplementary information in addition to the basic financial statements.
The Statement of Fiduciary Net Position provides information on all of the System’s assets and liabilities, with the difference between the assets and liabilities shown as net position. Ultimately, increases or decreases in net position may be used to measure the financial condition of ERFC over time.
The Statement of Changes in Fiduciary Net Position describes how ERFC’s net position
changed during the current fiscal year. Additions and deductions represent revenues and expenses, respectively. Additions minus deductions represent the change in net position. For the current fiscal year, ERFC received positive revenues from contributions. Investments generated sound gains. Expenses, or deductions, which consisted of benefit payments, refunds, and administrative costs were slightly higher this fiscal year.
The Notes to the Financial Statements provide additional data, which is crucial in understanding the information included in the financial statements. The Notes to the Financial Statements immediately follow the basic financial statements.
In addition to the basic financial statements and accompanying notes, the annual report also provides required supplementary information regarding the ERFC schedule of employer contributions and funding progress which is intended to assess ERFC’s ability to accumulate assets to pay retirement benefits when due.
Summary of Fiduciary Net Position
June 30,2013 June 30,2012 Difference
Assets
Total cash and investments $ 2,022,309,156 $ 1,857,824,191 $ 164,484,965
Total receivables 11,291,746 61,207,572 (49,915,826)
Other assets 28,645 42,421 (13,776)
Total assets 2,033,629,547 1,919,074,184 114,555,363
Liabilities
Accounts payable 1,864,168 2,775,296 (911,128)
Securities purchased 8,493,585 64,495,593 (56,002,008)
Securities lending collateral 66,498,968 24,034,973 42,463,995
Total liabilities 76,856,721 91,305,862 (14,449,141)
Total net position restricted $ 1,956,772,826 $ 1,827,768,322 $ 129,004,504 for pensions

FINANCIAL SECTION 16
Educ ational EmployEEs’ supplEmEntary rEtirEmEnt systEm of fairfa x count y
Management Discussion and Analysis(Unaudited)
Financial Statements
As indicated in the Summary of Fiduciary Net Position, the System’s net asset value increased $129.0 million or 7.1 percent in fiscal year 2013. This total increase in net position is due primarily to an increase of $164.5 million in the value of investments, a decrease in receivables of $(49.9) million, a $(56.9) million decrease in the value of payables along with an increase of $42.5 million in securities lending collateral liabilities.
As reflected in the Summary of Additions and Deductions (below), the net change is due to $106.1 million in contributions and $190.9 million in net investment income, which is offset by $160.1 million in benefits, $4.4 million in refunds and $3.6 million in expenses.
Also presented in the Summary of Additions and Deductions, additional information is provided regarding the differences between the fiscal year 2012 and 2013 results. These differing results are due mainly to a significant increase in investment income of $189.3 million and an increase in contributions of $4.1 million, offset by an increase in benefit payments of 5.1 million.
Requests for Information
This financial information is intended to provide a general overview of the System’s finances. Questions concerning any of the information presented in this report or requests for additional financial information should be addressed to either the Executive Director or the Finance Coordinator of the Educational Employees’ Supplementary Retirement System of Fairfax County, 8001 Forbes Place, Suite 300, Springfield, Virginia 22151.
Summary of Additions and Deductions
June 30,2013 June 30,2012 Difference
Additions
Contributions
Employer $ 67,734,634 $ 52,934,245 $ 14,800,389
Member 38,428,367 49,142,379 (10,714,012)
Net investment income 190,947,851 1,635,435 189,312,416
Total 297,110,852 103,712,059 193,398,793
Deductions
Benefits 160,098,128 155,041,762 5,056,366
Refunds 4,419,806 4,295,171 124,635
Admin. Expenses 3,588,414 3,574,923 13,491
Total 168,106,348 162,911,856 5,194,492
Net Change $ 129,004,504 $ (59,199,797) $ 188,204,301
Educ ational EmployEEs’ supplEmEntary rEtirEmEnt systEm of fairfa x count y
Statement of Fiduciary Net Position(As of June 30, 2013)
17 FINANCIAL SECTION
FIN
AN
CIA
L
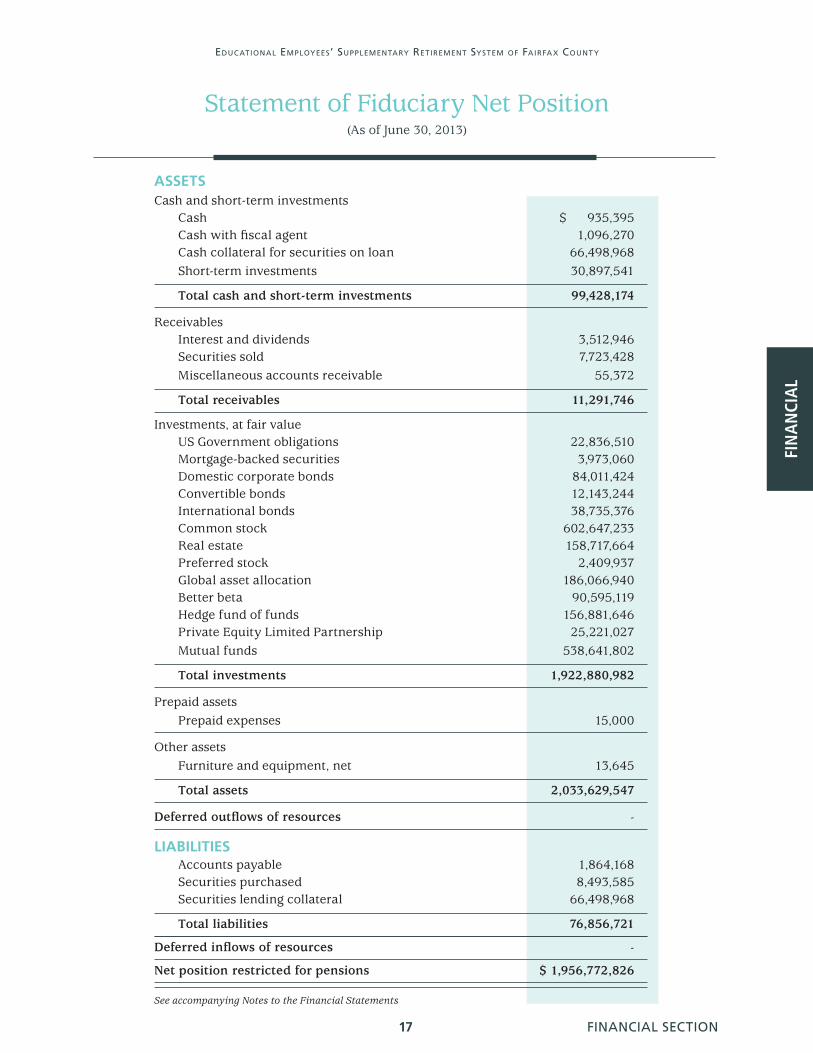
ASSETSCash and short-term investments
Cash $ 935,395 Cash with fiscal agent 1,096,270 Cash collateral for securities on loan 66,498,968 Short-term investments 30,897,541
Total cash and short-term investments 99,428,174
ReceivablesInterest and dividends 3,512,946 Securities sold 7,723,428 Miscellaneous accounts receivable 55,372
Total receivables 11,291,746
Investments, at fair valueUS Government obligations 22,836,510 Mortgage-backed securities 3,973,060 Domestic corporate bonds 84,011,424 Convertible bonds 12,143,244 International bonds 38,735,376 Common stock 602,647,233 Real estate 158,717,664 Preferred stock 2,409,937 Global asset allocation 186,066,940 Better beta 90,595,119 Hedge fund of funds 156,881,646 Private Equity Limited Partnership 25,221,027 Mutual funds 538,641,802
Total investments 1,922,880,982
Prepaid assetsPrepaid expenses 15,000
Other assetsFurniture and equipment, net 13,645
Total assets 2,033,629,547
Deferred outflows of resources -
LIABILITIESAccounts payable 1,864,168 Securities purchased 8,493,585 Securities lending collateral 66,498,968
Total liabilities 76,856,721
Deferred inflows of resources -
Net position restricted for pensions $ 1,956,772,826
See accompanying Notes to the Financial Statements
FINANCIAL SECTION 18
Educ ational EmployEEs’ supplEmEntary rEtirEmEnt systEm of fairfa x count y
Statement of Changes in Fiduciary Net Position(For the Fiscal Year Ending June 30, 2013)
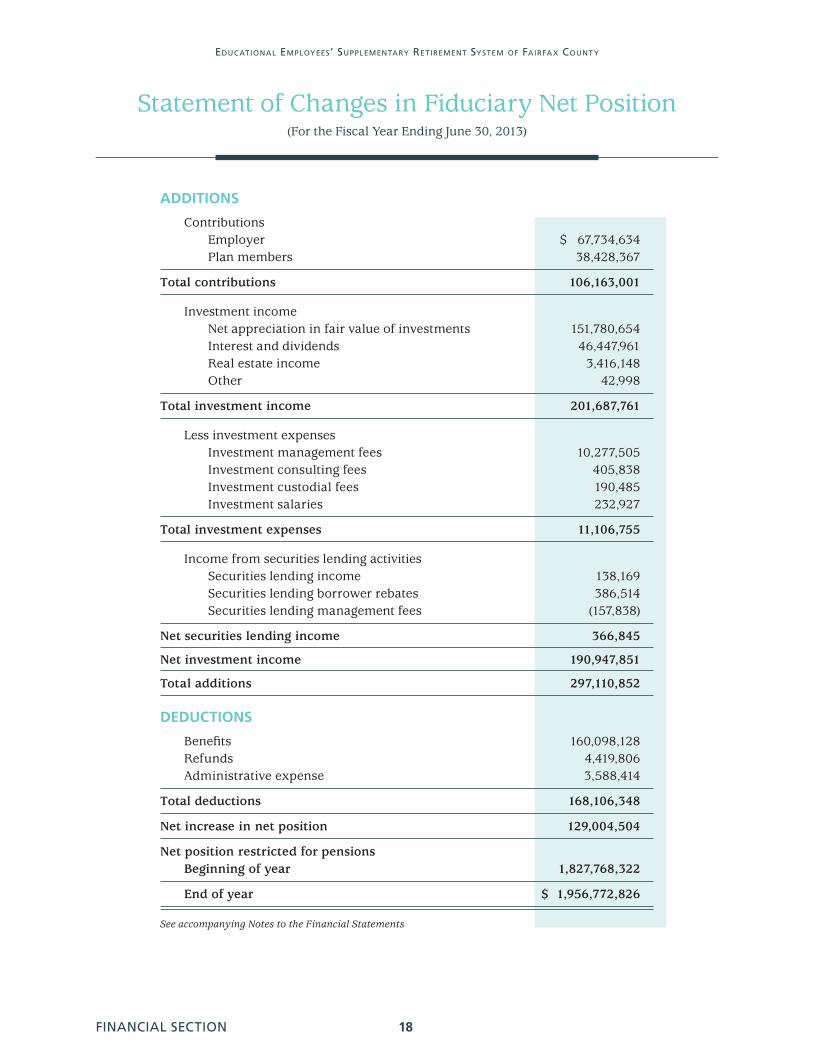
ADDITIONS
Contributions Employer $ 67,734,634 Plan members 38,428,367
Total contributions 106,163,001
Investment income Net appreciation in fair value of investments 151,780,654 Interest and dividends 46,447,961 Real estate income 3,416,148 Other 42,998
Total investment income 201,687,761
Less investment expenses Investment management fees 10,277,505 Investment consulting fees 405,838 Investment custodial fees 190,485 Investment salaries 232,927
Total investment expenses 11,106,755
Income from securities lending activities Securities lending income 138,169 Securities lending borrower rebates 386,514 Securities lending management fees (157,838)
Net securities lending income 366,845
Net investment income 190,947,851
Total additions 297,110,852
DEDUCTIONS
Benefits 160,098,128 Refunds 4,419,806 Administrative expense 3,588,414
Total deductions 168,106,348
Net increase in net position 129,004,504
Net position restricted for pensions Beginning of year 1,827,768,322
End of year $ 1,956,772,826
See accompanying Notes to the Financial Statements

Educ ational EmployEEs’ supplEmEntary rEtirEmEnt systEm of fairfa x count y
Notes to the Financial Statements
19 FINANCIAL SECTION
FIN
AN
CIA
L
The Educational Employees’ Supplementary Retirement System of Fairfax County (“ERFC”, “System”) is a legally separate
single-employer retirement system and fund established under Virginia code to provide pension benefits to all full-time educational and administrative support employees who are employed by the Fairfax County Public Schools (Schools) and who are not covered by another Fairfax County, Virginia (County) plan. As such, and as a fund under the financial control of the School Board, the System’s financial statements are included in the Schools’ basic financial statements as a pension trust fund.
The System contains two primary benefit structures, ERFC and ERFC 2001. Both are defined benefit structures. The original structure, ERFC, became effective July 1, 1973, and is coordinated with the benefits members expect to receive from the Virginia Retirement System (VRS) and Social Security. It remains in effect; however, it was closed to new members employed after June 30, 2001. Effective July 1, 2001, all newly hired full-time educational and administrative support employees are enrolled in ERFC 2001. This new component incorporates a streamlined stand-alone retirement benefit structure.
1. Summary of Significant Accounting and Other Policies
Basis of Accounting The System’s financial statements have been prepared under the accrual basis of accounting in accordance with accounting principles applicable to governmental units in the United States of America. Member contributions are recognized in the period in which the contributions are due. Employer contributions are recognized when due and the employer has made a formal commitment to provide the contributions. Benefits and refunds are recognized when due and payable in accordance with the terms of the System. The costs of administering the System are paid for by the use of investment income and employer and employee contributions.
Investment Policy and Valuation Short-term investments are reported at cost, which approximates fair value. All other investments are reported at fair value or estimated fair value. Securities which are traded on national or international exchanges are reported at fair value based on the last reported sales price at current exchange rates. The System records these investment purchases and sales as of the trade date but are not finalized until settlement date, which is approximately three business days for domestic securities and five to seven business days for foreign securities. Until finalized, these investment purchases and sales are recorded as payables and receivables, respectively.
The values of the commingled funds are provided to ERFC’s master custodian by the managers. These commingled funds include private real estate, global asset allocation, better beta, hedge fund of funds, emerging market equity and emerging market debt. The fair value of these investments is determined in different ways. For private real estate, the values of the actual property holdings are determined periodically but usually annually and subject to independent appraisal. However, since these holdings are relatively illiquid, there is not a ready market for these assets and it’s possible that fair value can differ from the assessed value. For global asset allocation, better beta, hedge fund of funds, emerging market equity and emerging market debt—depending on the actual contents of these separate portfolios—the assets are either reported at fair value as determined by the markets for those assets, or, if market quotes are not readily available, they are determined by the manager, subject to annual audits.
Cash received as collateral on securities lending transactions and investments with such cash are reported as assets along with the related liability for collateral received.
Cash ERFC maintains its cash with the County, which invests cash and allocates interest earned net of a management fee, on a daily basis to the System based on the System’s average daily balance of equity in pooled cash. For the fiscal year ended.
Notes, continued on next page

FINANCIAL SECTION 20
Educ ational EmployEEs’ supplEmEntary rEtirEmEnt systEm of fairfa x count y
Notes to the Financial Statements
June 30, 2013, the cash balance of $935,395 represents funds that could not be invested in the County’s enhanced cash fund until July 1, 2013.
The bank balance of the County’s public deposits was either insured by the Federal Deposit Insurance Corporation or through the State Treasury Board pursuant to the provisions of the Security for Public Deposit Act. As of June 30, 2013, cash with fiscal agent totaled $1,096,270. This cash is insured and represents receipts from investment sales occurring on the last day of the month.
In fiscal year 2013, the System implemented GASB Statement No. 63, Financial Reporting of Deferred Outflows of Resources, Deferred Inflows of Resources, and Net Position, issued in June, 2011 and GASB Statement No. 65, Items Previously Reported as Assets and Liabilities, issued March, 2012.
2. Plan Distribution and Contribution Information
Benefit Structure Descriptions Benefit provisions for ERFC and ERFC 2001 are established and may be amended by the System’s Board of Trustees subject to approval by the School Board. All members are vested for benefits after five years of service. The ERFC benefit formula was revised effective July 1, 1988, following changes to the Virginia Retirement System (VRS), which the ERFC has historically supplemented. The benefit structure is designed to supplement VRS and Social Security benefits to provide a level retirement benefit throughout retirement. ERFC 2001 has a stand-alone structure. Member contributions for ERFC and ERFC 2001 are made through an arrangement that results in a deferral of taxes on the contributions. Further details of member contributions may be found in Article III of both Benefit Structure Documents.
ERFC and ERFC 2001 provide for a variety of benefit payment types. ERFC’s payment types include Service Retirement, Reduced Service, Disability, Death-in-Service, and Deferred Retirement. ERFC 2001’s payment types include Service Retirement, Death-in-Service, and Deferred Retirement. Minimum eligibility requirements for full service
benefits for ERFC is either (a) age 65 with 5 years of service or (b) age 55 with 25 years of service. Minimum eligibility requirements for full service benefits for ERFC 2001 is either (a) age 60 with 5 years of service or (b) any age with 30 years of service. Annual post-retirement cost-of-living increases of 3 percent are effective each March 31. Participants in their first full year of retirement receive a 1.49 percent increase. Participants who retire on or after January 1 receive no cost-of-living increase that first March. Additional detail regarding all benefit payment types can be found in the actuarial valuation and/or the System Document. ERFC also issues this publicly available financial report which includes financial statements and required supplementary information. A copy of this report may be obtained by writing to ERFC, 8001 Forbes Place, Suite 300, Springfield, VA 22151 or by calling 800-426-3900. It is also available online at www.fcps.edu/erfc/publications.shtml.
Contributions The contribution requirements for ERFC and ERFC 2001 members are established and may be amended by the System’s Board of Trustees with the approval of the School Board. The requirements are based upon a fundamental financial objective of having rates of contribution that remain relatively level from generation to generation of employees. To determine the appropriate employer contribution rates and to assess the extent to which the fundamental financial objective is being achieved, the System has actuarial valuations prepared annually.
At December 31, 2012, the date of the most recent actuarial valuation, the System’s membership consisted of:
Retirees and beneficiaries currently receiving benefits 9,788
Terminated employees entitled to benefits but not yet receiving them 3,099
Active plan members 21,519
Total 34,406
Notes, continued on next page

Educ ational EmployEEs’ supplEmEntary rEtirEmEnt systEm of fairfa x count y
Notes to the Financial Statements
21 FINANCIAL SECTION
FIN
AN
CIA
L
the entry age actuarial cost method was used in preparing the valuation. The actuarial assumptions include a 7.5 percent investment rate of return and 3.75 to 9.05 percent annual wage increase of which both include a 3.75 percent inflation assumption. In addition, there is a 3 percent retiree cost-of-living adjustment. Unfunded actuarial liabilities are amortized over a closed 30 year period using the level percent of payroll method. The remaining amortization period at December 31, 2012 was 26 years. Assets are valued using the 5 year smoothing formula, which recognizes that assets must always be between 75 percent and 125 percent of the market. If the method results in an actuarial value of assets that is less than 75 percent or more than 125 percent, the actuarial value will be reset and the difference between market and actuarial value shall be spread over 4 future years. There is no legal maximum requirement on the employer contribution rate.
3. Investment Securities
Investments The authority to establish pension funds is set forth in sections 51.1-800 of the Code of Virginia (Code) which provides that the County may purchase investments for pension funds (including common and preferred stocks and corporate bonds) that meet the standard of judgment and care set forth in Section 51.1-124 of the Code. The Board of Trustees makes all investment decisions which are based on information and/or recommendations provided by ERFC’s investment consultant and ERFC staff.
The System does not have investments (other than U.S. government and U.S. government guaranteed obligations) in any one organization that represents 5 percent or more of net assets held in trust for pension benefits.
As permitted by the Code described above, ERFC invests in derivative instruments on a limited basis in accordance with the Board of Trustees’ investment policy. Investment in derivatives allows the System to increase earnings and/or hedge against potential losses. The risks associated with derivative investments include market risk resulting from fluctuations in interest and currency rates,
Funding Policy The contribution requirements of members and the employer are established and may be amended by the ERFC Board of Trustees, subject to School Board approval. Members are required to contribute 3 percent of annual salary. The employer is required to contribute at an actuarially determined rate which presently is 5.34 percent.The actuarial valuations as of odd numbered years are used to set the employer contribution rate for the two-year period beginning 18 months after the valuation date. As such, the December 31, 2011 valuation recommended that the contribution rate for the two-year period beginning July 1, 2013 to June 30, 2015 be increased to 5.6 percent in order to avoid a Net Pension Obligation (NPO). Restructuring of the VRS employee contribution rate caused the School Board to decrease the ERFC member contribution rate to 3 percent beginning in fiscal year 2013. This necessitated a corresponding 1 percent increase to the employer contribution rate to 5.34 percent from July 1, 2012 to June 30, 2013.
Annual Pension Cost ERFC’s annual required contribution (ARC) for fiscal year 2013 was $68 million, of which 100% was contributed, resulting in no net pension obligation in the current fiscal year.
Funded Status and Funding Progress As of December 31, 2012, the most recent actuarial valuation date, ERFC was 75.4 percent funded. The actuarial accrued liability for benefits was $2.57 billion and the actuarial value of assets was $1.94 billion, resulting in an unfunded actuarial accrued liability (UAAL) of $0.63 billion. The covered payroll (annual payroll of active employees covered by the plan) was $1.3 billion, and the ratio of the UAAL to the covered payroll was 48.6 percent.
The Schedule of Funding Progress, presented as RSI following the Notes to the Financial Statements, presents multi-year trend information about whether the actuarial value of Plan assets are increasing or decreasing over time relative to the actuarial accrued liability for benefits.
Actuarial Methods and Assumptions In the December 31, 2012 actuarial valuation,
Notes, continued on next page
FINANCIAL SECTION 22
Educ ational EmployEEs’ supplEmEntary rEtirEmEnt systEm of fairfa x count y
Notes to the Financial Statements
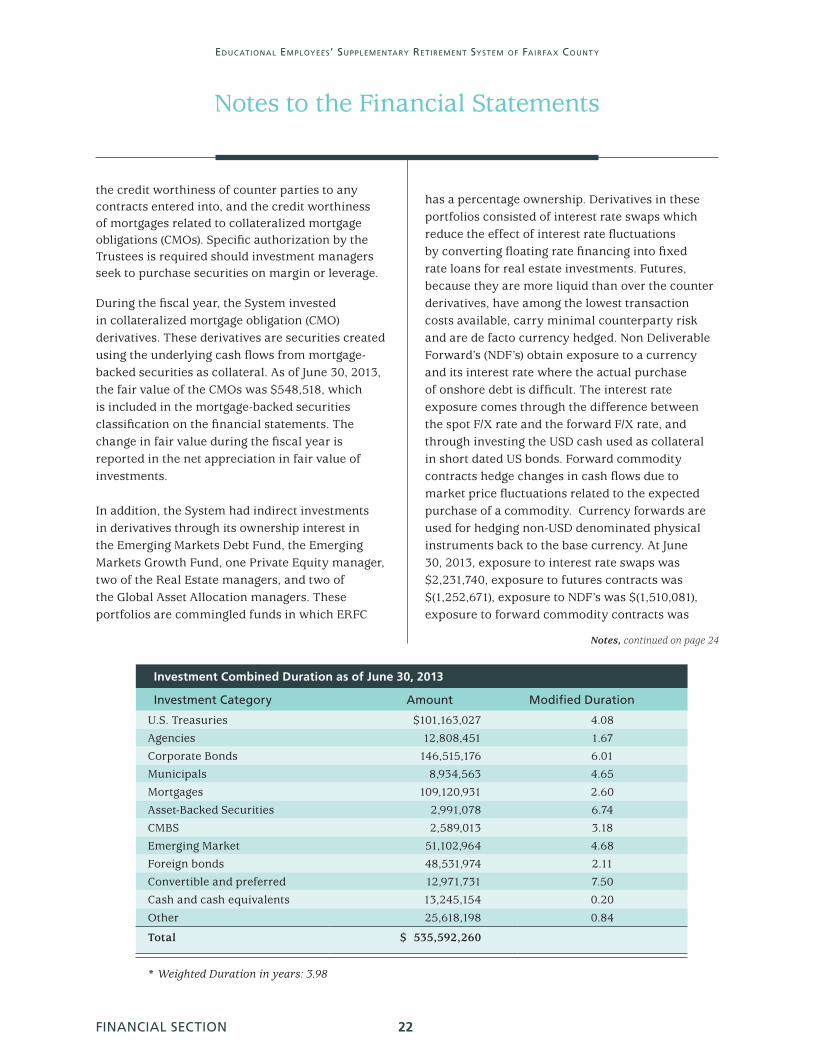
Investment Combined Duration as of June 30, 2013
Investment Category Amount Modified Duration
U.S. Treasuries $101,163,027 4.08
Agencies 12,808,451 1.67
Corporate Bonds 146,515,176 6.01
Municipals 8,934,563 4.65
Mortgages 109,120,931 2.60
Asset-Backed Securities 2,991,078 6.74
CMBS 2,589,013 3.18
Emerging Market 51,102,964 4.68
Foreign bonds 48,531,974 2.11
Convertible and preferred 12,971,731 7.50
Cash and cash equivalents 13,245,154 0.20
Other 25,618,198 0.84
Total $ 535,592,260
* Weighted Duration in years: 3.98
Notes, continued on page 24
the credit worthiness of counter parties to any contracts entered into, and the credit worthiness of mortgages related to collateralized mortgage obligations (CMOs). Specific authorization by the Trustees is required should investment managers seek to purchase securities on margin or leverage.
During the fiscal year, the System invested in collateralized mortgage obligation (CMO) derivatives. These derivatives are securities created using the underlying cash flows from mortgage-backed securities as collateral. As of June 30, 2013, the fair value of the CMOs was $548,518, which is included in the mortgage-backed securities classification on the financial statements. The change in fair value during the fiscal year is reported in the net appreciation in fair value of investments.
In addition, the System had indirect investments in derivatives through its ownership interest in the Emerging Markets Debt Fund, the Emerging Markets Growth Fund, one Private Equity manager, two of the Real Estate managers, and two of the Global Asset Allocation managers. These portfolios are commingled funds in which ERFC
has a percentage ownership. Derivatives in these portfolios consisted of interest rate swaps which reduce the effect of interest rate fluctuations by converting floating rate financing into fixed rate loans for real estate investments. Futures, because they are more liquid than over the counter derivatives, have among the lowest transaction costs available, carry minimal counterparty risk and are de facto currency hedged. Non Deliverable Forward’s (NDF’s) obtain exposure to a currency and its interest rate where the actual purchase of onshore debt is difficult. The interest rate exposure comes through the difference between the spot F/X rate and the forward F/X rate, and through investing the USD cash used as collateral in short dated US bonds. Forward commodity contracts hedge changes in cash flows due to market price fluctuations related to the expected purchase of a commodity. Currency forwards are used for hedging non-USD denominated physical instruments back to the base currency. At June 30, 2013, exposure to interest rate swaps was $2,231,740, exposure to futures contracts was $(1,252,671), exposure to NDF’s was $(1,510,081), exposure to forward commodity contracts was

Educ ational EmployEEs’ supplEmEntary rEtirEmEnt systEm of fairfa x count y
Notes to the Financial Statements
CREDIT QUALITY SUMMARY (As of June 30, 2013)
Rating Category Percent Amount Total Percent
AAA Domestic bonds 0.0% $ 188,967 AAA International bonds 2.2% 11,610,319 AAA Mortgage backed securities 0.3% 1,530,410 AAA US Government obligations 0.0% 9,727 13,339,423 2.5%
AA Domestic bonds 0.5% 2,914,894 AA International bonds 0.3% 1,808,073 AA Mortgage backed securities 6.4% 34,031,647 AA US Government obligations 9.1% 48,839,445 87,594,059 16.4%
A Domestic bonds 2.6% 13,760,862 A International bonds 6.6% 35,297,062 A Mortgage backed securities 0.1% 308,489 A US Government obligations 0.0% 25,384 A Convertible bonds 0.0% 203,901 49,595,698 9.3%
BBB Domestic bonds 8.9% 47,490,658 BBB International bonds 3.5% 18,942,697 BBB Mortgage backed securities 0.1% 312,564 BBB US Government obligations 0.0% - BBB Convertible bonds 0.6% 3,229,625 BBB Preferred stocks 0.0% 121,000 70,096,544 13.1%
BB Domestic bonds 3.6% 19,447,192 BB International bonds 2.0% 10,592,283 BB Mortgage backed securities 0.0% - BB US Government obligations 0.0% - BB Convertible bonds 0.8% 4,064,268 BB Preferred stocks 0.0% 121,688 34,225,431 6.4%
B Domestic bonds 1.7% 9,047,862 B International bonds 0.0% - B Mortgage backed securities 0.0% 33,812 9,081,674 1.7%
Below B Domestic bonds 0.6% 2,987,834 Below B International bonds 0.0% - 2,987,834 0.6%
Not rated Cash and Cash equivalent 3.5% 18,809,294 Not rated Convertible Bonds 0.9% 4,645,452 Not rated Mortgage backed securities 0.1% 479,063 Not rated International bonds 3.3% 17,704,282 Not rated Domestic bonds 37.3% 199,842,926 Not rated US Government obligations 4.3% 22,836,512 Not rated Preferred stocks 0.0% 188,193 264,505,722 49.4%
Withdrawn rating Domestic bonds 0.7% 3,806,488 Withdrawn rating International bonds 0.1% 347,990 Withdrawn rating Mortgage backed securities 0.0% 11,397 4,165,875 0.8%
Total 100.0% $ 535,592,260 $ 535,592,260 100.0%
23 FINANCIAL SECTION
FIN
AN
CIA
L
FINANCIAL SECTION 24
Educ ational EmployEEs’ supplEmEntary rEtirEmEnt systEm of fairfa x count y
Notes to the Financial Statements
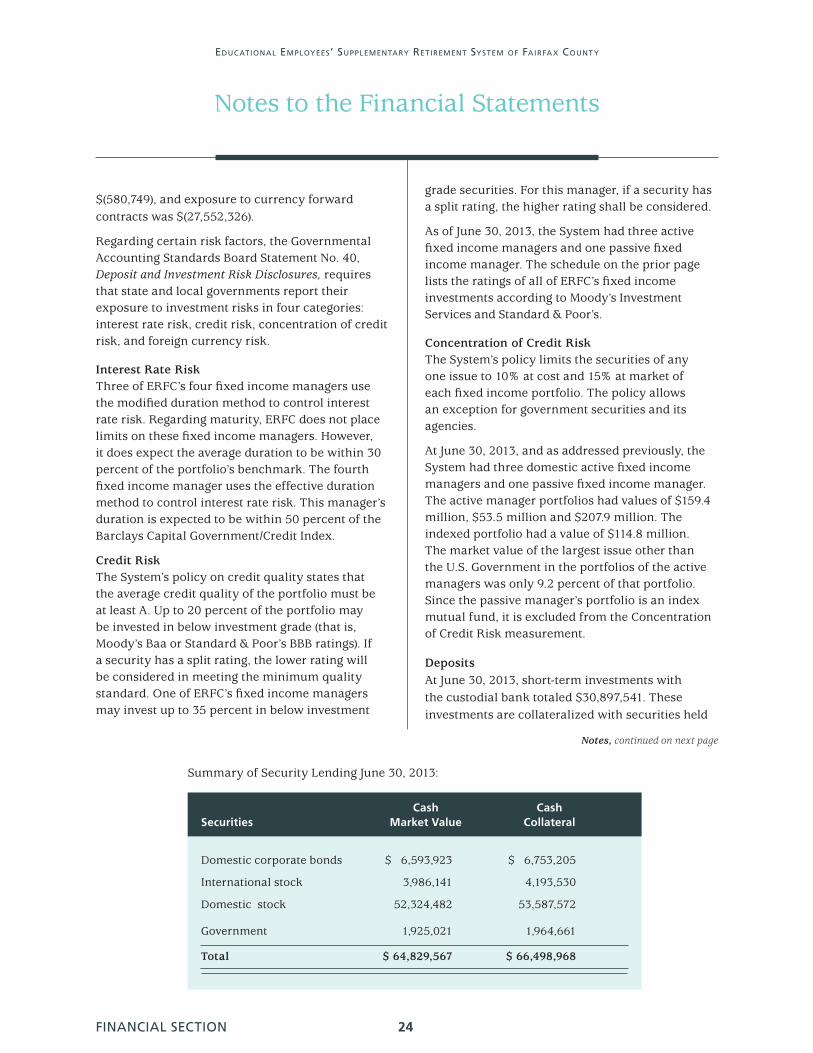
Summary of Security Lending June 30, 2013:
Domestic corporate bonds $ 6,593,923 $ 6,753,205
International stock 3,986,141 4,193,530
Domestic stock 52,324,482 53,587,572
Government 1,925,021 1,964,661
Total $ 64,829,567 $ 66,498,968
Cash Cash Securities Market Value Collateral
$(580,749), and exposure to currency forward contracts was $(27,552,326).
Regarding certain risk factors, the Governmental Accounting Standards Board Statement No. 40, Deposit and Investment Risk Disclosures, requires that state and local governments report their exposure to investment risks in four categories: interest rate risk, credit risk, concentration of credit risk, and foreign currency risk.
Interest Rate Risk Three of ERFC’s four fixed income managers use the modified duration method to control interest rate risk. Regarding maturity, ERFC does not place limits on these fixed income managers. However, it does expect the average duration to be within 30 percent of the portfolio’s benchmark. The fourth fixed income manager uses the effective duration method to control interest rate risk. This manager’s duration is expected to be within 50 percent of the Barclays Capital Government/Credit Index.
Credit Risk The System’s policy on credit quality states that the average credit quality of the portfolio must be at least A. Up to 20 percent of the portfolio may be invested in below investment grade (that is, Moody’s Baa or Standard & Poor’s BBB ratings). If a security has a split rating, the lower rating will be considered in meeting the minimum quality standard. One of ERFC’s fixed income managers may invest up to 35 percent in below investment
grade securities. For this manager, if a security has a split rating, the higher rating shall be considered.
As of June 30, 2013, the System had three active fixed income managers and one passive fixed income manager. The schedule on the prior page lists the ratings of all of ERFC’s fixed income investments according to Moody’s Investment Services and Standard & Poor’s.
Concentration of Credit Risk The System’s policy limits the securities of any one issue to 10% at cost and 15% at market of each fixed income portfolio. The policy allows an exception for government securities and its agencies.
At June 30, 2013, and as addressed previously, the System had three domestic active fixed income managers and one passive fixed income manager. The active manager portfolios had values of $159.4 million, $53.5 million and $207.9 million. The indexed portfolio had a value of $114.8 million. The market value of the largest issue other than the U.S. Government in the portfolios of the active managers was only 9.2 percent of that portfolio. Since the passive manager’s portfolio is an index mutual fund, it is excluded from the Concentration of Credit Risk measurement.
Deposits At June 30, 2013, short-term investments with the custodial bank totaled $30,897,541. These investments are collateralized with securities held
Notes, continued on next page

Educ ational EmployEEs’ supplEmEntary rEtirEmEnt systEm of fairfa x count y
Notes to the Financial Statements
25 FINANCIAL SECTION
FIN
AN
CIA
L
System for income of the securities while on loan. The market value of collateral is monitored daily by the custodian.
Cash collateral is invested in a fund maintained by the custodian or its affiliate. Per stated custodian policy, the maximum weighted average maturity of the fund is 60 days. Investment income from the securities lending program is shared 75/25 by ERFC and the custodian, respectively. At year-end, the System had no overall credit risk exposure to borrowers because the amounts the System owed the borrowers exceeded the amounts the borrowers owed the System.
Cash received as collateral and the related liability of $ 66,498,968 as of June 30, 2013, are shown on the Statement of Plan Net Assets. As of June 30, 2013, the market value of securities on loan for cash collateral was $ $64,829,567. Securities received as collateral are not reported as assets and liabilities since ERFC does not have the ability to pledge or sell the collateral securities absent
by the agent in the System’s name or are in a short-term investment pool.
Securities Lending The System’s Board of Trustees’ policy permits the fund to participate in a securities lending program. The securities lending program is administered by the System’s custodian. Certain securities of the System are loaned to approved broker/dealers who borrow the securities and provide collateral in the form of cash, U.S. Treasury or Government Agency Securities, letters of credit issued by approved banks, or other securities of a quality specified in the securities lending agreement. Collateral must be provided in the amount of 102 percent of market value for domestic securities and 105 percent for international securities. The System did not impose any restrictions during the period on the amount of loans the custodian made on its behalf. The custodian provides for full indemnification to the System for any losses that might occur in the program due to the failure of a broker/dealer to return a borrowed security or failure to pay the
US Government obligations 22,836,510
Mortgage-backed securities $ 3,973,060
Domestic corporate bonds 84,011,424
Convertible bonds 12,143,244
International bonds 38,735,376
Common stock 602,647,233
Real Estate 158,717,664
Preferred stock 2,409,937
Global asset allocation 186,066,940
Better beta 90,595,119
Hedge fund of funds 156,881,646
Private Equity Limited Partnership 25,221,027
Mutual funds 538,641,802
Sub-total investments $ 1,922,880,982
Cash collateral for securities on loan 66,498,968
Total $ 1,989,379,950
Investment Type Market Value
Investments with the custodian as of June 30, 2013, included the following:
Notes, continued on page 27

FINANCIAL SECTION 26
Educ ational EmployEEs’ supplEmEntary rEtirEmEnt systEm of fairfa x count y
Notes to the Financial Statements
Market Value of Foreign Currency Risk (As of June 30, 2013)
Currency Cash & Cash Equivalents Equity
Fixed Income Securities
Preferred Securities Grand Total
AUSTRALIAN DOLLAR $ 78,418 $ 4,533,115 $ 3,733,573 $ 8,345,106
BRAZIL REAL 29,075 1,319,733 12,232,194 1,365,867 14,946,869
CANADIAN DOLLAR 59,005 11,201,414 6,313,729 17,574,148
CHILEAN PESO 1,481,005 671,291 2,152,296
COLUMBIAN PESO 96,963 4,179,923 4,276,886
CZECH KORUNA 2,521 2,521
DANISH KRONE 1,035,166 1,035,166
EURO CURRENCY UNIT 558,184 67,179,721 1,288,276 613,189 69,639,370
HONG KONG DOLLAR 420,952 14,761,042 15,181,994
HUNGARIAN FORINT 83 2,194,601 2,194,684
INDONESIAN RUPIAH 9,594 257,649 267,243
ISRAELI SHEKEL 10,114 10,114
JAPANESE YEN 175,706 46,420,387 46,596,093
MALAYSIAN RINGGIT 105,720 1,418,822 4,315,452 5,839,994
MEXICAN NEW PESO 5,593 1,297,169 7,941,978 9,244,740
NEW TAIWAN DOLLAR - 4,618,994 4,618,994
NEW TURKISH LIRA 10,608 2,204,287 2,566,572 4,781,467
NEW ZEALAND DOLLAR 34,735 165,321 7,286,014 7,486,070
NORWEGIAN KRONE 13,161 4,946,245 2,723,572 7,682,978
PERUVIAN NUEVO SOL - 2,689,845 2,689,845
PHILIPPINES PESO 85,333 40,561 125,894
POLISH ZLOTY 98,279 418,355 6,324,943 6,841,577
POUND STERLING 242,872 48,861,069 279,568 49,383,509
RUSSIAN ROUBLE 3,238,945 3,238,945
S AFRICAN COMM RAND 94 1,297,673 4,933,380 6,231,147
SINGAPORE DOLLAR 46,483 6,444,095 4,362,008 10,852,586
SOUTH KOREAN WON 5,645 9,214,948 2,217,393 11,437,986
SWEDISH KRONA 99 5,400,984 5,401,083
SWISS FRANC 206,825 17,337,545 17,544,370
THAILAND BAHT 574,641 1,743,581 2,318,222
Grand Total $ 4,351,708 $ 252,117,876 $ 79,493,257 $ 1,979,056 $ 337,941,897

Educ ational EmployEEs’ supplEmEntary rEtirEmEnt systEm of fairfa x count y
Notes to the Financial Statements
borrower default.
Custodial Credit Risk Custodial credit risk is the risk that in the event of a bank failure, the system’s funds will be lost. However, the System’s investments and deposits are not exposed to custodial credit risk since they are held by the agent in the System’s name. Other investments such as mutual funds, a short-term investment pool and a cash collateral investment pool which invests cash collateral for securities on loan, are not exposed to custodial risk due to their non-physical form. As such, the System does not have a custodial credit risk policy.
Foreign Currency Risk The System’s Investment Guidelines on active fixed income holdings are limited to debt instruments of U.S. entities denominated in U.S. dollars which includes U.S. denominated sovereign bonds. However, with Trustee approval, ERFC’s two active fixed income managers have been granted exceptions that allow investments in non-U.S. bonds—one at a maximum of 25% and the other at 20%.
At the present time, there are no specific foreign currency guidelines for equities, however, the equity managers are all measured against specific benchmarks and are expected to adhere to the performance standard and risk guidelines identified in ERFC’s Investment Policy. The chart on the previous page provides a summary of ERFC’s foreign currency risk.
4. Income Taxes
The Internal Revenue Service (IRS) issued a determination letter on May 22, 2012, which stated that the System and its underlying trust qualify under the applicable provisions of the Internal Revenue Code and therefore are exempt from federal income taxes. In the opinion of the plan administrator, the System and its underlying trust have operated within the terms of the IRS regulations and are qualified under the applicable provisions of the Internal Revenue Code.
27 FINANCIAL SECTION
FIN
AN
CIA
L

FINANCIAL SECTION 28
Educ ational EmployEEs’ supplEmEntary rEtirEmEnt systEm of fairfa x count y
Required Supplementary Information(Unaudited)
Historical information is presented herein for the most recent six fiscal years as required supplementary information (RSI). This information is intended to help users assess the System’s funding status on a going-concern basis, assess progress made in accumulating assets to pay benefits when due, and make comparisons with other public employee retirement systems.
Schedule of Employer Contributions
Annual Year ended Required Percentage June 30 Contribution Contributed
2008 38,334,140 100%
2009 37,281,658 107%
2010 35,146,816 108%
2011 47,118,111 100%
2012 50,738,815 104%
2013 67,734,634 100%
Analysis of the dollar amounts of plan net assets, actuarial accrued liability, and unfunded actuarial accrued liability in isolation can be misleading. Expressing plan net assets as a percentage of the actuarial accrued liability provides one indication of the System’s funding status. Analysis of this percentage over time indicates whether the system is becoming financially stronger or weaker. Generally, the greater this percentage, the stronger the system.
Trends in the unfunded actuarial accrued liability and annual covered payroll are both affected by inflation. Expressing the unfunded actuarial accrued liability as a percentage of annual covered payroll approximately adjusts for the effects of inflation and aids in the analysis of the System’s progress made in accumulating sufficient assets to pay benefits when due. Generally, the smaller the percentage, the stronger the system.
The following Schedule of Funding Progress, presented as RSI, shows multiyear trend information which illustrates whether the actuarial value of plan assets are increasing or decreasing over time relative to the actuarial accrued liability for benefits. As addressed previously and as noted on the Schedule of Funding Progress, ERFC has transitioned to calendar year valuations. The most recent valuation was effective December 31, 2012. This transition to calendar year valuation was done in order to provide a more current contribution rate which could be included in the school system’s Superintendent’s proposed budget and to provide more accurate information to the actuary for the annual valuation.

Educ ational EmployEEs’ supplEmEntary rEtirEmEnt systEm of fairfa x count y
Required Supplementary Information(Unaudited)
0.0
0.5
1.0
1.5
2.0
2.5
3.0
201220112010200920082007
Accrued Liabilities
Actuarial Assets
CALENDAR YEAR
$ in
Bill
ions
ERFC FUNDING PROGRESS
SCHEDULE OF FUNDING PROGRESS ($ in thousands)
Actuarial [Excess of Assets]
Actuarial Accrued [Excess of Assets] UAAL as a Actuarial Value Liability (AAL) Unfunded Funded Covered Percentage ofValuation of Assets -Entry Age AAL (UAAL) Ratio Payroll Covered PayrollDate (a) (b) (b-a) (a/b) (c) ((b-a)/c)
12/31/07 $ 1,924,886 $ 2,186,801 $ 261,915 88.02% $ 1,161,432 22.55%
12/31/08 $ 1,733,946 $ 2,255,298 $ 521,352 76.88% $ 1,211,140 43.05%
12/31/09 $ 1,769,540 $ 2,339,869 $ 570,329 75.62% $ 1,208,093 47.21%
12/31/10 $ 1,822,603 $ 2,384,061 $ 561,458 76.45% $ 1,191,290 47.13%
12/31/11 $ 1,866,952 $ 2,470,964 $ 604,012 75.56% $ 1,246,973 48.44%
12/31/12 $ 1,935,292 $ 2,566,128 $ 630,836 75.42% $ 1,297,537 48.62%
29 FINANCIAL SECTION
FIN
AN
CIA
L

FINANCIAL SECTION 30
Educ ational EmployEEs’ supplEmEntary rEtirEmEnt systEm of fairfa x count y
Notes to the Schedules of Required Supplementary Information
(Unaudited)
SUMMARY OF ACTUARIAL METHODS AND ASSUMPTIONS
The information presented in the required supplementary schedules was determined as part of the actuarial valuation at the date indicated. Additional information as of the latest actuarial valuation is as follows:
Valuation date December 31, 2012 Actuarial cost method Entry age Amortization method Level percent of payroll Remaining amortization period 26 years Asset valuation method 5-year smoothed market which recognizes asset values should be between 75% and 125% of the market value Actuarial assumptions: Investment rate of return 7.5%* Projected active member salary increases 3.75–9.05%* Retiree cost-of-living adjustments 3% * Includes inflation at 3.75%
Reserves There are no legally required actuarial or investment reserves for the pension system nor are there any incorporated. However, there is a budgetary reserve of $3 million. This is a budget line item that is subject to the annual review and recommendation of the Board of Trustees and approval by the School Board.
FIN
AN
CIA
L
31 FINANCIAL SECTION
Educ ational EmployEEs’ supplEmEntary rEtirEmEnt systEm of fairfa x count y
Notes to the Schedules of Required Supplementary Information
(Unaudited)
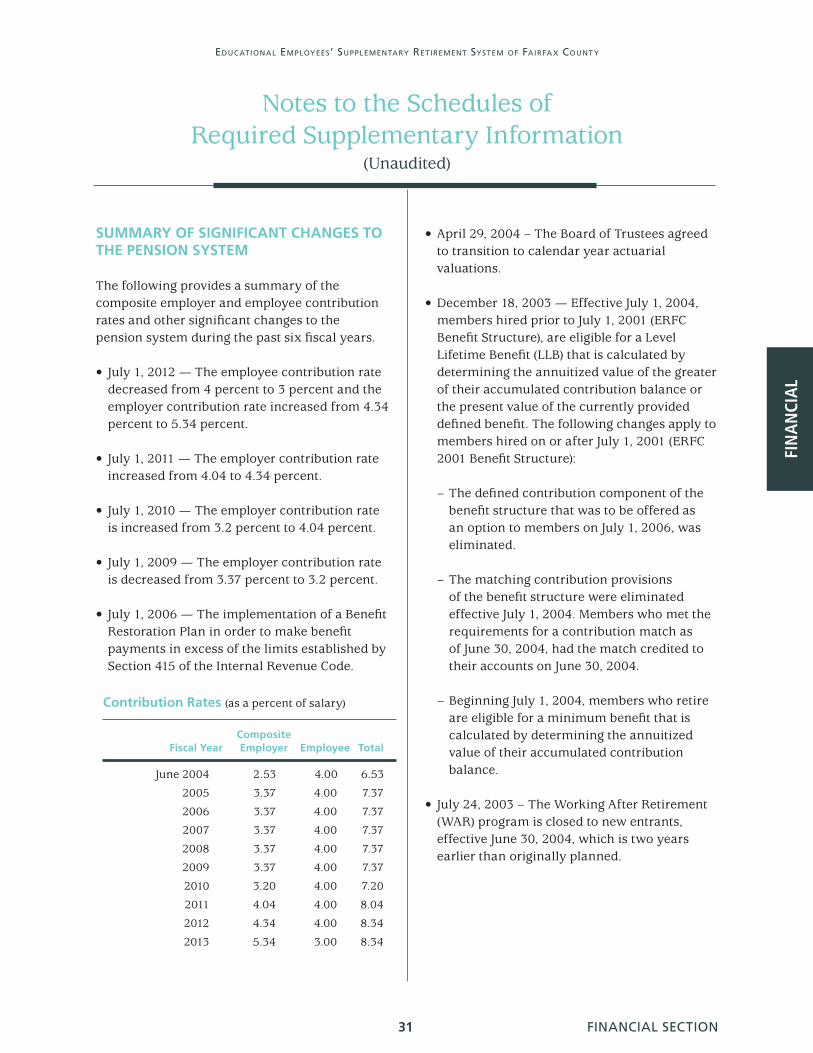
• April 29, 2004 – The Board of Trustees agreed to transition to calendar year actuarial valuations.
• December 18, 2003 — Effective July 1, 2004, members hired prior to July 1, 2001 (ERFC Benefit Structure), are eligible for a Level Lifetime Benefit (LLB) that is calculated by determining the annuitized value of the greater of their accumulated contribution balance or the present value of the currently provided defined benefit. The following changes apply to members hired on or after July 1, 2001 (ERFC 2001 Benefit Structure):
– The defined contribution component of the benefit structure that was to be offered as an option to members on July 1, 2006, was eliminated.
– The matching contribution provisions of the benefit structure were eliminated effective July 1, 2004. Members who met the requirements for a contribution match as of June 30, 2004, had the match credited to their accounts on June 30, 2004.
– Beginning July 1, 2004, members who retire are eligible for a minimum benefit that is calculated by determining the annuitized value of their accumulated contribution balance.
• July 24, 2003 – The Working After Retirement (WAR) program is closed to new entrants, effective June 30, 2004, which is two years earlier than originally planned.
SUMMARY OF SIGNIFICANT CHANGES TO THE PENSION SYSTEM
The following provides a summary of the composite employer and employee contribution rates and other significant changes to the pension system during the past six fiscal years.
• July 1, 2012 — The employee contribution rate decreased from 4 percent to 3 percent and the employer contribution rate increased from 4.34 percent to 5.34 percent.
• July 1, 2011 — The employer contribution rate increased from 4.04 to 4.34 percent.
• July 1, 2010 — The employer contribution rate is increased from 3.2 percent to 4.04 percent.
• July 1, 2009 — The employer contribution rate is decreased from 3.37 percent to 3.2 percent.
• July 1, 2006 — The implementation of a Benefit Restoration Plan in order to make benefit payments in excess of the limits established by Section 415 of the Internal Revenue Code.
Contribution Rates (as a percent of salary)
Composite Fiscal Year Employer Employee Total
June 2004 2.53 4.00 6.53
2005 3.37 4.00 7.37
2006 3.37 4.00 7.37
2007 3.37 4.00 7.37
2008 3.37 4.00 7.37
2009 3.37 4.00 7.37
2010 3.20 4.00 7.20
2011 4.04 4.00 8.04
2012 4.34 4.00 8.34
2013 5.34 3.00 8.34

FINANCIAL SECTION 32
Educ ational EmployEEs’ supplEmEntary rEtirEmEnt systEm of fairfa x count y
Other Supplementary Information
SCHEDULE OF ADMINISTRATIVE EXPENSES (Year Ended June 30, 2013)
Personnel services
Salaries and wages $ 1,818,008 Retirement contributions 393,167 Insurance 277,182 Social security 148,026
Total personnel services 2,636,383
Professional services
Actuarial 137,980 Legal 61,731 Payroll disbursement 42,088 Plan automation support 16,200 Strategic planning 17,121 Audit 47,940
Total professional services 323,060
Communications
Printing 30,287 Postage 36,098
Total communications 66,385
Supplies
Office supplies 10,695 Dues and subscriptions 8,635
Total supplies 19,330
Other services and charges
Board travel and staff development 45,625 Equipment 232,279 Building rent 248,931 Depreciation expense and asset disposal 3,984 Miscellaneous 12,437
Total other services and charges 543,256
Total administrative expenses $ 3,588,414

Educ ational EmployEEs’ supplEmEntary rEtirEmEnt systEm of fairfa x count y
Other Supplementary Information
SCHEDULE OF INVESTMENT EXPENSES (Year Ended June 30, 2013)
Investment management fees
Fixed income managers Loomis-Sayles and Company, L.P. $ 494,085 Mellon Capital Management Corporation 21,930 Mondrian Investment Partners (US), Inc. 400,062 Pacific Investment Management Company 495,706
Equity managers Aronson Johnson Ortiz, LLC 157,596 Epoch Investment Partners, Inc. 424,366 Lazard Asset Management 309,756 Mellon Capital Management Corporation 23,453 Westfield Capital Management 320,650
International managers Acadian Asset Management, Inc. 583,835 AllianceBernstein L.P. 327,785 Causeway Capital Management, LLC 218,265 William Blair & Company 833,273
Real Estate managers J.P. Morgan Asset Management 313,906 Prudential Financial 186,812 UBS Realty Investors, LLC 293,292 CenterSquare Investment Management (formerly Urdang) 501,714
Global Asset Allocation managers Pacific Investment Management Company 822,345 Wellington Management Company LLP 1,011,342
Better Beta Bridgewater Associates 491,033
Hedge fund of funds Grosvenor Capital Management, L.P. 734,118 Permal Investment Management Services. Ltd. 696,511
Private equity Audax Mezzanine Fund III, L.P. 78,044 HarbourVest Partners, LLC Buyout 80,092 HarbourVest Partners, LLC Credit 49,275 HarbourVest Partners, LLC Venture 82,955 Lexington Capital Partners VII 88,082 Newstone Capital Partners, LLC 80,972 Permal Private Equity Opportunities IV, L.P. 62,500 Private Advisors, LLC 93,750
Total investment management fees 10,277,505
Other investment service fees
Custodial fees - Mellon Trust 190,485 Investment consultant fees—New England Pension Consulting, Inc. 390,156 Monitor managers’ trading processes—Zeno Consulting Group 12,500 Foreign tax consulting—Pricewaterhouse Coopers 3,182 Investment salaries 232,927
Total other investment service fees 829,250
Total investment expenses $ 11,106,755
33 FINANCIAL SECTION
FIN
AN
CIA
L

FINANCIAL SECTION 34
SCHEDULE OF PROFESSIONAL SERVICE FEES (Year Ended June 30, 2013)
Service Provider Nature of Service Amount
Gabriel, Roeder, Smith & Company Actuary $ 137,980
Levi, Ray & Shoup, Inc. Plan automation support $ 16,200
Bredhoff & Kaiser, P.L.L.C. Legal counsel $ 54,150
Groom Law Group, Chartered Legal counsel $ 5,601
ADP payroll services Pension disbursement $ 42,088
KPMG, LLP Audit $ 47,940
Other various legal fees Legal $ 1,980
Various Miscellaneous $ 17,121
Total professional service fees $ 323,060
Educ ational EmployEEs’ supplEmEntary rEtirEmEnt systEm of fairfa x count y
Other Supplementary Information

INVE
STM
ENT
New text to come
Investment Section(Unaudited)
Consultant Report on Investment Activity
Strategic Review and Investment Policy
Investment Managers
Asset Structure
Investment Results
Ten Largest Equity and Fixed Income Holdings
Brokerage Commissions
Investment Summary
Investment Management Fees
INVE
STM
ENT

October 28, 2013
The Board of Trustees The Educational Employees' Supplementary Retirement System of Fairfax County 8001 Forbes Place, Suite 300 Springfield, Virginia 22151
Dear Board Members:
This letter summarizes the structure and performance of the Educational Employees’ Supplementary Retirement System of Fairfax County (ERFC) Fund through the Fiscal Year Ending June 30, 2013.
As of the June 30th fiscal year-end, the Fund was in compliance with policy ranges, and had 41.4 percent in equities, 7.8 percent in real estate equity, 27.3 percent in bonds, 8.0 percent in hedge fund strategies, 1.3 percent in private equity, 14.1 percent in global asset allocation/better beta strategies, and 0.1 percent in cash. Over the past year, the Fund has maintained public equity levels lower than the median equity allocation when measured against public fund peers in the InvestorForce Public Defined Benefit Universe.
The Fund earned 11.2%1 in the year ending June 30, 2013, which ranked in the 63rd
percentile of all public funds within the InvestorForce Universe. Over the last 12 months ending June 30, 2013, ERFC outperformed its assumed actuarial return target of 7.5% by 3.7%. Assets increased from $1.83 billion at the end of fiscal 2012 to approximately $1.96 billion as of June 30, 20132.
Market Commentary
The 2013 Fiscal year posted surprisingly strong returns for investors seeking risk even amidst a myriad of macroeconomic concerns. The year ending June 30th was largely dominated by headline risks related to the European debt crisis, the fiscal cliff, reports of slowed economic growth in China and emerging markets and the potential wind down of the Fed’s quantitative easing program.
In the second half of 2012, domestic equities benefited from improved fundamentals and a more robust housing market, which resulted in gains even amidst the uncertainties surrounding the presidential election and the fiscal cliff. International equity markets, buoyed by positive news flow within the Euro zone and stronger economic data from China, outperformed their domestic counterparts. In the first quarter of 2013, the Fed continued to 1 Return data for the Fund was reconciled from manager provided time-weighted returns that were calculated in accordance with the CFA Institute’s Global Investment Performance Standards (GIPS).®Valuations, where available, are based on published national securities exchange prices, as provided by ERFC’s custodian, BNY Mellon. 2 The fund assets presented in the investment section are reported at fair value.
INVESTMENT SECTION 36
Educ ational EmployEEs’ supplEmEntary rEtirEmEnt systEm of fairfa x count y
Consultant Report on Investment Activity

INVE
STM
ENT
drive equity markets with stimulative policy as market volatility was suppressed and markets shrugged off worries of fiscal tightening. Global equities surged, with domestic equities posting the strongest quarter for equity returns over the fiscal year. The final quarter of the fiscal year proved to be a challenging environment in which virtually all markets were down, leaving investors no place to run for cover. Treasury yields spiked on expectations of Fed tapering and continued to rise through June. As a result of the sharp rise in rates, investors saw long duration fixed income assets struggle.
The quarter ended September 30th, 2012 marked a rebound across most asset classes. Second quarter losses were reversed by news of “unlimited support” from the Fed and ECB. The primary take-away from the third quarter of 2012 is that central banks still possess the strength to move markets, but with each move their capacity for future intervention weakens. The S&P 500 produced a +6.4% return for the quarter, while the MSCI Europe, Australia, Far East (EAFE) rose +6.9% and the MSCI Emerging Markets index rose +7.7%. In fixed income, investors ratcheted up risk on the heels of monetary easing by central banks in the U.S. and Europe. In line with investors’ demand for yield, emerging markets debt and US high yield rallied. The clamor for risk and higher returns took the shine off safer but lower yielding assets such as Treasuries. The Barclays Capital Aggregate Bond Index posted a return of +1.6% for the quarter.
The quarter ended December 31, 2012 saw mixed results amid uncertainties around the presidential election and the resolution of the fiscal cliff. These macroeconomic issues took a bite out of domestic equity returns as they could not continue the strong performance of the past quarter. To this end, the S&P 500 recorded a -0.4% return for the quarter. However, international equity markets benefited from positive news flows from Europe, Japanese export-driven stocks, and stronger economic data from China and outperformed both domestic and emerging market equities. International stocks, as measured by the MSCI EAFE index, returned +6.6% during the period while emerging market stocks posted a +5.6% gain as measured by the MSCI EM index. Even as massive government stimulus poured into Treasuries, the yield curve shifted upwards in the quarter, retreating from all-time lows. The Barclays Capital Aggregate Bond Index returned +0.2% while the Barclays High Yield index and the JPM GBI-EM GD (unhedged) index returned +3.3% and +4.1, respectively.
U.S. stocks started 2013 with a bang, posting double digit returns across all market capitalizations. Small-caps led the way returning +12.4% as measured by the Russell Small Cap Index, followed by a large cap return of +10.6% as measured by the S&P 500 index. These strong returns were driven by improvements in residential real estate and consumer sentiment domestically. During the quarter, a strong U.S. dollar proved to be a headwind to international markets as international equities lagged with modest returns of +5.1%, according to the MSCI EAFE index. Investor’s quest for yield again drove performance for fixed income in the first quarter. Depressed yields for investment grade bonds pushed investors into riskier segments of the market. As a result, the Barclays Aggregate Bond Index returned -0.1%. The below investment grade segment of the bond market continued to outperform in the first quarter. The Barclays High Yield index returned +2.9% with low quality issues outperforming high quality paper.
After a strong first quarter across most asset classes, markets were roiled in the second quarter by indications the Fed would taper its stimulative policy earlier than expected and concerns of slowed growth in China and emerging markets. The higher
INVE
STM
ENT
37 INVESTMENT SECTION
Educ ational EmployEEs’ supplEmEntary rEtirEmEnt systEm of fairfa x count y
Consultant Report on Investment Activity

volatility environment in late May and June proved to be difficult for almost all asset classes as virtually all markets were negative, leaving investors no place to hide. Domestic and international equities began the quarter strong but then sold off as anticipation of earlier tapering by the Fed set in and a dramatic spike in rates took place. The S&P 500 index returned +2.9% and the MSCI EAFE index returned -1.0%, for the quarter. Investors also experienced a pronounced sell-off in emerging markets as a rise in rates and political turmoil in Brazil and Turkey drove down returns. The MSCI EM was the worst performing equity index as it posted a -8.1% return for the quarter. Over the same period, nearly all global fixed income sectors posted negative returns. The search for yield morphed into a quest for liquidity as longer-duration corporates and emerging markets debt dropped dramatically. The Barclays Aggregate index, which tracks U.S. investment grade fixed income, lost 2.3% in the quarter. Non-investment grade debt struggled as well with the Barclays High Yield index losing 1.4%.
Fiscal year 2013 was a productive time period for the fund with a few important changes to the portfolio. Due to performance concerns, the Plan divested from Alliance Bernstein and hired Causeway as a replacement to manage the international value equity assets. The fund continued to build out the private equity portfolio which grew from a market value of approximately $15 million in June 2012 to $24 million as of June 2013. In May, the Board voted to commit $10 million to Private Advisors SCBO Fund V. In addition the Board approved an updated Investment Policy Statement. The portfolio is well positioned and diversified across asset classes and remains in compliance with policy targets.
Sincerely,
Douglas Moseley, Partner Keith Stronkowsky, CFA, Consultant
Educ ational EmployEEs’ supplEmEntary rEtirEmEnt systEm of fairfa x count y
INVESTMENT SECTION 38
Educ ational EmployEEs’ supplEmEntary rEtirEmEnt systEm of fairfa x count y
Consultant Report on Investment Activity

Educ ational EmployEEs’ supplEmEntary rEtirEmEnt systEm of fairfa x count y
Strategic Review and Investment Policy
39 INVESTMENT SECTION
INVE
STM
ENT
0.0
0.5
1.0
1.5
2.0
$ in
bill
ions
'12'11'10'09'04'99'94'89'83'78'73Fiscal Year Calendar Year
ERFC TOTAL FUND GROWTH — VALUATION ASSETS SINCE INCEPTION(As refl ected in the December 31, 2012 actuarial valuation)
Introduction
The members of the ERFC Board of Trustees have jurisdiction over and ultimate fi duciary responsibility for the investment of the System’s assets. In carrying out their responsibilities, they must adhere to applicable laws, regulations, and rulings with respect to the duties of investment fi duciaries. Accordingly, they are required to “discharge their duties in the interest of plan participants” and “act with the same care, skill, prudence, and diligence under the circumstances then prevailing that a prudent person acting in a similar capacity and familiar with those matters would use in the conduct of a similar enterprise with similar aims.” The Board of Trustees has established a Statement of Investment Policy that identifi es a set of investment objectives, guidelines, and performance standards for the assets of the fund. The objectives are formulated in response to the following:
• the anticipated fi nancial needs of the ERFC
• consideration of risk tolerance; and
• the need to document and communicate objectives, guidelines and standards to the investment managers.
Investment Objectives
The investment objective of the ERFC is to ensure, over the long-term life of the fund, an adequate level of assets to fund the benefi ts for ERFC members and their benefi ciaries at the time they are payable. The Trustees seek to achieve a high level of total investment return consistent with a prudent level of portfolio risk. The fund’s actuary uses an investment return assumption of 7.5 percent, compounded annually, of which 3.75 percent constitutes an assumed rate of infl ation and 3.75 percent refl ects an assumed real rate of return on investments. The fund’s objective is to meet or exceed the assumed real rate of return over time, while preserving the fund’s principal.

INVESTMENT SECTION 40
Educ ational EmployEEs’ supplEmEntary rEtirEmEnt systEm of fairfa x count y
Investment Managers
ASSETS UNDER MANAGEMENTAs of June 30, 2013 ($ in millions)
Investment Manager Investment Type Amount
Equities Large Capitalization
Aronson Johnson Ortiz Value $ 121.9Mellon Capital Management Corp. Core Index (Russell 1000) 106.7Turner Investment Partners Growth 100.9
Small/Mid CapitalizationEpoch Investment Partners, Inc. Value 46.9 Lazard Asset Management Core 46.0Westfield Capital Management Growth 43.1
InternationalAcadian Asset Management Core 111.8AllianceBernstein L.P. Value 0.1Causeway Capital Value 88.4William Blair & Company Growth 84.6William Blair & Company Emerging Market 59.7
Fixed Income Loomis-Sayles & Company Core Plus 159.4Mellon Capital Management Corp. Core Index 114.9 Pacific Investment Management Co. Core Plus 208.0Mondrian Investments Emerging Market 53.5
Global Asset Allocation/Better BetaBridgewater Associates, Inc. Better Beta 90.6Wellington Management Co. Global Asset Allocation 95.7Pacific Investment Management Co. Global Asset Allocation 90.3
Hedge fund of fundsGrosvenor Institutional Partners, L.P. Hedge Fund of Funds 77.6Permal Group of Funds Hedge Fund of Funds 79.3
Private Equity Audax Mezzanine Fund III, L.P. Private 3.0Lexington Capital Partners VII, L.P. Private 6.3Newstone Capital Partners II, L.P. Private 3.1Permal Private Equity Opportunities IV, L.P. Private 2.6Private Advisors, LLC Private 5.2HarbourVest Private 5.0
Real Estate JP Morgan Asset Management Private 21.6Prudential Financial Private 21.1UBS Realty Investors, LLC Private 27.6Center Square Investment Management Public 81.7
Cash (temporary cash) 1.8
Total $ 1,958.4
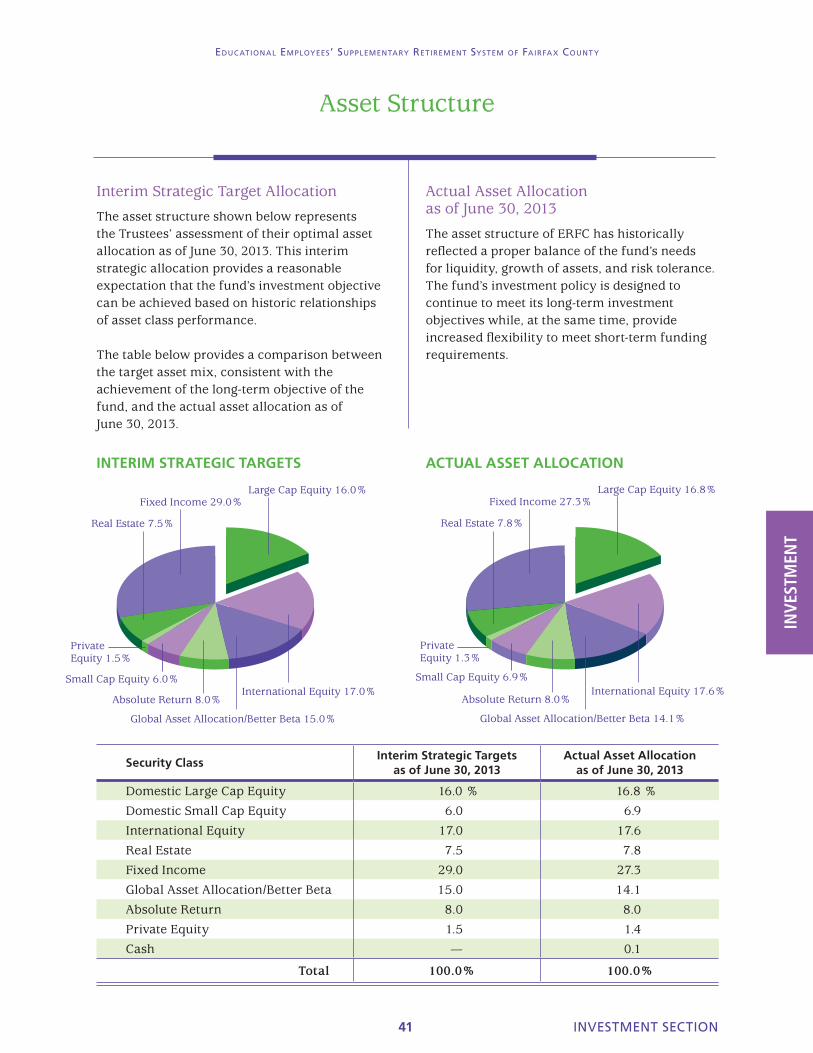
Educ ational EmployEEs’ supplEmEntary rEtirEmEnt systEm of fairfa x count y
Asset Structure
41 INVESTMENT SECTION
INVE
STM
ENT
Large Cap Equity 16.0%
Private Equity 1.5%
Small Cap Equity 6.0%
Absolute Return 8.0%International Equity 17.0%
Global Asset Allocation/Better Beta 15.0%
Real Estate 7.5%
Fixed Income 29.0%Large Cap Equity 16.8%
Private Equity 1.3%
Small Cap Equity 6.9%
Absolute Return 8.0%International Equity 17.6%
Global Asset Allocation/Better Beta 14.1%
Real Estate 7.8%
Fixed Income 27.3%
Security ClassInterim Strategic Targets
as of June 30, 2013Actual Asset Allocation
as of June 30, 2013
Domestic Large Cap Equity 16.0 % 16.8 %
Domestic Small Cap Equity 6.0 6.9
International Equity 17.0 17.6
Real Estate 7.5 7.8
Fixed Income 29.0 27.3
Global Asset Allocation/Better Beta 15.0 14.1
Absolute Return 8.0 8.0
Private Equity 1.5 1.4
Cash — 0.1
Total 100.0% 100.0%
Interim Strategic Target Allocation
The asset structure shown below represents the Trustees’ assessment of their optimal asset allocation as of June 30, 2013. This interim strategic allocation provides a reasonable expectation that the fund’s investment objective can be achieved based on historic relationships of asset class performance.
The table below provides a comparison between the target asset mix, consistent with the achievement of the long-term objective of the fund, and the actual asset allocation as of June 30, 2013.
Actual Asset Allocation as of June 30, 2013
The asset structure of ERFC has historically reflected a proper balance of the fund’s needs for liquidity, growth of assets, and risk tolerance. The fund’s investment policy is designed to continue to meet its long-term investment objectives while, at the same time, provide increased flexibility to meet short-term funding requirements.
INTERIM STRATEGIC TARGETS ACTUAL ASSET ALLOCATION
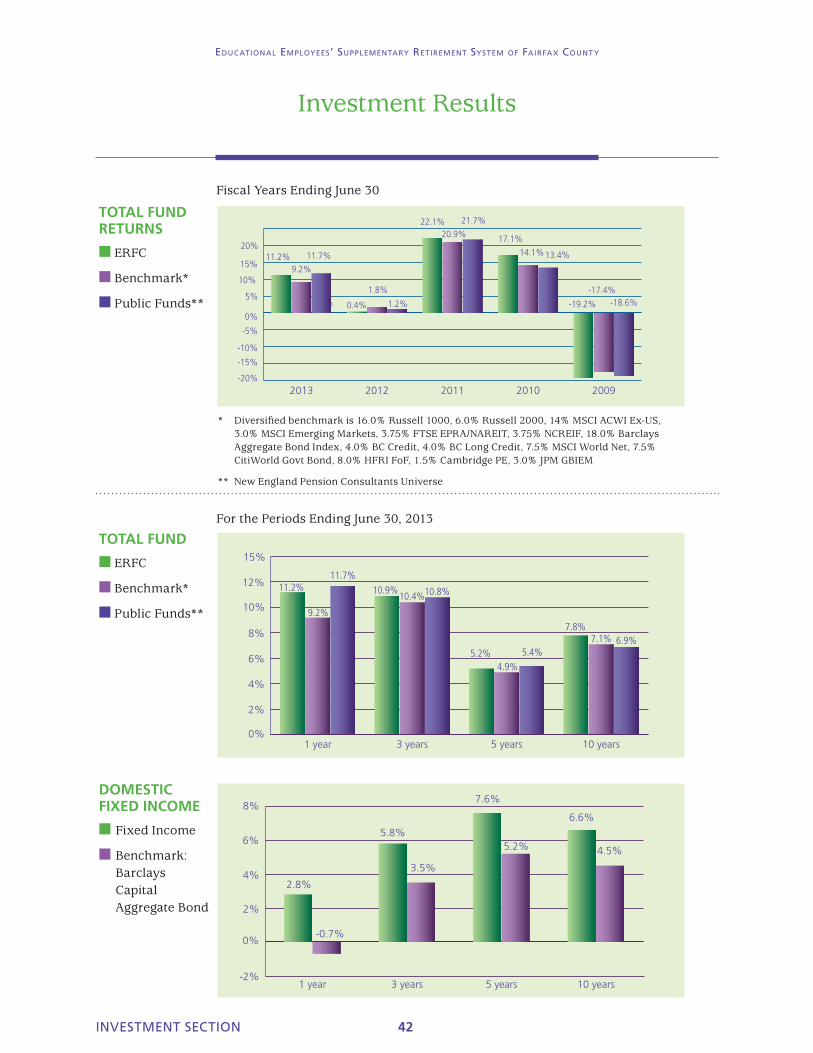
TOTAL FUND RETURNS
n ERFC
n Benchmark*
n Public Funds**
TOTAL FUND
n ERFC
n Benchmark*
n Public Funds**
DOMESTIC FIXED INCOME
n Fixed Income
n Benchmark: Barclays Capital Aggregate Bond
-20%
-15%
-10%
-5%
0%
5%
10%
15%
20%
25%
Public Funds
Benchmark
ERFC
20092010201120122013
22.1% 21.7%
17.1%
14.1% 13.4%
20.9%
-19.2% -18.6%-17.4%
11.2% 11.7%
9.2%
0.4% 1.2%
1.8%
0%
2%
4%
6%
8%
10%
12%Public Funds
Benchmark
ERFC
10 years5 years3 years1 year
10.9%10.4%10.8%11.2%
9.2%
11.7%
5.2%4.9%
5.4%
7.8%7.1% 6.9%
15%
* Diversified benchmark is 16.0% Russell 1000, 6.0% Russell 2000, 14% MSCI ACWI Ex-US, 3.0% MSCI Emerging Markets, 3.75% FTSE EPRA/NAREIT, 3.75% NCREIF, 18.0% Barclays Aggregate Bond Index, 4.0% BC Credit, 4.0% BC Long Credit, 7.5% MSCI World Net, 7.5% CitiWorld Govt Bond, 8.0% HFRI FoF, 1.5% Cambridge PE, 3.0% JPM GBIEM
** New England Pension Consultants Universe
-2%
0%
2%
3.5%4%
-0.7%
6%
2.8%
8%
5.8%
Benchmark
ERFC
10 years5 years3 years1 year
5.2%
7.6%
6.6%
4.5%
For the Periods Ending June 30, 2013
Fiscal Years Ending June 30
INVESTMENT SECTION 42
Educ ational EmployEEs’ supplEmEntary rEtirEmEnt systEm of fairfa x count y
Investment Results
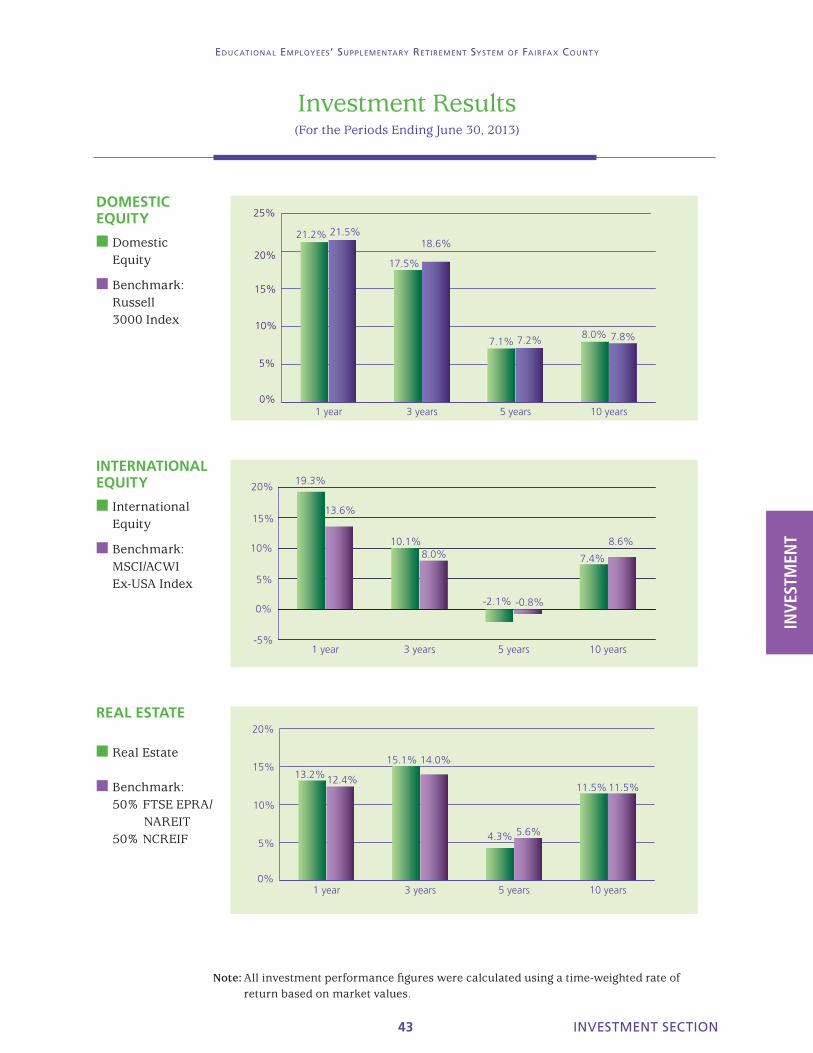
Educ ational EmployEEs’ supplEmEntary rEtirEmEnt systEm of fairfa x count y
Investment Results(For the Periods Ending June 30, 2013)
43 INVESTMENT SECTION
INVE
STM
ENT
Note: All investment performance figures were calculated using a time-weighted rate of return based on market values.
DOMESTIC EQUITY
n Domestic Equity
n Benchmark: Russell 3000 Index
0%
5%
10%
15%
20% Benchmark
ERFC
10 years5 years3 years1 year
21.2% 21.5%
17.5%
18.6%
7.1% 7.2% 8.0% 7.8%
25%
INTERNATIONAL EQUITY
n International Equity
n Benchmark: MSCI/ACWI Ex-USA Index
-5%
0%
5%
10%
15%
20%
Benchmark
ERFC
10 years5 years3 years1 year
20%19.3%
10.1%
13.6%
8.0%
-2.1% -0.8%
8.6%
7.4%
REAL ESTATE
n Real Estate
n Benchmark: 50% FTSE EPRA/ NAREIT 50% NCREIF
0%
5%
10%
15%
20%
10 years5 years3 years1 year
13.2% 12.4%
15.1% 14.0%
4.3% 5.6%
11.5% 11.5%

INVESTMENT SECTION 44
Educ ational EmployEEs’ supplEmEntary rEtirEmEnt systEm of fairfa x count y
Investment Results(For the Periods Ending June 30, 2013)
GLOBAL ASSET ALLOCATION
n GAA
n Benchmark: 50% MSCI World / 50% Citi World Govt Bond Index
HEDGE FUND
n Hedge Fund of Funds
n Benchmark: HFRI Fund of Funds Composite Index
0%
2%
4%
6%
8%
10%
10 years5 years3 years1 year
3.3%
5.0%
8.4%8.9%
6.5%
5.0%
12%
10%
-2%
0%
2%
4%
6%
8%
10 years5 years3 years1 year
14%
12.1%
7.4%
5.9%
3.0%3.5%
-0.6%

INVE
STM
ENT
45 INVESTMENT SECTION
Educ ational EmployEEs’ supplEmEntary rEtirEmEnt systEm of fairfa x count y
Schedules of Ten Largest Equity & Fixed Income Holdings
(As of June 30, 2013)
INVE
STM
ENT
TEN LARGEST EQUITY HOLDINGS*
No. Shares Description Cost Fair Value % of Total Portfolio
76,000 EXXON MOBIL CORP $ 6,184,994 $ 6,866,600 0.35%
17,040 APPLE INC $ 3,680,017 $ 6,756,871 0.35%
19,378 ROCHE HLDG AG GENUSSCHEINE NPV $ 3,954,969 $ 4,813,011 0.25%
150,378 ROYAL DUTCH SHELL PLC $ 4,866,955 $ 4,794,926 0.25%
5,000 GOOGLE INC $ 3,038,845 $ 4,401,850 0.23%
81,200 JPMORGAN CHASE & CO $ 3,277,189 $ 4,286,548 0.22%
81,880 CITIGROUP INC $ 3,180,336 $ 3,927,784 0.20%
68,423 BNP PARIBAS EUR2 $ 4,142,566 $ 3,733,241 0.19%
146,080 CISCO SYSTEMS INC $ 3,038,570 $ 3,554,857 0.18%
40,600 JOHNSON & JOHNSON $ 3,464,999 $ 3,485,916 0.18%
TOTAL $ 38,829,440 $ 46,621,604 2.38%
TEN LARGEST FIXED INCOME HOLDINGS*
Par Value Security Coupon Maturity Cost Fair Value% of Total Portfolio
5,505,000 INTER-AMERICAN DEVELOPMENT BANK 6.000% 12/15/2017 $ 3,779,204 $ 4,565,583 0.23%
5,500,000 INTERNATIONAL BANK FOR RECONST 1.430% 03/05/2014 $ 3,581,312 $ 4,362,008 0.22%
3,115,000 GEORGIA-PACIFIC LLC 7.750% 11/15/2029 $ 2,766,891 $ 4,016,481 0.21%
3,355,000 NEW SOUTH WALES TREASURY CORP 6.000% 02/01/2018 $ 3,785,333 $ 3,389,173 0.17%
2,795,000 OLD REPUBLIC INTERNATIONAL CORP 3.750% 03/15/2018 $ 2,743,203 $ 3,144,375 0.16%
3,495,000 U S TREASURY BOND 2.875% 05/15/2043 $ 3,220,516 $ 3,093,075 0.16%
3,120,000 U S TREASURY BOND 2.750% 11/15/2042 $ 2,789,963 $ 2,690,033 0.14%
2,534,337 TRINITY RAIL LEASING 1A A 144A 5.194% 10/16/2040 $ 2,534,337 $ 2,587,862 0.13%
2,190,000 INTEL CORP 2.950% 12/15/2035 $ 2,161,153 $ 2,383,005 0.12%
2,425,000 SPRINGLEAF FINANCE CORP 6.900% 12/15/2017 $ 2,369,453 $ 2,379,531 0.12%
TOTAL $ 29,731,365 $ 32,611,126 1.67%
* A detailed list of the portfolio’s equity and fixed income holdings are available upon request.
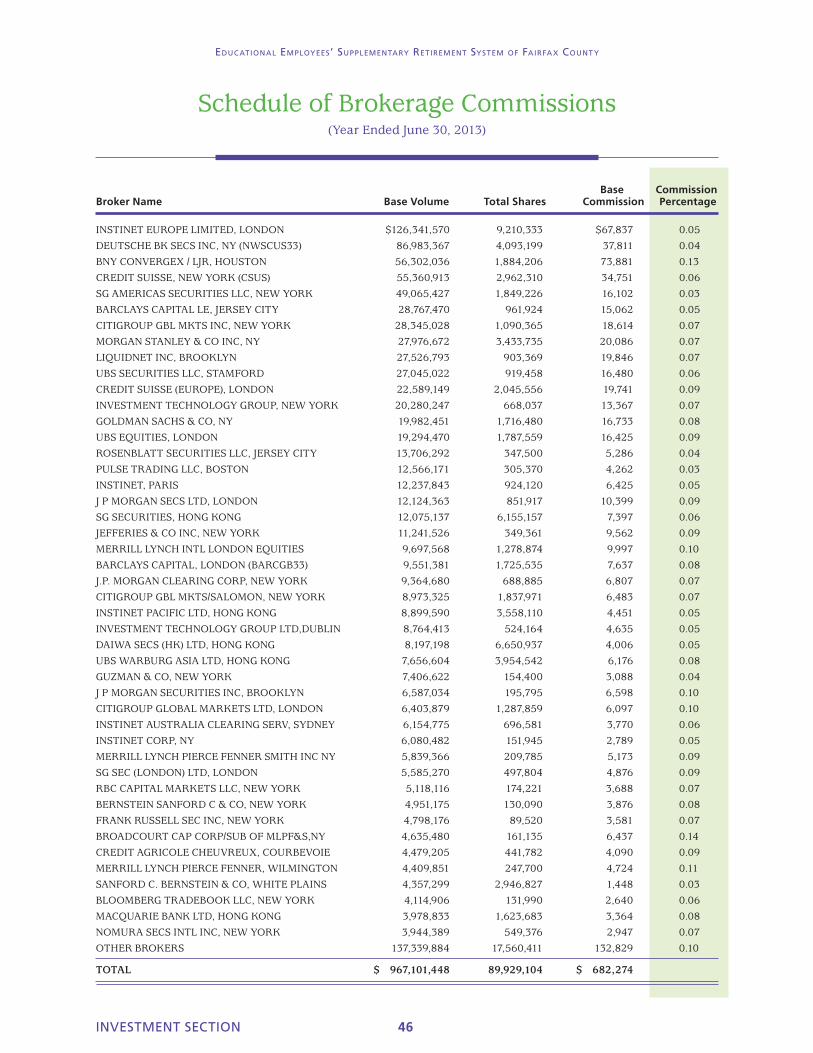
INVESTMENT SECTION 46
Educ ational EmployEEs’ supplEmEntary rEtirEmEnt systEm of fairfa x count y
Schedule of Brokerage Commissions(Year Ended June 30, 2013)
Base Commission Broker Name Base Volume Total Shares Commission Percentage
INSTINET EUROPE LIMITED, LONDON $126,341,570 9,210,333 $67,837 0.05
DEUTSCHE BK SECS INC, NY (NWSCUS33) 86,983,367 4,093,199 37,811 0.04
BNY CONVERGEX / LJR, HOUSTON 56,302,036 1,884,206 73,881 0.13
CREDIT SUISSE, NEW YORK (CSUS) 55,360,913 2,962,310 34,751 0.06
SG AMERICAS SECURITIES LLC, NEW YORK 49,065,427 1,849,226 16,102 0.03
BARCLAYS CAPITAL LE, JERSEY CITY 28,767,470 961,924 15,062 0.05
CITIGROUP GBL MKTS INC, NEW YORK 28,345,028 1,090,365 18,614 0.07
MORGAN STANLEY & CO INC, NY 27,976,672 3,433,735 20,086 0.07
LIQUIDNET INC, BROOKLYN 27,526,793 903,369 19,846 0.07
UBS SECURITIES LLC, STAMFORD 27,045,022 919,458 16,480 0.06
CREDIT SUISSE (EUROPE), LONDON 22,589,149 2,045,556 19,741 0.09
INVESTMENT TECHNOLOGY GROUP, NEW YORK 20,280,247 668,037 13,367 0.07
GOLDMAN SACHS & CO, NY 19,982,451 1,716,480 16,733 0.08
UBS EQUITIES, LONDON 19,294,470 1,787,559 16,425 0.09
ROSENBLATT SECURITIES LLC, JERSEY CITY 13,706,292 347,500 5,286 0.04
PULSE TRADING LLC, BOSTON 12,566,171 305,370 4,262 0.03
INSTINET, PARIS 12,237,843 924,120 6,425 0.05
J P MORGAN SECS LTD, LONDON 12,124,363 851,917 10,399 0.09
SG SECURITIES, HONG KONG 12,075,137 6,155,157 7,397 0.06
JEFFERIES & CO INC, NEW YORK 11,241,526 349,361 9,562 0.09
MERRILL LYNCH INTL LONDON EQUITIES 9,697,568 1,278,874 9,997 0.10
BARCLAYS CAPITAL, LONDON (BARCGB33) 9,551,381 1,725,535 7,637 0.08
J.P. MORGAN CLEARING CORP, NEW YORK 9,364,680 688,885 6,807 0.07
CITIGROUP GBL MKTS/SALOMON, NEW YORK 8,973,325 1,837,971 6,483 0.07
INSTINET PACIFIC LTD, HONG KONG 8,899,590 3,558,110 4,451 0.05
INVESTMENT TECHNOLOGY GROUP LTD,DUBLIN 8,764,413 524,164 4,635 0.05
DAIWA SECS (HK) LTD, HONG KONG 8,197,198 6,650,937 4,006 0.05
UBS WARBURG ASIA LTD, HONG KONG 7,656,604 3,954,542 6,176 0.08
GUZMAN & CO, NEW YORK 7,406,622 154,400 3,088 0.04
J P MORGAN SECURITIES INC, BROOKLYN 6,587,034 195,795 6,598 0.10
CITIGROUP GLOBAL MARKETS LTD, LONDON 6,403,879 1,287,859 6,097 0.10
INSTINET AUSTRALIA CLEARING SERV, SYDNEY 6,154,775 696,581 3,770 0.06
INSTINET CORP, NY 6,080,482 151,945 2,789 0.05
MERRILL LYNCH PIERCE FENNER SMITH INC NY 5,839,366 209,785 5,173 0.09
SG SEC (LONDON) LTD, LONDON 5,585,270 497,804 4,876 0.09
RBC CAPITAL MARKETS LLC, NEW YORK 5,118,116 174,221 3,688 0.07
BERNSTEIN SANFORD C & CO, NEW YORK 4,951,175 130,090 3,876 0.08
FRANK RUSSELL SEC INC, NEW YORK 4,798,176 89,520 3,581 0.07
BROADCOURT CAP CORP/SUB OF MLPF&S,NY 4,635,480 161,135 6,437 0.14
CREDIT AGRICOLE CHEUVREUX, COURBEVOIE 4,479,205 441,782 4,090 0.09
MERRILL LYNCH PIERCE FENNER, WILMINGTON 4,409,851 247,700 4,724 0.11
SANFORD C. BERNSTEIN & CO, WHITE PLAINS 4,357,299 2,946,827 1,448 0.03
BLOOMBERG TRADEBOOK LLC, NEW YORK 4,114,906 131,990 2,640 0.06
MACQUARIE BANK LTD, HONG KONG 3,978,833 1,623,683 3,364 0.08
NOMURA SECS INTL INC, NEW YORK 3,944,389 549,376 2,947 0.07
OTHER BROKERS 137,339,884 17,560,411 132,829 0.10
TOTAL $ 967,101,448 89,929,104 $ 682,274

Educ ational EmployEEs’ supplEmEntary rEtirEmEnt systEm of fairfa x count y
Investment Summary
As of June 30, 2013 As of June 30, 2012
Market Value % Market Value Market Value % Market Value
Fixed IncomeU.S. Government obligations $22,836,510 1.2% $- 0.0%
Mortgage-backed securities 3,973,060 0.2% 1,523,586 0.1%
Domestic corporate bonds 84,011,424 4.3% 90,424,608 4.9%
Convertible bonds 12,143,244 0.6% 11,457,800 0.6%
International bonds 38,735,376 2.0% 41,750,081 2.3%
Preferred stocks 2,409,937 0.1% 6,877,879 0.4%
Index / Commingled fund 356,838,334 18.4% 361,914,042 19.9%
Total fixed income 520,947,885 26.8% 513,947,996 28.2%
Domestic Equities:
Basic industry 66,136,779 3.4% 58,683,212 3.2%Consumer and services 110,471,161 5.7% 98,920,238 5.4%Financial and utility 81,022,092 4.1% 52,127,231 2.8%Technological 60,526,874 3.1% 69,981,295 3.8%Index / Commingled fund 106,662,381 5.5% 110,603,943 6.0%
Total domestic stock 424,819,287 21.8% 390,315,919 21.2%
International EquityBasic industry 74,770,555 3.8% 69,024,421 3.8%Consumer and services 100,604,259 5.1% 71,206,787 3.9%Financial and utility 75,408,684 3.9% 48,910,078 2.7%Technological 33,706,829 1.7% 29,779,605 1.6%Index / Commingled fund 75,141,087 3.8% 76,397,734 4.2%
Total international stock 359,631,414 18.3% 295,318,625 16.2%
Real Estate
Commercial 55,423,279 2.8% 51,848,635 2.8%
Commingled 103,294,385 5.3% 98,237,115 5.4%
Total real estate 158,717,664 8.1% 150,085,750 8.2%
Alternative investments
Better beta 90,595,119 4.6% 103,425,441 5.7%
Global asset allocation 186,066,940 9.5% 184,473,015 10.1%
Hedge fund of funds 156,881,646 8.0% 139,115,563 7.6%Limited partnerships 25,221,027 1.3% 15,537,604 0.8%
Total alternative investments 458,764,732 23.4% 442,551,623 24.2%
Subtotal investments at fair value 1,922,880,982 98.4% 1,792,219,913 98.0%
Short-term Investments
Money Market 30,897,541 1.6% 37,909,533 2.0%
Total short-term investments 30,897,541 1.6% 37,909,533 2.0%
Total $ 1,953,778,523 100.0% $ 1,830,129,446 100.0%
Note: This summary is comprised of investments at fair value and short-term investments.
47 INVESTMENT SECTION
INVE
STM
ENT
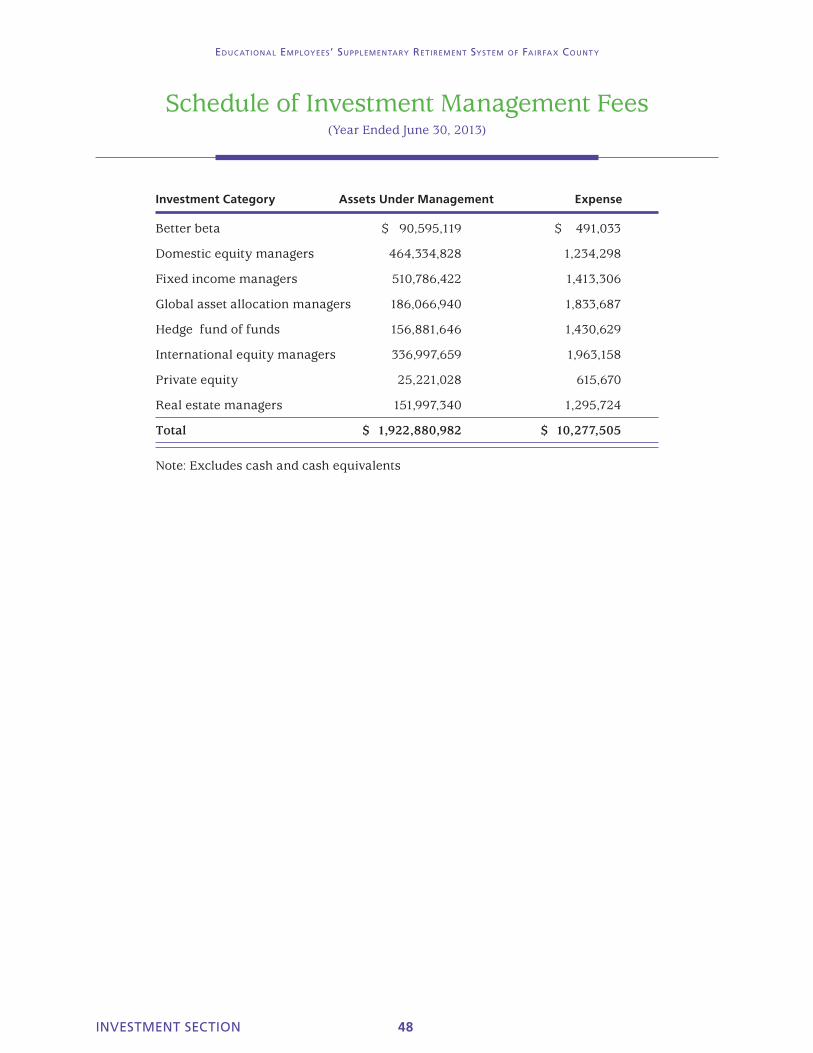
INVESTMENT SECTION 48
Educ ational EmployEEs’ supplEmEntary rEtirEmEnt systEm of fairfa x count y
Schedule of Investment Management Fees(Year Ended June 30, 2013)
Investment Category Assets Under Management Expense
Better beta $ 90,595,119 $ 491,033
Domestic equity managers 464,334,828 1,234,298
Fixed income managers 510,786,422 1,413,306
Global asset allocation managers 186,066,940 1,833,687
Hedge fund of funds 156,881,646 1,430,629
International equity managers 336,997,659 1,963,158
Private equity 25,221,028 615,670
Real estate managers 151,997,340 1,295,724
Total $ 1,922,880,982 $ 10,277,505
Note: Excludes cash and cash equivalents

ACTU
ARI
AL
ACTU
ARI
AL
Actuarial Section(Unaudited)
Actuary’s Certifi cation Letter
Summary of Actuarial Assumptions and Methods
Summary of Member Data
Short-Term Solvency Test
Analysis of Financial Experience
Summary of Benefi t Provisions
Contribution Rates
Summary of Plan Changes
New text to come.

ACTUARIAL SECTION 50
Educ ational EmployEEs’ supplEmEntary rEtirEmEnt systEm of fairfa x count y
Actuary’s Certification Letter

ACTU
ARI
AL
ACTU
ARI
AL
51 ACTUARIAL SECTION
Educ ational EmployEEs’ supplEmEntary rEtirEmEnt systEm of fairfa x count y
Actuary’s Certification Letter
ACTUARIAL SECTION 52
Educ ational EmployEEs’ supplEmEntary rEtirEmEnt systEm of fairfa x count y
Summary of Actuarial Assumptions and Methods
The actuarial assumptions and methods used in making the annual actuarial valuation are summarized in this section.
The assumptions were adopted by the Trustees following a study of experience covering the five-year period ending December 31, 2009.
Economic Assumptions
The investment return rate used in making the valuation was 7.5 percent per year, compounded annually (net after administrative expenses). The real rate of return is the portion of total investment return, which is more than the wage inflation rate. Based upon an assumed wage inflation rate of 3.75 percent, the 7.5 percent investment return rate translates to an assumed real rate of return over wages of 3.75 percent.
Pay increase assumptions for individual active members are shown for sample ages on Table A. Part of the assumption for each age is for merit and/or seniority increase, and the other 3.75 percent recognizes wage inflation.
The number of active members is assumed to continue at the present number.
Total active member payroll is assumed to increase 3.75 percent annually, which is the portion of the individual pay increase assumptions attributable to wage inflation. This assumed increase is recognized in the funding of unfunded actuarial accrued liabilities.
Non-Economic Assumptions
The probabilities of retirement for members eligible to retire are shown on Table C.
The mortality table used to measure active and retired life mortality was the 1994 Group Annuity Mortality Table set back 3 years for males and females. Related values are shown on Table D.
The probabilities of withdrawal from service, death-in-service, and disability are shown for sample ages on Table B.
The individual entry age actuarial cost method of valuation was used for determining actuarial accrued liabilities and normal cost.
Actuarial gains and losses reduce or increase the unfunded liability. The unfunded actuarial accrued liabilities are amortized to produce contribution amounts (principal and interest) which are level percent of payroll contributions.
Present assets (cash and investments) are valued on a market-related basis effective June 30, 1986. A one time adjustment toward market was made in connection with the 1990–93 experience study and an additional one-time adjustment set the funding value equal to the market value as of December 31, 2004. Further, an 85–115% market value corridor was added in the December 31, 2005 valuation. Additionally, the market value corridor on assets was changed from 75% to 125% in the December 31, 2008 valuation.
The data about persons now covered and about present assets was furnished by the System’s administrative staff. Although examined for general reasonableness, the data was not audited by the actuary.
The actuarial valuation computations were made by or under the supervision of a Member of the American Academy of Actuaries (MAAA).

Educ ational EmployEEs’ supplEmEntary rEtirEmEnt systEm of fairfa x count y
Summary of Actuarial Assumptions and Methods
TABLE A: Sample Pay Increase Assumptions for an Individual Member
PAY INCREASE ASSUMPTION
Service Index Merit & Seniority Base (Economy) Increase Next Year
1 5.30% 3.75% 9.05% 2 3.80% 3.75% 7.55% 3 3.30% 3.75% 7.05% 4 3.10% 3.75% 6.85% 5 2.90% 3.75% 6.65% 6 2.70% 3.75% 6.45% 7 2.70% 3.75% 6.45% 8 2.30% 3.75% 6.05% 9 2.10% 3.75% 5.85% 10–19 1.80% 3.75% 5.55% 20–24 1.00% 3.75% 4.75% 25 0.00% 3.75% 3.75%
TABLE B: Sample Rates of Separation from Active Employment Before Retirement
PERCENT OF ACTIVE MEMBERS SEPARATING WITHIN NEXT YEAR
DEATH DISABILTY OTHER
Ordinary Duty Ordinary Duty
Sample Ages
Years of Service Men Women Men Women Men Women Men Women Men Women
25 4 & over 0.02% 0.01% 0.00% 0.00% 0.03% 0.02% 0.01% 0.00% 11.20 15.40
30 0.03 0.01 0.00 0.00 0.03 0.02 0.01 0.01 7.60 11.20
35 0.03 0.02 0.00 0.00 0.05 0.04 0.01 0.01 5.40 7.60
40 0.04 0.02 0.00 0.00 0.07 0.06 0.02 0.02 3.80 4.20
45 0.05 0.03 0.01 0.00 0.10 0.09 0.03 0.02 3.00 3.00
50 0.08 0.04 0.01 0.01 0.17 0.15 0.04 0.04 2.00 3.00
55 0.13 0.07 0.02 0.01 0.29 0.25 0.07 0.06 3.20 4.20
60 0.22 0.12 0.03 0.01 0.49 0.35 0.12 0.09 4.00 5.00
Rates of separation for members with less than 4 years of service are assumed to be 16% in the first year, 13% in the second and thid years for men, and 14% in the second and third years for women.
53 ACTUARIAL SECTION
ACTU
ARI
AL

ACTUARIAL SECTION 54
Educ ational EmployEEs’ supplEmEntary rEtirEmEnt systEm of fairfa x count y
Summary of Actuarial Assumptions and Methods
ERFC (Hired before 7/1/2001) ERFC 2001 (Hired on or after 7/1/2001)
Type of Retirement Type of Retirement
Ages Service Reduced Service Age Based Service Service Based
45 2% 46 2 47 2 48 2 49 2 50 2 51 3 52 6 53 8 54 8 55 45% 9 22.5% 30 22.5% 56 35 4 17.5 31 17.5 57 25 4 12.5 32 12.5 58 25 4 12.5 33 12.5 59 25 4 12.5 34 12.5
60 30 8 15.0% 35 15.0 61 35 9 17.5 36 17.5 62 35 15 17.5 37 17.5 63 30 18 15.0 38 35.0 64 25 18 12.5 39 50.0
65 25 12.5 40 & up 100 66 25 12.5 67 25 25.0 68 25 25.0 69 20 20.0 70 20 20.0 71 20 20.0 72 20 20.0 73 30 30.0 74 30 30.0 75 100 100 76 100 100 77 100 100 78 100 100 79 100 100 80 100 100
TABLE C: Probability of Retirement for Members Eligible to Retire

Educ ational EmployEEs’ supplEmEntary rEtirEmEnt systEm of fairfa x count y
Summary of Actuarial Assumptions and Methods
TABLE D: Single Life Retirement Values
Standard Mortality
Sample Attained Ages
Present Value of $1 Monthly for Life Increasing 3% Annually
Future Life Expectancy (years)
Men Women Men Women
55 $ 187.03 $ 201.44 28.85 32.99
60 169.63 185.77 24.39 28.31
65 150.45 167.93 20.18 23.82
70 130.51 148.72 16.37 19.65
75 110.33 128.05 12.98 15.78
80 89.95 106.03 9.96 12.22
Disabled Mortality
Sample Attained Ages
Present Value of $1 Monthly for Life Increasing 3% Annually
Future Life Expectancy (years)
Men Women Men Women
55 $ 128.18 $ 144.69 17.14 20.34
60 118.67 135.13 15.18 18.04
65 110.09 124.28 13.46 15.71
70 99.71 111.14 11.60 13.27
75 86.55 94.59 9.55 10.66
80 70.31 76.55 7.37 8.16
55 ACTUARIAL SECTION
ACTU
ARI
AL
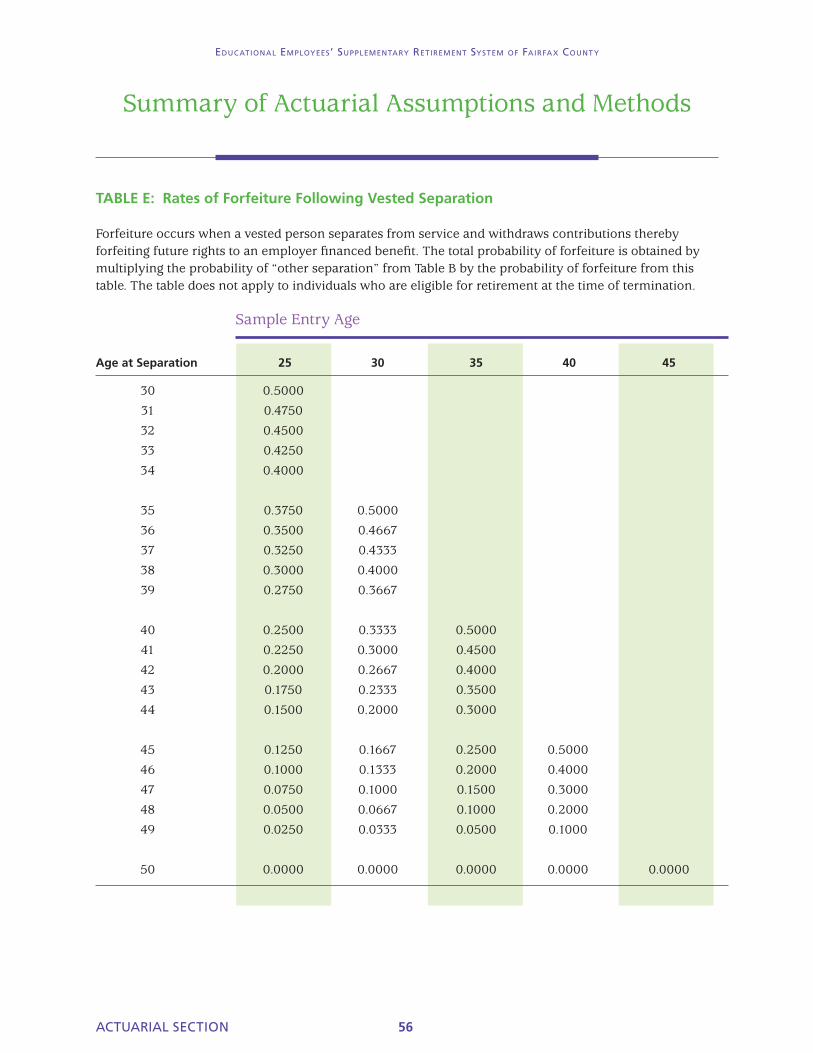
ACTUARIAL SECTION 56
Educ ational EmployEEs’ supplEmEntary rEtirEmEnt systEm of fairfa x count y
Summary of Actuarial Assumptions and Methods
TABLE E: Rates of Forfeiture Following Vested Separation
Forfeiture occurs when a vested person separates from service and withdraws contributions thereby forfeiting future rights to an employer financed benefit. The total probability of forfeiture is obtained by multiplying the probability of “other separation” from Table B by the probability of forfeiture from this table. The table does not apply to individuals who are eligible for retirement at the time of termination.
Sample Entry Age
Age at Separation 25 30 35 40 45
30 0.5000
31 0.4750
32 0.4500
33 0.4250
34 0.4000
35 0.3750 0.5000
36 0.3500 0.4667
37 0.3250 0.4333
38 0.3000 0.4000
39 0.2750 0.3667
40 0.2500 0.3333 0.5000
41 0.2250 0.3000 0.4500
42 0.2000 0.2667 0.4000
43 0.1750 0.2333 0.3500
44 0.1500 0.2000 0.3000
45 0.1250 0.1667 0.2500 0.5000
46 0.1000 0.1333 0.2000 0.4000
47 0.0750 0.1000 0.1500 0.3000
48 0.0500 0.0667 0.1000 0.2000
49 0.0250 0.0333 0.0500 0.1000
50 0.0000 0.0000 0.0000 0.0000 0.0000

Educ ational EmployEEs’ supplEmEntary rEtirEmEnt systEm of fairfa x count y
Summary of Member Data( Last Eight Years)
0,000
5,000
10,000
15,000
20,000
25,000
'1211'10'09'08'07'06'05
Terminated/Vested
Retired
Active
ERFC MEMBERSHIP
Calendar Year
0,000
5,000
10,000
15,000
20,000
25,000
'12'11'10'09'08'07'06'05
Terminated/Vested
Retired
Active
ERFC 2001 MEMBERSHIP
Calendar Year
ERFC ERFC 2001
Year Active RetiredTerminated/
Vested Active RetiredTerminated/
Vested Total
Calendar Year 2005 10,895 7,710 2,030 8,186 28,821
(As of December 31) 2006 10,065 7,710 2,179 9,306 6 65 29,331
2007 9,350 8,333 2,249 10,249 21 157 30,359
2008 8,791 8,556 2,243 10,940 39 317 30,886
2009 8,417 8,707 2,177 11,474 65 390 31,230
2010 7,900 8,968 2,137 12,241 113 582 31,941
2011 7,353 9,293 2,063 13,623 174 798 33,304
2012 6,801 9,524 2,029 14,718 264 1,070 34,406
57 ACTUARIAL SECTION
ACTU
ARI
AL

ACTUARIAL SECTION 58
Educ ational EmployEEs’ supplEmEntary rEtirEmEnt systEm of fairfa x count y
Summary of Member Data(As of December 31, 2012)
Active ERFC Members by Attained Age and Years of Service
YEARS OF SERVICE TO VALUATION DATE TOTALS
Age Group 0-4 5-9 10-14 15-19 20-24 25-29 30 & Up No. Salary Average
30-34 1 4 35 40 $2,442,197 $61,055
35-39 4 43 439 51 537 38,138,067 71,021
40-44 10 79 452 427 37 1 1,006 77,111,173 76,651
45-49 9 44 364 312 222 42 1 994 76,741,452 77,205
50-54 4 36 368 308 268 204 23 1,211 93,801,027 77,458
55-59 3 20 469 344 287 169 69 1,361 102,785,627 75,522
60 2 99 70 68 33 14 286 21,481,373 75,110
61 2 5 95 64 41 30 14 251 18,348,154 73,100
62 1 63 79 56 18 15 232 17,491,587 75,395
63 69 65 46 29 15 224 17,176,918 76,683
64 1 52 58 44 20 7 182 13,009,014 71,478
65 1 2 47 42 41 13 4 150 10,853,054 72,354
66 2 30 33 31 9 4 109 7,816,597 71,712
67 10 21 19 6 1 57 4,699,380 82,445
68 18 9 12 5 2 46 3,464,715 75,320
69 7 9 8 4 2 30 2,149,896 71,663
70 13 9 12 4 3 41 3,034,459 74,011
71 2 4 3 3 12 797,310 66,443
72 3 4 2 3 12 751,917 62,660
73 3 4 1 8 454,829 56,854
74 1 1 1 3 157,440 52,480
75 & over 1 1 3 2 2 9 526,019 58,447
Total 34 239 2,638 1,913 1,201 594 182 6,801 $513,232,205 $75,464

Educ ational EmployEEs’ supplEmEntary rEtirEmEnt systEm of fairfa x count y
Summary of Member Data(As of December 31, 2012)
Active ERFC 2001 Members by Attained Age and Years of Service
YEARS OF SERVICE TO VALUATION DATE TOTALS
Age Group0-4 5-9 10-14 15 & up No. Salary Average
15-19 2 2 $54,681 $27,341
20-24 714 714 30,436,982 42,629
25-29 2,500 360 2,860 137,559,631 48,098
30-34 1,306 1,515 176 2,997 162,243,450 54,135
35-39 648 788 264 1,700 99,484,260 58,520
40-44 735 634 191 1,560 88,586,345 56,786
45-49 649 601 151 1,401 74,937,107 53,488
50-54 541 721 217 1,479 76,738,647 51,885
55-59 352 545 253 1,150 64,995,545 56,518
60 37 88 32 157 8,778,052 55,911
61 30 81 32 143 8,258,392 57,751
62 28 60 31 119 7,003,328 58,852
63 32 65 24 121 6,822,742 56,386
64 24 53 26 103 6,353,196 61,682
65 12 36 16 64 3,446,255 53,848
66 10 29 10 49 3,205,677 65,422
67 7 13 5 25 1,431,214 57,249
68 9 15 4 28 1,422,502 50,804
69 1 11 3 15 1,003,107 66,874
70 2 7 2 11 530,951 48,268
71 2 8 10 518,079 51,808
72 1 2 1 4 218,279 54,570
74 1 1 84,939 84,939
75 & OVER 4 1 5 190,941 38,188
Total 7,642 5,636 1,440 - 14,718 $784,304,302 $53,289
59 ACTUARIAL SECTION
ACTU
ARI
AL

ACTUARIAL SECTION 60
Educ ational EmployEEs’ supplEmEntary rEtirEmEnt systEm of fairfa x count y
Summary of Member Data(As of December 31, 2012)
0 1000 2000 3000 4000 5000 6000 7000 8000
0-4
5-9
10-14
15-19
20-24
25-29
30 & up
0 1000 2000 3000 4000 5000 6000
<$50
$50-59
$60-69
$70 +
0 1000 2000 3000 4000 5000
<30
30s
40s
50s
60+
0-4 5-9 10-14 15-19 20-24 25-29 30 & up
ERFC 34 239 2,638 1,913 1,201 594 182
ERFC 2001
7,642 5,636 1,440 – – – –
ACTIVE MEMBER YEARS OF SERVICE Average Service = 8.8 years
<$ 50 $ 50-59 $ 60-69 $ 70+
ERFC 929 416 1,053 4,403
ERFC 2001 4,856 5,858 2,024 1,980
ACTIVE MEMBER SALARIES ($ in thousands) Average Annual Pay = $60,297
<30 30’s 40’s 50’s 60+
ERFC 0 577 2,000 2,572 1,652
ERFC 2001 3,576 4,697 2,961 2,629 855
ACTIVE MEMBER AGES Average Age = 43.5 years Total Active Members = 21,519
n ERFC n ERFC 2001
n ERFC n ERFC 2001
n ERFC n ERFC 2001

Educ ational EmployEEs’ supplEmEntary rEtirEmEnt systEm of fairfa x count y
Summary of Member Data(Last Eight Years)
ACTIVE MEMBER VALUATION DATA
Annual Annual Annual % Increase in Valuation Date Number Payroll Average Pay Avg. Annual Pay
December 31, 2005 19,081 $ 1,050,216,544 $ 55,040 5.4
December 31, 2006 19,371 $ 1,111,827,576 $ 57,396 4.3
December 31, 2007 19,599 $ 1,161,431,668 $ 59,260 3.2
December 31, 2008 19,731 $ 1,211,140,009 $ 61,383 3.6
December 31, 2009 19,891 $ 1,208,092,606 $ 60,735 (1.1)
December 31, 2010 20,141 $ 1,191,290,190 $ 59,148 (2.6)
December 31, 2011 20,976 $ 1,246,973,240 $ 59,448 0.5
December 31, 2012 21,519 $ 1,297,536,507 $ 60,297 1.4
RETIREES AND BENEFICIARIES ADDED AND REMOVED
Added to Payroll Removed from Payroll Payroll at End of Year
Year Number
Annualized Monthly Benefit Number
Annualized Monthly Benefit Number
Annualized Monthly Benefit
Average Annualized
Monthly Benefit
% Increase in Monthly
Benefit
As of December 31
2005 481 $ 615,969 201 $ 106,627 7,710 $ 9,587,825 $ 1,244 8.06
2006 531 $ 729,364 212 $ 124,532 8,029 $ 10,124,699 $ 1,261 5.60
2007 539 $ 727,585 214 $ 129,189 8,354 $ 10,705,991 $ 1,282 5.74
2008 461 $ 660,186 220 $ 147,638 8,595 $ 11,189,751 $ 1,302 4.52
2009 426 $ 596,102 249 $ 162,485 8,772 $ 11,565,358 $ 1,318 3.36
2010 563 $ 774,606 254 $ 170,078 9,081 $ 11,916,352 $ 1,312 3.03
2011 629 $ 851,853 243 $ 169,704 9,467 $ 12,410,208 $ 1,311 4.14
2012 636 $ 821,485 315 $ 194,842 9,788 $ 12,867,671 $ 1,315 3.69
61 ACTUARIAL SECTION
ACTU
ARI
AL
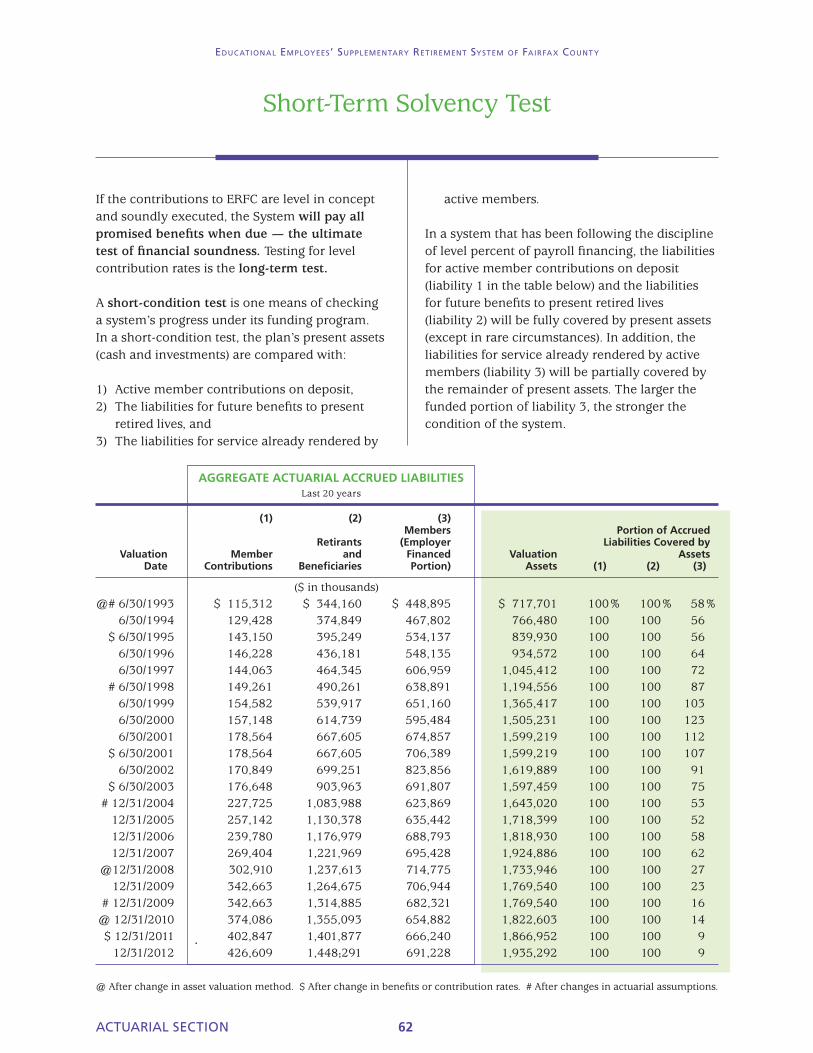
If the contributions to ERFC are level in concept and soundly executed, the System will pay all promised benefits when due — the ultimate test of financial soundness. Testing for level contribution rates is the long-term test.
A short-condition test is one means of checking a system’s progress under its funding program. In a short-condition test, the plan’s present assets (cash and investments) are compared with:
1) Active member contributions on deposit,2) The liabilities for future benefits to present
retired lives, and3) The liabilities for service already rendered by
active members.
In a system that has been following the discipline of level percent of payroll financing, the liabilities for active member contributions on deposit (liability 1 in the table below) and the liabilities for future benefits to present retired lives (liability 2) will be fully covered by present assets (except in rare circumstances). In addition, the liabilities for service already rendered by active members (liability 3) will be partially covered by the remainder of present assets. The larger the funded portion of liability 3, the stronger the condition of the system.
AGGREGATE ACTUARIAL ACCRUED LIABILITIES Last 20 years
(1) (2) (3) Members Portion of Accrued Retirants (Employer Liabilities Covered by Valuation Member and Financed Valuation Assets Date Contributions Beneficiaries Portion) Assets (1) (2) (3)
($ in thousands) @# 6/30/1993 $ 115,312 $ 344,160 $ 448,895 $ 717,701 100% 100% 58% 6/30/1994 129,428 374,849 467,802 766,480 100 100 56 $ 6/30/1995 143,150 395,249 534,137 839,930 100 100 56 6/30/1996 146,228 436,181 548,135 934,572 100 100 64 6/30/1997 144,063 464,345 606,959 1,045,412 100 100 72 # 6/30/1998 149,261 490,261 638,891 1,194,556 100 100 87 6/30/1999 154,582 539,917 651,160 1,365,417 100 100 103 6/30/2000 157,148 614,739 595,484 1,505,231 100 100 123 6/30/2001 178,564 667,605 674,857 1,599,219 100 100 112 $ 6/30/2001 178,564 667,605 706,389 1,599,219 100 100 107 6/30/2002 170,849 699,251 823,856 1,619,889 100 100 91 $ 6/30/2003 176,648 903,963 691,807 1,597,459 100 100 75 # 12/31/2004 227,725 1,083,988 623,869 1,643,020 100 100 53 12/31/2005 257,142 1,130,378 635,442 1,718,399 100 100 52 12/31/2006 239,780 1,176,979 688,793 1,818,930 100 100 58 12/31/2007 269,404 1,221,969 695,428 1,924,886 100 100 62 @12/31/2008 302,910 1,237,613 714,775 1,733,946 100 100 27 12/31/2009 342,663 1,264,675 706,944 1,769,540 100 100 23 # 12/31/2009 342,663 1,314,885 682,321 1,769,540 100 100 16 @ 12/31/2010 374,086 1,355,093 654,882 1,822,603 100 100 14 $ 12/31/2011 402,847 1,401,877 666,240 1,866,952 100 100 9 12/31/2012 426,609 1,448,291 691,228 1,935,292 100 100 9
@ After change in asset valuation method. $ After change in benefits or contribution rates. # After changes in actuarial assumptions.
ACTUARIAL SECTION 62
Educ ational EmployEEs’ supplEmEntary rEtirEmEnt systEm of fairfa x count y
Short-Term Solvency Test

Educ ational EmployEEs’ supplEmEntary rEtirEmEnt systEm of fairfa x count y
Analysis of Financial Experience
Pay Increases. If there are smaller pay increases than assumed, there is a gain. If greater increases, a loss.
Investment Return. If there is a greater investment return than assumed, there is a gain. If smaller return, a loss.
Age & Service Retirement. If members retire at older ages than assumed, there is a gain. If at younger ages, a loss.
Disability & Death in Service. If disability claims are less than assumed, there is a gain. If claims are more, a loss. If survivor claims are less than assumed, there is a gain. If claims are more, a loss.
Other Separations. If more liabilities are released by other separations than assumed, there is a gain. If smaller releases, a loss.
EXPERIENCE GAINS AND LOSSES BY RISK AREA (Dollars in Millions)
Economic Risk Area Demographic Risk Area Total Gain (Loss)
Age and Disability Experience Pay Investment Service and Death- Other Percent of Period Increases Return Retirement in Service Separations Other Amount Liabilities
For Periods Ending June 30
#1993–94 $ (4.1) $ 4.7 $ (1.6) $ (3.7) $ 3.5 $ (15.2) $ (16.4) (1.8)%
1994–95 (9.7) 25.2 5.1 (1.4) (4.4) (5.5) 9.3 0.9
1995–96 (7.7) 45.4 4.1 (1.8) (5.6) 4.3 38.7 3.6
1996–97 9.9 53.5 2.9 (1.7) (4.5) (8.7) 51.4 4.5
#1997–98 (2.6) 81.1 5.9 (0.5) 6.4 (13.9) 76.4 6.3
*1998–99 (8.4) 95.4 0.3 (1.0) 6.5 (3.8) 89.0 7.0
1999–00 (17.6) 62.3 3.8 (1.2) 12.9 38.9 99.1 7.4
2000–01 (9.1) 17.6 (0.3) (1.0) 13.0 (19.5) 0.7 0.0
2001–02 3.0 (50.4) 3.5 (1.1) 2.6 (29.9) (72.3) (4.7)
2002–03 18.5 (92.5) 11.0 (0.3) 4.0 (23.3) (82.6) (4.9)
For Periods Ending December 31
@2003–04 Due to transition to calendar year valuations, a gain/loss analysis was not conducted for this valuation period.
#2005 (7.1) 1.9 1.0 0.1 0.0 (3.2) (7.3) (0.4)
2006 (4.7) 23.6 2.0 0.0 (0.8) 2.6 22.7 1.1
2007 10.0 25.1 1.9 (0.2) (2.2) (7.2) 27.4 1.4
2008 4.1 (277.5) 5.2 (0.4) (4.0) 13.5 (259.1) (11.8)
2009 45.0 (34.6) 8.8 (0.8) (10.0) (11.6) (3.2) (0.1)
#2010 53.1 (16.9) 5.2 0.2 (5.3) (4.2) 32.1 1.4
2011 18.8 (30.6) 5.3 (0.2) (4.2) (4.8) (15.7) (0.7)
2012 12.3 (10.8) 4.6 (0.3) (3.4) (10.2) (7.8) (0.3)
# Experience Study
* Updated Gain Formulas
@ Gain Loss analysis not performed
63 ACTUARIAL SECTION
ACTU
ARI
AL

Service Retirement: Alternate Amount After Social Security Normal Retirement Age. By election at time of retirement, a member with service before July 1, 1988, may elect to receive 1988 new benefits with a special alternate amount for payment periods after the age the member becomes eligible for full Social Security benefits. The alternate amount is 103 percent of the total of:
1) the amount payable under June 30, 1987 benefit provisions,
2) plus, if the retiring member is younger than age 65 and if creditable Virginia service is less than 30 years, 1.65 percent of VRS average final compensation in excess of $1,200, multplied by years of creditable Virginia service, and further multiplied by a certain percent based upon the number of months that retirement occurs before reaching the earlier of the above two conditions; such percent is half of one percent for each of the first 60 such months and 4/10 of one percent for each of the next 60 such months, if any.
Reduced Service Retirement: With 25 Years Service. By election at time of retirement, such a member may elect to receive 103 percent of the following combination of benefits:
– To age 55, 2.85 percent of the 3-year average annual salary multiplied by years of credited service, then actuarially reduced to reflect retirement age younger than age 55; and
– From age 55 to Social Security Normal Retirement Age, the amount to age 55 reduced by: 1.65 percent of the portion of VRS average final compensation in excess of $1,200, multiplied by applicable years of creditable Virginia service; provided if creditable Virginia service is less than 30 years, the result of such multiplication shall be actuarially reduced for each month before the earlier of (1) attainment of age 65, and (2) the date when 30 years service would have been completed; and
– From Social Security Normal Retirement Age for life, the greater of the amount payable at the age the member becomes eligible for full Social Security benefits according to June 30, 1987 provisions or the amount payable at that age according to July 1, 1988 provisions.
ACTUARIAL SECTION 64
Educ ational EmployEEs’ supplEmEntary rEtirEmEnt systEm of fairfa x count y
Summary of Benefit ProvisionsAvailable to a Member Retiring with Some Service Before July 1, 1988 (ERFC Members)

Educ ational EmployEEs’ supplEmEntary rEtirEmEnt systEm of fairfa x count y
Summary of Benefit ProvisionsFor a Person Becoming a Member after July 1, 1988 but Before July 1, 2001 (ERFC Members)
Service Retirement: Eligibility. A member may retire any time after reaching the service retirement date, which is either (i) age 65 with 5 years service or (ii) age 55 with 25 years of service.
Service Retirement: Amount. For payment periods during the retired member’s lifetime 103 percent times (i) minus (ii) where:
(i) means 1.85 percent of the 3-year average annual salary multiplied by years of credited service, and
(ii) means 1.65 percent of the portion of VRS average final compensation in excess of $1,200, multiplied by applicable years of creditable Virginia service; provided if the member is younger than age 65 and if creditable Virginia service is less than 30 years, the result of such multiplication shall be actuarially reduced for each month before the earlier of:–1) attainment of age 65, and–2) the date when 30 years service would
have been completed.
For payment periods, if any, before the age the member becomes eligible for full Social Security benefits, an additional temporary benefit equal to 1 percent of the 3-year average annual salary multiplied by years of credited service.
Reduced Service Retirement: Eligibility. A member with 25 years service but younger than age 55 may retire as early as age 45. A member with less than 25 years service and younger than age 65 may retire on or after age 55.
Reduced Service Retirement: Amount After 25 Years Service. Service Retirement amount actuarially reduced to reflect retirement age younger than age 55.
Reduced Service Retirement: Amount After 5-24 Years Service. For payment periods during the retired member’s lifetime, the
Service Retirement amount payable at age 65 is actuarially reduced to reflect that the retirement age is younger than age 65. For payment periods before the age the member becomes eligible for full Social Security benefits, an additional temporary benefit equal to the Service Retirement temporary benefit reduced to reflect that the retirement age is younger than age 65.
Disability Retirement: An active member with 5 or more years of service who becomes totally and permanently disabled may be retired and receive a disability pension. The 5 year service requirement is waived if the disability is service-connected.
The amount is 103 percent times a lifetime pension equal to 0.25 percent of the 3-year average annual salary multiplied by years of credited service. Credited service shall be increased by the time period from disability retirement to the date when member would have reached service retirement date.
Death-in-Service Benefits: An active member with 5 or more years of service who dies will have benefits payable to the surviving spouse and/or dependent children. The 5 year service requirement is waived if the death is service-connected and the member’s benefit includes service credit that the member would have earned between the date of death and eligibility for service retirement (with a minimum of 10 years of service used).
Deferred Retirement: Calculated in the same manner as reduced service retirement.
Member Contributions: Members contribute 4 percent of their salaries. Interest credits of 5 percent are added annually. If a member leaves covered employment before becoming eligible to retire, accumulated contributions are returned upon request.
Before July 1, 2001, continued on next page
65 ACTUARIAL SECTION
ACTU
ARI
AL

ACTUARIAL SECTION 66
Educ ational EmployEEs’ supplEmEntary rEtirEmEnt systEm of fairfa x count y
Before July 1, 2001, continued from previous page
Post-Retirement Increases: On March 31, most pensions are increased by 3 percent. These increases are compounded each year. Pensions of members or beneficiaries who retired in the immediately preceding calendar year are increased by 1.489 percent (½ of a year’s increase).
Lifetime Level Benefit: Members retiring after July 1, 2004 are eligible for a lifetime level benefit (LLB) that is calculated by determining
the annuitized value of the greater of their accumulated contribution balance or the present value of the currently provided benefit.
Optional Forms of Payment: Option A — 100% joint and survivor.Option B — 50% joint and survivor.Option C — 10 years certain and life.Option D — Single sum payment not exceeding member’s accumulated contribution balance, plus a single life annuity actuarially reduced from the pension amount otherwise payable.
Summary of Benefit ProvisionsFor a Person Becoming a Member July 1, 2001 or Later (ERFC 2001 Members)
Service Retirement: Eligibility. A member may retire any time after reaching the service retirement date, which is either (i) age 60 with 5 years service or (ii) any age with 30 years of service.
Service Retirement: Amount. For payment periods during the retired member’s lifetime.
The amount is a lifetime pension equal to 0.8 percent of the 3-year average annual salary multiplied by years of credited service.
Death-in-Service Benefits: An active member with 5 or more years of service who dies will have benefits payable to the nominated beneficiary.
The amount is a pension equal to the straight life amount (0.8 percent of the 3-year average annual salary multiplied by years of credited service at date of death), reduced in accordance with an option A election and payable at age 60. Beneficiaries may elect to receive benefits before age 60 if benefits are further reduced as follows:
• an additional reduction of the smaller of 1) ½ of 1 percent for the first 60 months and
4/10 of 1 percent for each additional month between the member’s age at the date of death and age 60, and
2) ½ of 1 percent for the first 60 months and 4/10 of 1 percent for each additional month between the member’s service at the date of death and 30 years.
Deferred Retirement: An inactive member with 5 or more years of service will be entitled to a pension with payments beginning at age 60, provided she/he does not withdraw accumulated member contributions.
The amount is a pension equal to the straight life amount (0.8 percent of the 3-year average annual salary multiplied by years of credited service at termination date), payable at age 60.
Member Contributions: Members contribute 4 percent of their salaries. Interest credits of 5 percent are added annually. If a member leaves covered employment before becoming eligible to retire, accumulated contributions are returned upon request.
Post-Retirement Increases: On March 31, most pensions are increased by 3 percent. These increases are compounded each year. Pensions of members or beneficiaries who retired in the immediately preceding calendar year are increased by 1.489 percent.

Educ ational EmployEEs’ supplEmEntary rEtirEmEnt systEm of fairfa x count y
ERFC Contribution Rates(Last 20 Years)
Support Employees Instructional Employees
Fiscal Year Employee Employer Total Employee Employer Total
1994 2.00% 5.08% 7.08% 2.00% 5.53% 7.53%
1995 2.00 5.08 7.08 2.00 5.53 7.53
1996 2.00 5.08 7.08 2.00 5.53 7.53
1997 2.00 5.58 7.58 2.00 6.03 8.03
1998 2.00 5.58 7.58 2.00 6.03 8.03
1999 2.00 5.58 7.58 2.00 6.03 8.03
ERFC began using composite rates effective July 1, 1999
2000 2.00 4.99 6.99
2001 2.00 3.69 5.69
2002 2.00 3.69 5.69
2003 2.00 4.00 6.00
2004
7/1 to 5/30 2.00 4.29 6.29
6/1 to 6/30 4.00 2.53 6.53
2005 4.00 3.37 7.37
2006 4.00 3.37 7.37
2007 4.00 3.37 7.37
2008 4.00 3.37 7.37
2009 4.00 3.37 7.37
2010 4.00 3.20 7.20
2011 4.00 4.04 8.04
2012 4.00 4.34 8.34
2013 3.00 5.34 8.34
67 ACTUARIAL SECTION
ACTU
ARI
AL

ACTUARIAL SECTION 68
Educ ational EmployEEs’ supplEmEntary rEtirEmEnt systEm of fairfa x count y
Summary of Plan Changes
There were no significant plan changes during the valuation period ending December 31, 2012.

STAT
ISTI
CAL
Statistical Section(Unaudited)
Financial Trends Information
Net Assets
Changes in Net Assets
Assets and Liabilities Comparative Statement
Benefi t Deductions by Type
Benefi t Refunds by Type
Operating Information
Retired Members by Type of Benefi t
Average Benefi t Payments by Years of Service
Average Composite Monthly Benefi t Payments
Current Benefi ts by Attained Ages
Deferred Benefi ts by Attained Ages
New text to come.

STATISTICAL SECTION 70
Educ ational EmployEEs’ supplEmEntary rEtirEmEnt systEm of fairfa x count y
Net Assets Last Ten Fiscal Years
NET ASSETS
Do
llars
in M
illio
ns
200
400
600
800
1000
1200
1400
1600
1800
2000
'13'12'11'10'09'08'07'06'05'040
FISCAL YEARS NET ASSETS
2004 $ 1,528,120,115
2005 $ 1,647,713,156
2006 $ 1,766,534,921
2007 $ 2,015,738,092
2008 $ 1,858,571,973
2009 $ 1,441,434,430
2010 $ 1,607,663,423
2011 $ 1,886,968,119
2012 $ 1,827,768,322
2013 $ 1,956,772,826

71 STATISTICAL SECTION
STAT
ISTI
CAL
STAT
ISTI
CAL
Ed
uc
at
ion
al
Em
pl
oy
EE
s’
sup
pl
Em
En
ta
ry r
Et
irE
mE
nt s
ys
tE
m o
f fa
irfa
x c
ou
nt
y
Ch
ange
s in
Net
Ass
ets
Last
Ten
Fis
cal Y
ears
DED
UC
TIO
NS
BY
TY
PE
2004
2005
2006
2007
2008
2009
2010
2011
2012
2013
AD
DIT
ION
S
Empl
oyee
con
trib
utio
ns$
2
2,34
0,87
0$
3
9,81
8,58
5$
42
,292
,828
$
44,4
53,6
17$
46
,143
,803
$
47,9
96,4
08$
47,
918,
341
$ 4
7,16
7,12
9 $
49,
142,
379
$ 3
8,42
8,36
7
Empl
oyer
con
trib
utio
ns37
,331
,203
32,1
98,5
9634
,648
,918
36,6
44,0
0138
,334
,140
40,0
12,4
8037
,868
,623
47,1
18,11
152
,934
,245
67,7
34,6
34
Inve
stm
ent i
ncom
e (n
et o
f exp
ense
s)23
3,80
7,96
416
8,47
9,92
016
9,94
4,35
630
4,11
9,32
7(9
6,85
5,06
0)(3
57,6
72,2
66)
231,
574,
404
341,
669,
367
1,63
5,43
519
0,94
7,85
1
Gain
\loss
from
sal
e of
cap
ital a
sset
s—
——
27,6
32—
(5,4
94)
—(1
,503
) —
—
Tota
l add
ition
s to
pla
n ne
t ass
ets
293,
480,
037
240,
497,
101
246,
886,
102
385,
244,
577
(12,
377,
117)
(269
,668
,872
)31
7,36
1,36
843
5,95
3,10
410
3,71
2,05
929
7,11
0,85
2
DED
UC
TIO
NS
Bene
fit p
aym
ents
110,
236,
424
114,
999,
379
121,
687,
318
128,
739,
638
135,
927,
308
139,
594,
144
143,
128,
569
149,
046,
042
155,
041,
762
160,
098,
128
Cont
ribu
tion
refu
nds
1,99
6,94
72,
794,
118
3,08
7,50
13,
583,
007
4,22
9,85
03,
975,
907
3,33
9,91
04,
258,
033
4,29
5,17
14,
419,
806
Adm
inis
trat
ive
expe
nses
2,91
8,77
83,
110,
563
3,28
9,51
83,
718,
761
4,63
1,84
43,
898,
620
4,66
3,89
63,
344,
333
3,57
4,92
33,
588,
414
Tota
l ded
uctio
ns to
pla
n ne
t ass
ets
115,
152,
149
120,
904,
060
128,
064,
337
136,
041,
406
144,
789,
002
147,
468,
671
151,
132,
375
156,
648,
408
162,
911,
856
168,
106,
348
Chan
ge in
net
ass
ets
net o
f exp
ense
s$
178
,327
,888
$ 1
19,5
93,0
41$
118
,821
,765
$ 2
49,2
03,1
71$
(157
,166
,119
)$
(417
,137
,543
)$
166
,228
,993
$ 2
79,3
04,6
96$
(59,
199,
797)
$ 1
29,0
04,5
04
-400
-300
-200
-1000
100
200
300
400
'13
'12
'11
'10
'09
'08
'07
'06
'05
'04
Net
Inve
stm
ent
Inco
me
$ in Millions
020406080100
120
Empl
oyee
Con
trib
utio
n
Empl
oyer
Con
trib
utio
n
'13
'12
'11
'10
'09
'08
'07
'06
'05
'04
Emp
loye
e/Em
plo
yer
Co
ntr
ibu
tio
n
$ in Millions
0
306090120
150
180
'13
'12
'11
'10
'09
'08
'07
'06
'05
'04
$ in Millions
Con
trib
utio
n R
efun
ds
Adm
inis
trat
ive
Expe
nse
s
Ben
efits
Pay
men
ts
AD
DIT
ION
S B
Y S
OU
RC
E

@ After change in asset valuation method.
$ After change in benefits.
# After changes in actuarial assumptions.
STATISTICAL SECTION 72
Educ ational EmployEEs’ supplEmEntary rEtirEmEnt systEm of fairfa x count y
Assets and Liabilities Comparative StatementLast 20 Years—Dollars in Thousands
Computed Liabilities
Valuation Date
Active Member Payroll Retired Members Total
Valuation Assets
[Excess of Assets]
Unfunded Accrued
LiabilitiesFunded Percent
@# 6/30/1993 $ 450,530 $ 344,160 $ 564,207 $ 908,367 $ 717,701 $ 190,666 79.0
6/30/1994 480,995 374,849 597,230 972,079 766,480 205,599 78.8
$ 6/30/1995 521,044 395,249 677,287 1,072,536 839,930 232,606 78.3
6/30/1996 531,060 436,181 694,363 1,130,544 934,571 195,973 82.7
6/30/1997 553,709 464,345 751,022 1,215,367 1,045,412 169,955 86.0
# 6/30/1998 582,755 490,261 788,111 1,278,372 1,194,556 83,816 93.4
6/30/1999 626,015 539,917 805,742 1,345,659 1,365,417 (19,758) 101.5
6/30/2000 678,937 614,739 752,632 1,367,371 1,505,231 (137,860) 110.1
$ 6/30/2001 759,906 667,605 884,953 1,552,558 1,599,219 (46,661) 103.0
6/30/2002 781,756 699,251 994,705 1,693,956 1,619,889 74,067 95.6
$ 6/30/2003 866,502 903,963 868,455 1,772,418 1,597,459 174,959 90.1
12/31/2004 977,817 1,043,677 853,565 1,897,242 1,640,216 257,026 86.5
# 12/31/2004 977,817 1,083,988 851,594 1,935,582 1,643,020 292,562 84.9
12/31/2005 1,050,271 1,130,378 892,584 2,022,962 1,718,399 304,563 84.9
12/31/2006 1,111,828 1,176,979 928,573 2,105,552 1,818,930 286,662 86.4
12/31/2007 1,161,432 1,221,969 964,832 2,186,801 1,924,886 261,915 88.0
@ 12/31/2008 1,211,140 1,237,613 1,017,685 2,255,298 1,733,946 521,352 76.9
12/31/2009 1,208,093 1,264,675 1,049,607 2,314,282 1,769,540 544,742 76.5
# 12/31/2009 1,208,093 1,314,885 1,024,984 2,339,869 1,769,540 570,329 75.6
12/31/2010 1,191,290 1,355,093 1,028,968 2,384,061 1,822,603 561,458 76.5
$ 12/31/2011 1,246,973 1,401,887 1,069,087 2,470,964 1,866,952 604,012 75.6
12/31/2012 1,297,537 1,448,291 1,117,837 2,566,128 1,935,292 630,836 75.4
%

73 STATISTICAL SECTION
STAT
ISTI
CAL
STAT
ISTI
CAL
Ed
uc
at
ion
al
Em
pl
oy
EE
s’
sup
pl
Em
En
ta
ry r
Et
irE
mE
nt s
ys
tE
m o
f fa
irfa
x c
ou
nt
y
Ben
efit D
educ
tion
s fr
om N
et A
sset
s by
Typ
eLa
st T
en Y
ears
Serv
ice
Ben
efits
Dea
th B
enefi
tsD
isab
ility
Ben
efits
No
rmal
Earl
yD
uty
/No
n-D
uty
Du
tyN
on
-Du
tyTo
tal
Nu
mb
erA
mo
un
tN
um
ber
Am
ou
nt
Nu
mb
erA
mo
un
tN
um
ber
Am
ou
nt
Nu
mb
erA
mo
un
tPa
rtic
ipan
tsB
enefi
ts
Cal
end
ar Y
ears
2004
3,89
077
,911
,030
3,
174
29,9
41,2
3811
181
2,14
926
298,
169
229
1,06
6,41
4 7,
430
110,
029,
000
2005
3,98
981
,734
,466
3,
364
32,2
79,0
3611
085
0,78
127
309,
656
220
1,04
9,82
6 7,
710
116,
223,
765
2006
4,15
687
,010
,607
3,51
334
,096
,345
112
910,
194
2731
8,94
722
11,
066,
747
8,02
912
3,40
2,84
0
2007
4,33
491
,777
,998
3,65
836
,100
,474
120
1,04
8,49
626
322,
317
216
1,05
7,79
48,
354
130,
307,
079
2008
4,47
694
,522
,827
3,76
037
,401
,953
124
1,05
9,05
425
319,
262
210
1,04
3,16
48,
595
134,
346,
260
2009
4,61
596
,983
,027
3,79
138
,266
,346
134
1,10
5,43
824
294,
234
208
1,04
3,25
98,
772
137,
692,
304
Fisc
al Y
ears
2010
4,60
010
0,02
0,27
13,
783
40,6
14,2
1414
51,
167,
515
2330
8,45
419
41,
018,
115
8,74
514
3,12
8,56
9
2011
4,71
710
4,79
2,72
73,
990
41,6
54,5
0716
01,
276,
445
2230
0,68
418
91,
021,
679
9,07
814
6,04
6,04
2
2012
4,99
910
6,48
7,56
84,
050
45,9
46,8
6217
11,
341,
323
2127
6,42
117
798
9,58
89,
418
155,
041,
762
2013
5,12
411
0,63
4,20
64,
232
46,9
26,2
2216
91,
308,
058
2126
5,15
317
396
4,48
99,
719
160,
098,
128

STATISTICAL SECTION 74
Educ ational EmployEEs’ supplEmEntary rEtirEmEnt systEm of fairfa x count y
Benefit Refunds by TypeLast Ten Years
Separation Deaths TOTAL
Fiscal Year No. Amount No. Amount No. Amount
2004 719 $ 1,840,349 15 $ 156,598 734 $ 1,996,947
2005 871 $ 2,620,070 26 $ 174,048 897 $ 2,794,118
2006 818 $ 2,865,448 20 $ 222,052 838 $ 3,087,500
2007 746 $ 3,407,248 18 $ 175,759 764 $ 3,583,007
2008 857 $ 4,064,627 24 $ 165,223 881 $ 4,229,850
2009 722 $ 3,644,789 25 $ 331,118 747 $ 3,975,907
2010 648 $ 3,201,604 15 $ 138,306 663 $ 3,339,910
2011 725 $ 4,046,929 26 $ 211,104 751 $ 4,258,033
2012 659 $ 3,934,877 26 $ 360,294 685 $ 4,295,171
2013 634 $ 4,081,157 19 $ 338,649 653 $ 4,419,806
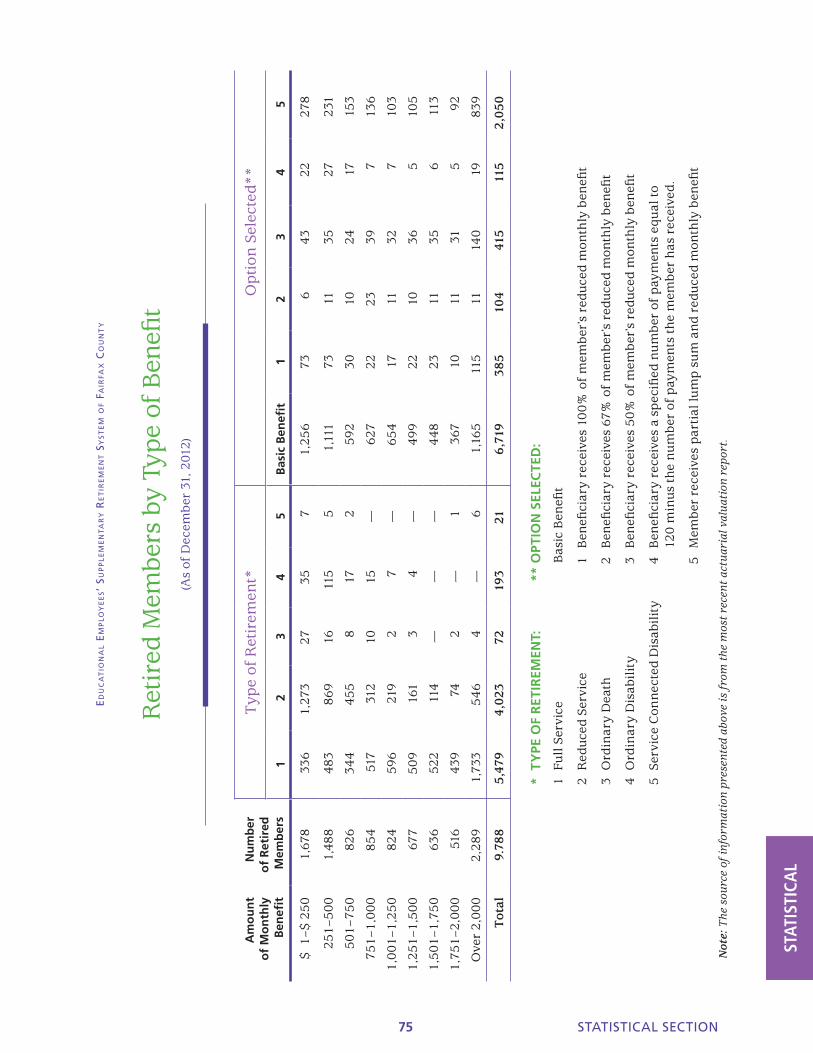
STAT
ISTI
CAL
STAT
ISTI
CAL
75 STATISTICAL SECTION
Ed
uc
at
ion
al
Em
pl
oy
EE
s’
sup
pl
Em
En
ta
ry r
Et
irE
mE
nt s
ys
tE
m o
f fa
irfa
x c
ou
nt
y
Ret
ired
Mem
bers
by
Type
of
Ben
efit
(As
of D
ecem
ber
31, 2
012)
Not
e: T
he s
ourc
e of
info
rmat
ion
pres
ente
d ab
ove
is f
rom
the
mos
t re
cent
act
uar
ial v
alu
atio
n re
port
.
Am
ou
nt
of
Mo
nth
ly
Ben
efit
Nu
mb
er
of
Ret
ired
M
emb
ers
Typ
e of
Ret
irem
ent*
Opt
ion
Sel
ecte
d**
12
34
5B
asic
Ben
efit
12
34
5
$ 1
–$ 2
501,
678
336
1,27
327
357
1,25
673
643
2227
8
251–
500
1,48
848
386
916
115
51,
111
7311
3527
231
501–
750
826
344
455
817
2 59
230
1024
1715
3
751–
1,00
085
451
731
210
15—
627
2223
397
136
1,00
1–1,
250
824
596
219
27
—65
417
1132
710
3
1,25
1–1,
500
677
509
161
34
—49
922
1036
510
5
1,50
1–1,
750
636
522
114
——
—44
823
1135
611
3
1,75
1–2,
000
516
439
742
—1
367
1011
315
92
Ove
r 2,
000
2,28
91,
733
546
4—
61,
165
115
1114
019
839
Tota
l9.
788
5,47
94,
023
7219
321
6,71
938
510
441
511
52,
050
* T
YPE
OF
RET
IREM
ENT:
**
OPT
ION
SEL
ECTE
D:
1 Fu
ll Se
rvic
e
Bas
ic B
enefi
t
2 R
educ
ed S
ervi
ce
1
Ben
efici
ary
rece
ives
100
% o
f m
embe
r’s
redu
ced
mon
thly
ben
efit
3 O
rdin
ary
Dea
th
2
Ben
efici
ary
rece
ives
67%
of
mem
ber’
s re
duce
d m
onth
ly b
enefi
t
4 O
rdin
ary
Dis
abil
ity
3
Ben
efici
ary
rece
ives
50%
of
mem
ber’
s re
duce
d m
onth
ly b
enefi
t
5 Se
rvic
e C
onn
ecte
d D
isab
ilit
y 4
Ben
efici
ary
rece
ives
a s
pec
ified
nu
mbe
r of
pay
men
ts e
qual
to
12
0 m
inu
s th
e n
um
ber
of p
aym
ents
th
e m
embe
r h
as r
ecei
ved.
5
Mem
ber
rece
ives
par
tial
lum
p su
m a
nd
redu
ced
mon
thly
ben
efit

STATISTICAL SECTION 76
Educ ational EmployEEs’ supplEmEntary rEtirEmEnt systEm of fairfa x count y
Average Benefit Payments by Years of Service
YEARS CREDITED SERVICE
5-10 10-15 15-20 20-25 25-30 30+
Retirement Effective Dates
Period 1/1/08 to 12/31/08
Avg Monthly Benefit $ 273.32 $ 360.11 $ 730.56 $ 905.71 $ 2,442.16 $ 2,721.16
Avg Final Average Salary $ 4,807.02 $ 4,918.32 $ 5,626.34 $ 5,648.77 $ 6,985.58 $ 7,405.08
No. of Retired Members 64 60 80 45 146 49
Period 1/1/09 to 12/31/09
Avg Monthly Benefit $ 237.69 $ 390.72 $ 791.10 $ 1,067.98 $ 2,451.95 $ 2,782.62
Avg Final Average Salary $ 4,839.74 $ 4,776.32 $ 5,974.65 $ 6,496.54 $ 7,376.69 $ 7,595.88
No. of Retired Members 58 63 58 59 115 56
Period 1/1/10 to 12/31/10
Avg Monthly Benefit $ 295.81 $ 296.64 $ 669.73 $ 1,031.12 $ 2,439.18 $ 2,625.63
Avg Final Average Salary $ 4,964.70 $ 4,995.25 $ 5,724.04 $ 6,377.40 $ 7,307.50 $ 7,871.13
No. of Retired Members 82 90 77 80 146 80
Period 1/1/11 to 12/31/11
Avg Monthly Benefit $ 264.65 $ 349.22 $ 759.30 $ 920.42 $ 2,266.05 $ 2,872.97
Avg Final Average Salary $ 4,842.94 $ 4,912.25 $ 5,806.50 $ 6,084.78 $ 7,278.50 $ 8,073.08
No. of Retired Members 75 103 112 81 168 83
Period 1/1/12 to 12/31/12
Avg Monthly Benefit $ 272.98 $ 434.75 $ 678.98 $ 1,088.46 $ 2,239.49 $ 2,667.58
Avg Final Average Salary $ 4,962.62 $ 5,182.69 $ 5,965.10 $ 6,278.19 $ 7,040.31 $ 8,026.53
No. of Retired Members 87 121 99 83 159 79

STAT
ISTI
CAL
77 STATISTICAL SECTION
Educ ational EmployEEs’ supplEmEntary rEtirEmEnt systEm of fairfa x count y
Average Composite Monthly Benefit Payments for Retirees
Last Ten Years
By Type of Benefit Being Paid
Service Reduced Ordinary Year Retirement Service Disability
Fiscal Year 2003 $ 1,617 $ 783 $ 478
Calendar Year 2004 $ 1,663 $ 784 $ 446
2005 $ 1,707 $ 800 $ 459
2006 $ 1,745 $ 809 $ 466
2007 $ 1,765 $ 822 $ 475
2008 $ 1,760 $ 829 $ 469
2009 $ 1,751 $ 841 $ 480
2010 $ 1,727 $ 849 $ 495
2011 $ 1,717 $ 853 $ 492
2012 $ 1,688 $ 839 $ 570

STATISTICAL SECTION 78
Educ ational EmployEEs’ supplEmEntary rEtirEmEnt systEm of fairfa x count y
Retirees and Beneficiaries Current Annual Benefits Tabulated by Attained Ages
(As of December 31, 2012)
Total
Attained Ages No. Annual Amount
Under 40 6 $ 17,784
40-44 6 30,617
45 1 2,895
46 1 811
47 2 6,479
48 2 30,513
49 8 25,322
50 6 94,067
51 3 53,448
52 7 174,006
53 13 366,264
54 20 620,611
55 82 1,860,372
56 137 3,184,796
57 165 3,670,196
58 207 4,941,350
59 222 5,289,178
60 319 7,062,663
61 369 7,884,224
62 432 9,196,678
63 486 11,452,903
64 582 12,911,224
65 737 15,964,074
66 589 6,700,078
67 455 4,512,260
68 466 5,064,156
69 443 4,816,974
70-74 1,707 18,818,441
75-79 1,180 15,232,369
80 & Up 1,135 12,649,317
Grand Total 9,788 $152,634,070
Note: This source of information
presented is from the most recent
actuarial valuation report.
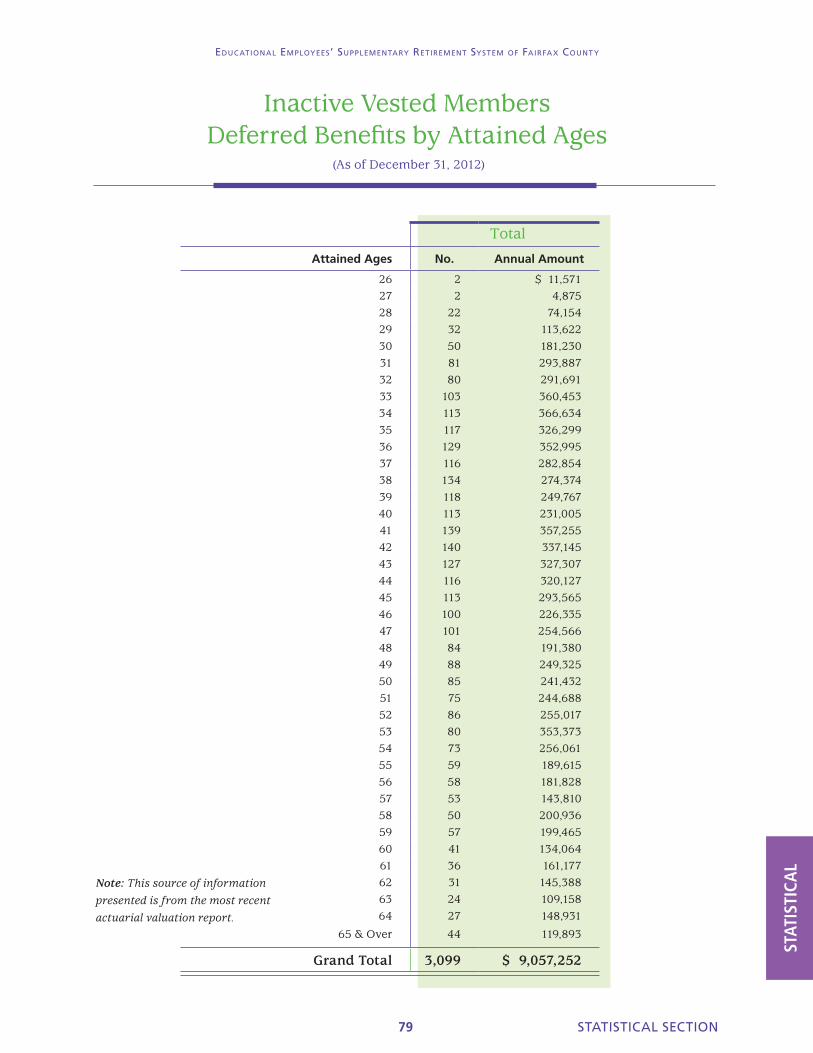
79 STATISTICAL SECTION
Educ ational EmployEEs’ supplEmEntary rEtirEmEnt systEm of fairfa x count y
Inactive Vested Members Deferred Benefits by Attained Ages
(As of December 31, 2012)
STAT
ISTI
CAL
Total
Attained Ages No. Annual Amount
26 2 $ 11,571 27 2 4,875 28 22 74,154 29 32 113,622 30 50 181,230 31 81 293,887 32 80 291,691 33 103 360,453 34 113 366,634 35 117 326,299 36 129 352,995 37 116 282,854 38 134 274,374 39 118 249,767 40 113 231,005 41 139 357,255 42 140 337,145 43 127 327,307 44 116 320,127 45 113 293,565 46 100 226,335 47 101 254,566 48 84 191,380 49 88 249,325 50 85 241,432 51 75 244,688 52 86 255,017 53 80 353,373 54 73 256,061 55 59 189,615 56 58 181,828 57 53 143,810 58 50 200,936 59 57 199,465 60 41 134,064 61 36 161,177 62 31 145,388 63 24 109,158 64 27 148,931
65 & Over 44 119,893
Grand Total 3,099 $ 9,057,252
Note: This source of information
presented is from the most recent
actuarial valuation report.

STATISTICAL SECTION 80
This page is intentionally left blank.