
INTRODUCING ARCHROCK - The Zen of Investingthezenofinvesting.com/wp-content/uploads/Archrock... ·...
32
1 INTRODUCING ARCHROCK October 26, 2015 © 2015 Archrock, Inc. All rights reserved.
Transcript of INTRODUCING ARCHROCK - The Zen of Investingthezenofinvesting.com/wp-content/uploads/Archrock... ·...
0,169,224
0,0,0
151,153,155
0,73,118
0,130,186
45,204,211
1
INTRODUCING ARCHROCK
October 26, 2015
© 2015 Archrock, Inc. All rights reserved.

0,169,224
0,0,0
151,153,155
0,73,118
0,130,186
45,204,211
2
Forward Looking Statements
All statements in this presentation (and oral statements made regarding the subjects of this presentation) other than historical facts are forward-looking statements
within the meaning of the Private Securities Litigation Reform Act of 1995. These forward-looking statements rely on a number of assumptions concerning future
events and are subject to a number of uncertainties and factors that could cause actual results to differ materially from such statements, many of which are outside
the control of Archrock, Inc. and Archrock Partners, L.P. (“Archrock” and “Archrock Partners” together, the “Companies”). Forward-looking information includes, but
is not limited to: the industry fundamentals, including the attractiveness of returns and valuation, stability of cash flows, demand dynamics and overall outlook, and
the Companies’ abilities to realize the benefits thereof; the Companies’ expectations regarding future economic and market conditions and trends; the Companies’
operational and financial strategies, including planned capital expenditures and growth activities, the Companies’ abilities to successfully effect those strategies
and the expected results therefrom; the Companies’ financial and operational outlook, including additional payments expected to be received following the receipt
by Exterran Corporation of payments from Venezuela, and ability to fulfill that outlook; demand and growth opportunities for the Companies’ products and services;
statements related to performance, profitability, structural and process improvement initiatives, the expected timing thereof, the Companies’ abilities to successfully
effect those initiatives and the expected results therefrom; the operational and financial synergies provided by the Companies’ size; Exterran Holdings, Inc.’s plan
to conduct a separation of certain of its businesses; the possibility that the proposed separation will be consummated and the timing of its consummation; the
expected benefits from the proposed separation; the expected financial position and indebtedness levels of the Companies’ following the proposed separation; the
expected dividend policies and dividend levels of Archrock following the proposed separation; and the impact of the proposed separation on employees and
customers.
While the Companies believe that the assumptions concerning future events are reasonable, they caution that there are inherent difficulties in predicting certain
important factors that could impact the future performance or results of their businesses. The factors that could cause results to differ materially from those
indicated by such forward-looking statements include, but are not limited to: actions by governmental and regulatory authorities; delays, costs and difficulties
associated with the proposed separation; local, regional, national and international economic and financial market conditions and the impact they may have on the
Companies and their respective customers; changes in tax laws that impact master limited partnerships; conditions in the oil and gas industry, including a
sustained decrease in the level of supply or demand for oil or natural gas or a sustained decrease in the price of oil or natural gas; the Companies’ ability to timely
and cost-effectively execute larger projects; changes in economic conditions in key operating markets; any non-performance by third parties of their contractual
obligations; changes in safety, health, environmental and other regulations; as to each of the Companies, the performance of the other entity; and proposed
regulations issued by the Treasury Department and the Internal Revenue Service on May 5, 2015 that may affect the treatment of Archrock Partners’ income as
“qualifying income”.
These forward-looking statements are also affected by the risk factors, forward-looking statements and challenges and uncertainties described in the Companies’
Annual Reports on Form 10-K for the year ended December 31, 2014, and those set forth from time to time in the Companies’ filings with the Securities and
Exchange Commission, which are currently available at www.exterran.com and after the completion of the separation will be available at www.archrock.com.
Except as required by law, the Companies expressly disclaim any intention or obligation to revise or update any forward-looking statements whether as a result of
new information, future events or otherwise.
© 2015 Archrock, Inc. All rights reserved.

0,169,224
0,0,0
151,153,155
0,73,118
0,130,186
45,204,211
3
Update on Spinoff
Archrock & Exterran
Corporation
Exchange /
Ticker
• NYSE: AROC (EXH) (“RemainCo”) / NASDAQ: APLP (EXLP)
• NYSE: EXTN (“SpinCo”)
Key Dates
• When-issued trading begins: October 26, 2015
• Record date: October 27, 2015
• Distribution date: November 3, 2015
• Regular-way trading begins: November 4, 2015
Distribution Ratio • 1 share of EXTN for every 2 shares of EXH
Capital Structure
• $160mm of funded debt1
– Contingent receivable based on Venezuela payments received by EXTN’s subsidiaries
• $350mm revolving credit facility
Corporate Credit
Ratings
• AROC
– NR
• APLP
– Moody’s: Ba3
– S&P: B+
© 2015 Archrock, Inc. All rights reserved.
1 Reflects expected balances as of spin-off closing date. Excludes $10mm to $15mm of transaction-related expenses related to the completion of the spin-off that Archrock expects
to incur in the fourth quarter.

0,169,224
0,0,0
151,153,155
0,73,118
0,130,186
45,204,211
4
• GP and IDRs of APLP (2%)1
• 24 mm LP Units1
• Operating HP ~0.5mm4
• U.S. Aftermarket Services
Business
• Contingent Receivable from
Exterran Corporation
Overview of Archrock
Archrock Companies’ Structure and Asset Overview
1 Based on APLP/EXLP units outstanding as of July 28, 2015. 2 AROC expected liquidity excludes $10mm to $15mm of transaction-related expenses related to the completion of the spin-off that Archrock expects to incur in the fourth quarter and
letters of credit. 3 As of June 30, 2015. 4 Operating horsepower as of June 30, 2015.
(AROC)
$160mm Funded Debt at
Closing2
(APLP)
~$1.4bn Net Debt3
GP 39% LP1
2% GP1
100% IDR
100%
Public
Unitholders
59%1
Public
Stockholders
Archrock is a pure play North American provider of contract compression & aftermarket services
Value Unlocked Through Separation
AROC Assets
• Operating HP ~3.1mm4
• Distribution Coverage of 1.24x
at June 30, 2015
APLP Assets
Enhances management focus on
driving maximum growth from
North American business
Simplifies corporate structure
– High growth from GP / IDR
cash flows illuminated at
Archrock
– Removes international /
fabrication focus of parent
Improves capital allocation with
focus on deploying capital to:
– Grow base of stable cash
flow assets
– Drive distribution and
dividend growth
© 2015 Archrock, Inc. All rights reserved.

0,169,224
0,0,0
151,153,155
0,73,118
0,130,186
45,204,211
5
Key Archrock Investment Highlights
1 Operating horsepower as of June 30, 2015.
2 Data from Energy Information Administration and Bentek. 3 AROC expected liquidity excludes $10mm to $15mm of transaction-related expenses related to the completion of the spin-off that Archrock expects to incur in the fourth quarter and
letters of credit.
Cash Flow
Stability
• Fee-based contracts for “must-run” production and midstream infrastructure assets
• Production, not exploration, leveraged business model ensures steady demand for services through the
commodity cycle
Largest Fleet
Deployed to
Major Basins
• Combined operating fleet of 3.6 mm HP1 positions us as largest pure play contract compression company
• Fleet is deployed across all major U.S. producing basins
Visible Growth
• Natural gas demand in the U.S. is forecasted to increase by ~17 bcf/d by 2020 relative to 2015, a 23%
increase2
• Third party acquisitions provide an additional source of growth potential as upstream companies re-focus
capital deployment in current commodity environment
• GP / IDR structure enhances distribution growth from APLP to AROC
Optimized
Structure for
Growth
• Simplified structure improves management focus and investor valuation methodology
• Archrock incentivized to grow Archrock Partners’ distributions via LP & IDR ownership
Conservatively
Capitalized
• Balance sheet strength provides additional flexibility for pursuing growth
• Free cash flow positive at AROC with expected liquidity of $190mm at AROC at closing of spin-off3 and
$359mm at APLP as of 6/30/15 minimizes near-term reliance on public markets to fund growth plans
© 2015 Archrock, Inc. All rights reserved.

0,169,224
0,0,0
151,153,155
0,73,118
0,130,186
45,204,211
6
What Does Compression Do?
Increases pressure from suction to discharge
© 2015 Archrock, Inc. All rights reserved.
• Wellhead
• Gathering System
50 PSI
Suction
Pressure1
Inlet Sources
• Gathering
System
• Pipeline
• Processing Plant
• Storage Facility
• Reservoir
1,200 PSI
Discharge
Pressure1
Outlet Sources
1 Pressures based on an illustrative example from the Eagle Ford shale.

0,169,224
0,0,0
151,153,155
0,73,118
0,130,186
45,204,211
7
Where is Compression Used?
Compression is an essential service utilized all along the production cycle to transport gas to the end user
Processing
Wellhead
Production
Power
Generation
Storage
Industrial
Residential
Exports - Pipelines
Gathering
System
© 2015 Archrock, Inc. All rights reserved.
LNG
Chemical
Feed-Stocks and
Fuels
Na
tura
l G
as
C
rud
e O
il
Gas Lift
82% of Fleet1
18% of Fleet1 Enhanced Oil
Recovery
1 Based on operating horsepower as of June 30, 2015.

0,169,224
0,0,0
151,153,155
0,73,118
0,130,186
45,204,211
8
Compression Applications & Customers
Services Provided
Average
HP / Unit1 Units1 Overview
Customer
Types
Archrock
Focus
Wellhead 322 2,198
• Compression located at the well site
• Often smaller units that are compressing a single
well
• Upstream
E&P
Gathering 865 2,209
• Transports gas from multiple wells to a compressor
or compressor station
• Often larger units compared to wellhead
• Upstream
E&P
• Midstream
G&P
Gas Lift 312 2,199
• Use of gas to artificially lift oil or fluids from a well
• Unit size can vary based on the volume and number
of wells being lifted
• Upstream
E&P
Other 583 457 • Includes plant compression, flash gas, residue plant
compression, CO2 injection and storage • Various
• More limited
opportunities
© 2015 Archrock, Inc. All rights reserved.
1 Horsepower reported as original equipment manufacturer (OEM) horsepower and unit data as of October 01, 2015.

0,169,224
0,0,0
151,153,155
0,73,118
0,130,186
45,204,211
9
U.S. Forecasted Production Growth
Driven by Strong Demand Outlook
Sources of Demand Forecasted Supply
Source: Energy Information Administration; Bentek
U.S. LNG Exports
U.S. Natural Gas Demand Growth
© 2015 Archrock, Inc. All rights reserved.
Alaska Lower 48 Offshore
Coalbed Methane Other Lower 48 Onshore
Tight Gas Shale Gas and Tight Oil Plays
74.3
91.6
3.6
2.1
1.6
10.3 (0.4)
70
75
80
85
90
95
100
2015 Industrial Power MexicoExport
LNGExport
Other 2020
Bc
f/d
2015 vs. 2020
0
10
20
30
40
50
60
70
80
90
100
110
0
5
10
15
20
25
30
35
40
2015 2025 2035
Billio
n C
ub
ic F
eet (P
er D
ay)
Tri
llio
n C
ub
ic F
eet
(An
nu
al)

10
0,169,224
0,0,0
151,153,155
0,73,118
0,130,186
45,204,211
Aftermarket Services Overview
© 2015 Archrock, Inc. All rights reserved.
Field
Services
• Sales of field labor services concentrated around:
− Scheduled Maintenance
− Major Maintenance
− Unscheduled Call-Outs
Parts • Sales of natural gas engines, compressors and accessory
parts needed for maintenance and repair of compression
equipment
Shop
Services /
Revamps
• Services such as parts remanufacturing, valve repair and
machining that is performed in Archrock shops across the
U.S.
• Re-design of existing compression assets to meet new
operating conditions
AMS Business Segments AMS Highlights
Revenue stream from customers that
choose to own compression
Leverages existing infrastructure of
contract compression business
Significant opportunity as newer
compression in shale developments
approaches major maintenance cycle

11
0,169,224
0,0,0
151,153,155
0,73,118
0,130,186
45,204,211
How the Businesses Fit Together
© 2015 Archrock, Inc. All rights reserved.
Business Segments Revenue by Segment1
Gross Margin by Segment1,2
1 Revenue and gross margin based on LTM Q2-2015 as of June 30, 2015, pro-forma for the separation of Exterran Corp. LTM data should not be relied upon as being indicative of
full year 2015 or future results. 2 See Addendum I for information on gross margin.
Contract Operations Aftermarket Services
Equipment
Owner
Service
Providers
Service Types
Shared
Resources
The two business segments leverage the same
operational skill set, infrastructure and supply
chain channels
Customer
• Full service
• Pressure and
throughput capability
• Run-time guarantee
• Discrete activities up to
full service
• Parts and maintenance
Contract Operations Aftermarket Services
$227mm22%
$791mm78%
Contract Operations Aftermarket Services
$460mm92%
$42mm8%
and

12
0,169,224
0,0,0
151,153,155
0,73,118
0,130,186
45,204,211
3,130
488
1,413 1,411
952
510 500
279
100
0
500
1,000
1,500
2,000
2,500
3,000
3,500
4,000
Archrock EnergyTransfer/
CDM
USACompression
CSICompressco
J-WOperating
Axip Natural GasServices
Natural GasCompression
Systems
Other
Op
era
tin
g H
P (
000s) Operating HP
at
© 2015 Archrock, Inc. All rights reserved.
Archrock Is the Leading U.S. Contract
Compression Services Operator in the U.S.
U.S. Outsourced Compression Competitors1 Archrock Highlights
• Archrock is a pure-play contract
compression services operator
• Archrock is the leading contract
compression services operator in
the U.S.
• Archrock’s business size and
scale provide significant
operational and financial
synergies
1 SEC filings and management estimates as of June 30, 2015.
Operating HP
at
3,618

13
0,169,224
0,0,0
151,153,155
0,73,118
0,130,186
45,204,211
Archrock’s Geographic Diversity
Presence in All Major U.S. Producing Basins HP by Play Type (k HP)1
Source: Energy Information Administration
Note: Excludes offshore units in the Gulf of Mexico. 1 Horsepower reported as original equipment manufacturer (OEM) horsepower as of June 30, 2015.
© 2015 Archrock, Inc. All rights reserved.
ARCHROCK OPERATING UNITS
HP by Application (k HP)1
Gathering1,95454%
Wellhead72420%
Gas Lift65118%
Other2898%
Non -Conventional
2,09858%
Conventional1,19433%
Offshore2176%
Other1093%

14
0,169,224
0,0,0
151,153,155
0,73,118
0,130,186
45,204,211
Stability of Business Model
Fee-based compression services provide stable cash flow
Services Revenue and Oil & Gas Prices1,2
© 2015 Archrock, Inc. All rights reserved.
(100)%
(50)%
0 %
50 %
100 %
150 %
200 %
$0
$100
$200
$300
$400
$500
$600
$700
$800
$900
2009 2010 2011 2012 2013 2014 LTM Q2-15
Ind
exe
d to
12/3
1/0
8R
ev
en
ue
($
in
mil
lio
ns
)
Contract Operations Aftermarket Services Henry Hub WTI Cushing
Note: LTM data should not be relied upon as being indicative of full year 2015 or future results.
1 Henry Hub indexed to $5.63 per million BTU at December 31, 2008; WTI indexed to $44.60 per barrel at December 31, 2008. Prices presented through June 30, 2015.
2 In December 2013, we abandoned our contract water treatment business. All periods exclude results from our contract water treatment business.

15
0,169,224
0,0,0
151,153,155
0,73,118
0,130,186
45,204,211
$7.91$8.43 $8.37 $8.45
$8.78$9.10 $8.87
$9.82 $10.00
$10.60
$9.58$9.92 $9.84
$10.42 $10.30 $10.50$10.79 $10.68
$0.00
$2.00
$4.00
$6.00
$8.00
$10.00
$12.00
Q1-11 Q2-11 Q3-11 Q4-11 Q1-12 Q2-12 Q3-12 Q4-12 Q1-13 Q2-13³ Q3-13 Q4-13 Q1-14 Q2-14 Q3-14 Q4-14 Q1-15 Q2-15
Contribution from Operation of Two Processing Plants Contribution from Sale of Two Processing Plants
Archrock’s Favorable Profitability Trend
Gross Margin per Horsepower per Month1,2
Archrock gross margin per horsepower benefitted from profit improvement initiatives and fleet
high grading from the MidCon acquisitions
1 See Addendum I for information on gross margin and gross margin per horsepower. 2 Excludes discontinued operations related to Archrock’s contract water treatment business. 3 A customer’s exercise of purchase options on two natural gas processing plants increased gross margin per horsepower per month by $0.75 in the second quarter 2013.
© 2015 Archrock, Inc. All rights reserved.

16
0,169,224
0,0,0
151,153,155
0,73,118
0,130,186
45,204,211
Proven Profitability of AMS Business
AMS Gross Margin1
Note: LTM data should not be relied upon as being indicative of full year 2015 or future results. 1 See Addendum I for information on gross margin and gross margin percentage.
© 2015 Archrock, Inc. All rights reserved.
Gross Margin Percentage1
$ 28
$ 45 $ 46
$ 42 $ 42
$ 0
$ 10
$ 20
$ 30
$ 40
$ 50
2011 2012 2013 2014 LTM Q2-15
($ in
mil
lio
ns
)
13 %
18 %
20 %
18 % 19 %
0 %
5 %
10 %
15 %
20 %
25 %
2011 2012 2013 2014 LTM Q2-15

17
0,169,224
0,0,0
151,153,155
0,73,118
0,130,186
45,204,211
Proven Track Record of Growing Margins
Archrock Gross Margin1 Archrock Partners EBITDA, as further adjusted2
Our financial results have benefitted from growth and performance improvement initiatives
© 2015 Archrock, Inc. All rights reserved.
$ 277 $ 311
$ 345
$ 413 $ 460
$ 28
$ 45
$ 46
$ 42
$ 42
$ 305
$ 356
$ 391
$ 455
$ 502
$ 0
$ 100
$ 200
$ 300
$ 400
$ 500
$ 600
2011 2012 2013 2014 LTM Q2-15
($ in
mil
lio
ns
)
Contract Operations Aftermarket Services
$ 107
$ 156
$ 214
$ 266
$ 311
$ 32
$ 25
$ 25
$ 14
$ 6
$ 140
$ 181
$ 239
$ 280
$ 318
$ 0
$ 50
$ 100
$ 150
$ 200
$ 250
$ 300
$ 350
2011 2012 2013 2014 LTM Q2-15
($ in
millio
ns)
Cost Caps provided by AROC EBITDA, as further adjusted²
Note: LTM data should not be relied upon as being indicative of full year 2015 or future results. 1 See Addendum I for information on gross margin. Archrock historical gross margin was derived from the reported Exterran Holdings segment gross margin of North America
Contract Operations and Aftermarket Services less International Aftermarket Services gross margin. 2 See Addendum I for information on Archrock Partners EBITDA, as further adjusted.

0,169,224
0,0,0
151,153,155
0,73,118
0,130,186
45,204,211
18
Overview of Growth Strategies
© 2015 Archrock, Inc. All rights reserved.
Demonstrated track record of executing growth strategies
Organic Growth
and Operational
Enhancements
Drop Down
Growth
Third Party
Acquisitions
~800k HP of new units added to combined AROC/APLP fleet in last ~5 years
Continued focus on improving profitability of fleet
Ongoing enhancement of field operations management has lowered operating costs and
improved competitiveness of the fleet
Successfully executed a drop down of contract compression assets in
2015
Archrock’s strategy to drop down additional contract compression
assets to Archrock Partners
Demonstrated ability to source and execute
deals with MidCon acquisitions
Opportunity to source from customers and
competitors
Distribution / Dividend Growth

19
0,169,224
0,0,0
151,153,155
0,73,118
0,130,186
45,204,211
$5 $6 $9
$15 $19
$24 $25
$41
$43
$49
$29 $31
$50
$58
$68
$0
$10
$20
$30
$40
$50
$60
$70
$80
2011 2012 2013 2014 H1-15 Annualized
($ i
n m
illi
on
s)
GP Interest LP Interest
0.78x
1.02x1.13x
1.07x
1.22x 1.24x
1.41x 1.42x
1.24x
1.22x
1.29x1.36x
1.22x1.26x
1.31x
1.51x
1.42x
1.24x
0.00x
0.20x
0.40x
0.60x
0.80x
1.00x
1.20x
1.40x
1.60x
1.80x
2011 2012 2013 1Q14 2Q14 3Q14 4Q14 1Q15 2Q15
Excluding Cost Caps Including Cost Caps
APLP Distributions & Coverage
Distributable Cash Flow Coverage1 Distributions Declared to AROC
1 See Addendum I for information on distributable cash flow and distributable cash flow coverage. 2 1Q14 pro forma for acquisition of compression assets from MidCon Compression LLC closed April 10, 2014. 3 Distribution levels with respect to future quarters have not been declared and will be determined by the board of the managing general partner of APLP.
© 2015 Archrock, Inc. All rights reserved.
2
Improvement in fleet profitability has led to strengthened coverage ratios at APLP &
increased distribution to AROC
3

0,169,224
0,0,0
151,153,155
0,73,118
0,130,186
45,204,211
20
Archrock Is Leveraged to Growth at APLP
APLP GP Growth Is ~6.6x APLP LP Distribution Growth (At Current APLP Level)
APLP GP Distribution Leveraged to Underlying LP
Distribution Growth
APLP GP Distribution Also Grows as APLP Unit Count
Grows
Note: Starting LP Distribution is $0.5675 / unit for Q2-2015 annualized. 1 Assumes an illustrative issuance price of $20.00 / unit.
© 2015 Archrock, Inc. All rights reserved.
33 %
66 %
99 %
132 %
165 %
198 %
0 %
50 %
100 %
150 %
200 %
250 %
0 % 5 % 10 % 15 % 20 % 25 % 30 %
Gro
wth
in
ID
R D
istr
ibu
tio
ns
APLP LP Distribution Growth
GP Multiplier ~6.6x
8 %
17 %
25 %
33 %
0 %
10 %
20 %
30 %
40 %
50 %
$0 $100 $200 $300 $400 $500
Gro
wth
in
ID
R D
istr
ibu
tio
ns
APLP Equity Issuance¹
42 %

0,169,224
0,0,0
151,153,155
0,73,118
0,130,186
45,204,211
21
Enhanced Credit Profile
Liquidity Profile
Debt Maturity Profile
1 Reflects expected balances as of spin-off closing date. Excludes $10mm to $15mm of transaction-related expenses related to the completion of the spin-off that Archrock expects
to incur in the fourth quarter and letters of credit. 2 Reflects balances outstanding as of June 30, 2015.
With our enhanced operating and financial positions, we believe that we are well-positioned to both navigate
commodity price cycles and take advantage of long-term secular growth opportunities
© 2015 Archrock, Inc. All rights reserved.
Highlights
• Limited near term reliance on public markets (debt or equity)
− Ample liquidity at Archrock companies
− No near term maturities
− Free cash flow positive at AROC
• Will opportunistically term out debt as markets allow
• Committed to maintaining leverage and liquidity metrics that allow
Archrock to execute on growth strategies through the cycle
$0
AROC RCF APLP RCF
APLP Term Loan APLP Notes
Archrock Standalone PF Liquidity¹
Revolving credit facility capacity $ 350
Borrowings under facility (160)
Cash 0
Liquidity at Archrock Standalone $ 190
Archrock Partners PF Liquidity²
Revolving credit facility capacity $ 900
Borrowings under facility (542)
Cash 0
Liquidity at Archrock Partners $ 359
Total Liquidity of Archrock Companies $ 549
$150
$542
$359
$160
$190
$1,050
$350 $350 $350
$0
$200
$400
$600
$800
$1,000
$1,200
2015 2016 2017 2018 2019 2020 2021 2022 2023
($ in
mill
ion
s)
0,169,224
0,0,0
151,153,155
0,73,118
0,130,186
45,204,211
22 © 2015 Archrock, Inc. All rights reserved.
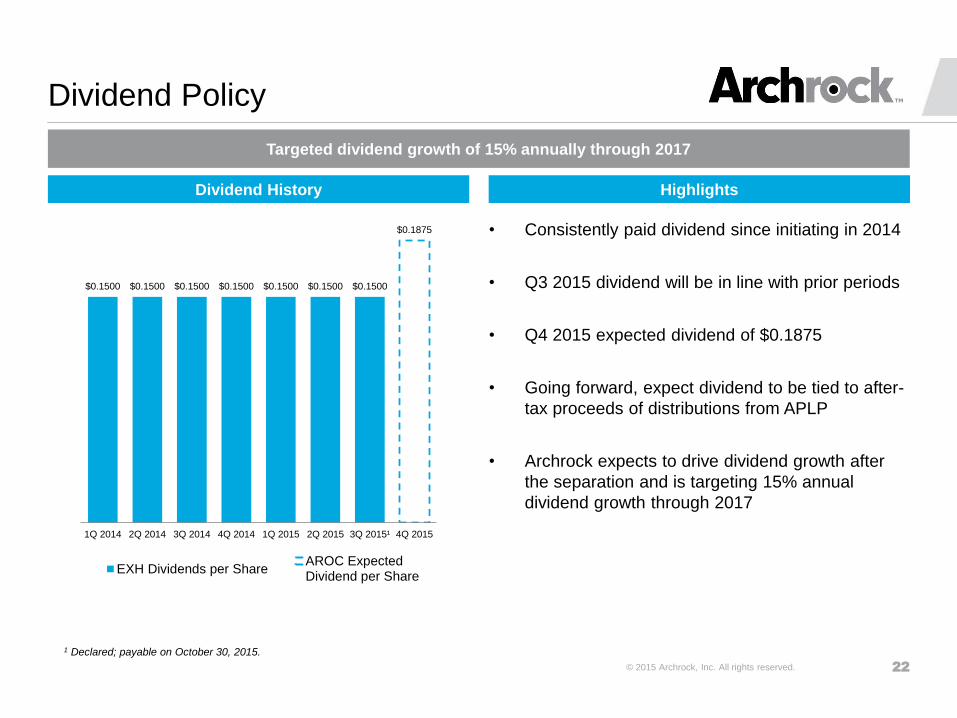
• Consistently paid dividend since initiating in 2014
• Q3 2015 dividend will be in line with prior periods
• Q4 2015 expected dividend of $0.1875
• Going forward, expect dividend to be tied to after-
tax proceeds of distributions from APLP
• Archrock expects to drive dividend growth after
the separation and is targeting 15% annual
dividend growth through 2017
Dividend Policy
Dividend History Highlights
Targeted dividend growth of 15% annually through 2017
AROC ExpectedDividend per Share
$0.1500 $0.1500 $0.1500 $0.1500 $0.1500 $0.1500 $0.1500
$0.1875
1Q 2014 2Q 2014 3Q 2014 4Q 2014 1Q 2015 2Q 2015 3Q 2015¹ 4Q 2015
1 Declared; payable on October 30, 2015.
EXH Dividends per Share

0,169,224
0,0,0
151,153,155
0,73,118
0,130,186
45,204,211
23
Q3 Update
© 2015 Archrock, Inc. All rights reserved.
1 Full financial results for 3Q 2015 are not yet available and are subject to finalization by management and review by Archrock’s and Archrock Partners’ independent auditors.
($ in millions) Archrock
North American Contract Operations Revenues $191 - 193
North American Aftermarket Services Revenues $56 - 58
Total Revenues $247 - 251
North American Contract Operations Gross Margin % 58 - 60%
North American Aftermarket Services Gross Margin % 19 - 21%
End of Period Operating HP (in '000s) 3,575 - 3,585
($ in millions) Archrock Partners
Revenue $162 - 164
Gross Margin % 60 - 61%
End of Period Operating HP (in '000s) 3,100 - 3,110
Archrock Growth Capex $165 - 175
Archrock Maintenance Capex $70 - 75
Archrock Partners Growth Capex $165 - 175
Archrock Partners Maintenance Capex $50 - 55
2015 Annual Capex Guidance
Expected Financial Results Ranges for Q3 2015¹

0,169,224
0,0,0
151,153,155
0,73,118
0,130,186
45,204,211
24
Key Archrock Investment Highlights
© 2015 Archrock, Inc. All rights reserved.
Conservatively
Capitalized
Largest Fleet
Deployed to
Major Basins
Cash Flow
Stability
Optimized
Structure for
Growth
Visible Growth

0,169,224
0,0,0
151,153,155
0,73,118
0,130,186
45,204,211
25 © 2015 Archrock, Inc. All rights reserved.
Addendum I: Non-GAAP Financial Measures

0,169,224
0,0,0
151,153,155
0,73,118
0,130,186
45,204,211
26 © 2015 Archrock, Inc. All rights reserved.
Non-GAAP Financial Measures
Archrock, Inc. (Exterran Holdings, Inc. pre-spin):
Gross margin, a non-GAAP measure, is defined as total revenue less cost of sales (excluding depreciation and amortization expense). Gross margin
percentage is defined as gross margin divided by revenue.
Archrock Partners, L.P. (Exterran Partners, L.P. pre-spin):
EBITDA, as further adjusted, a non-GAAP measure, is defined as net income (loss) (a) excluding income taxes, interest expense (including debt
extinguishment costs and gain or loss on termination of interest rate swaps), depreciation and amortization expense, impairment charges, restructuring
charges, expensed acquisition costs, other items and non-cash selling, general and administrative (“SG&A”) costs (b) plus the amounts reimbursed to us by
Archrock as a result of caps on cost of sales and SG&A costs provided in the omnibus agreement to which Archrock and Archrock Partners are parties (the
“Omnibus Agreement”), which amounts are treated as capital contributions from Archrock for accounting purposes.
EBITDA, as further adjusted (without the benefit of the cost caps) is defined as EBITDA, as further adjusted, less the amounts reimbursed to us by Archrock as
a result of caps on cost of sales and SG&A costs provided in the Omnibus Agreement.
Distributable cash flow, a non-GAAP measure, is defined as net income (loss) (a) plus depreciation and amortization expense, impairment charges,
restructuring charges, expensed acquisition costs, non-cash SG&A costs, interest expense and any amounts reimbursed to us by Archrock as a result of the
caps on cost of sales and SG&A costs provided in the Omnibus Agreement, which amounts are treated as capital contributions from Archrock for accounting
purposes, (b) less cash interest expense (excluding amortization of deferred financing fees, amortization of debt discount and non-cash transactions related to
interest rate swaps) and maintenance capital expenditures, and (c) excluding gains or losses on asset sales and other items.
Distributable cash flow (without the benefit of cost caps) is defined as distributable cash flow less the amounts reimbursed to us by Archrock as a result of caps
on cost of sales and SG&A costs provided in the Omnibus Agreement.
Gross margin, a non-GAAP measure, is defined as total revenue less cost of sales (excluding depreciation and amortization expense).
Addendum I-A

0,169,224
0,0,0
151,153,155
0,73,118
0,130,186
45,204,211
27 © 2015 Archrock, Inc. All rights reserved.
Non-GAAP Financial Measures Archrock, Inc. (Exterran Holdings, Inc. pre-spin)1
1 Historical stand alone financial statements have not been prepared for Archrock, Inc. The amounts presented as Archrock revenue and gross margin for all periods have been
derived exclusively from the historical financial records of Exterran Holdings. Exterran Holdings’ North America contract operations and North America aftermarket services represent
the businesses of Archrock, Inc. Following the completion of the spin-off, historical amounts related to the international contract operations, international aftermarket services and
fabrication businesses will be reclassified to discontinued operations in the Archrock financial statements. 2 See Addendum I-A for more information on gross margin and gross margin percentage.
Addendum I-B
($ in millions)
Q1-11 Q2-11 Q3-11 Q4-11 Q1-12 Q2-12 Q3-12 Q4-12 Q1-13 Q2-13 Q3-13 Q4-13 Q1-14 Q2-14 Q3-14 Q4-14 Q1-15 Q2-15
Revenues
North America Contract Operations $142.1 $142.1 $143.1 $143.4 $147.3 $146.4 $149.5 $152.8 $158.0 $162.2 $152.6 $155.1 $156.5 $181.9 $191.0 $199.6 $202.3 $198.3
International Contract Operations 105.7 110.9 113.8 114.7 112.8 112.6 110.6 127.9 109.6 117.9 117.5 131.0 111.0 134.4 124.4 124.1 120.7 115.3
Aftermarket Services - North America 43.7 49.7 49.6 66.1 54.4 62.4 60.4 63.6 51.0 63.9 59.1 61.0 53.2 57.2 56.5 63.2 50.6 56.8
Aftermarket Services - International 30.7 35.1 46.1 50.4 35.2 39.5 35.4 34.8 32.7 35.5 43.1 49.4 34.8 43.1 39.6 45.2 36.2 34.0
Fabrication 280.0 301.7 332.7 311.0 262.2 267.6 360.7 457.9 458.8 456.5 403.3 342.5 287.4 322.6 312.5 361.6 319.3 279.5
Total $602.2 $639.6 $685.2 $685.6 $611.9 $628.6 $716.7 $837.1 $809.9 $835.9 $775.6 $739.0 $643.0 $739.3 $723.8 $793.6 $729.1 $683.8
Expenses
North America Contract Operations $76.1 $71.7 $73.4 $72.6 $72.8 $69.4 $74.2 $68.3 $71.1 $70.5 $70.9 $70.0 $71.1 $77.5 $82.5 $85.1 $82.7 $81.2
International Contract Operations 41.0 49.8 48.2 45.4 43.9 47.1 46.3 47.4 46.2 50.0 50.6 50.1 41.0 46.5 48.0 49.9 44.3 44.7
Aftermarket Services - North America 39.1 44.1 42.0 56.3 44.5 49.0 50.7 52.1 40.8 50.4 47.5 49.8 42.8 47.1 45.3 53.0 40.8 45.8
Aftermarket Services - International 25.6 33.5 33.8 37.3 27.2 28.5 25.1 26.4 24.7 27.5 33.3 35.4 25.0 32.2 30.2 32.8 25.2 24.3
Fabrication 239.3 269.4 303.3 290.3 235.6 241.4 310.8 404.2 402.4 381.6 328.4 296.2 229.6 280.0 251.4 297.5 267.1 240.9
Total $421.0 $468.5 $500.7 $502.0 $424.0 $435.4 $507.1 $598.4 $585.2 $580.0 $530.7 $501.6 $409.5 $483.3 $457.3 $518.3 $460.1 $437.0
Gross Margin2
North America Contract Operations $66.1 $70.4 $69.7 $70.8 $74.5 $77.0 $75.3 $84.5 $86.8 $91.7 $81.8 $85.1 $85.4 $104.4 $108.5 $114.5 $119.6 $117.0
International Contract Operations 64.7 61.2 65.5 69.2 68.9 65.5 64.4 80.5 63.4 67.9 66.9 80.9 70.0 87.9 76.4 74.2 76.4 70.5
Aftermarket Services - North America 4.6 5.6 7.6 9.8 9.9 13.4 9.7 11.5 10.2 13.5 11.6 11.2 10.4 10.1 11.1 10.2 9.8 11.0
Aftermarket Services - International 5.1 1.6 12.2 13.0 8.0 11.0 10.3 8.4 8.0 8.0 9.8 14.0 9.8 11.0 9.4 12.4 11.1 9.7
Fabrication 40.8 32.4 29.4 20.7 26.6 26.3 49.9 53.6 56.4 74.9 74.9 46.3 57.8 42.6 61.1 64.1 52.2 38.6
Total $181.2 $171.1 $184.5 $183.6 $187.9 $193.2 $209.6 $238.6 $224.7 $255.9 $244.9 $237.5 $233.5 $256.0 $266.5 $275.3 $269.0 $246.8
Gross Margin Percentage2
North America Contract Operations 46% 50% 49% 49% 51% 53% 50% 55% 55% 57% 54% 55% 55% 57% 57% 57% 59% 59%
International Contract Operations 61% 55% 58% 60% 61% 58% 58% 63% 58% 58% 57% 62% 63% 65% 61% 60% 63% 61%
Aftermarket Services - North America 10% 11% 15% 15% 18% 21% 16% 18% 20% 21% 20% 18% 20% 18% 20% 16% 19% 19%
Aftermarket Services - International 17% 5% 27% 26% 23% 28% 29% 24% 24% 22% 23% 28% 28% 25% 24% 27% 31% 29%
Fabrication 15% 11% 9% 7% 10% 10% 14% 12% 12% 16% 19% 14% 20% 13% 20% 18% 16% 14%
Total 30% 27% 27% 27% 31% 31% 29% 29% 28% 31% 32% 32% 36% 35% 37% 35% 37% 36%

0,169,224
0,0,0
151,153,155
0,73,118
0,130,186
45,204,211
28 © 2015 Archrock, Inc. All rights reserved.
Non-GAAP Financial Measures Archrock, Inc. (Exterran Holdings, Inc. pre-spin)1
1 Historical stand alone financial statements have not been prepared for Archrock, Inc. The amounts presented as Archrock revenue and gross margin for all periods have been
derived exclusively from the historical financial records of Exterran Holdings. Exterran Holdings’ North America contract operations and North America aftermarket services represent
the businesses of Archrock, Inc. Following the completion of the spin-off, historical amounts related to the international contract operations, international aftermarket services and
fabrication businesses will be reclassified to discontinued operations in the Archrock financial statements. 2 See Addendum I-A for more information on gross margin and gross margin percentage.
Addendum I-C
($ in millions)
2010 2011 2012 2013 2014
Revenues
North America Contract Operations 568.9$ 570.8$ 596.0$ 627.8$ 729.1$
International Contract Operations 465.1 445.1 464.0 476.0 493.9
Aftermarket Services - North America 173.2 209.1 240.8 234.9 230.1
Aftermarket Services - International 120.6 162.3 145.0 160.7 162.7
Fabrication 1,066.2 1,225.5 1,348.4 1,660.9 1,284.0
Total 2,394.0$ 2,612.6$ 2,794.2$ 3,160.4$ 2,899.7$
Expenses
North America Contract Operations 280.9$ 293.8$ 284.7$ 282.5$ 316.1$
International Contract Operations 175.4 184.4 184.6 196.9 185.4
Aftermarket Services - North America 150.7 181.5 196.3 188.5 188.3
Aftermarket Services - International 97.7 130.2 107.3 120.9 120.2
Fabrication 904.7 1,102.2 1,191.9 1,408.5 1,058.5
Total 1,609.3$ 1,892.2$ 1,964.8$ 2,197.4$ 1,868.4$
Gross Margin2
North America Contract Operations 288.1$ 277.0$ 311.3$ 345.4$ 413.0$
International Contract Operations 289.8 260.7 279.3 279.1 308.4
Aftermarket Services - North America 22.5 27.6 44.5 46.4 41.8
Aftermarket Services - International 22.9 32.0 37.8 39.7 42.5
Fabrication 161.5 123.2 156.5 252.4 225.5
Total 784.7$ 720.4$ 829.4$ 963.0$ 1,031.3$
Gross Margin Percentage2
North America Contract Operations 51% 49% 52% 55% 57%
International Contract Operations 62% 59% 60% 59% 62%
Aftermarket Services - North America 13% 13% 18% 20% 18%
Aftermarket Services - International 19% 20% 26% 25% 26%
Fabrication 15% 10% 12% 15% 18%
Total 33% 28% 30% 30% 36%

0,169,224
0,0,0
151,153,155
0,73,118
0,130,186
45,204,211
29 © 2015 Archrock, Inc. All rights reserved.
Non-GAAP Financial Measures Archrock, Inc. (Exterran Holdings, Inc. pre-spin)
1 See Addendum I-A for more information on gross margin and gross margin percentage.
Addendum I-D
(in thousands, except per HP amounts) 1Q 11 2Q 11 3Q 11 4Q 11 1Q 12 2Q 12 3Q 12 4Q 12 1Q 13 2Q 13 3Q 13 4Q 13
NACO Gross margin1
66,079$ 70,364$ 69,744$ 70,783$ 74,502$ 77,015$ 75,267$ 84,524$ 86,840$ 91,694$ 81,750$ 85,071$
NACO Average Operating Horsepower 2,783 2,782 2,776 2,793 2,827 2,820 2,830 2,870 2,895 2,884 2,845 2,860
Gross margin per Horsepower per Quarter 23.74$ 25.29$ 25.12$ 25.34$ 26.35$ 27.31$ 26.60$ 29.45$ 30.00$ 31.79$ 28.73$ 29.75$
Gross margin per Horsepower per Month 7.91 8.43 8.37 8.45 8.78 9.10 8.87 9.82 10.00 10.60 9.58 9.92
1Q 14 2Q 14 3Q 14 4Q 14 1Q 15 2Q 15
NACO Gross margin1
85,442$ 104,426$ 108,547$ 114,546$ 119,582$ 117,038$
NACO Average Operating Horsepower 2,894 3,340 3,514 3,638 3,695 3,652
Gross margin per Horsepower per Quarter 29.52$ 31.27$ 30.89$ 31.49$ 32.36$ 32.05$
Gross margin per Horsepower per Month 9.84 10.42 10.30 10.50 10.79 10.68

0,169,224
0,0,0
151,153,155
0,73,118
0,130,186
45,204,211
30 © 2015 Archrock, Inc. All rights reserved.
Non-GAAP Financial Measures Archrock, Inc. (Exterran Holdings, Inc. pre-spin)1
1 Historical stand alone financial statements have not been prepared for Archrock, Inc. The amounts presented as Archrock revenue and gross margin for all periods have been
derived exclusively from the historical financial records of Exterran Holdings. Exterran Holdings’ North America contract operations and North America aftermarket services represent
the businesses of Archrock, Inc. Following the completion of the spin-off, historical amounts related to the international contract operations, international aftermarket services and
fabrication businesses will be reclassified to discontinued operations in the Archrock financial statements. 2 See Addendum I-A for more information on gross margin and gross margin percentage.
Addendum I-E
2010 Q1-11 Q2-11 Q3-11 Q4-11 Q1-12 Q2-12 Q3-12 Q4-12 Q1-13 Q2-13 Q3-13 Q4-13 Q1-14 Q2-14 Q3-14 Q4-14 Q1-15 Q2-15
($ millions)
Net income (loss) ($113.2) ($30.5) ($30.2) ($214.5) ($64.4) $7.3 ($166.9) $119.3 $3.1 $58.8 $24.5 $45.3 $27.2 $34.9 $20.9 $42.2 $28.0 $41.1 $7.8
Selling, general and administrative 350.7 89.3 90.4 89.0 83.5 94.7 94.0 85.4 101.6 84.9 91.0 93.6 88.7 92.6 95.7 94.8 94.7 86.7 83.9
Depreciation and amortization 387.6 87.2 89.4 87.7 88.5 84.1 87.9 84.2 90.1 82.6 80.8 81.3 82.8 85.5 112.0 98.3 90.3 95.8 94.3
Long-lived asset impairment 143.9 0.0 2.1 1.8 2.2 4.1 128.5 3.2 0.8 3.6 16.6 4.6 3.9 3.8 9.8 12.4 20.6 12.7 15.4
Restructuring charges (0.0) 0.0 0.0 2.9 8.7 2.9 1.3 1.5 0.8 0.0 0.0 0.0 0.0 4.8 0.4 0.2 2.2 4.8 19.6
Goodwill impairment 0.0 0.0 0.0 196.1 0.7 0.0 0.0 0.0 (0.0) 0.0 0.0 0.0 0.0 0.0 0.0 0.0 0.0 0.0 0.0
Interest expense 136.1 37.2 34.6 38.7 39.0 38.0 37.0 31.7 27.7 27.9 30.3 28.9 28.7 28.3 32.7 25.7 27.4 27.3 28.4
Equity in (income) loss of non-consolidated affiliates 0.6 0.0 0.0 0.3 0.2 (37.3) (4.7) (4.8) (4.6) (4.7) (4.7) (4.8) (4.8) (4.7) (4.9) (5.0) 0.0 (5.0) (5.1)
Other (income) expense, net (11.5) (0.1) (2.9) 12.8 (15.4) (6.1) 8.8 (1.4) (0.8) (9.8) (7.2) (5.5) (2.0) (2.4) (3.7) 4.7 3.2 7.8 1.0
Provision for (benefit from) income taxes (64.6) (4.2) (14.6) (29.2) 36.2 (1.3) (34.8) 1.4 (11.0) 15.0 23.6 16.7 29.4 9.4 10.9 11.2 27.2 16.5 1.7
(Income) loss from discontinued operations, net of tax (44.9) 2.3 2.3 (1.1) 4.4 1.6 42.2 (110.9) 31.1 (33.5) 1.1 (15.1) (16.5) (18.7) (17.8) (18.0) (18.2) (18.7) (0.3)
Gross margin² $784.7 $181.2 $171.1 $184.5 $183.6 $187.9 $193.2 $209.6 $238.6 $224.7 $255.9 $244.9 $237.5 $233.5 $256.0 $266.5 $275.3 $269.0 $246.8

0,169,224
0,0,0
151,153,155
0,73,118
0,130,186
45,204,211
31 © 2015 Archrock, Inc. All rights reserved.
Non-GAAP Financial Measures Archrock Partners, L.P. (Exterran Partners, L.P. pre-spin)
1 See Addendum I-A for information on gross margin, EBITDA, as further adjusted, EBITDA, as further adjusted (without the benefit of the cost caps), distributable cash flow and
distributable cash flow (without the benefit of the cost caps). 2 Consists of a cash reimbursement from Archrock of non-cash merger-related expenses incurred by Archrock Partners. 3 Defined as distributable cash flow divided by distributions declared to all unit holders for the period, including incentive distributions rights. 4 Provisions in the Omnibus Agreement that provided caps on our obligation to reimburse Archrock for operating and SG&A expenses terminated on December 31, 2014. Excluding
the benefit of the cost caps from our previously defined non-GAAP measures of EBITDA, as further adjusted, and distributable cash flow provides external users of our consolidated
financial statements comparable measures to assess operating performance in the current year period with operating performance in the prior year periods.
Addendum I-F
($ in thousands) 2007 2008 2009 2010 2011 2012 2013 2014
Net income (loss) 19,401$ 29,847$ 14,784$ (23,333)$ 6,053$ 10,509$ 64,023$ 61,719$
Depreciation and amortization 16,570 27,053 36,452 52,518 67,930 88,298 103,711 128,196
Long-lived asset impairment - - 3,151 24,976 1,060 29,560 5,350 12,810
Restructuring charges - - - - - - - 702
Selling, general and administrative 13,730 16,085 24,226 34,830 39,380 49,889 61,971 80,521
Interest expense 11,658 18,039 20,303 24,037 30,400 25,167 37,068 57,811
Other (income) expense, net (22) (1,430) (1,208) (314) (392) (35) (9,481) (74)
Provision for (benefit from) income taxes 272 555 541 680 918 945 1,506 1,313
Gross margin1
61,609 90,149 98,249 113,394 145,349 204,333 264,148 342,998
Cap on operating costs provided by Exterran Holdings ("EXH") 8,618 12,480 7,246 21,404 26,492 16,562 12,382 2,536
Cap on selling, general and administrative costs provided by EXH 283 120 552 3,316 5,905 8,196 12,798 11,314
Non-cash selling, general and administrative costs 3,184 (2,090) 811 1,209 532 797 1,174 1,376
Expensed acquisition costs (in Other (income) expense, net) - - 803 356 514 695 821 2,471
Plus: Non-recurring cash selling, general and administrative reimbursement2
(848) - - - - - - -
Less: Selling, general and administrative (13,730) (16,085) (24,226) (34,830) (39,380) (49,889) (61,971) (80,521)
Less: Other income (expense), net 22 1,430 1,208 314 392 35 9,481 74
EBITDA, as further adjusted1
59,138 86,004 84,643 105,163 139,804 180,729 238,833 280,248
Less: (Provision for) benefit from income taxes (272) (555) (541) (680) (918) (945) (1,506) (1,313)
Less: Gain on sale of property, plant and equipment (in Other (income) expense,
net) - (1,435) (2,011) (667) (919) (689) (10,140) (2,466)
Less: Cash interest expense (11,258) (17,567) (19,697) (21,087) (18,822) (22,761) (32,810) (53,525)
Less: Maintenance capital expenditures (7,079) (9,451) (12,585) (15,898) (28,861) (38,368) (41,401) (45,316)
Distributable cash flow1
40,529$ 56,996$ 49,809$ 66,831$ 90,284$ 117,966$ 152,976$ 177,628$
Distributions declared to all unitholders for the period, including incentive
distribution rights 24,575$ 34,164$ 39,404$ 54,913$ 74,214$ 91,617$ 112,705$ 136,829$
Distributable cash flow coverage3
1.65x 1.67x 1.26x 1.22x 1.22x 1.29x 1.36x 1.30x
Distributable cash flow coverage (without the benefit of the cost caps)3,4
1.29x 1.30x 1.07x 0.77x 0.78x 1.02x 1.13x 1.20x
EBITDA, as further adjusted1
59,138$ 86,004$ 84,643$ 105,163$ 139,804$ 180,729$ 238,833$ 280,248$
Less: Cap on operating and selling, general and administrative costs provided by
EXH (8,901) (12,600) (7,798) (24,720) (32,397) (24,758) (25,180) (13,850)
EBITDA, as further adjusted (without the benefit of the cost caps)4
50,237$ 73,404$ 76,845$ 80,443$ 107,407$ 155,971$ 213,653$ 266,398$
Distributable cash flow1
40,529$ 56,996$ 49,809$ 66,831$ 90,284$ 117,966$ 152,976$ 177,628$
Less: Cap on operating and selling, general and administrative costs provided by
EXH (8,901) (12,600) (7,798) (24,720) (32,397) (24,758) (25,180) (13,850)
Distributable cash flow (without the benefit of the cost caps)4
31,628$ 44,396$ 42,011$ 42,111$ 57,887$ 93,208$ 127,796$ 163,778$

0,169,224
0,0,0
151,153,155
0,73,118
0,130,186
45,204,211
32 © 2015 Archrock, Inc. All rights reserved.
Non-GAAP Financial Measures Archrock Partners, L.P. (Exterran Partners, L.P. pre-spin)
1 See Addendum I-A for information on gross margin, EBITDA, as further adjusted, EBITDA, as further adjusted (without the benefit of the cost caps), distributable cash flow and
distributable cash flow (without the benefit of the cost caps). 2 Defined as distributable cash flow divided by distributions declared to all unit holders for the period, including incentive distribution rights.
3 Provisions in the Omnibus Agreement that provided caps on our obligation to reimburse Archrock for operating and SG&A expenses terminated on December 31, 2014. Excluding the
benefit of the cost caps from our previously defined non-GAAP measures of EBITDA, as further adjusted, and distributable cash flow provides external users of our consolidated
financial statements comparable measures to assess operating performance in the current year period with operating performance in the prior year periods.
Addendum I-G
($ in thousands) 1Q 11 2Q 11 3Q 11 4Q 11 1Q 12 2Q 12 3Q 12 4Q 12 1Q 13 2Q 13 3Q 13 4Q 13 1Q 14 2Q 14 3Q 14 4Q 14 1Q 15 2Q 15
Net income (loss) 223$ (1,938)$ 3,253$ 4,515$ 4,505$ (19,050)$ 10,380$ 14,674$ 14,733$ 27,896$ 10,035$ 11,359$ 6,939$ 17,752$ 18,103$ 18,925$ 20,085$ 22,327$
Depreciation and amortization 14,149 15,459 19,087 19,235 20,362 22,788 21,930 23,218 22,706 27,030 27,158 26,817 27,921 31,708 33,598 34,969 36,105 39,487
Long-lived asset impairment - 305 384 371 805 28,122 - 633 1,540 925 784 2,101 2,486 1,991 3,558 4,775 3,484 1,826
Restructuring charges - - - - - - - - - - - - 379 198 125 - - -
Selling, general and administrative 10,216 9,927 10,594 8,643 12,222 13,450 11,762 12,455 12,607 15,203 16,948 17,213 19,376 19,047 20,734 21,364 21,169 20,721
Interest expense 7,075 7,553 7,860 7,912 5,882 6,399 6,465 6,421 7,424 10,299 9,735 9,610 9,689 14,756 16,141 17,225 17,832 19,082
Other (income) expense, net (221) 455 (338) (288) 527 (261) (137) (164) (407) (7,270) (639) (1,165) 871 (134) (649) (162) (191) (1,512)
Provision for (benefit from) income taxes 235 256 242 185 281 277 272 115 407 561 309 229 182 541 (299) 889 643 (72)
Gross margin1
31,677 32,017 41,082 40,573 44,584 51,725 50,672 57,352 59,010 74,644 64,330 66,164 67,843 85,859 91,311 97,985 99,127 101,859
Cap on operating costs provided by Exterran Holdings ("EXH") 6,877 8,349 6,193 5,073 5,323 3,511 5,841 1,886 3,503 1,729 3,212 3,938 2,536 - - - - -
Cap on selling, general and administrative costs provided by EXH 2,252 1,851 1,802 - 2,482 2,810 1,090 1,815 1,854 2,368 4,164 4,412 3,620 1,399 2,685 3,610 - -
Non-cash selling, general and administrative costs 364 153 (207) 222 345 140 172 140 253 335 285 301 756 218 348 54 592 247
Expensed acquisition costs (in Other (income) expense, net) - 514 - - 695 - - - 575 - - 246 1,544 - 866 61 - 302
Less: Selling, general and administrative (10,216) (9,927) (10,594) (8,643) (12,222) (13,450) (11,762) (12,455) (12,607) (15,203) (16,948) (17,213) (19,376) (19,047) (20,734) (21,364) (21,169) (20,721)
Less: Other income (expense), net 221 (455) 338 288 (527) 261 137 164 407 7,270 639 1,165 (871) 134 649 162 191 1,512
EBITDA, as further adjusted1
31,175 32,502 38,614 37,513 40,680 44,997 46,150 48,902 52,995 71,143 55,682 59,013 56,052 68,563 75,125 80,508 78,741 83,199
Less: (Provision for) benefit from income taxes (235) (256) (242) (185) (281) (277) (272) (115) (407) (561) (309) (229) (182) (541) 299 (889) (643) 72
Less: Gain on sale of property, plant and equipment (in Other (income) expense, net) (212) (115) (319) (273) (174) (244) (127) (144) (935) (7,249) (614) (1,342) (673) (170) (1,414) (209) (280) (1,782)
Less: Cash interest expense (4,207) (4,652) (4,951) (5,012) (5,208) (5,718) (5,905) (5,930) (6,198) (9,036) (8,802) (8,774) (8,838) (13,563) (14,962) (16,162) (16,768) (17,893)
Less: Maintenance capital expenditures (5,457) (8,454) (7,382) (7,568) (8,117) (11,416) (10,345) (8,490) (8,349) (9,558) (12,675) (10,819) (10,216) (11,896) (13,366) (9,838) (10,079) (15,294)
Distributable cash flow1
21,064$ 19,025$ 25,720$ 24,475$ 26,900$ 27,342$ 29,501$ 34,223$ 37,106$ 44,739$ 33,282$ 37,849$ 36,143$ 42,393$ 45,682$ 53,410$ 50,971$ 48,302$
Distributions declared to all unitholders for the period, including incentive distribution rights 16,243$ 19,061$ 19,322$ 19,581$ 22,480$ 22,762$ 23,044$ 23,331$ 27,598$ 27,927$ 28,340$ 28,840$ 33,093$ 33,649$ 34,764$ 35,323$ 35,903$ 39,084$
Distributable cash flow coverage² 1.30x 1.00x 1.33x 1.25x 1.20x 1.20x 1.28x 1.47x 1.34x 1.60x 1.17x 1.31x 1.09x 1.26x 1.31x 1.51x 1.42x 1.24x
Distributable cash flow coverage (without the benefit of the cost caps)2,3
0.73x 0.46x 0.92x 0.99x 0.85x 0.92x 0.98x 1.31x 1.15x 1.46x 0.91x 1.02x 0.91x 1.22x 1.24x 1.41x 1.42x 1.24x
EBITDA, as further adjusted1
31,175$ 32,502$ 38,614$ 37,513$ 40,680$ 44,997$ 46,150$ 48,902$ 52,995$ 71,143$ 55,682$ 59,013$ 56,052$ 68,563$ 75,125$ 80,508$ 78,741$ 83,199$
Less: Cap on operating and selling, general and administrative costs provided by EXH (9,129) (10,200) (7,995) (5,073) (7,805) (6,321) (6,931) (3,701) (5,357) (4,097) (7,376) (8,350) (6,156) (1,399) (2,685) (3,610) - -
EBITDA, as further adjusted (without the benefit of the cost caps)3
22,046$ 22,302$ 30,619$ 32,440$ 32,875$ 38,676$ 39,219$ 45,201$ 47,638$ 67,046$ 48,306$ 50,663$ 49,896$ 67,164$ 72,440$ 76,898$ 78,741$ 83,199$
Distributable cash flow1
21,064$ 19,025$ 25,720$ 24,475$ 26,900$ 27,342$ 29,501$ 34,223$ 37,106$ 44,739$ 33,282$ 37,849$ 36,143$ 42,393$ 45,682$ 53,410$ 50,971$ 48,302$
Less: Cap on operating and selling, general and administrative costs provided by EXH (9,129) (10,200) (7,995) (5,073) (7,805) (6,321) (6,931) (3,701) (5,357) (4,097) (7,376) (8,350) (6,156) (1,399) (2,685) (3,610) - -
Distributable cash flow (without the benefit of the cost caps)3
11,935$ 8,825$ 17,725$ 19,402$ 19,095$ 21,021$ 22,570$ 30,522$ 31,749$ 40,642$ 25,906$ 29,499$ 29,987$ 40,994$ 42,997$ 49,800$ 50,971$ 48,302$


