Intrinsic Clearance of Xenobiotic Chemicals by Liver ...
11
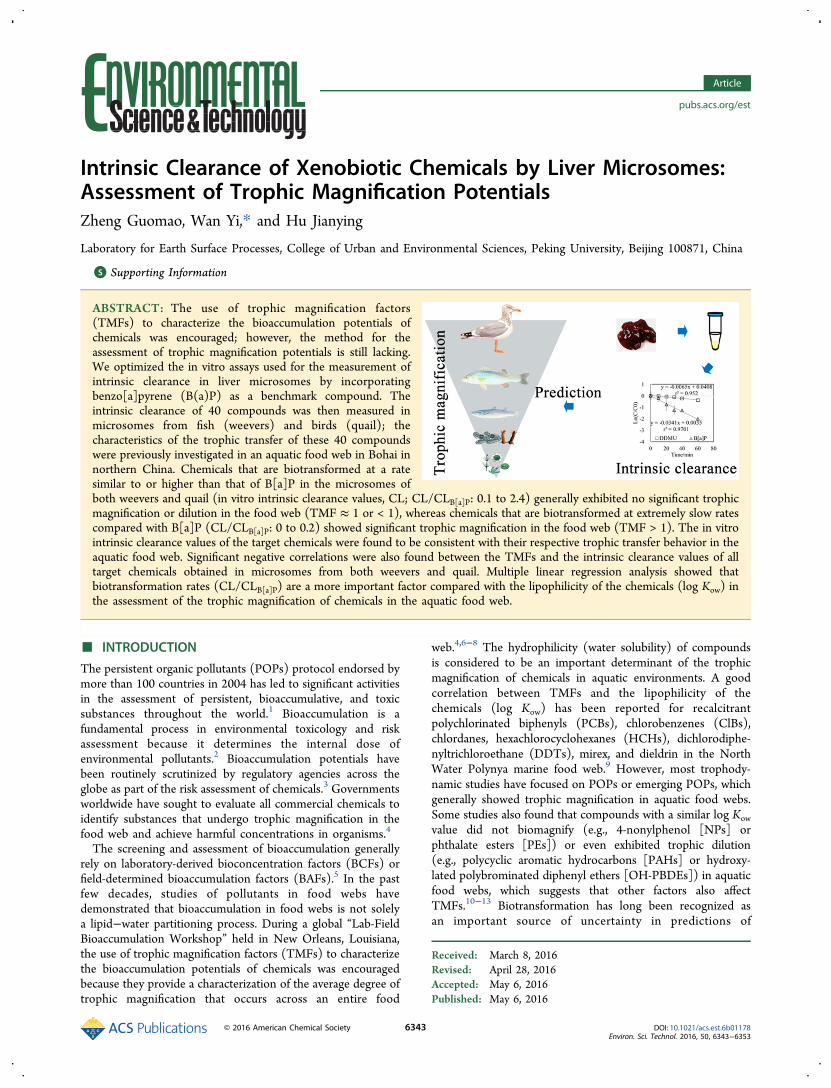
Intrinsic Clearance of Xenobiotic Chemicals by Liver Microsomes: Assessment of Trophic Magnification Potentials Zheng Guomao, Wan Yi,* and Hu Jianying Laboratory for Earth Surface Processes, College of Urban and Environmental Sciences, Peking University, Beijing 100871, China * S Supporting Information ABSTRACT: The use of trophic magnification factors (TMFs) to characterize the bioaccumulation potentials of chemicals was encouraged; however, the method for the assessment of trophic magnification potentials is still lacking. We optimized the in vitro assays used for the measurement of intrinsic clearance in liver microsomes by incorporating benzo[a]pyrene (B(a)P) as a benchmark compound. The intrinsic clearance of 40 compounds was then measured in microsomes from fish (weevers) and birds (quail); the characteristics of the trophic transfer of these 40 compounds were previously investigated in an aquatic food web in Bohai in northern China. Chemicals that are biotransformed at a rate similar to or higher than that of B[a]P in the microsomes of both weevers and quail (in vitro intrinsic clearance values, CL; CL/CL B[a]P : 0.1 to 2.4) generally exhibited no significant trophic magnification or dilution in the food web (TMF ≈ 1 or < 1), whereas chemicals that are biotransformed at extremely slow rates compared with B[a]P (CL/CL B[a]P : 0 to 0.2) showed significant trophic magnification in the food web (TMF > 1). The in vitro intrinsic clearance values of the target chemicals were found to be consistent with their respective trophic transfer behavior in the aquatic food web. Significant negative correlations were also found between the TMFs and the intrinsic clearance values of all target chemicals obtained in microsomes from both weevers and quail. Multiple linear regression analysis showed that biotransformation rates (CL/CL B[a]P ) are a more important factor compared with the lipophilicity of the chemicals (log K ow ) in the assessment of the trophic magnification of chemicals in the aquatic food web. ■ INTRODUCTION The persistent organic pollutants (POPs) protocol endorsed by more than 100 countries in 2004 has led to significant activities in the assessment of persistent, bioaccumulative, and toxic substances throughout the world. 1 Bioaccumulation is a fundamental process in environmental toxicology and risk assessment because it determines the internal dose of environmental pollutants. 2 Bioaccumulation potentials have been routinely scrutinized by regulatory agencies across the globe as part of the risk assessment of chemicals. 3 Governments worldwide have sought to evaluate all commercial chemicals to identify substances that undergo trophic magnification in the food web and achieve harmful concentrations in organisms. 4 The screening and assessment of bioaccumulation generally rely on laboratory-derived bioconcentration factors (BCFs) or field-determined bioaccumulation factors (BAFs). 5 In the past few decades, studies of pollutants in food webs have demonstrated that bioaccumulation in food webs is not solely a lipid−water partitioning process. During a global “Lab-Field Bioaccumulation Workshop” held in New Orleans, Louisiana, the use of trophic magnification factors (TMFs) to characterize the bioaccumulation potentials of chemicals was encouraged because they provide a characterization of the average degree of trophic magnification that occurs across an entire food web. 4,6−8 The hydrophilicity (water solubility) of compounds is considered to be an important determinant of the trophic magnification of chemicals in aquatic environments. A good correlation between TMFs and the lipophilicity of the chemicals (log K ow ) has been reported for recalcitrant polychlorinated biphenyls (PCBs), chlorobenzenes (ClBs), chlordanes, hexachlorocyclohexanes (HCHs), dichlorodiphe- nyltrichloroethane (DDTs), mirex, and dieldrin in the North Water Polynya marine food web. 9 However, most trophody- namic studies have focused on POPs or emerging POPs, which generally showed trophic magnification in aquatic food webs. Some studies also found that compounds with a similar log K ow value did not biomagnify (e.g., 4-nonylphenol [NPs] or phthalate esters [PEs]) or even exhibited trophic dilution (e.g., polycyclic aromatic hydrocarbons [PAHs] or hydroxy- lated polybrominated diphenyl ethers [OH-PBDEs]) in aquatic food webs, which suggests that other factors also affect TMFs. 10−13 Biotransformation has long been recognized as an important source of uncertainty in predictions of Received: March 8, 2016 Revised: April 28, 2016 Accepted: May 6, 2016 Published: May 6, 2016 Article pubs.acs.org/est © 2016 American Chemical Society 6343 DOI: 10.1021/acs.est.6b01178 Environ. Sci. Technol. 2016, 50, 6343−6353
Transcript of Intrinsic Clearance of Xenobiotic Chemicals by Liver ...
Intrinsic Clearance of Xenobiotic Chemicals by Liver Microsomes:Assessment of Trophic Magnification PotentialsZheng Guomao, Wan Yi,* and Hu Jianying
Laboratory for Earth Surface Processes, College of Urban and Environmental Sciences, Peking University, Beijing 100871, China
*S Supporting Information
ABSTRACT: The use of trophic magnification factors(TMFs) to characterize the bioaccumulation potentials ofchemicals was encouraged; however, the method for theassessment of trophic magnification potentials is still lacking.We optimized the in vitro assays used for the measurement ofintrinsic clearance in liver microsomes by incorporatingbenzo[a]pyrene (B(a)P) as a benchmark compound. Theintrinsic clearance of 40 compounds was then measured inmicrosomes from fish (weevers) and birds (quail); thecharacteristics of the trophic transfer of these 40 compoundswere previously investigated in an aquatic food web in Bohai innorthern China. Chemicals that are biotransformed at a ratesimilar to or higher than that of B[a]P in the microsomes ofboth weevers and quail (in vitro intrinsic clearance values, CL; CL/CLB[a]P: 0.1 to 2.4) generally exhibited no significant trophicmagnification or dilution in the food web (TMF ≈ 1 or < 1), whereas chemicals that are biotransformed at extremely slow ratescompared with B[a]P (CL/CLB[a]P: 0 to 0.2) showed significant trophic magnification in the food web (TMF > 1). The in vitrointrinsic clearance values of the target chemicals were found to be consistent with their respective trophic transfer behavior in theaquatic food web. Significant negative correlations were also found between the TMFs and the intrinsic clearance values of alltarget chemicals obtained in microsomes from both weevers and quail. Multiple linear regression analysis showed thatbiotransformation rates (CL/CLB[a]P) are a more important factor compared with the lipophilicity of the chemicals (log Kow) inthe assessment of the trophic magnification of chemicals in the aquatic food web.
■ INTRODUCTION
The persistent organic pollutants (POPs) protocol endorsed bymore than 100 countries in 2004 has led to significant activitiesin the assessment of persistent, bioaccumulative, and toxicsubstances throughout the world.1 Bioaccumulation is afundamental process in environmental toxicology and riskassessment because it determines the internal dose ofenvironmental pollutants.2 Bioaccumulation potentials havebeen routinely scrutinized by regulatory agencies across theglobe as part of the risk assessment of chemicals.3 Governmentsworldwide have sought to evaluate all commercial chemicals toidentify substances that undergo trophic magnification in thefood web and achieve harmful concentrations in organisms.4
The screening and assessment of bioaccumulation generallyrely on laboratory-derived bioconcentration factors (BCFs) orfield-determined bioaccumulation factors (BAFs).5 In the pastfew decades, studies of pollutants in food webs havedemonstrated that bioaccumulation in food webs is not solelya lipid−water partitioning process. During a global “Lab-FieldBioaccumulation Workshop” held in New Orleans, Louisiana,the use of trophic magnification factors (TMFs) to characterizethe bioaccumulation potentials of chemicals was encouragedbecause they provide a characterization of the average degree oftrophic magnification that occurs across an entire food
web.4,6−8 The hydrophilicity (water solubility) of compoundsis considered to be an important determinant of the trophicmagnification of chemicals in aquatic environments. A goodcorrelation between TMFs and the lipophilicity of thechemicals (log Kow) has been reported for recalcitrantpolychlorinated biphenyls (PCBs), chlorobenzenes (ClBs),chlordanes, hexachlorocyclohexanes (HCHs), dichlorodiphe-nyltrichloroethane (DDTs), mirex, and dieldrin in the NorthWater Polynya marine food web.9 However, most trophody-namic studies have focused on POPs or emerging POPs, whichgenerally showed trophic magnification in aquatic food webs.Some studies also found that compounds with a similar log Kow
value did not biomagnify (e.g., 4-nonylphenol [NPs] orphthalate esters [PEs]) or even exhibited trophic dilution(e.g., polycyclic aromatic hydrocarbons [PAHs] or hydroxy-lated polybrominated diphenyl ethers [OH-PBDEs]) in aquaticfood webs, which suggests that other factors also affectTMFs.10−13 Biotransformation has long been recognized asan important source of uncertainty in predictions of
Received: March 8, 2016Revised: April 28, 2016Accepted: May 6, 2016Published: May 6, 2016
Article
pubs.acs.org/est
© 2016 American Chemical Society 6343 DOI: 10.1021/acs.est.6b01178Environ. Sci. Technol. 2016, 50, 6343−6353

bioaccumulation,14,15 and biodegradation testing is required forbioaccumulation assessments under the Chemical SubstanceControl Law in Japan.3 However, the influence of bio-transformation on the trophic transfer of chemicals is unknowndue to the limited availability of biological biotransformationrates and their relationships with reported TMFs.Currently, the methods most often adopted for accurately
and efficiently determination of biotransformation rates are stilllacking. Among the various in vitro methods, subcellularfractions of the liver (e.g., microsomes or S9) have been shownto be best suited to the high-throughput screening of chemicals’biotransformation potentials.14,16 A recent study demonstratedthat cryopreserved trout hepatocytes can be used to reliablyobtain in vitro intrinsic clearance of xenobiotics.17 The resultsof that study also suggested that the incorporation of one ormore “benchmarking” chemicals into in vitro chemicaldepletion could potentially reduce the variation betweendifferent batches.17 However, information regarding the natureof an ideal benchmarking compound (e.g., the desired pathwayfor metabolism and ease of analysis) is still lacking.Bohai is an enclosed inland sea in northern China. In recent
decades, the trophodynamics of about 40 chemicals have beenstudied in the Bohai aquatic food web, which includesphytoplankton and seston, zooplankton, invertebrates, fish,and birds.10,12,13,18−21 The resulting TMFs database of the 40chemicals obtained from the same aquatic food web provides anexcellent opportunity to examine the influence of biotransfor-mation and log Kow values on the trophic magnification ofvarious chemicals. In this study, microsomes of the marineweever (Lateolabras japonicus) and common quail (Coturnixcoturnix) were used to obtain the intrinsic biotransformationrates. The weever is a typical predatory fish that has a largebody size and a high trophic level (3.88 ± 0.49) in the Bohaiaquatic food web.10,19 Quail were used to replace seagullsbecause fresh seagull liver tissue could not be obtained. An invitro method for the determination of repeatable biotransfor-mation rates was developed and applied to compounds withfield-derived TMFs values. The relationships between the logKow values, biotransformation rates, and TMFs were exploredto establish a method to predict the trophic magnification ofchemicals in aquatic food webs.
■ MATERIALS AND METHODSChemicals and Reagents. A total of 13 individual PAHs
standards (acenaphthene [ACE], fluorene [FE], phenanthrene[PH], anthracene [AN], fluoranthene [FL], pyrene [PY],chrysene [CH], benzo[k]fluoranthene [B(k)F], benzo[a]-pyrene [B(a)P], benzo[ghi]perylene [BP], dibenz[a,h]-anthracene [DA], benzo[b]fluoranthene [B(b)F], and benz-[a]anthracene [B(a)A]) and four surrogate standards (ace-naphthene-d10, phenanthrene-d10, chrysene-d12, and perylene-d14) were obtained from AccuStandard (New Haven, CT). Atotal of eight individual PBDEs (BDE28, BDE47, BDE99,BDE100, BDE119, BDE153, BDE154, and BDE183), mirex,seven individual PCBs (PCB105, PCB114, PCB118, PCB123,PCB157, PCB169, and PCB189), and 13C-labeled PCBs wereobtained from Wellington Laboratories Inc. (Guelph, ON,Canada). 2′-OH-6′-Cl-BDE7, 6-OH-BDE47, 6′-MeO-BDE17,and 6-MeO-BDE47 were synthesized in the Department ofBiology and Chemistry, City University of Hong Kong. HCBand p,p′-DDE were purchased from Chemservice (Chester,England), p,p′-DDMU was obtained from Sigma (St. Louis,MO), and their surrogates (PCB121 and PCB 198) were
obtained from AccuStandard. 4-NP (technical grade) and 4-n-NP were purchased from Kanto Chemicals (Tokyo, Japan).NPEOs was purchased from Hayashi Pure Chemicals (Tokyo,Japan). Monobutyltin trichloride (MBT) was purchased fromAcros Organics (Geel, Belgium), dibutyltin dichloride (DBT),tributyltin chloride (TBT), and triphenyltin chloride (TPT)were purchased from Wako (Osaka, Japan). Deuteratedorganotins (MBT-d9, DBT-d18, TBT-d27, and TPT-d15) wereobtained from Hayashi Pure Chemicals. Dichloromethane(DCM), n-hexane, acetone, acetonitrile, and methanol ofpesticide residue grade were obtained from Fisher Chemicals(Fair Lawn, NJ). Methyl chloroformate was obtained fromSigma-Aldrich. O-bis (trimethylsilyl) trifluoroacetamide(BSTFA) was obtained from Supelco (Bellefonte, PA). Sodiumtetraethylborate (NaBEt4) was purchased from Wako. Waterwas prepared with a Milli-Q Synthesis water purification system(Millipore, Bedford, MA). A nicotinamide adenine dinucleotidephosphate (NADPH) regenerating system and dithiothreitol(DTT) were purchased from Promega (Madison, WI). Sodiumsulfate (analytical reagent grade, Beijing Chemicals) was bakedat 450 °C for 4 h and stored in a drying oven before use.Monopotassium phosphate, dipotassium phosphate, ethylenediamine tetraacetic acid (EDTA), glycerol, and sucrose werepurchased from Beijing Chemicals.
In Vitro Microsomal Incubations. B[a]P was added to theincubation mixtures as a benchmark compound to normalizethe variation in the transformation rates that occurred indifferent batches of analyses. The details of the preparation ofmicrosomes are provided in the Supporting Information. Theprotein concentrations were determined with the Bradfordmethod using bovine serum albumin as a standard andaccording to the manufacturer’s protocol (Sigma-Aldrich).Hepatic microsomal CYP450 enzymes and four specific CYPenzymes (7-ethoxyresorufin O-deethylase [EROD], 7-pentox-yresorufin O-demethylase [PROD], 7-methoxyresorufin O-demethylase [MROD], and 7-benzyloxyresorufin O-dealkyla-tase [BROD]) from weevers and quail were measured withfluorescence kits (Genmed Scientific Inc.). The EROD, PROD,MROD, and BROD were markers for CYP1A1, CYP2B1,CYP1A2, and CYP3A1 activity, respectively.For in vitro incubations of weever microsomes, the reactions
were performed in 50 mM phosphate buffer (pH 7.4)containing 1 mM EDTA, 1 mM DTT, and 20% (v/v) glycerol.The reaction mixtures (200 μL) consisting of 100 μL of livermicrosomes (2 mg/mL protein), 60 μL of NADPHregenerating system, and 1 μL of substrate (0.5 μM for bothindividual compounds and B[a]P) and were incubated in 1.5mL amber glass vials. Reactions were initiated by adding aNADPH-generating system (NADP, 6.5 mM; glucose 6-phosphate, 16.5 mM; MgCl2, 16.5 mM; and glucose 6-phosphate dehydrogenase, 2 U/mL). Incubations were carriedout in triplicate in separate glass vials at 25 °C, and 200 μL ofice-cold acetone was added into each vial to terminate thereaction after 0, 1, 3, 5, 9, 12, and 24 h.For in vitro incubations of quail microsomes, 50 mM
phosphate buffer (pH 7.4) containing 5 mM MgCl2 and 0.5mM EDTA was added into the incubation vials. The reactionmixtures (200 μL) consisted of 100 μL of liver microsomes (2mg/mL protein), 60 μL of NADPH regenerating system, and 1μL of substrate (0.5 μM for individual compounds and 2 μMfor B[a]P) and were incubated in 1.5 mL amber glass vials.Reactions were initiated by adding a NADPH-generatingsystem (NADP, 6.5 mM; glucose 6-phosphate, 16.5 mM;
Environmental Science & Technology Article
DOI: 10.1021/acs.est.6b01178Environ. Sci. Technol. 2016, 50, 6343−6353
6344

MgCl2, 16.5 mM; and glucose 6-phosphate dehydrogenase, 2U/mL). Incubations were carried out in triplicate at 39 °C inseparate glass vials, and 200 μL of ice-cold acetone was addedinto each vial to terminate the reaction after 0, 10, 20, 30, 40,and 60 minThe vials were stored at −20 °C until chemical analysis. The
microsomes were inactivated by boiling for 10 min and werethen cooled on ice. Incubations with deactivated microsomesand standards were used as negative controls to assess potentialbackground interference and the possibility of nonenzymaticchanges. The percentage variations of concentrations of targetcompounds along with the incubation time in the deactivatedliver microsomes were shown in Figures S1 and S2.Sample Analysis. The incubation mixture in each vial was
added with 1 mL of water and surrogates and extracted threetimes with 1 mL of hexane. The aquatic fraction was thenpassed through a Pasteur pipe filled with sodium sulfate toremove moisture and eluted with 1 mL of hexane and 1 mL ofDCM, which were also used to rinse the glass vial beforeelution. All of the extracts were combined and concentrated to50 μL for instrumental analysis. The organotins werederivatized with NaBEt4 before gas chromatography−electronionization−mass spectrometry (GC-EI-MS) analysis, 4-NP wasderivatized with BSTFA before GC-EI-MS analysis, and 6-OH-BDE47 was derivatized with methyl chloroformate before gaschromatography−negative chemical ionization−mass spec-trometry (GC-NCI-MS) analysis. PAHs, PCBs, DDTs, HCB,mirex, organotins, and 4-NP were directly analyzed by GC-EI-MS (Agilent Technologies); PBDEs, 6-MeO-BDE47 and 6-OH-BDE47 were analyzed by GC-NCI-MS (Shimadzu QP2010 plus); and NPEOs were analyzed with high-performanceliquid chromatograph (Agilent 1100 Series) coupled with afluorescence detector (Agilent 1200 Series). Detailed informa-tion on the instrumental conditions for each group of chemicalsis provided in the Supporting Information.Quality Assurance and Quality Control. Concentrations of
PAHs in sample extracts were quantified relative to deuteratedPAHs (chrysene-d12, perylene-d14, and perylene-d14); PBDEsand 6-MeO-BDE47 were quantified relative to 6′-MeO-BDE17;6-OH-BDE47 was quantified relative to 2′-OH-6′-Cl-BDE7;p,p′-DDE, p,p′-DDMU, and HCB were quantified relative toPCB 121; 4-NP was quantified relative to 4-n-NP; organotinswere quantified relative to deuterated organotins (MBT-d9,DBT-d18, TBT-d27, and TPT-d15); mirex was quantified to PCB198; and PCBs were quantified relative to 13C-labeled PCBs.The recoveries of surrogates standards were 78 ± 19%, 100 ±1%, 85 ± 13%, 85 ± 6%, 72 ± 19%, 124 ± 7%, 93 ± 26%, and119 ± 14% for deuterated PAHs, 6′-MeO-BDE17, PCB 121,
PCB198, 2′-OH-6′-Cl-BDE7, 4-n-NP, deuterated organotins,and 13C-labeled PCBs, respectively.
Data Analysis. The declining concentrations of substrate inthe incubation mixtures over time followed the monoexponen-tial decay model and were fit to the linear eq 1:
= − ·C C K tln lnt 0 (1)
where t is incubation time; C0 and Ct are the substrateconcentrations in the incubation medium at time zero and timet, respectively; and K is the apparent first-order biotransforma-tion rate constant (h−1). The in vitro intrinsic clearance values(CL, mL/h/mg of protein) were obtained according to the eq2:
= KC
CLprotein (2)
where Cprotein is the protein concentration (mg protein/ml) ofthe incubation mixtures. The in vitro intrinsic clearance value ofeach chemical was normalized to that of B[a]P according to theeq 3:
′ =CLCL
CLB[a]P (3)
where CL′ is the normalized intrinsic clearance value of targetcompounds, and CLB[a]P is the intrinsic clearance value ofB[a]P.
Statistical Analysis. Multiple linear regression models wereconstructed to determine the contribution of log Kow and thebiotransformation rate on the trophic magnification ofchemicals. TMFs were slopes of the correlations betweenconcentrations of chemicals in organisms and trophic levels.The significances of the correlations were examined bySpearman’s rank correlation test. The TMFs were log10-transformed before analysis, and the linear regression wasregarded as significant when the p value was less than 0.05. Thecorrelations between Ln(Ct/C0) and the incubation time werealso examined with Spearman’s rank correlation test. The linearregression was regarded as significant when the value of p wasbelow 0.05. All statistical analyses were performed with SPSS13.0 statistical software (SPSS, Inc., Chicago, IL).
■ RESULTS AND DISCUSSIONHepatic Microsomal Enzyme Activities. The activities of
hepatic microsomal CYP450 enzymes and the four specificCYP enzymes (EROD, PROD, MROD, and BROD) inweevers and quail are listed in Table 1. The total and specificCYP450 enzyme activities in the microsomes of weevers werewithin the ranges of those in marine fish reported
Table 1. Activities of Hepatic Microsomal CYP450 Enzymes and Four Specific CYP Enzymes (EROD, PROD, MROD, andBROD) from Weevers and Quail and Range Concentrations of Enzyme Activities in Hepatic Microsomes of Marine Fishes andBirds from References
weevers marine fishes in refa quail birds in refb
enzyme activity (pmol/mg/min) mean ± SD range mean ± SD range
total CYP450 enzymes 101 ± 46 43−230 300 ± 68 NVspecific CYP enzymesEROD 3.0 ± 0.3 2−10 6.8 ± 0.1 2.2−60PROD 0.1 ± 0.01 0.2−1 1.7 ± 0.8 0.9−2.6MROD 3.2 ± 0.5 3.6 10.5 ± 2.2 1.7−32.8BROD 2.4 ± 0.3 3.7 10.7 ± 0.3 11
aRef from 22−27. bRef from 28−34, NV: no values reported.
Environmental Science & Technology Article
DOI: 10.1021/acs.est.6b01178Environ. Sci. Technol. 2016, 50, 6343−6353
6345

previously,22,23 and the profiles of EROD, MROD, PROD, andBROD activities were also similar to those of the correspondingenzymes in previous investigations.24−27 In the quail livermicrosomes, the EROD, MROD, PROD, and BROD activitieswere determined to be 6.8 ± 0.1, 1.7 ± 0.8, 10.5 ± 2.2, and 10.7± 0.3 pmol/mg/min, respectively, which were all within thenormal ranges reported previously for herring gulls, glaucousgulls, yellow legged gulls, chickens, black-legged kittiwake,European quail, gray partridges, and northern fulmar.28−34
Similar hepatic enzyme activities observed between quail andother avian species suggested that quail could be used as anacceptable model to replace seagulls in this study. Theincubation of chemicals with quail microsomes was conductedfor 1 h due to the relatively high activities of hepaticmicrosomal CYP enzymes, and incubations of chemicals withweever microsomes were extended to 24 h to evaluatebiotransformation potentials of persistent compounds (e.g.,PCBs). A similar incubation time (24 h) was also applied in theincubation of fish microsomes in previous studies.35−37 Theenzyme activities of EROD, PROD, MROD, and BROD, alongwith the incubation time, were determined in microsomes ofweevers and quail, and no significant decline was observed forthe target enzyme activities (Figure S3), which suggests thatbiotransformation can continue for up to 24 h during in vitroincubations.Method Optimization. The reliability of the in vitro assays
for assessment of bioaccumulation is substantially hampered bythe high variability in enzyme viability and metabolic capacitybetween different batches. This variability might be accounted
for with the use of benchmark chemicals with known metaboliccharacteristics.14,17 In this study, B[a]P was tested as abenchmark compound in in vitro assays to normalize thevariation that occurred across different batches of analyses. B[a]P was reported to undergo biotransformation mainly throughCYP1A1,38 and the depletion of the chemical followed first-order kinetics with a relatively constant first-order rate constantin previous studies.15−17,39,40 A total of three chemicals (PH, 6-MeO-BDE47, and 4-NP) from diverse chemical classes wereused to assess the variability in the assays because PH, 6-MeO-BDE47, and 4-NP undergo steadily biotransformation byCYP1A1, CYP2B, and CYP1A2, respectively.41−43 Theactivities of EROD, PROD, and MROD (markers forCYP1A1, CYP2B1, and CYP1A2, respectively) have beendetermined to be within normal ranges in microsomes ofweevers (Table 1). Incubation of B[a]P with chemicalsbiotransformed by the same or different metabolic enzymesin microsomes could help to clarify whether the benchmarkchemical would reduce the variations within different enzymes.Each chemical was tested relative to B[a]P in the microsomesof weevers in triplicate batches at a low substrate concentration(0.5 μM). The low substrate concentration prevented enzymesaturation and high cytotoxicities of the chemicals and allowedfor the detection of significant depletion of substrates. Themicrosomes for each batch were isolated at different times(January, July, and November 2014). As shown in Figures 1−3,the in vitro intrinsic clearance values of PH, 6-MeO-BDE47,and 4-NP were 0.007 ± 0.0017, 0.027 ± 0.005, and 0.021 ±0.013 (mL/h/mg of protein) with the variation (% CV) in
Figure 1. Substrate depletion curves for the three test chemicals (PH [a1−a3], 6-MeO-BDE47 [b1−b3] and 4-NP [c1−c3]) with B[a]P as thebenchmark compound in weever microsomes. Each graph represents the data from one batch for one test chemical. The error bars indicate thestandard deviation of the triplicate runs. CYP450 enzyme activities were 103, 168, and 171 (pmol/mg/min) for batches 1, 2, 3, respectively.Concentrations of B[a]P at 24 h for C2 and C3 were below the detection limits. Concentrations of C0 were in the range of 0.49−0.54 μM.
Environmental Science & Technology Article
DOI: 10.1021/acs.est.6b01178Environ. Sci. Technol. 2016, 50, 6343−6353
6346

intrinsic clearance values of 23%, 23%, and 61%, respectively.After correction by the intrinsic clearance value of B[a]P, theCL′ values for PH, 6-MeO-BDE47, and 4-NP were 0.22 ±0.037, 0.41 ± 0.019, and 0.29 ± 0.046, respectively, and thevariation (% CV) of the three compounds decreased to 5−17%.The corrected variation was in the range of the reportedintralaboratory variability (4.1−30%) achieved when thehepatocyte assay was isolated and cryopreserved in onelocation.17 The study’s results demonstrate that the incorpo-ration of B[a]P benchmarking could substantially reduce thevariability between batches. The variations of enzyme activitiescaused by cytotoxicity of chemicals and other abiotic factorsduring the incubations could also be corrected by the depletionof B[a]P in the in vitro system.Another critical issue that can cause great variation in in vitro
systems is the adsorption of chemicals into the reaction vesselsor proteins.14 In this study, a separate amber glass vial (1.5 mL)was used for incubations at different reaction times. Thisapproach differs from previous methods in which an aliquot ofthe suspension was taken from the reaction vial eachtime.17,44,45 Using the amber glass vial helped to avoid theuneven distribution of chemicals in the solutions or adsorptioninto vessels. The adsorption of chemicals during incubationswould also cause substrate loss during liquid−liquid extraction,possibly as a result of the nonspecific binding of chemicals toproteins within the system, a process that could not be reducedby liquid−liquid extraction. An extraction method wasdeveloped in this study in which incubation mixtures were
passed through a Pasteur pipet filled with anhydrous sodiumsulfate, which was then eluted by hexane and DCM. As a resultof this method, the target compounds showed 88−114%recovery in all of the incubated samples terminated by ice-coldacetone at 0 h (Figure S4); these values were significantlyhigher than those in samples in which liquid−liquid extractionwas used (40−55%).
Intrinsic Clearances. The substrate depletion approach hasbeen well adopted for estimation of intrinsic clearance for asingle compound.15,17,40,46−48 In this study, the biotransforma-tion of target compounds followed first-order kinetics in bothweever and quail liver microsomes (Figures 2 and 3). Asummary of the in vitro intrinsic clearance values for the 40compounds examined are listed in Table 2. Relatively highintrinsic clearance rates were observed for PAHs, 6-OH/MeO-BDE47, NPEOs, 4-NP, and butyltins, and the CL values ofthese compounds were determined to be 0.0022−0.17 and0.26−4.6 (mL/h/mg of protein) in the liver microsomes ofweevers and quail, respectively. In comparison, no statisticallysignificant decline was found for PBDEs, DDTs, HCB, mirex,PCBs, or TPT during the incubation periods in weevermicrosomes, and extremely slow depletion was observed forPBDEs and p,p′-DDMU in quail microsomes, with a CL of0.05−0.39 (mL/h/mg of protein). The available substratedepletion studies focused mainly on the hepatic clearance of 4-NP, PAHs, and some pharmaceuticals in fish.39,46−51 The CL of4-NP was reported to be 0.18 and 0.11 (mL/h/mg of protein)in trout-liver microsomes and S9 fractions, respectively,39 which
Figure 2. Substrate depletion curves for chemicals that undergo trophic dilution, as exemplified by 6-OH-BDE47, B[k]F, and NPEOs (CL/CLB[a]P:0.14−1.0); chemicals that show no trophic magnification, as exemplified by 4-NP, 6-MeO-BDE47, and DBT (CL/CLB[a]P: 0.10−1.4); and chemicalsthat exhibit significant trophic magnification, as exemplified by p,p′-DDMU, PCB114, and BDE99 (CL/CLB[a]P ≈ 0) in weever microsomes.Concentrations of C0 were in the range of 0.43−0.54 μM.
Environmental Science & Technology Article
DOI: 10.1021/acs.est.6b01178Environ. Sci. Technol. 2016, 50, 6343−6353
6347

were relatively higher than those found in the weevermicrosomes in this study (0.021 mL/h/mg of protein). Theintrinsic clearance values of B[a]P reported in three separatestudies were 0.024 ± 0.003 (mL/h/mg of protein) (dosedconcentrations, 0.5 μM),51 0.032−0.088 (mL/h/mg of protein)(dosed concentrations, 2 μM),39 and 0.19−0.37 (mL/h/mg ofprotein) (dosed concentrations, 1−2.5 μM).49 The differencesbetween these reported intrinsic clearance rates might haveresulted from the use of different trout subspecies, S9 fractionprotein concentrations, and beginning substrate concentrations.The CL of B[a]P in weever microsomes (0.03 ± 0.02 mL/h/mg of protein) in this study was in the range of the reportedvalues cited above.To the best of our knowledge, no information is available
about the in vitro intrinsic clearance of chemicals in birds. Theextremely low intrinsic clearance values of persistent chemicals(e.g., DDTs, HCB, mirex, PCBs, and TPT) in quailmicrosomes were similar to the values obtained in weevermicrosomes (Figures 2 and 3), but the CLquail of the chemicalsthat undergo steady biotransformation was found to be 14 to1500 times higher than those in weever microsomes (Table 2).It is interesting to note that the hepatic clearance values ofPAHs increased in a linear relationship with benzo-rings inincubations with weever microsomes (Figure 4). The relation-ship was similar to the increasing degree of stereoselectivitywith the size and shape of the molecules in the metabolism ofPAHs by bullhead liver microsomes: B[a]P (five benzo-rings) >CH (four benzo-rings) > PH (three benzo-rings).52−54
However, a negative correlation was observed between theCL′quail of PAHs and their benzo-rings in quail microsomes(Figure 4). The discrepancy between quail and fish for themicrosomal metabolism of PAHs was also reported betweenrats and fish, possibly because of the significantly differentstereoselectivities of cytochrome P450 enzymes between thetwo species.52−56 The results suggested that quail- and rat-livermicrosomal enzymes may have similar stereoselectivity in themetabolism of PAHs.
Assessment of Trophic Magnification Potentials. It hasbeen reported that two important physiological processesdetermine whether a chemical will bioaccumulate in fish: theuptake of the chemical from the environment and thebiotransformation of the chemical into water-soluble metabo-lites.14,51 Fish take up chemicals through their gills andintestines, and these pathways depend mainly on thelipophilicity of the chemicals (log Kow).
14,57 Thus, therelationships between field-derived TMFs, log Kow, and invitro intrinsic clearance values in microsomes from weevers andquail were explored (Table 2). As shown in Figure 5a, TMFsincreased with log Kow values for all target compounds, but thecorrelation between TMFs and log Kow was not statisticallysignificant for the 40 target chemicals in this study (Figure 5a).Although positive correlations have been reported betweenTMFs and log Kow for some POPs in previous studies,9,58−60
negative relationships or no relationships were observed fordioxins, PAHs, and PEs.11,19,61−63 The different relationships
Figure 3. Substrate depletion curves for chemicals that undergo trophic dilution, as exemplified by 6-OH-BDE47, B[k]F, and NPEOs (CL/CLB[a]P:0.5−2.4); chemicals that show no trophic magnification, as exemplified by 4-NP, 6-MeO-BDE47, and DBT (CL/CLB[a]P: ≈0−2.6); and chemicalsthat exhibit significant trophic magnification, as exemplified by p,p′-DDMU, PCB114, and BDE99 (CL/CLB[a]P: ≈0−0.19) in quail microsomes.Concentrations of C0 were in the range of 0.5−0.58 μM.
Environmental Science & Technology Article
DOI: 10.1021/acs.est.6b01178Environ. Sci. Technol. 2016, 50, 6343−6353
6348
between TMFs and log Kow suggested the existence of other,more important factors.The in vitro intrinsic clearance values of each group of
chemicals were found to be consistent with that group’s trophictransfer behaviors in the aquatic food web (Table 2). Chemicalsthat undergo significant trophic dilution in the aquatic foodweb (TMF < 1, p < 0.05), including high-molecular-weightPAHs and OH-PBDEs, were biotransformed at a rapid rate inboth weever and quail microsomes (CL/CLB[a]P: 0.5−2.4).Biotransformation was difficult for chemicals that showedsignificant trophic magnification in the food web (TMF > 1, p <0.05), including PBDEs, HCB, DDTs, mirex, and PCBs, in
microsomes of both weevers and quail (CL/CLB[a]P: 0−0.2).Moderate normalized intrinsic clearance values (CL/CLB[a]P:0.12−1.4) were found for chemicals that exhibited nosignificant trophic magnification or dilution in the food web(TMF ≈ 1, p > 0.05), with the exception of low-molecular-weight PAHs in quail microsomes. Although large speciesdifferences in biotransformation were observed within groupsof chemicals (e.g., PAHs), similar profiles of intrinsic clearancewere found for different groups of chemicals in each species(Table 2). The three groups of chemicals were fractionated byCL/CLB[a]P with the values of 0, 0−0.5 and 0.5−2, respectively,and significant negative correlations were observed between
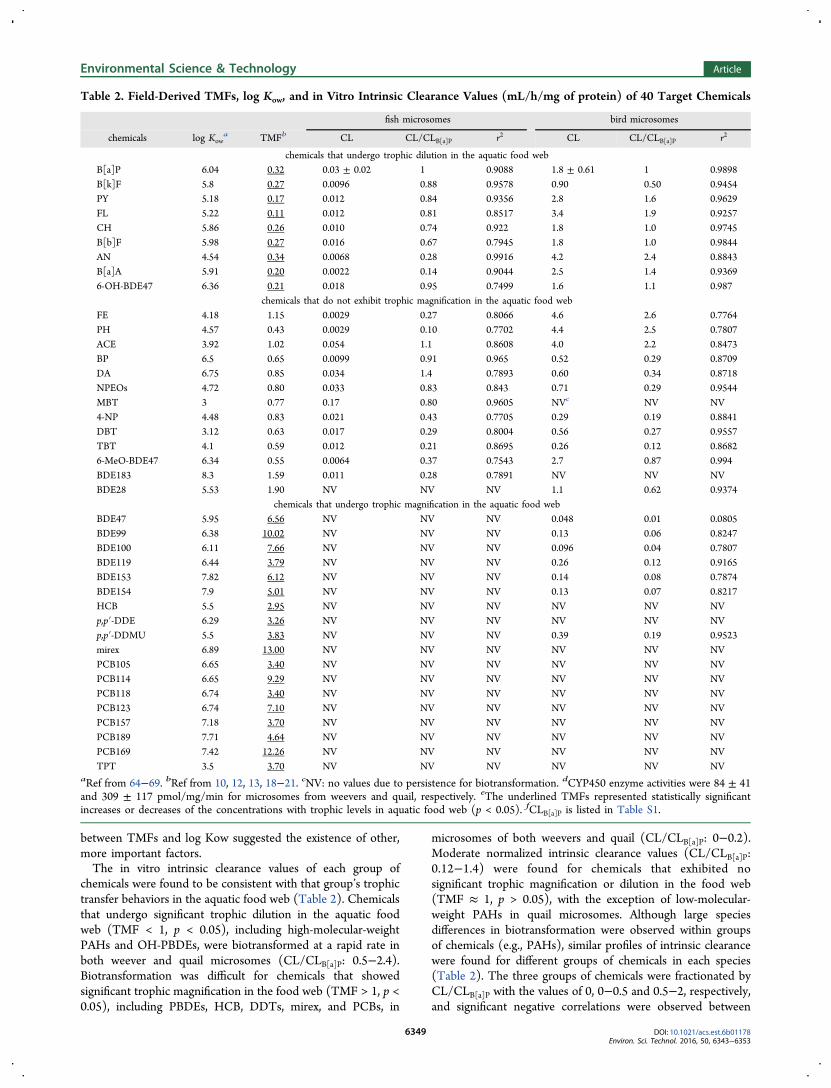
Table 2. Field-Derived TMFs, log Kow, and in Vitro Intrinsic Clearance Values (mL/h/mg of protein) of 40 Target Chemicals
fish microsomes bird microsomes
chemicals log Kowa TMFb CL CL/CLB[a]P r2 CL CL/CLB[a]P r2
chemicals that undergo trophic dilution in the aquatic food webB[a]P 6.04 0.32 0.03 ± 0.02 1 0.9088 1.8 ± 0.61 1 0.9898B[k]F 5.8 0.27 0.0096 0.88 0.9578 0.90 0.50 0.9454PY 5.18 0.17 0.012 0.84 0.9356 2.8 1.6 0.9629FL 5.22 0.11 0.012 0.81 0.8517 3.4 1.9 0.9257CH 5.86 0.26 0.010 0.74 0.922 1.8 1.0 0.9745B[b]F 5.98 0.27 0.016 0.67 0.7945 1.8 1.0 0.9844AN 4.54 0.34 0.0068 0.28 0.9916 4.2 2.4 0.8843B[a]A 5.91 0.20 0.0022 0.14 0.9044 2.5 1.4 0.93696-OH-BDE47 6.36 0.21 0.018 0.95 0.7499 1.6 1.1 0.987
chemicals that do not exhibit trophic magnification in the aquatic food webFE 4.18 1.15 0.0029 0.27 0.8066 4.6 2.6 0.7764PH 4.57 0.43 0.0029 0.10 0.7702 4.4 2.5 0.7807ACE 3.92 1.02 0.054 1.1 0.8608 4.0 2.2 0.8473BP 6.5 0.65 0.0099 0.91 0.965 0.52 0.29 0.8709DA 6.75 0.85 0.034 1.4 0.7893 0.60 0.34 0.8718NPEOs 4.72 0.80 0.033 0.83 0.843 0.71 0.29 0.9544MBT 3 0.77 0.17 0.80 0.9605 NVc NV NV4-NP 4.48 0.83 0.021 0.43 0.7705 0.29 0.19 0.8841DBT 3.12 0.63 0.017 0.29 0.8004 0.56 0.27 0.9557TBT 4.1 0.59 0.012 0.21 0.8695 0.26 0.12 0.86826-MeO-BDE47 6.34 0.55 0.0064 0.37 0.7543 2.7 0.87 0.994BDE183 8.3 1.59 0.011 0.28 0.7891 NV NV NVBDE28 5.53 1.90 NV NV NV 1.1 0.62 0.9374
chemicals that undergo trophic magnification in the aquatic food webBDE47 5.95 6.56 NV NV NV 0.048 0.01 0.0805BDE99 6.38 10.02 NV NV NV 0.13 0.06 0.8247BDE100 6.11 7.66 NV NV NV 0.096 0.04 0.7807BDE119 6.44 3.79 NV NV NV 0.26 0.12 0.9165BDE153 7.82 6.12 NV NV NV 0.14 0.08 0.7874BDE154 7.9 5.01 NV NV NV 0.13 0.07 0.8217HCB 5.5 2.95 NV NV NV NV NV NVp,p′-DDE 6.29 3.26 NV NV NV NV NV NVp,p′-DDMU 5.5 3.83 NV NV NV 0.39 0.19 0.9523mirex 6.89 13.00 NV NV NV NV NV NVPCB105 6.65 3.40 NV NV NV NV NV NVPCB114 6.65 9.29 NV NV NV NV NV NVPCB118 6.74 3.40 NV NV NV NV NV NVPCB123 6.74 7.10 NV NV NV NV NV NVPCB157 7.18 3.70 NV NV NV NV NV NVPCB189 7.71 4.64 NV NV NV NV NV NVPCB169 7.42 12.26 NV NV NV NV NV NVTPT 3.5 3.70 NV NV NV NV NV NV
aRef from 64−69. bRef from 10, 12, 13, 18−21. cNV: no values due to persistence for biotransformation. dCYP450 enzyme activities were 84 ± 41and 309 ± 117 pmol/mg/min for microsomes from weevers and quail, respectively. eThe underlined TMFs represented statistically significantincreases or decreases of the concentrations with trophic levels in aquatic food web (p < 0.05). fCLB[a]P is listed in Table S1.
Environmental Science & Technology Article
DOI: 10.1021/acs.est.6b01178Environ. Sci. Technol. 2016, 50, 6343−6353
6349

TMFs and normalized intrinsic clearance values when the threegroups of chemicals were all included in the regression analysis(p < 0.05, Figure 5b,c). There are some exceptional chemicals
in the correlations (for example, three PAH isomers (FE, PH,and ACE)) had relatively high TMFs in Figure 5c. The possiblereason was due to the fact that no significant trophicmagnification or dilution was observed for these compoundsin the aquatic food web (p > 0.05), resulting in the largeuncertainties of field-derived TMFs. Multiple linear regressionwas used to further assess the effects of log Kow andbiotransformation on the trophic magnification of chemicals.The analysis produced extremely significant multiple regressionmodels (p < 0.001 for all models) (eqs 4 and 5).
= = −
′ < −
K p
p
log(TMFs) 0.119 log ( 0.024, 6.3%) 0.931
CL ( 0.001, 51.1%) 0.228ow
weever (4)
= =
− ′ < −
K p
p
log(TMFs) 0.092log ( 0.137, 3.4%)
0.424CL ( 0.001, 42.3%) 0.135ow
quail (5)
The biotransformation rate was found to be a significantpredictor of TMFs, with percentage contributions of 51.1% and42.3% for weevers and quail, respectively. Multiple linearregressions demonstrated that biotransformation was animportant factor in the prediction of the trophic magnificationof chemicals in the aquatic food web.It is well-known that the in vivo models are the most accurate
way to determine the clearance rates, but even the abbreviatedmethods developed recently are expensive and time-consum-ing.17 As a result, regulatory agencies throughout the worldincreasingly favor the development and validation of in vitromethods.17 Although the use of in vitro system to determinebiotransformation rates of chemicals provided a relatively easierand faster way for assessing the trophic magnifications in thisstudy, some toxicokinetic processes such as bioavailability andenterohepatic circulation were not considered in the in vitrosystem. Because uptake and distribution of chemicals in biotasdepend mainly on the lipophilicity of the chemicals (logKow),
14,57 the biotransformation rates should be appliedtogether with log Kow for assessment of the trophicmagnification potentials of chemicals. The relationshipsbetween observed and predicted TMF values based on themultiple regression models were shown in Figure S5. Goodagreements were obtained for compounds exhibiting significanttrophic magnifications or trophic dilutions in the aquatic foodweb. Most of the outliners in the correlations were compoundsthat undergo no significant trophic magnification or dilution inthe food web, and the calculated TMF values have largeuncertainties.Generally, regulatory authorities rely on the log Kow of a
chemical to assess bioaccumulation potentials, and chemicalswith log Kow values of greater than 5 are identified as highlybioaccumulative substances. This criterion only reflects thelipid−water partition and neglects biotransformation asanother, more important, process for the assessment ofbioaccumulation potentials. We optimized the in vitro assaysof microsomes and incorporated a benchmark compound intothe analysis, which greatly reduced the variability amongbatches. This method was then applied to 40 compoundswhose trophic transfer characteristics were previously inves-tigated in an aquatic food web in Bohai in the northern China.A prediction method for trophic magnification assessment wasfinally established on the basis of the normalized intrinsicclearance values of all of the target compounds, and a newmethod was proposed for the identification of chemicals with
Figure 4. Relationships between number of benzo-rings and in vitrointrinsic clearance values (CLin vitro) of PAHs in weever and quailmicrosomes, ▲: CL′ measured in weever microsomes; □: CL′measured in quail microsomes.
Figure 5. Correlations between field-derived TMFs and log Kow (a)and TMFs and measured biotransformation rates in weever (b) andquail microsomes (c).
Environmental Science & Technology Article
DOI: 10.1021/acs.est.6b01178Environ. Sci. Technol. 2016, 50, 6343−6353
6350

high trophic magnification potentials in an aquatic food web. Inaddition, only one fish model and one bird model were selectedto assess the trophic magnification potentials of chemicals.Further study is needed to explore the variations in the intrinsicclearance values of different animals (e.g., fish) with differenttrophic levels, which would provide important informationabout the relationships among TMFs, log Kow values, andbiotransformation rates across an entire food web.
■ ASSOCIATED CONTENT*S Supporting InformationThe Supporting Information is available free of charge on theACS Publications website at DOI: 10.1021/acs.est.6b01178.
Additional details on microsomal preparations andinstrumental analysis of target compounds. Figuresshowing percentage variations of concentrations of targetcompounds along with the incubation time in thedeactivated liver microsomes of weevers and quail,enzyme activity (EROD, MROD, BROD, and PROD)along with the incubation time in weever liver micro-somes (a1-a4) and quail liver micrsomes (b1-b4),recoveries of target compounds in the extraction methoddeveloped in the present study, and model predictedversus observed TMFs in various chemicals for weeversand quail. A table showing CLB[a]P values of B[a]P usedas benchmark compounds in determining the in vitrointrinsic clearance values of 40 target chemicals. (PDF)
■ AUTHOR INFORMATIONCorresponding Author*Tel and fax: 86-10-62759126; e-mail: [email protected] authors declare no competing financial interest.
■ ACKNOWLEDGMENTSThe research is supported by National Natural ScienceFoundation of China (41330637, 21422701), the SpecialScientific Research Funds for Environmental ProtectionCommonweal Section (201309027), and National BasicResearch Program of China (2015CB458900).
■ REFERENCES(1) United Nations Environment Program (UNEP). Final act of theconference of plenipotentiaries on the Stockholm Convention onpersistent organic pollutants, Stockholm, Sweden, May 22−23, 2001;UNEP: Geneva, Switzerland, 2001.(2) Mackay, D.; Fraser, A. Bioaccumulation of persistent organicchemicals: mechanisms and models. Environ. Pollut. 2000, 110, 375−391.(3) Weisbrod, A. V.; Burkhard, L. P.; Arnot, J.; Mekenyan, O.;Howard, P. H.; Russom, C.; Boethling, R.; Sakuratani, Y.; Traas, T.;Bridges, T.; Lutz, C.; Bonnell, M.; Woodburn, K.; Parkerton, T.Workgroup report: Review of fish bioaccumulation databases used toidentify persistent, bioaccumulative, toxic substances. Environ. HealthPerspect. 2006, 115, 255−261.(4) Kelly, B. C.; Ikonomou, M. G.; Blair, J. D.; Morin, A. E.; Gobas,F. A. P. C. Food web-specific biomagnification of persistent organicpollutants. Science 2007, 317, 236−238.(5) Arnot, J. A.; Gobas, F. A. P. C. A review of bioconcentrationfactor (BCF) and bioaccumulation factor (BAF) assessments fororganic chemicals in fish. Environ. Rev. 2006, 14, 257−259.(6) Conder, J. M.; Gobas, F. A. P. C.; Borga, K.; Muir, D. C. G.;Powell, D. E. Use of trophic magnification factors and related measures
to characterize bioaccumulation potential of chemicals. Integr. Environ.Assess. Manage. 2012, 8, 85−97.(7) Jardine, T. D.; Kidd, K. A.; Fisk, A. T. Applications,considerations, and sources of uncertainty when using stable isotopeanalysis in ecotoxicology. Environ. Sci. Technol. 2006, 40, 7501−7511.(8) Borga, K.; Kidd, K. A.; Muir, D. C. G.; Berglund, O.; Conder, J.M.; Gobas, F. A. P. C; Kucklick, J.; Malm, O.; Powell, D. E. Trophicmagnification factors: Considerations of ecology, ecosystems, andstudy design. Integr. Environ. Assess. Manage. 2012, 8, 64−84.(9) Fisk, A. T.; Hobson, K. A.; Norstrom, R. J. Influence of chemicaland biological factors on trophic transfer of persistent organicpollutants in the northwater polynya marine food web. Environ. Sci.Technol. 2001, 35, 732−738.(10) Hu, J. Y.; Jin, F.; Wan, Y.; Yang, M.; An, L. H.; An, W.; Tao, S.Trophodynamic behavior of 4-nonylphenol and nonylphenol poly-ethoxylate in a marine aquatic food web: comparison to DDTs.Environ. Sci. Technol. 2005, 39, 4801−4807.(11) Mackintosh, C. E.; Maldonado, J.; Hongwu, J.; Hoover, N.;Chong, A.; Ikonomou, M. G.; Gobas, F. A. P. C. Distribution ofphthalate esters in a marine aquatic food web: comparison topolychlorinated biphenyls. Environ. Sci. Technol. 2004, 38, 2011−2020.(12) Wan, Y.; Jin, X. H.; Hu, J. Y.; Jin, F. Trophic dilution ofpolycyclic aromatic hydrocarbons (PAHs) in a marine food web fromBohai Bay, North China. Environ. Sci. Technol. 2007, 41, 3109−3114.(13) Zhang, K.; Wan, Y.; An, L. H.; Hu, J. Y. Trophodynamics ofpolybrominated diphenyl ethers and methoxylated polybrominateddiphenyl ethers in a marine food web. Environ. Toxicol. Chem. 2010,29, 2792−2799.(14) Weisbrod, A. V.; Sahi, J.; Segner, H.; James, M. O.; Nichols, J.;Schultz, I.; Erhardt, S.; Cowan-Ellsberry, C.; Bonnell, M.; Hoeger, B.The state of in vitro science for use in bioaccumulation assessment forfish. Environ. Toxicol. Chem. 2009, 28, 86−96.(15) Han, X.; Nabb, D. L.; Mingoia, R. T.; Yang, C. H.Determination of xenobiotic intrinsic clearance in freshly isolatedhepatocytes from rainbow trout (Oncorhynchus mykiss) and rat and itsapplication in bioaccumulation assessment. Environ. Sci. Technol. 2007,41, 3269−3276.(16) Fitzsimmons, P. N.; Lien, G. J.; Nichols, J. W. A compilation ofin vitro rate and affinity values for xenobiotic biotransformation in fish,measured under physiological conditions. Comp. Biochem. Physiol., PartC: Toxicol. Pharmacol. 2007, 145, 485−506.(17) Fay, K. A.; Mingoia, R. T.; Goeritz, I. Intra- and interlaboratoryreliability of a cryopreserved trout hepatocyte assay for the predictionof chemical bioaccumulation potential. Environ. Sci. Technol. 2014, 48,8170−8178.(18) Hu, J. Y.; Zhen, H. J.; Wan, Y.; Gao, J. M.; An, W.; An, L. H.;Jin, F.; Jin, X. H. Trophic magnification of triphenyltin in marine foodweb: Comparison to tributyltin. Environ. Sci. Technol. 2006, 40, 3142−3147.(19) Wan, Y.; Hu, J. Y.; Yang, M.; An, L. H.; An, W.; Hattori, T.;Itoh, M.; Tao, S.; Jin, X. Characterization of trophic transfer forPCDD/Fs and coplanar PCBs in the marine food web of Bohai Bay,North China. Environ. Sci. Technol. 2005, 39, 2417−2425.(20) Wan, Y.; Hu, J. Y.; Zhang, K.; An, L. H. Trophodynamics ofpolybrominated diphenyl ethers in the marine food web of Bohai Bay,north China. Environ. Sci. Technol. 2008, 42, 1078−1083.(21) Peng, H.; Wan, Y.; Zhang, K.; Sun, J. X.; Hu, J. Y. Trophictransfer of dechloranes in the marine food web of Liaodong Bay, northChina. Environ. Sci. Technol. 2014, 48, 5458−5466.(22) Stegeman, J.; Woodin, B.; Singh, H.; Oleksiak, M.; Celander, M.Cytochromes P450 (CYP) in tropical fishes: Catalytic activities,expression of multiple CYP proteins and high levels of microsomalP450 in liver of fishes from Bermuda Comp. Comp. Biochem. Physiol.,Part C: Pharmacol., Toxicol. Endocrinol. 1997, 116, 61−75.(23) Holdway, D. A.; Brennan, S. E.; Ahokas, J. T. Short review ofselected fish biomarkers of xenobiotic exposure with an example usingfish hepatic mixed-function oxidase. Aust. J. Ecol. 1995, 20, 34−44.(24) Aas, E.; Klungsoyr, J. PAH metabolites in bile and ERODactivity in North Sea fish. Mar. Environ. Res. 1998, 46, 229−232.
Environmental Science & Technology Article
DOI: 10.1021/acs.est.6b01178Environ. Sci. Technol. 2016, 50, 6343−6353
6351

(25) Romeo, M.; Mathieu, A.; Gnassia-Barelli, M.; Romana, A.;Lafaurie, M. Heavy metal content and biotransformation enzymes intwo fish species from the NW Mediterranean. Mar. Ecol.: Prog. Ser.1994, 107, 15−22.(26) Novi, S.; Pretti, C.; Cognetti, A. M.; Longo, V.; Marchetti, S.;Gervasi, P. G. Biotransformation enzymes and their induction by beta-naphthoflavone in adult sea bass (Dicentrarchus labrax). Aquat. Toxicol.1998, 41, 63−81.(27) Iwata, H.; Yoshinari, K.; Negishi, M.; Stegeman, J. J. Species-specific responses of constitutively active receptor (CAR) - CYP2Bcoupling: lack of CYP2B inducer-responsive nuclear translocation ofCAR in marine teleost, scup (Stenotomus chrysops). Comp. Biochem.Physiol., Part C: Toxicol. Pharmacol. 2002, 131, 501−510.(28) Abiola, F.; Lorgue, G.; Benoit, E.; Soyez, D.; Riviere, J. L. Effectsof PCBs on plasma enzymes, testosterone level, and hepatic xenobioticmetabolism in the grey partridge. Bull. Environ. Contam. Toxicol. 1989,43, 473−480.(29) de la Casa-Resino, I.; Valdehita, A.; Soler, F.; Navas, J. M.;Perez-Lopez, M. Endocrine disruption caused by oral administration ofatrazine in European quail (Coturnix coturnix coturnix). Comp.Biochem. Physiol., Part C: Toxicol. Pharmacol. 2012, 156, 159−165.(30) Helgason, L. B.; Arukwe, A.; Gabrielsen, G. W.; Harju, M.;Hegseth, M. N.; Heimstad, E. S.; Jorgensen, E. H.; Mortensen, A. S.;Wolkers, J. Biotransformation of PCBs in Arctic seabirds: Character-ization of phase I and II pathways at transcriptional, translational andactivity levels. Comp. Biochem. Physiol., Part C: Toxicol. Pharmacol.2010, 152, 34−41.(31) Henriksen, E. O.; Gabrielsen, G. W.; Skaare, J. U.; Skjegstad, N.;Jenssen, B. M. Relationships between PCB levels, hepatic ERODactivity and plasma retinol in glaucous gulls. Mar. Environ. Res. 1998,46, 45−49.(32) Velando, A.; Munilla, I.; Lopez-Alonso, M.; Freire, J.; Perez, C.EROD activity and stable isotopes in seabirds to disentangle marinefood web contamination after the Prestige oil spill. Environ. Pollut.2010, 158, 1275−1280.(33) Yang, Y. F.; Wiseman, S.; Cohen-Barnhouse, A. M.; Wan, Y.;Jones, P. D.; Newsted, J. L.; Kay, D. P.; Kennedy, S. W.; Zwiernik, M.J.; Bursian, S. J.; Giesy, J. P. Effects of in ovo exposure of white leghornchicken, common pheasant, and Japanese quail to 2,3,7,8-tetrachlor-odibenzo-p-dioxin and two chlorinated dibenzofurans on CYP1Ainduction. Environ. Toxicol. Chem. 2010, 29, 1490−1502.(34) Kennedy, S. W.; Lorenzen, A.; Jones, S. P.; Hahn, M. E.;Stegeman, J. J. Cytochrome P4501 a induction in avian hepatocytecultures: A promising approach for predicting the sensitivity of avianspecies to toxic effects of halogenated aromatic hydrocarbons. Toxicol.Appl. Pharmacol. 1996, 141, 214−230.(35) Noyes, P. D.; Kelly, S. M.; Mitchelmore, C. L.; Stapleton, H. M.Characterizing the in vitro hepatic biotransformation of the flameretardant BDE 99 by common carp. Aquat. Toxicol. 2010, 97, 142−150.(36) Browne, E. P.; Stapleton, H. M.; Kelly, S. M.; Tilton, S. C.;Gallagher, E. P. In vitro hepatic metabolism of 2,2′,4,4′,5-pentabromodiphenyl ether (BDE 99) in Chinook salmon (Oncho-rhynchus tshawytscha). Aquat. Toxicol. 2009, 92, 281−287.(37) Roberts, S. C.; Noyes, P. D.; Gallagher, E. P.; Stapleton, H. M.Species-specific differences and structure-activity relationships in thedebromination of PBDE congeners in three fish species. Environ. Sci.Technol. 2011, 45, 1999−2005.(38) Uno, S.; Dalton, T. P.; Dragin, N.; Curran, C. P.; Derkenne, S.;Miller, M. L.; Shertzer, H. G.; Gonzalez, F. J.; Nebert, D. W. Oralbenzo[a]pyrene in Cyp1 knockout mouse lines: CYP1A1 important indetoxication, CYP1B1 metabolism required for immune damageindependent of total-body burden and clearance rate. Mol. Pharmacol.2005, 69, 1103−1114.(39) Han, X.; Nabb, D. L.; Yang, C. H.; Snajdr, S. I.; Mingoia, R. T.Liver microsomes and S9 from rainbow trout (Oncorhynchus mykiss):Comparison of basal-level enzyme activities with rat and determinationof xenobiotic intrinsic clearance in support of bioaccumulationassessment. Environ. Toxicol. Chem. 2009, 28, 481−488.
(40) Lee, Y. S.; Otton, S. V.; Campbell, D. A.; Moore, M. M.;Kennedy, C. J.; Gobas, F. A. P. C. Measuring in vitrobiotransformation rates of super hydrophobic chemicals in rat liverS9 fractions using thin-film sorbent-phase dosing. Environ. Sci. Technol.2012, 46, 410−418.(41) Larsen, M. C.; Angus, W. G. R.; Brake, P. B.; Eltom, S. E.;Sukow, K. A.; Jefcoate, C. R. Characterization of CYP1B1 andCYP1A1 expression in human mammary epithelial cells: role of thearyl hydrocarbon receptor in polycyclic aromatic hydrocarbonmetabolism. Cancer Res. 1998, 58, 2366−2374.(42) Liu, F. Y.; Wiseman, S.; Wan, Y.; Doering, J. A.; Hecker, M.;Lam, M. H. W.; Giesy, J. P. Multi-species comparison of themechanism of biotransformation of MeO-BDEs to OH-BDEs in fish.Aquat. Toxicol. 2012, 114, 182−188.(43) Ohkawa, H.; Inui, H. Metabolism of agrochemicals and relatedenvironmental chemicals based on cytochrome P450s in mammals andplants. Pest Manage. Sci. 2015, 71, 824−828.(44) Ronquillo-Sanchez, M. D.; Camacho-Carranza, R.; Fernandez-Mejia, C.; Hernandez-Ojeda, S.; Elinos-Baez, M.; Espinosa-Aguirre, J.J. Modulation of the rat hepatic cytochrome P4501A subfamily usingbiotin supplementation. BioMed Res. Int. 2013, 2013, 1−9.(45) Chen, Y.; Liu, L.; Monshouwer, M.; Fretland, A. J.Determination of time-dependent inactivation of CYP3A4 incryopreserved human hepatocytes and assessment of human drug-drug interactions. Drug Metab. Dispos. 2011, 39, 2085−92.(46) Connors, K. A.; Du, B.; Fitzsimmons, P. N.; Hoffman, A. D.;Chambliss, C. K.; Nichols, J. W.; Brooks, B. W. Comparativepharmaceutical metabolism by rainbow trout (Oncorhynchus mykiss)liver S9 fractions. Environ. Toxicol. Chem. 2013, 32, 1810−1818.(47) Nichols, J. W.; Hoffman, A. D.; ter Laak, T. L.; Fitzsimmons, P.N. Hepatic clearance of 6 polycyclic aromatic hydrocarbons by isolatedperfused trout livers: Prediction from in vitro clearance by liver S9fractions. Toxicol. Sci. 2013, 136, 359−372.(48) Gomez, C. F.; Constantine, L.; Huggett, D. B. The influence ofgill and liver metabolism on the predicted bioconcentration of threepharmaceuticals in fish. Chemosphere 2010, 81, 1189−1195.(49) Lee, Y. S.; Lee, D. H. Y.; Delafoulhouze, M.; Otton, S. V.;Moore, M. M.; Kennedy, C. J.; Gobas, F. A. P. C. In vitrobiotransformation rates in fish liver S9: Effect of dosing techniques.Environ. Toxicol. Chem. 2014, 33, 1885−1893.(50) Laue, H.; Gfeller, H.; Jenner, K. J.; Nichols, J. W.; Kern, S.;Natsch, A. Predicting the bioconcentration of fragrance ingredients byrainbow trout using measured rates of in vitro intrinsic clearance.Environ. Sci. Technol. 2014, 48, 9486−9495.(51) Saunders, L. J. Effect of pre-exposure to treated wastewatereffluent on in vitro biotransformation rates of hydrophobic chemicalsin rainbow trout (Oncorhynchus mykiss). B.Sc. thesis, DalhousieUniversity, British Columbia, Canada, 2010.(52) Pangrekar, J.; Kole, P. L.; Honey, S. A.; Kumar, S.; Sikka, H. C.Metabolism of chrysene by brown bullhead liver microsomes. Toxicol.Sci. 2003, 71, 67−73.(53) Pangrekar, J.; Kole, P. L.; Honey, S. A.; Kumar, S.; Sikka, H. C.Metabolism of phenanthrene by brown bullhead liver microsomes.Aquat. Toxicol. 2003, 64, 407−418.(54) Sikka, H. C.; Rutkowski, J. P.; Kandaswami, C. Comparativemetabolism of benzo[a]pyrene by liver microsomes from brownbullhead and carp. Aquat. Toxicol. 1990, 16, 101−112.(55) Yuan, Z. X.; Honey, S. A.; Kumar, S.; Sikka, H. C. Comparativemetabolism of dibenzo[a,l]pyrene by liver microsomes from rainbowtrout and rats. Aquat. Toxicol. 1999, 45, 1−8.(56) Thakker, D. R.; Yagi, H.; Levin, W.; Wood, A. W.; Conney, A.H.; Jerina, D. M. Polycyclic aromatic hydrocarbons: metabolicactivation to ultimate carcinogens. In Bioactivation of ForeignCompounds; Academic Press: Waltham, MA, 1985; pp 177−242.(57) Nichols, J. W.; Bonnell, M.; Dimitrov, S. D.; Escher, B. I.; Han,X.; Kramer, N. I. Bioaccumulation assessment using predictiveapproaches. Integr. Environ. Assess. Manage. 2009, 5, 577−597.(58) Figueiredo, K.; Maenpaa, K.; Leppanen, M. T.; Kiljunen, M.;Lyytikainen, M.; Kukkonen, J. V. K.; Koponen, H.; Biasi, C.;
Environmental Science & Technology Article
DOI: 10.1021/acs.est.6b01178Environ. Sci. Technol. 2016, 50, 6343−6353
6352

Martikainen, P. J. Trophic transfer of polychlorinated biphenyls (PCB)in a boreal lake ecosystem: Testing of bioaccumulation models. Sci.Total Environ. 2014, 466, 690−698.(59) Verhaert, V.; Covaci, A.; Bouillon, S.; Abrantes, K.; Musibono,D.; Bervoets, L.; Verheyen, E.; Blust, R. Baseline levels and trophictransfer of persistent organic pollutants in sediments and biota fromthe Congo River Basin (DR Congo). Environ. Int. 2013, 59, 290−302.(60) Zhang, Y.; Luo, X. J.; Wu, J. P.; Liu, J.; Wang, J.; Chen, S. J.;Mai, B. X. Contaminant pattern and bioaccumulation of legacy andemerging organhalogen pollutants in the aquatic biota from an e-wasterecycling region in South China. Environ. Toxicol. Chem. 2010, 29,852−9.(61) Kobayashi, J.; Imuta, Y.; Komorita, T.; Yamada, K.; Ishibashi,H.; Ishihara, F.; Nakashima, N.; Sakai, J.; Arizono, K.; Koga, M.Trophic magnification of polychlorinated biphenyls and polybromi-nated diphenyl ethers in an estuarine food web of the Ariake Sea,Japan. Chemosphere 2015, 118, 201−206.(62) Kelly, B. C.; Ikonomou, M. G.; Blair, J. D.; Gobas, F. A. P. C.Bioaccumulation behaviour of polybrominated diphenyl ethers(PBDEs) in a Canadian Arctic marine food web. Sci. Total Environ.2008, 401, 60−72.(63) Khairy, M. A.; Weinstein, M. P.; Lohmann, R. Trophodynamicbehavior of hydrophobic organic contaminants in the aquatic food webof a tidal river. Environ. Sci. Technol. 2014, 48, 12533−12542.(64) Arnold, C. G.; Weidenhaupt, A.; David, M. M.; Muller, S. R.;Haderlein, S. B.; Schwarzenbach, R. P. Aqueous speciation and 1-octanol-water partitioning of tributyl- and triphenyltin: Effect of pHand ion composition. Environ. Sci. Technol. 1997, 31, 2596−2602.(65) Kelly, B. C.; Ikonomou, M. G.; Blair, J. D.; Gobas, F. A. P. C.Hydroxylated and methoxylated polybrominated diphenyl ethers in aCanadian Arctic marine food web. Environ. Sci. Technol. 2008, 42,7069−7077.(66) Chin, Y. P.; Weber, W. J.; Voice, T. C. Determination ofpartition-coefficients and aqueous solubilities by reverse phasechromatography. II. Evaluation of partitioning and solubility models.Water Res. 1986, 20, 1443−1450.(67) Debruijn, J.; Busser, F.; Seinen, W.; Hermens, J. Determinationof octanol water partition-coefficients for hydrophobic organic-chemicals with the slow-stirring method. Environ. Toxicol. Chem.1989, 8, 499−512.(68) Hawker, D. W.; Connell, D. W. Octanol water partition-coefficients of polychlorinated biphenyl congeners. Environ. Sci.Technol. 1988, 22, 382−387.(69) Neff, J. M.; Burns, W. A. Estimation of polycyclic aromatichydrocarbon concentrations in the water column based on tissueresidues in mussels and salmon: An equilibrium partitioning approach.Environ. Toxicol. Chem. 1996, 15, 2240−2253.
Environmental Science & Technology Article
DOI: 10.1021/acs.est.6b01178Environ. Sci. Technol. 2016, 50, 6343−6353
6353