Intrinsic and Extrinsic Factors Affecting...
284
Intrinsic and Extrinsic Factors Affecting Proteasome Inhibitor Resistance in Multiple Myeloma A thesis submitted for the degree of PhD Catriona Ann Hayes (CAH), MB BCh. School of Biotechnology Dublin City University January 2015 The experiment work described in this thesis was carried out under the supervision of Prof. Martin Clynes and Dr. Paul Dowling, School of Biotechnology; and Dr. Peter O’ Gorman, Mater Misericordiea University Hospital, Dublin.
Transcript of Intrinsic and Extrinsic Factors Affecting...
Intrinsic and Extrinsic Factors
Affecting Proteasome Inhibitor
Resistance in Multiple Myeloma
A thesis submitted for the degree of PhD
Catriona Ann Hayes (CAH), MB BCh.
School of Biotechnology
Dublin City University
January 2015
The experiment work described in this thesis was
carried out under the supervision of Prof. Martin
Clynes and Dr. Paul Dowling, School of Biotechnology;
and Dr. Peter O’ Gorman, Mater Misericordiea
University Hospital, Dublin.

I hereby certify that this material, which I now submit for assessment on the
programme of study leading to the award of Ph.D. is entirely my own work, and
that I have exercised reasonable care to ensure that the work is original, and does
not to t
he best of my knowledge breach any law of copyright, and has not been taken from
the work of others save and to the extent that such work has been cited and
acknowledged within the text of my work.
Signed:
Candidate ID No.: 12210012
Date:

The experimental work outlined in this thesis was undertaken at two
institutions, the National Institute for Cellular Biotechnology at Dublin City
University, and at the Jerome Lipper Centre for Multiple Myeloma and Harvard
Institutes for Medicine at the Dana-Farber Cancer Institute in Boston, USA over a
period of 3 years.
Work completed at the National Institute for Cellular Biotechnology was done so
under the supervision of Prof. Martin Clynes, Dr Paul Dowling, and Dr. Peter O’
Gorman, in collaboration with the Mater Misericordiae University Hospital.
At the Dana-Farber Cancer Institute work completed was supervised by Dr
Constantine Mitsiades and Dr. Kenneth Anderson.
Acknowledgements
While working under the supervision of Dr. Peter O' Gorman at the Mater
Misericordiae University Hospital in Dublin as a Medical Senior House Officer I
developed a keen interest in haematology, particularly in multiple myeloma
(MM). The clinical diversity of this disease, in addition to on-going efforts to
decipher mechanisms of its pathogenesis, given the inevitable emergence of
bortezomib resistance in these patients, prompted my initial interest in this field.
Following encouraging discussions with Dr O’ Gorman, Prof. Martin Clynes and
Dr Paul Dowling, I subsequently undertook a PhD program in Biotechnology at
the National Institute for Cellular Biotechnology (NICB), Dublin City University
(DCU), in collaboration with the Dana-Farber Cancer Institute (DFCI) in Boston,
USA, in the field of multiple myeloma research.
In Dublin, I received outstanding mentorship and guidance from all the staff at
the NICB, to whom I am truly indebted, given the anticipated anxiety of
transferring directly from a hospital-based setting to bench work that I had not
completed since my undergraduate degree in medicine. The kindness and
helpfulness of the staff there during this challenging transition cannot be
quantified. In particular I would like to thank Justine Meiller, Michael Henry, Kay
Reen Ting and Colm Cosgrove.
In Boston, I was fortunate enough to be trained in on basic laboratory skills by
my predecessor, Dr Melissa Ooi, a physician who was completing her PhD when I
was beginning, who provided me with the skills necessary to undertake basic
experiments independently. Dr. Constantine Mitsiades and Dr Ken Anderson
with years of experience in multiple myeloma research were a constant source of
innovative ideas for my PhD project and provided me with constant supervision
to ensure timely and effective completion of my research during my time in
Boston. In addition I was so grateful to be allowed shadow in the Multiple
Myeloma out-patients clinic at Dana-Farber under the supervision of Dr Paul
Richardson who gave me a wonderful insight into the current and most up-to-
date clinical management of patients with multiple myeloma, where I learned the
conduction and management of patients on clinical trials.

For the constant support provided to me by my three Dublin-based supervisors,
Prof Martin Clynes, Dr Peter O’ Gorman and Dr Paul Dowling, I will be forever
indebted for their time and dedication committed to my PhD project, and for
their constant encouragement regardless of which side of the Atlantic I was
based at any particular time, and irrespective of Greenwich Mean Time, they
were always available for a word of advice, how to tweak an experiment to
ensure its successful completion and continued encouragement throughout this
programme.
Finally I thank my fiancé Paul Rubin, and my family, especially my parents
Michael and Isobel, and my siblings Paula, Patrick, James and Michael, who were
a constant source of support and encouragement to me throughout the PhD
process.
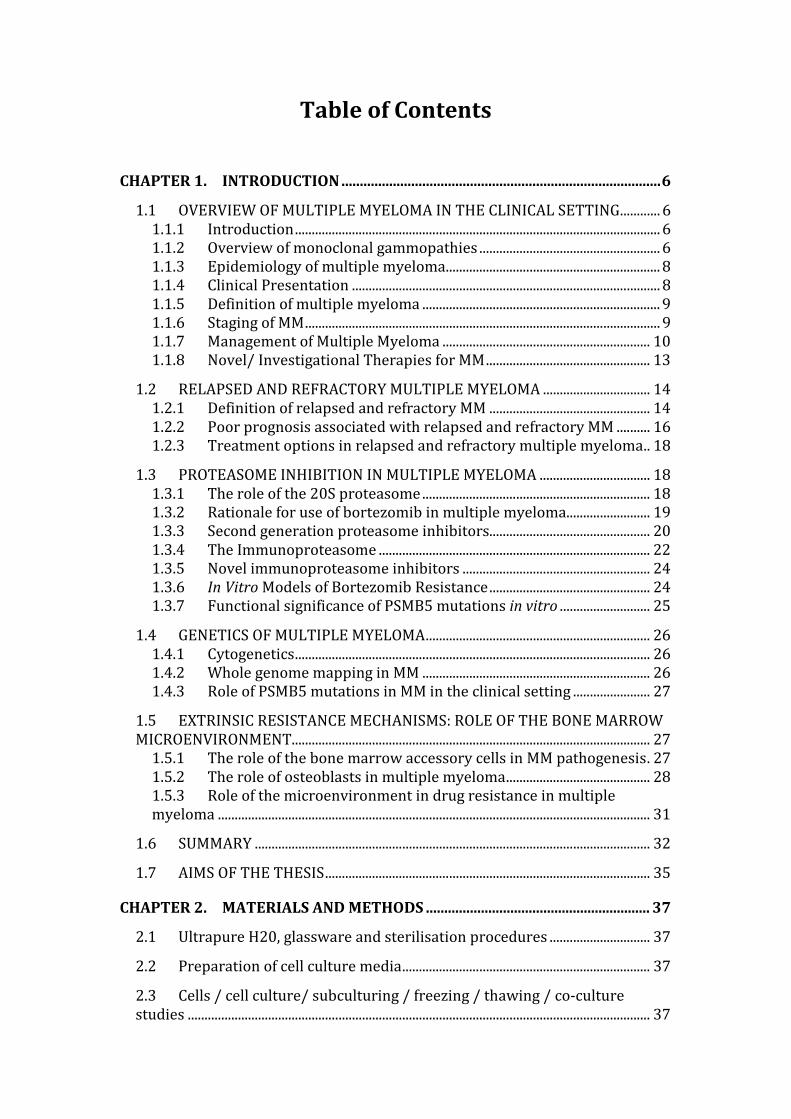
Table of Contents
CHAPTER 1. INTRODUCTION ....................................................................................... 6
1.1 OVERVIEW OF MULTIPLE MYELOMA IN THE CLINICAL SETTING ............ 6
1.1.1 Introduction ............................................................................................................. 6
1.1.2 Overview of monoclonal gammopathies ...................................................... 6
1.1.3 Epidemiology of multiple myeloma................................................................ 8
1.1.4 Clinical Presentation ............................................................................................ 8
1.1.5 Definition of multiple myeloma ....................................................................... 9
1.1.6 Staging of MM .......................................................................................................... 9
1.1.7 Management of Multiple Myeloma .............................................................. 10
1.1.8 Novel/ Investigational Therapies for MM ................................................. 13
1.2 RELAPSED AND REFRACTORY MULTIPLE MYELOMA ................................ 14
1.2.1 Definition of relapsed and refractory MM ................................................ 14
1.2.2 Poor prognosis associated with relapsed and refractory MM .......... 16
1.2.3 Treatment options in relapsed and refractory multiple myeloma .. 18
1.3 PROTEASOME INHIBITION IN MULTIPLE MYELOMA ................................. 18
1.3.1 The role of the 20S proteasome .................................................................... 18
1.3.2 Rationale for use of bortezomib in multiple myeloma......................... 19
1.3.3 Second generation proteasome inhibitors................................................ 20
1.3.4 The Immunoproteasome ................................................................................. 22
1.3.5 Novel immunoproteasome inhibitors ........................................................ 24
1.3.6 In Vitro Models of Bortezomib Resistance ................................................ 24
1.3.7 Functional significance of PSMB5 mutations in vitro ........................... 25
1.4 GENETICS OF MULTIPLE MYELOMA ................................................................... 26
1.4.1 Cytogenetics .......................................................................................................... 26
1.4.2 Whole genome mapping in MM .................................................................... 26
1.4.3 Role of PSMB5 mutations in MM in the clinical setting ....................... 27
1.5 EXTRINSIC RESISTANCE MECHANISMS: ROLE OF THE BONE MARROW MICROENVIRONMENT........................................................................................................... 27
1.5.1 The role of the bone marrow accessory cells in MM pathogenesis . 27
1.5.2 The role of osteoblasts in multiple myeloma ........................................... 28
1.5.3 Role of the microenvironment in drug resistance in multiple myeloma ................................................................................................................................. 31
1.6 SUMMARY ...................................................................................................................... 32
1.7 AIMS OF THE THESIS ................................................................................................. 35
CHAPTER 2. MATERIALS AND METHODS ............................................................. 37
2.1 Ultrapure H20, glassware and sterilisation procedures .............................. 37
2.2 Preparation of cell culture media .......................................................................... 37
2.3 Cells / cell culture/ subculturing / freezing / thawing / co-culture studies .......................................................................................................................................... 37

2.4 STR analysis of cell lines ........................................................................................... 39
2.5 Reagents .......................................................................................................................... 40
2.6 Generation of a bortezomib resistant cell line. ................................................ 42
2.7 In vitro toxicity assays measuring cell viability ............................................... 42
2.8 In vivo mouse model treatment with bortezomib or carfilzomib ............. 43
2.9 Immunoblot ................................................................................................................... 44
2.10 Whole exome sequencing .................................................................................... 45
2.11 Validation of mutPSMB5 in VDR cell line ....................................................... 46
2.12 Gene expression profiling .................................................................................... 46
2.13 shRNA knockdown studies .................................................................................. 46
2.14 Lentiviral infection of mutPSMB5 in bortezomib-sensitive cell lines 48
2.15 Label-free mass spectrometry ........................................................................... 49
2.16 Transwell co-cultures of hFob 1.19 and MM.1S cells ................................ 49
2.17 Characteristics of bortezomib-refractory patients selected from Multiple Myeloma BioBank .................................................................................................. 50
2.18 Immunohistochemistry ........................................................................................ 54
2.19 Statistical Analysis .................................................................................................. 54
CHAPTER 3. RESULTS .................................................................................................. 57
3.1 CHARACTERISATION OF AN ISOGENIC CELL LINE MODEL OF BORTEZOMIB RESISTANCE IN VITRO AND IN VIVO. ................................................. 57
3.1.1 Introduction .......................................................................................................... 57
3.1.2 Generation of a cell line model of bortezomib resistance ................... 57
3.1.3 Response profile of VDR cells to conventional and novel therapies60
3.1.4 Sensitivity of VDR to novel proteasome inhibitors ............................... 69
3.1.5 The role of p-glycoprotein in bortezomib resistance in VDR. ........... 72
3.1.6 Baseline proliferation rate of MM.1R and VDR cell lines .................... 75
3.1.7 Sensitivity of isogenic cell lines MM.1R and VDR to bortezomib and carfilzomib in vivo .............................................................................................................. 77
3.1.8 Summary of in vitro and in vivo studies ..................................................... 82
3.2 WHOLE EXOME SEQUENCING OF MM.1R AND VDR CELL LINES ............ 83
3.2.1 Introduction .......................................................................................................... 83
3.2.2 Frequency of single nucleotide variants observed between isogenic cell lines MM.1R and VDR ................................................................................................ 83
3.2.3 Insertions and deletions identified in VDR vs. MM.1R ......................... 87
3.2.4 Identification of PSMB5 mutation in VDR cell line ................................ 89
3.2.5 Sensitivity of KMS11 cell line to bortezomib following lentiviral infection with mutPSMB5 ................................................................................................ 90
3.2.6 Summary of whole exome sequencing study ........................................... 92
3.3 GENE EXPRESSION PROFILING OF MM.1R AND VDR .................................. 94
3.3.1 Introduction .......................................................................................................... 94
3.3.2 Transcripts over-expressed in VDR compared to MM.1R .................. 95
3.3.3 Transcripts downregulated in VDR compared to MM.1R ................. 111
3.3.4 Identification of transcripts of interest for shRNA knockdown screening .............................................................................................................................. 117
3.3.5 Results of shRNA knockdown screen ....................................................... 119
3.3.6 Validation of shRNA knockdown of PSMB5 ........................................... 124
3.3.7 Conclusion of gene expression profiling studies .................................. 128
3.4 PROTEOMIC PROFILE OF MM.1R AND VDR BY LABEL-FREE MASS SPECTROMETRY ..................................................................................................................... 130
3.4.1 Introduction ........................................................................................................ 130
3.4.2 Proteins over-expressed in VDR vs. MM.1R ........................................... 132
3.4.3 Proteins down-regulated in VDR compared to MM.1R ...................... 141
3.4.4 Individual biomarkers down-regulated in MM.1R or VDR following bortezomib treatment ..................................................................................................... 149
3.4.5 Proteins over-expressed in bortezomib treated VDR compared to bortezomib treated MM.1R ........................................................................................... 163
3.4.6 PSMB5 protein expression in MM.1R and VDR with and without bortezomib treatment ..................................................................................................... 173
3.4.7 Immunoblot validation of proteins differentially expressed in VDR compared to MM.1R ......................................................................................................... 175
3.4.8 Summary of proteomic profiling studies ................................................. 177
3.5 FUNCTIONAL STUDIES AND POTENTIAL ROLE OF THE BONE MARROW MICROENVIRONMENT IN THE PATHOGENESIS OF BORTEZOMIB RESISTANCE IN VDR ........................................................................................................................................ 180
3.5.1 Introduction ........................................................................................................ 180
3.5.2 Effect of HS-5 stromal cells on sensitivity of MM1R and VDR to bortezomib and carfilzomib .......................................................................................... 181
3.5.3 Investigation of the role for combination therapies to overcome bortezomib resistance in VDR cells in co-culture with HS-5 stromal cells . 184
3.5.4 Effect of osteoblasts on proliferation rate and sensitivity of MM.1S, MM.1R and VDR to therapies in vitro ........................................................................ 187
3.5.5 Role of direct cell-to-cell contact in osteoblast-like cell-induced drug resistance in MM.1S .......................................................................................................... 191
3.5.6 Role of cell-to-accessory cell ratio and protein content in observed osteoblast-like cell-induced resistance ..................................................................... 193
3.5.7 Upregulation of PSMB8 by interferon-gamma increases the sensitivity of VDR cell lines to bortezomib ............................................................. 196
3.5.8 PSMB5 and PSMB8 expression in vivo ...................................................... 200
3.5.9 Summary of functional studies ......................................................................... 206
CHAPTER 4. DISCUSSION .......................................................................................... 209
4.1 CHARACTERISATION OF AN ISOGENIC CELL LINE MODEL OF BORTEZOMIB RESISTANCE IN VITRO AND IN VIVO. .............................................. 209
4.1.1 Introduction ........................................................................................................ 209
4.1.2 The use of cell line models to examine bortezomib resistance in
vitro and in vivo .................................................................................................................. 210
4.1.3 Variations in the sensitivity of bortezomib-resistant cells to other therapies in vitro ................................................................................................................ 211
4.1.4 Potential FDA-approved compounds that overcome bortezomib resistance in VDR .............................................................................................................. 212
4.1.5 The efficacy of novel proteasome inhibitors in the setting of bortezomib resistance in vitro ..................................................................................... 215
4.1.6 P-glycoprotein does not mediate bortezomib resistance in VDR .. 215
4.1.7 The in vivo efficacy of bortezomib and carfilzomib in bortezomib-resistant VDR cell line ...................................................................................................... 216
4.2 MUTATIONAL ALTERATIONS IN MM.1R AND VDR AS IDENTIFIED BY WHOLE EXOME SEQUENCING .......................................................................................... 219
4.2.1 Introduction to whole exome sequencing ............................................... 219
4.2.2 Single nucleotide variants identified in bortezomib-resistant VDR but not MM.1R .................................................................................................................... 220
4.2.3 Deletion in ABCA7 gene identified in VDR cell line ............................. 224
4.2.4 In vitro and in vivo significance of mutPSMB5 identified in VDR ... 226
4.3 TRANSCRIPTIONAL PROFILE OF ISOGENIC CELL LINE MODEL OF BORTEZOMIB RESISTANCE ............................................................................................... 227
4.3.1 Introduction to gene expression profiling .............................................. 227
4.3.2 Pathways associated with genes over-expressed in VDR compared to MM.1R ............................................................................................................................... 227
4.3.3 Pathways associated with genes down-regulated in VDR compared to MM.1R ............................................................................................................................... 228
4.3.4 shRNA knockdown studies of genes up-regulated in VDR ............... 229
4.4 PROTEOMIC PROFILING OF ISOGENIC CELL LINE MODEL OF BORTEZOMIB RESISTANCE ............................................................................................... 232
4.4.1 Introduction to proteomic profiling in MM.1R and VDR ................... 232
4.4.2 Protein expression in VDR compared to MM.1R .................................. 232
4.4.3 Protein expression in bortezomib-treated VDR and bortezomib-treated MM.1R .................................................................................................................... 234
4.4.4 Potential significance of PSMB5 in bortezomib resistance .............. 236
4.5 THE ROLE OF THE BONE MARROW MICROENVIRONMENT AND ITS FURTHER CONTRIBUTION TO DRUG RESISTANCE ................................................. 239
4.5.1 Introduction ........................................................................................................ 239
4.5.2 VDR is subject to HS-5 stromal cell–induced drug resistance. ........ 239
4.5.3 Osteoblasts promote myeloma cell proliferation and contribute to drug resistance ................................................................................................................... 240
4.5.4 Role of the immunoproteasome and interferon-gamma in bortezomib resistance in vitro ..................................................................................... 243
4.5.5 Role of the immunoproteasome in the in vivo setting in bortezomib-refractory myeloma .......................................................................................................... 245
CHAPTER 5. SUMMARY, CONCLUSION AND FUTURE WORK ........................ 250
5.1 SUMMARY AND CONCLUSION ............................................................................. 250
5.1.1 Characterisation of an isogenic cell line model of bortezomib resistance in vitro and in vivo. ...................................................................................... 250
5.1.2 Whole exome sequencing of MM.1R and VDR ....................................... 251
5.1.3 Gene expression profiles of MM.1R and VDR ........................................ 252
5.1.4 Proteomic profiling of MM.1R and VDR by label-free mass spectrometry ....................................................................................................................... 253
5.1.5 Functional studies and potential role of the bone marrow microenvironment in the pathogenesis of bortezomib resistance in VDR . 254
5.1.6 CONCLUSION ...................................................................................................... 255
5.2 FUTURE WORK ........................................................................................................... 259
5.2.1 Characterisation of an isogenic cell line model of bortezomib resistance in vitro and in vivo. ...................................................................................... 259
5.2.2 Whole exome sequencing of MM.1R and VDR ....................................... 259
5.2.3 Gene expression profiles of MM.1R and VDR ........................................ 259
5.2.4 Proteomic profiling of MM.1R and VDR by label-free mass spectrometry ....................................................................................................................... 259
5.2.5 Role of the bone marrow microenvironment in the pathogenesis of bortezomib resistance in VDR ...................................................................................... 260
6. SCIENTIFIC WORK PUBLISHED OR PRESENTED ......................................... 261
REFERENCES .................................................................................................................... 263

1
ABBREVIATIONS
ALL Acute lymphoblastic leukaemia
AML Acute myeloid leukaemia
ASCT Autologous Stem Cell Transplant
BJP Bence-Jones Proteins
BMSC Bone marrow stromal cell
BR Bortezomib Resistance
c Monoculture
C-L Caspase-like
cc Co-culture
CFZ Carfilzomib
CI Confidence interval
CRAB Hypercalcaemia, Renal Impairment, Anaemia, Lytic Bone Lesions
CSBLI Compartment-specific bioluminescence imaging
CT-L Chymotrypsin-like
CTG Cell Titre Glo
DAVID Database for Annotation, Visualization and Integrated Discovery
DCU Dublin City University
Del Deletion
DFCI Dana-Farber Cancer Institute
EFS Event free survival
FDA Federal Drug Association
GEP Gene expression profiling
GFP Green-fluorescent protein
GO Gene Ontology
HDAC Histone deacetylase
hFob Human Foetal Osteoblast-like
2
HS-5 Human Stromal Cell line-5
HSP Heat shock protein
IFN Interferon
IHC Immunohistochemistry
IL-6 Interleukin-6
IMiD Immunomodulator (e.g. lenalidomide/ pomalidomide/ thalidomide)
IMWG International Myeloma Working Group
IV Intravenously
Luc Luciferase
M-protein Monoclonal Protein
Mcl M-Cherry-luc
MGUS Monoclonal Gammopathy Of Uncertain Significance
MM Multiple Myeloma
MRI Magnetic Resonance Imaging
MSC Mesenchymal stem cell
MTT 3-(4,5-dimethylthiazol-2-yl)-2,5-diphenyltetrazolium bromide
Mut Mutant
NEDD8 Neural precursor cell expressed, developmentally down-regulated 8
NF-ĸB Nuclear factor-kappaB
NICB National Institute for Cellular Biotechnology
nM Nanomolar
OB Osteoblast
OC Osteoclast
OS Overall survival
P-gp P-glycoprotein
PET-CT Positron Emission Tomography-Computerised Tomography
PI Proteasome inhibitor
PO Per oral
3
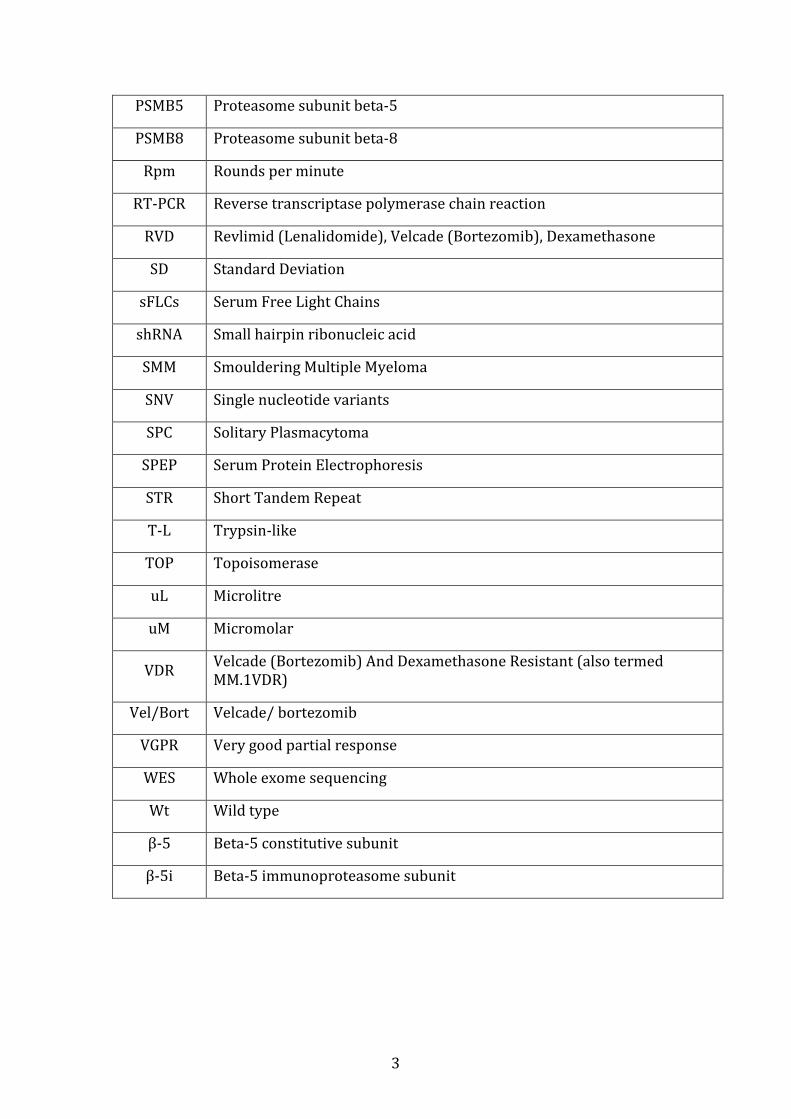
PSMB5 Proteasome subunit beta-5
PSMB8 Proteasome subunit beta-8
Rpm Rounds per minute
RT-PCR Reverse transcriptase polymerase chain reaction
RVD Revlimid (Lenalidomide), Velcade (Bortezomib), Dexamethasone
SD Standard Deviation
sFLCs Serum Free Light Chains
shRNA Small hairpin ribonucleic acid
SMM Smouldering Multiple Myeloma
SNV Single nucleotide variants
SPC Solitary Plasmacytoma
SPEP Serum Protein Electrophoresis
STR Short Tandem Repeat
T-L Trypsin-like
TOP Topoisomerase
uL Microlitre
uM Micromolar
VDR Velcade (Bortezomib) And Dexamethasone Resistant (also termed MM.1VDR)
Vel/Bort Velcade/ bortezomib
VGPR Very good partial response
WES Whole exome sequencing
Wt Wild type
β-5 Beta-5 constitutive subunit
β-5i Beta-5 immunoproteasome subunit
4
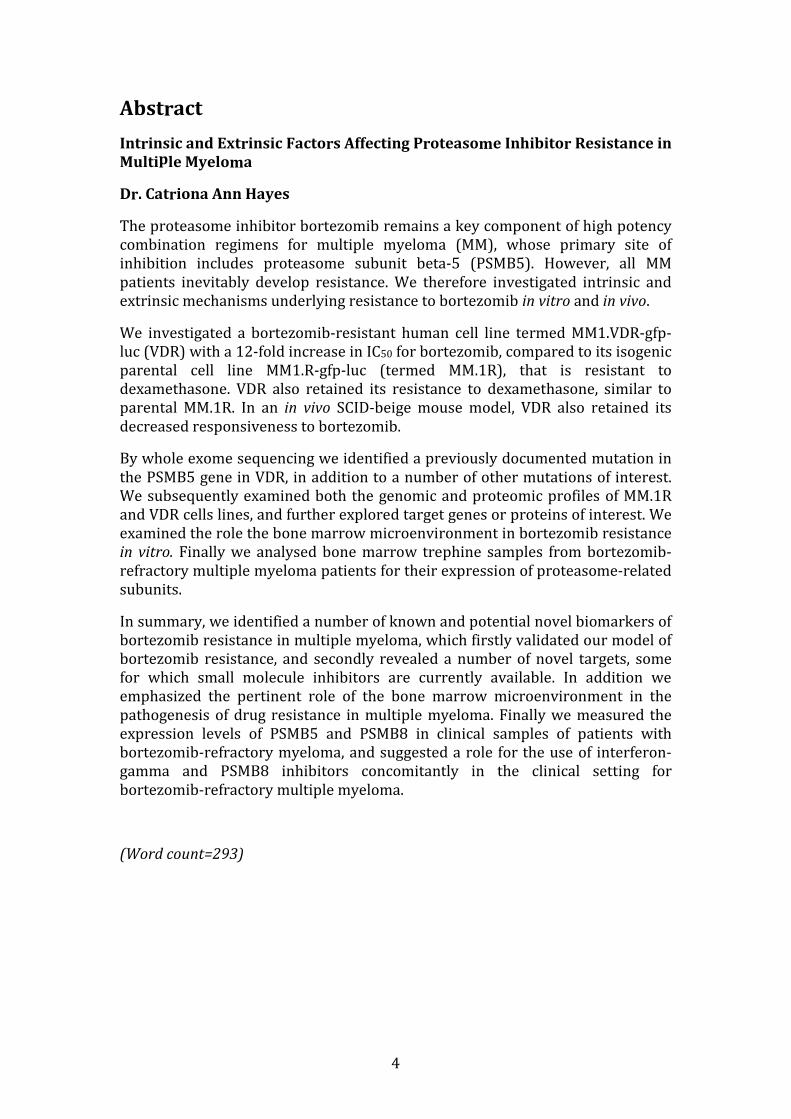
Abstract
Intrinsic and Extrinsic Factors Affecting Proteasome Inhibitor Resistance in
Multiple Myeloma
Dr. Catriona Ann Hayes
The proteasome inhibitor bortezomib remains a key component of high potency combination regimens for multiple myeloma (MM), whose primary site of inhibition includes proteasome subunit beta-5 (PSMB5). However, all MM patients inevitably develop resistance. We therefore investigated intrinsic and extrinsic mechanisms underlying resistance to bortezomib in vitro and in vivo.
We investigated a bortezomib-resistant human cell line termed MM1.VDR-gfp-luc (VDR) with a 12-fold increase in IC50 for bortezomib, compared to its isogenic parental cell line MM1.R-gfp-luc (termed MM.1R), that is resistant to dexamethasone. VDR also retained its resistance to dexamethasone, similar to parental MM.1R. In an in vivo SCID-beige mouse model, VDR also retained its decreased responsiveness to bortezomib.
By whole exome sequencing we identified a previously documented mutation in the PSMB5 gene in VDR, in addition to a number of other mutations of interest. We subsequently examined both the genomic and proteomic profiles of MM.1R and VDR cells lines, and further explored target genes or proteins of interest. We examined the role the bone marrow microenvironment in bortezomib resistance in vitro. Finally we analysed bone marrow trephine samples from bortezomib-refractory multiple myeloma patients for their expression of proteasome-related subunits.
In summary, we identified a number of known and potential novel biomarkers of bortezomib resistance in multiple myeloma, which firstly validated our model of bortezomib resistance, and secondly revealed a number of novel targets, some for which small molecule inhibitors are currently available. In addition we emphasized the pertinent role of the bone marrow microenvironment in the pathogenesis of drug resistance in multiple myeloma. Finally we measured the expression levels of PSMB5 and PSMB8 in clinical samples of patients with bortezomib-refractory myeloma, and suggested a role for the use of interferon-gamma and PSMB8 inhibitors concomitantly in the clinical setting for bortezomib-refractory multiple myeloma.
(Word count=293)

5
Chapter 1
Introduction

6
CHAPTER 1. INTRODUCTION
1.1 OVERVIEW OF MULTIPLE MYELOMA IN THE CLINICAL
SETTING
1.1.1 Introduction
Multiple myeloma (MM) is characterised by unrestrained proliferation of
terminally differentiated B-lymphocytes (i.e. plasma cells). It remains an
incurable disease. Myeloma is the second most common lymphoid malignancy
after non-Hodgkin’s lymphoma, and third most common haematological
malignancy in Europe.[1] In the past decade, MM overall survival rates have
dramatically improved in an era of proteasome inhibitors by the first-in-class
agent, bortezomib. The APEX (Assessment of Proteasome Inhibition for
Extending Remissions) Phase III clinical trial demonstrated a 6-month overall
survival advantage with bortezomib monotherapy compared to high dose
dexamethasone alone for relapsed MM.[2] Presently bortezomib is currently used
in combination schedules as up-front treatment for newly diagnosed MM, in
addition to forming a core component of treatment regimens for relapsed and
refractory disease.[3] However a dismal 9-month overall survival associated with
relapsed and refractory MM provokes an urgent need to decipher fundamental
mechanisms involved in bortezomib resistance (BR).[4] By delineating
bortezomib-specific resistance pathways that can be overcome by targeted
therapy, we aim to further improve the prognosis of patients with relapsed and
refractory multiple myeloma.
1.1.2 Overview of monoclonal gammopathies
Multiple myeloma develops from an earlier indolent form of monoclonal plasma
cell proliferation, called monoclonal gammopathy of undetermined significance
(MGUS), whereby a monoclonal protein is detected in the patient’s blood.
Approximately 1% of MGUS patients will progress to multiple myeloma each
year.[5] In MGUS or MM, uncontrolled plasma cell proliferation results in the
secretion of a monoclonal protein of a specific isotype, resulting in abnormal
heavy chain (IgG/ IgA/ IgD) and/or light chain (kappa, lambda) immunoglobulin
production. This results in varying isotypes of multiple myeloma, such as IgG
7
kappa myeloma (by far the most common), IgA kappa myeloma, IgA lambda
myeloma, or light chain myeloma (characterised by the detection of free light
chains only in the serum or urine), or much less frequently, IgD myeloma. The
monoclonal protein (or M-protein) is quantified by immunofixation and serum
protein electrophoresis, and is one of the criteria used to monitor response to
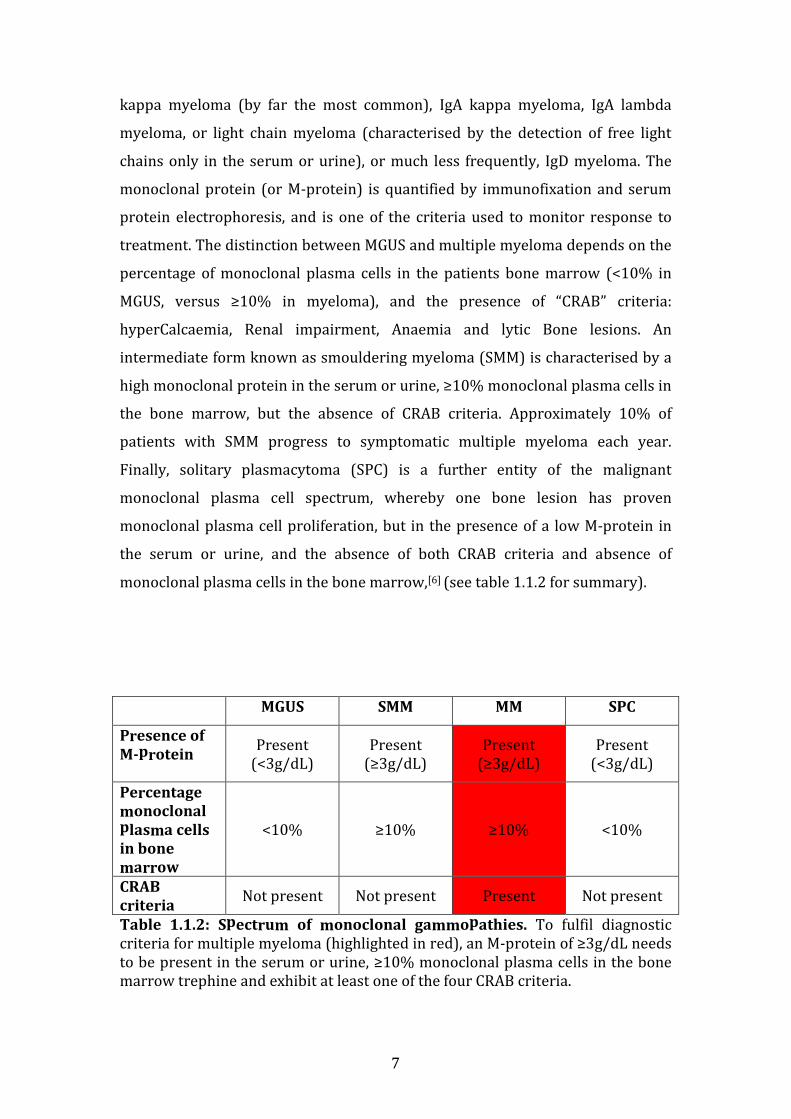
treatment. The distinction between MGUS and multiple myeloma depends on the
percentage of monoclonal plasma cells in the patients bone marrow (<10% in
MGUS, versus ≥10% in myeloma), and the presence of “CRAB” criteria:
hyperCalcaemia, Renal impairment, Anaemia and lytic Bone lesions. An
intermediate form known as smouldering myeloma (SMM) is characterised by a
high monoclonal protein in the serum or urine, ≥10% monoclonal plasma cells in
the bone marrow, but the absence of CRAB criteria. Approximately 10% of
patients with SMM progress to symptomatic multiple myeloma each year.
Finally, solitary plasmacytoma (SPC) is a further entity of the malignant
monoclonal plasma cell spectrum, whereby one bone lesion has proven
monoclonal plasma cell proliferation, but in the presence of a low M-protein in
the serum or urine, and the absence of both CRAB criteria and absence of
monoclonal plasma cells in the bone marrow,[6] (see table 1.1.2 for summary).
MGUS SMM MM SPC
Presence of
M-protein
Present (<3g/dL)
Present (≥3g/dL)
Present (≥3g/dL)
Present (<3g/dL)
Percentage
monoclonal
plasma cells
in bone
marrow
<10% ≥10% ≥10% <10%
CRAB
criteria Not present Not present Present Not present
Table 1.1.2: Spectrum of monoclonal gammopathies. To fulfil diagnostic criteria for multiple myeloma (highlighted in red), an M-protein of ≥3g/dL needs to be present in the serum or urine, ≥10% monoclonal plasma cells in the bone marrow trephine and exhibit at least one of the four CRAB criteria.
8
1.1.3 Epidemiology of multiple myeloma
A large retrospective study examining the survival of patients with
haematological malignancies recently published in the Lancet journal outlines
the frequency of haematological malignancies in Europe and associated survival
scores for each subtype. As previously mentioned, multiple myeloma is the
second most common lymphoid malignancy after non-Hodgkin’s lymphoma, and
third most common haematological malignancy in Europe. Of all the lymphoid
malignancies, multiple myeloma was the most frequently occurring, compared to
Hodgkin’s lymphoma and individual non-Hodgkin’s lymphoma subtypes.
Between 1996 and 2007, 81,562 cases of multiple myeloma or plasmacytoma
have been documented. In 1997-1999, the 5-year relative survival for myeloma
was 29.8% which dramatically increased to 39.6% by 2006-2008, and this stark
increase has been attributed to novel therapies for myeloma such as the
immunomodulators thalidomide and lenalidomide, and the proteasome inhibitor
bortezomib.[1]
1.1.4 Clinical Presentation
Multiple myeloma exhibits varying degrees of clinical presentation. Patients with
known MGUS or smouldering myeloma have routine monitoring of monoclonal-
protein (M-protein) by serum protein electrophoresis (SPEP), serum free light
chains (sFLCs), Bence-Jones proteins (BJP), creatinine, calcium, and
haemoglobin. A rise in M-protein/sFLC/BJP or the development of CRAB criteria
warrant restaging and this is a common means of detecting symptomatic
myeloma in the clinic. CRAB criteria manifest clinically as bone pain (secondary
to lytic lesions), fatigue, perioral paraesthesia (secondary to hypercalcaemia),
anuria or oliguria (secondary to renal impairment), or autonomic neuropathy (a
paraneoplastic phenomenon associated with myeloma). Suppression of normal
immunoglobulins by the predominating monoclonal protein can cause impaired
immune function and increased frequency of infections.
Other patients are diagnosed following investigation of unexplained
hypercalcaemia or renal impairment. Some patients will have an incidental
finding of a raised total serum protein on routine liver profile testing, with a
9
large globulin-to-total-protein ratio. Finally, a number of patients will present
with multiple myeloma without preceding MGUS or SMM, and will exhibit a
monoclonal protein in the serum or urine, 10% or more monoclonal plasma cells
in the bone marrow, and end-organ damage such as debilitating vertebral body
collapse manifesting with severe back pain or even paralysis. Finally, if the
tumour burden in the bone marrow is over-whelming, patients may even present
with a secondary plasma cell leukaemia, whereby circulating malignant plasma
cells can be seen on blood film by light microscopy.
1.1.5 Definition of multiple myeloma
To recap, diagnosis of multiple myeloma is based on the International Myeloma
Working Groups diagnostic criteria as defined by the following parameters:
≥10% monoclonal plasma cells present in the bone marrow, the detection of an
M (monoclonal)-protein in the serum and/or urine, whilst also fulfilling at least
one of the four “CRAB” criteria, that cannot be explained by another concomitant
pathological process.[6]
1.1.6 Staging of MM
The Durie-Salmon staging system was historically used to determine stage of
multiple myeloma, and is based on total M-protein in serum or urine,
haemoglobin level, serum calcium level and the number of lytic lesions identified
on skeletal survey. This staging system was first published in 1975, however
with more advanced means of determining the extent of lytic bone disease and
with increased availability of PET-CT and MRI to identify lytic bone lesions, this
staging system is less frequently used nowadays.[7]
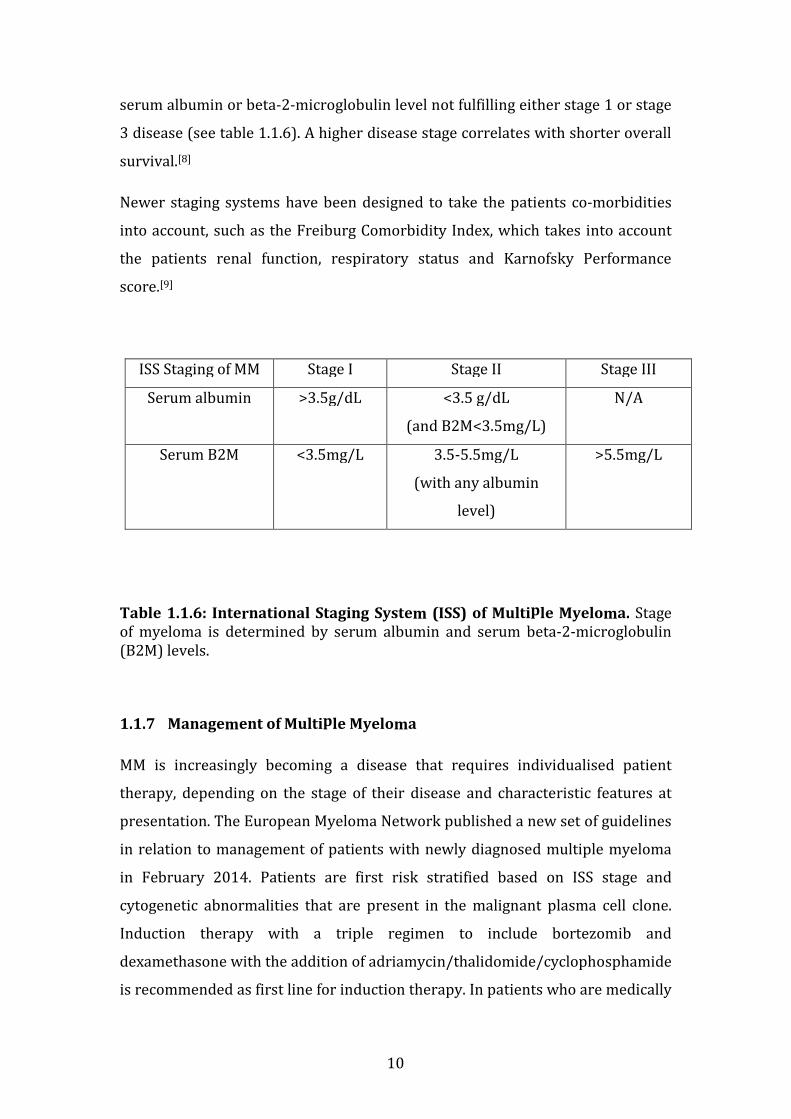
Currently the cornerstone of staging of multiple myeloma is determined by the
International Staging System, which incorporates the patients’ serum albumin
and beta-2-microglobulin levels. Patients with a serum albumin measurement
greater than or equal to 3.5g/dL and a serum beta-2-microglobulin lower than
3.5mg/L are by definition stage 1 disease. Stage 3 disease is defined a having a
serum beta-2-microglobulin greater than 5.5mg/L. Stage 2 disease is defined as a
10
serum albumin or beta-2-microglobulin level not fulfilling either stage 1 or stage
3 disease (see table 1.1.6). A higher disease stage correlates with shorter overall
survival.[8]
Newer staging systems have been designed to take the patients co-morbidities
into account, such as the Freiburg Comorbidity Index, which takes into account
the patients renal function, respiratory status and Karnofsky Performance
score.[9]
Table 1.1.6: International Staging System (ISS) of Multiple Myeloma. Stage of myeloma is determined by serum albumin and serum beta-2-microglobulin (B2M) levels.
1.1.7 Management of Multiple Myeloma
MM is increasingly becoming a disease that requires individualised patient
therapy, depending on the stage of their disease and characteristic features at
presentation. The European Myeloma Network published a new set of guidelines
in relation to management of patients with newly diagnosed multiple myeloma
in February 2014. Patients are first risk stratified based on ISS stage and
cytogenetic abnormalities that are present in the malignant plasma cell clone.
Induction therapy with a triple regimen to include bortezomib and
dexamethasone with the addition of adriamycin/thalidomide/cyclophosphamide
is recommended as first line for induction therapy. In patients who are medically
ISS Staging of MM Stage I Stage II Stage III
Serum albumin >3.5g/dL <3.5 g/dL
(and B2M<3.5mg/L)
N/A
Serum B2M <3.5mg/L 3.5-5.5mg/L
(with any albumin
level)
>5.5mg/L
11
fit, induction therapy should be followed by autologous stem cell transplant
(ASCT), with subsequent thalidomide or lenalidomide-based maintenance
therapy. Bortezomib consolidation should also be considered following ASCT
should the patient fail to achieve an excellent response to ASCT. In patients who
are non-transplant eligible, a combination of melphalan and prednisolone with
either bortezomib or thalidomide is recommended, with the possibility of
lenalidomide monotherapy or lenalidomide plus reduced-dose dexamethasone
maintenance,[10] (see figure 1.1.7 for summary).
Locally in our tertiary referral centre at the Mater Misericordiae University
Hospital, patients initially undergo induction therapy with a bortezomib-based
regimen for example RVD (lenalidomide (i.e. Revlimid), bortezomib (i.e.
Velcade), dexamethasone).[11] Patients also receive monthly bisphosphonate
infusions, mainly zoledronic acid, which has been shown to reduce skeletal-
related events (i.e. bone fractures) in MM patients and also appears to increase
overall survival in MM.[12] For transplant eligible candidates, if an appropriate
response is achieved with induction therapy, autologous stem cell transplant
(ASCT) will be considered depending on the individual’s risk for progression.
Following ASCT, or achievement of clinical response in the absence of ASCT,
patients are assigned maintenance therapy, often in the form of lenalidomide
which has been shown to prolong time to progression and overall survival, and
are maintained on same until progression occurs.[13]

12
Figure 1.1.7: European Myeloma Network 2014 Guidelines on Management
of Newly diagnosed Multiple Myeloma. Overview of recent guidelines for the
management of newly diagnosed MM. Note: Bort= bortezomib; Adria=
adriamycin; Dex= high dose dexamethasone; Thal= thalidomide; Cyclophos=
cyclophosphamide; Len= lenalidomide; Mel= melphalan; Pred= prednisolone;
dex= low dose dexamethasone.
Newly diagnosed
Multiple Myeloma
Transplant
eligible
Induction:
Bort/Adria/Dex
or
Bort/Thal/Dex
or
Bort/Cyclophos/Dex
Autologous Stem Cell Transplant
Optimal Response
Len maintenance
Suboptimal Response
Bort consolidation,
then Len maintenance.
Transplant
ineligible
Induction:
Mel/Bort/Pred
or
Mel/Thal/Pred
Maintenance:
Len
or
Len/dex
13
1.1.8 Novel/ Investigational Therapies for MM
A variety of promising novel agents are currently under investigation for the
management of MM. These include novel histone deacetylase inhibitors (e.g.
panobinostat), second generation proteasome inhibitors (carfilzomib, ixazomib),
novel immunomodulators (such as pomalidomide), a novel PI3K-Akt
(phosphatidylinositol 3-kinase-Akt) inhibitor (perifosine), a NEDD8-activating
enzyme inhibitor (MLN4924) and an mTOR inhibitor (BEZ235).
Histone deacetylase (HDAC) inhibitors such as vorinostat have successfully
undergone Phase I clinical trials in 2008 demonstrating tolerability in relapsed
and refractory MM as a single agent,[14] and furthermore efficacy when used in
combination with bortezomib in another clinical trial in 2012.[15] Panobinostat, a
class I, II and IV HDAC inhibitor is considered the most efficacious HDAC
inhibitor and allows dual inhibition of the proteasome and aggresome when
combined with bortezomib.[16] A number of phase 1 and 2 clinical trials,
including PANORAMA 2 at our collaborating centre at Dana-Farber Cancer
Institute, have proven its efficacy for use in relapsed and refractory multiple
myeloma in the clinical setting.[17-19] Panobinostat is also undergoing clinical
trials for its use in newly diagnosed transplant-eligible multiple myeloma in
combination with lenalidomide-bortezomib-dexamethasone, and in the relapsed
and refractory setting in combination with carfilzomib (www.clinicaltrials.gov).
With the success of bortezomib, second generation proteasome inhibitors (PIs)
are now at the forefront of investigation for MM treatment. In particular
carfilzomib, a proteasome inhibitor which binds irreversibly to the proteasome,
received FDA approval in July 2012 for use in relapsed and refractory multiple
myeloma, in patients who have received at least 2 previous treatment regimens
containing bortezomib and an immunomodulator such as lenalidomide or
thalidomide.[20] A number of further studies have proven the efficacy of
carfilzomib in both newly diagnosed and relapsed and refractory multiple
myeloma.[21-24] Furthermore, oral proteasome inhibitors are also under
investigation such as marizomib, a broad spectrum proteasome inhibitor that is
14
at the pre-clinical phase of investigation and targets multiple sites of proteolytic
activity within the proteasome,[25] and ixazomib, a twice weekly oral proteasome
inhibitor which has just completed phase 1 clinical trial with promising results
for its use in refractory myeloma.[26]
In an era of novel proteasome inhibitors, we also see novel immunomodulatory
drugs at the forefront of multiple myeloma research. In particular pomalidomide
in February 2013 was granted accelerated FDA-approval for its use in refractory
multiple myeloma in the United States, and subsequently achieved approval in
Europe in August 2013.[27-31] At our local haematology department at the Mater
Misericordiae Hospital in Dublin we have enrolled a number of patients in the
STRATUS study that is examining the use of pomalidomide in combination with
low dose dexamethasone in relapsed and refractory myeloma.
Finally, perifosine, the Akt inhibitor that targets phosphatidylinositol 3-kinase-
Akt signalling, has successfully completed Phase I clinical trials in relapsed
myeloma with encouraging results.[32, 33] Down the pipeline additional agents
that are currently under investigation include those targeting two pathways
strongly implicated in multiple myeloma pathogenesis including (a) the
ubiquitination pathway, in particular NEDD-8-activating enzyme inhibition via
MLN4924 (of which phase 1 clinical trial has been completed, results
pending),[34] and (b) inhibitors of the phosphatidylinositol 3-kinase (PI3K)-Akt-
mammalian target of rapamycin (mTOR) pathway via BEZ235 (which is
currently in clinical trials for solid tumour malignancies).[35]
1.2 RELAPSED AND REFRACTORY MULTIPLE MYELOMA
1.2.1 Definition of relapsed and refractory MM
The International Myeloma Working Group, in addition to providing us with
diagnostic criteria for myeloma, have also provided us with response criteria in
multiple myeloma.[6] Response is broken down into a number of categories that
include complete response (CR), very good partial response (VGPR), partial
response (PR), stable disease (SD), minimal response (MR) and progressive
15
disease (PD). These responses are based mainly on the degree of reduction in
serum or urine M-protein, reduction in number of clonal plasma cells in the bone
marrow, disappearance of soft tissue plasmacytomas, and if clinically indicated,
reduction in free light chain assays.
Progressive disease is based on an increase of 25% from initially documented
value in any of the following: serum M-protein, urine M-protein, serum free light
chains (if serum or urine M-protein not detectable at baseline). In addition an
increase in the percentage plasma cells in the bone marrow must be ≥10%. The
development of new lytic lesions or new hypercalcaemia that can solely be
attributed to the myeloma also correlate with progressive disease.
“Relapsed myeloma” is defined based on criteria indicating increased disease
burden, or new/ worsening CRAB criteria. “Clinical relapse” is used in the clinical
setting to document the recurrence of disease following completion of therapy,
however it is not used to calculate time to progression or progression free
survival. Specifically, the development of new bone lesions or new soft tissue
plasmacytomas, increasing size of known plasmacytomas by 50% (that are at
least 1cm larger than before), elevated serum calcium levels >2.65mmol/L, a
reduction in haemoglobin ≥2g/dL, or an increase in serum creatinine
>177umol/L all correlate with relapsed myeloma.
“Refractory myeloma” is defined as a lack of any measurable response in a patient
to current treatment, or progression of disease within 60 days of their last
treatment. There are two main groups of refractory myeloma, primary refractory
myeloma whereby patients do not respond to induction chemotherapy; and
secondary refractory myeloma, whereby patients respond to induction therapy
but do not respond to salvage therapy after relapse following induction therapy.
Finally, “relapsed and refractory myeloma” is defined clinically as someone who
obtained at least a minimal response to therapy, then develops progressive
disease, undergoes salvage chemotherapy, and either does not respond to
salvage treatment at all or experiences progressive disease within sixty days of
their last treatment.[36]
16
1.2.2 Poor prognosis associated with relapsed and refractory MM
Despite an era of novel therapies including the proteasome inhibitor bortezomib
and the immunomodulators (IMiD) thalidomide and lenalidomide, patients
inevitably develop a state of relapsed and refractory disease. The prognosis at
this disease stage was vividly outlined by Kumar et al. in a large multicentre
study in 2012. In total, 286 patients were studied. The inclusion criteria included
patients who were refractory to bortezomib, and/or were resistant to an
immunomodulator (thalidomide or lenalidomide) or intolerant of /ineligible for
treatment with an IMiD. Time zero (or T0) was defined as the time in which the
patients fulfilled the aforementioned criteria. The average age of the patients
included in the study was 58 years at time zero. The average EFS (event free
survival) from time zero for the entire group was 5 months (95% CI; 4, 6), and
the average overall survival was 9 months (95% CI; 7, 11). The total overall
survival for the group from time of diagnosis was 4.7 years (or 56 months; 95%
CI; 44, 72). For patients specifically refractory to bortezomib, their median
overall survival was found to be just 9 months ((95% CI; 7,11), and for those
refractory to or intolerant of an IMiD overall survival was also 9 months (95%
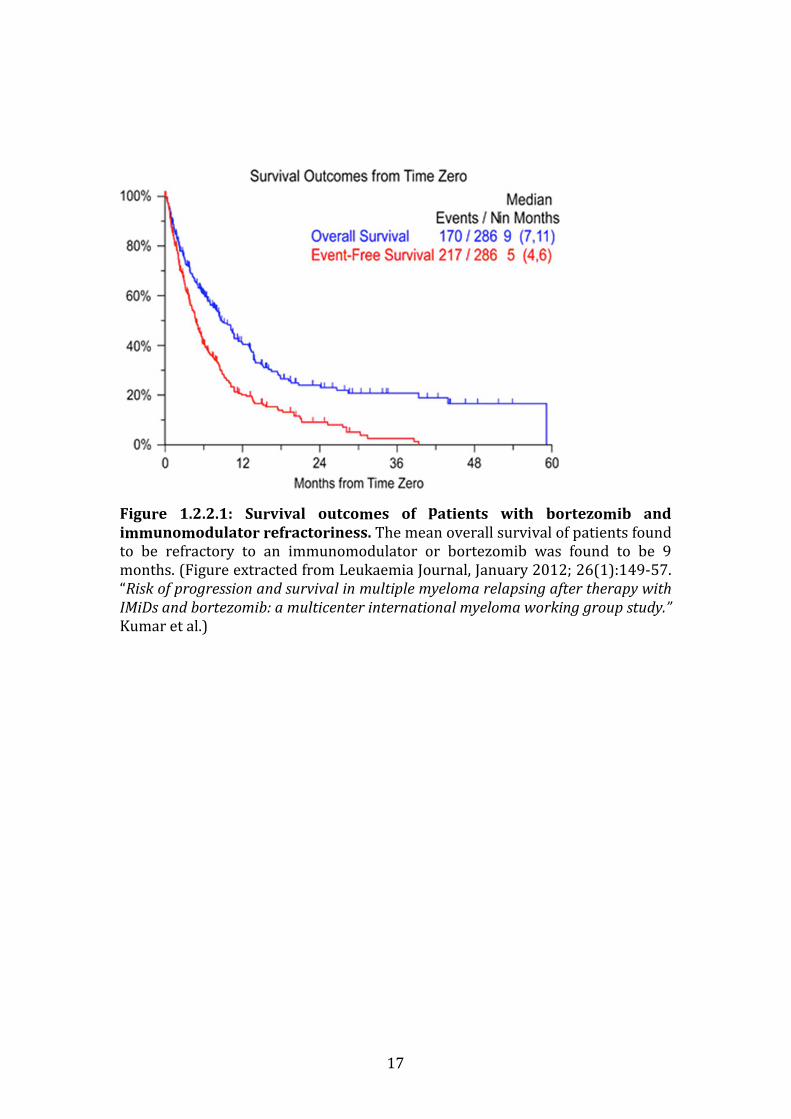
CI; 7,13). Figure 1.2.2.1 represents the survival outcomes for both bortezomib
refractory and IMiD refractory/intolerant patients.
17
Figure 1.2.2.1: Survival outcomes of patients with bortezomib and
immunomodulator refractoriness. The mean overall survival of patients found
to be refractory to an immunomodulator or bortezomib was found to be 9
months. (Figure extracted from Leukaemia Journal, January 2012; 26(1):149-57.
“Risk of progression and survival in multiple myeloma relapsing after therapy with
IMiDs and bortezomib: a multicenter international myeloma working group study.”
Kumar et al.)
18
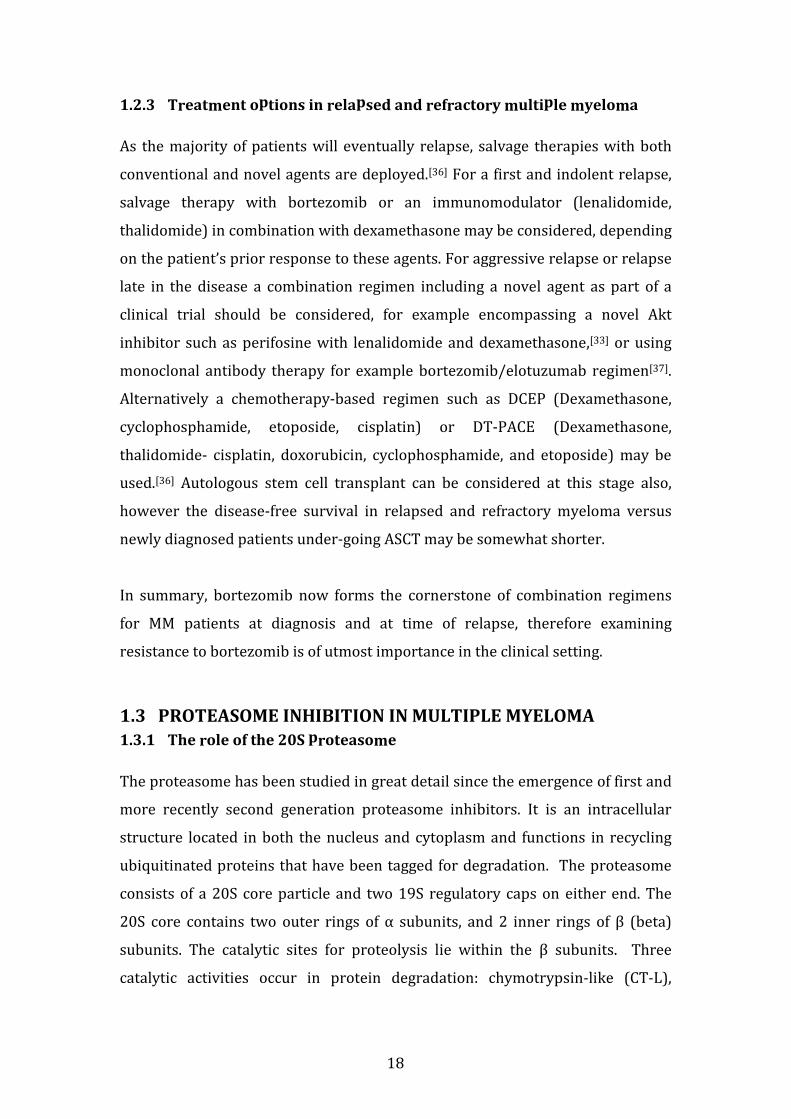
1.2.3 Treatment options in relapsed and refractory multiple myeloma
As the majority of patients will eventually relapse, salvage therapies with both
conventional and novel agents are deployed.[36] For a first and indolent relapse,
salvage therapy with bortezomib or an immunomodulator (lenalidomide,
thalidomide) in combination with dexamethasone may be considered, depending
on the patient’s prior response to these agents. For aggressive relapse or relapse
late in the disease a combination regimen including a novel agent as part of a
clinical trial should be considered, for example encompassing a novel Akt
inhibitor such as perifosine with lenalidomide and dexamethasone,[33] or using
monoclonal antibody therapy for example bortezomib/elotuzumab regimen[37].
Alternatively a chemotherapy-based regimen such as DCEP (Dexamethasone,
cyclophosphamide, etoposide, cisplatin) or DT-PACE (Dexamethasone,
thalidomide- cisplatin, doxorubicin, cyclophosphamide, and etoposide) may be
used.[36] Autologous stem cell transplant can be considered at this stage also,
however the disease-free survival in relapsed and refractory myeloma versus
newly diagnosed patients under-going ASCT may be somewhat shorter.
In summary, bortezomib now forms the cornerstone of combination regimens
for MM patients at diagnosis and at time of relapse, therefore examining
resistance to bortezomib is of utmost importance in the clinical setting.
1.3 PROTEASOME INHIBITION IN MULTIPLE MYELOMA
1.3.1 The role of the 20S proteasome
The proteasome has been studied in great detail since the emergence of first and
more recently second generation proteasome inhibitors. It is an intracellular
structure located in both the nucleus and cytoplasm and functions in recycling
ubiquitinated proteins that have been tagged for degradation. The proteasome
consists of a 20S core particle and two 19S regulatory caps on either end. The
20S core contains two outer rings of α subunits, and 2 inner rings of β (beta)
subunits. The catalytic sites for proteolysis lie within the β subunits. Three
catalytic activities occur in protein degradation: chymotrypsin-like (CT-L),
19
caspase-like (C-L) and trypsin-like (T-L) activities, and these predominate in the
β5, β1 and β2 subunits respectively.[38]
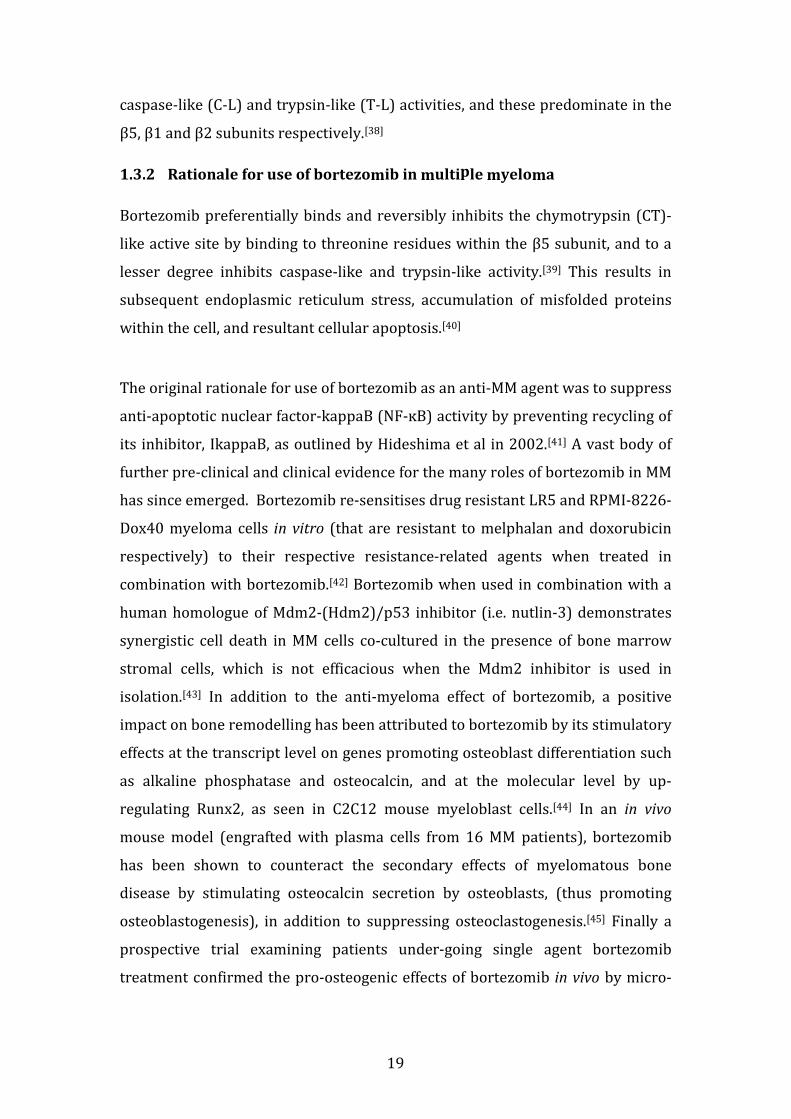
1.3.2 Rationale for use of bortezomib in multiple myeloma
Bortezomib preferentially binds and reversibly inhibits the chymotrypsin (CT)-
like active site by binding to threonine residues within the β5 subunit, and to a
lesser degree inhibits caspase-like and trypsin-like activity.[39] This results in
subsequent endoplasmic reticulum stress, accumulation of misfolded proteins
within the cell, and resultant cellular apoptosis.[40]
The original rationale for use of bortezomib as an anti-MM agent was to suppress
anti-apoptotic nuclear factor-kappaB (NF-ĸB) activity by preventing recycling of
its inhibitor, IkappaB, as outlined by Hideshima et al in 2002.[41] A vast body of
further pre-clinical and clinical evidence for the many roles of bortezomib in MM
has since emerged. Bortezomib re-sensitises drug resistant LR5 and RPMI-8226-
Dox40 myeloma cells in vitro (that are resistant to melphalan and doxorubicin
respectively) to their respective resistance-related agents when treated in
combination with bortezomib.[42] Bortezomib when used in combination with a
human homologue of Mdm2-(Hdm2)/p53 inhibitor (i.e. nutlin-3) demonstrates
synergistic cell death in MM cells co-cultured in the presence of bone marrow
stromal cells, which is not efficacious when the Mdm2 inhibitor is used in
isolation.[43] In addition to the anti-myeloma effect of bortezomib, a positive
impact on bone remodelling has been attributed to bortezomib by its stimulatory
effects at the transcript level on genes promoting osteoblast differentiation such
as alkaline phosphatase and osteocalcin, and at the molecular level by up-
regulating Runx2, as seen in C2C12 mouse myeloblast cells.[44] In an in vivo
mouse model (engrafted with plasma cells from 16 MM patients), bortezomib
has been shown to counteract the secondary effects of myelomatous bone
disease by stimulating osteocalcin secretion by osteoblasts, (thus promoting
osteoblastogenesis), in addition to suppressing osteoclastogenesis.[45] Finally a
prospective trial examining patients under-going single agent bortezomib
treatment confirmed the pro-osteogenic effects of bortezomib in vivo by micro-
20
CT demonstrating increased osteoid deposition in bortezomib-responsive
patients.[46]
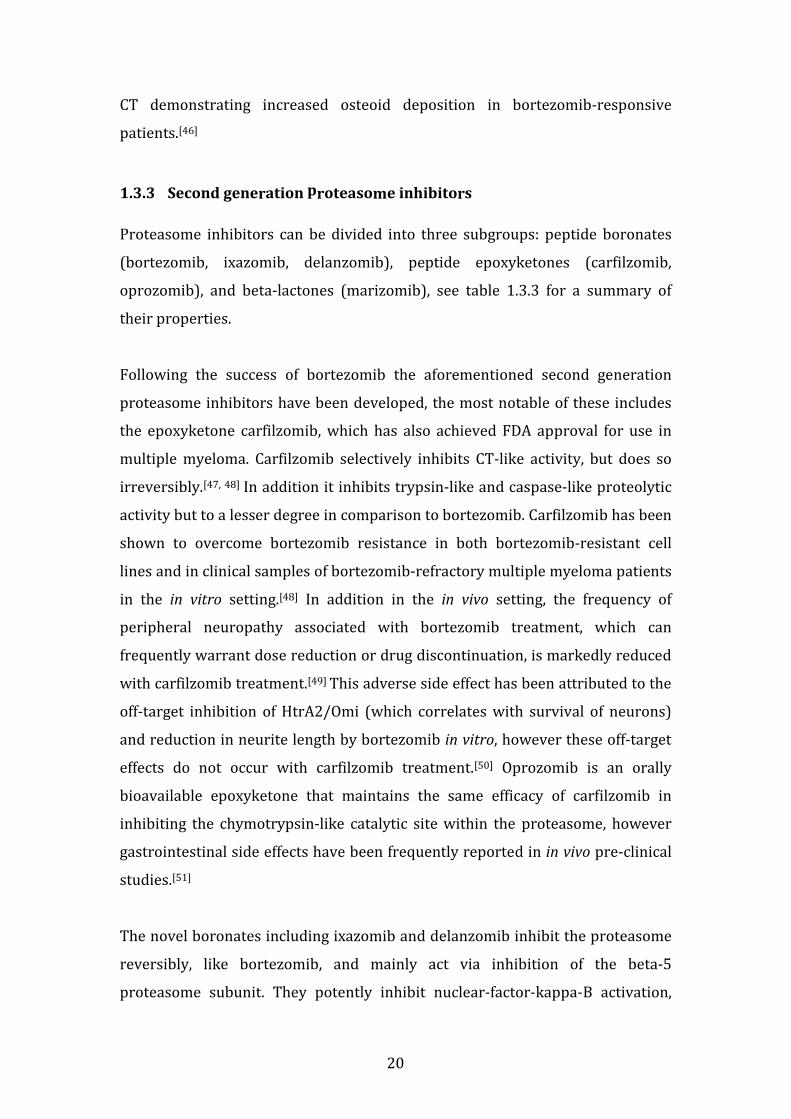
1.3.3 Second generation proteasome inhibitors
Proteasome inhibitors can be divided into three subgroups: peptide boronates
(bortezomib, ixazomib, delanzomib), peptide epoxyketones (carfilzomib,
oprozomib), and beta-lactones (marizomib), see table 1.3.3 for a summary of
their properties.
Following the success of bortezomib the aforementioned second generation
proteasome inhibitors have been developed, the most notable of these includes
the epoxyketone carfilzomib, which has also achieved FDA approval for use in
multiple myeloma. Carfilzomib selectively inhibits CT-like activity, but does so
irreversibly.[47, 48] In addition it inhibits trypsin-like and caspase-like proteolytic
activity but to a lesser degree in comparison to bortezomib. Carfilzomib has been
shown to overcome bortezomib resistance in both bortezomib-resistant cell
lines and in clinical samples of bortezomib-refractory multiple myeloma patients
in the in vitro setting.[48] In addition in the in vivo setting, the frequency of
peripheral neuropathy associated with bortezomib treatment, which can
frequently warrant dose reduction or drug discontinuation, is markedly reduced
with carfilzomib treatment.[49] This adverse side effect has been attributed to the
off-target inhibition of HtrA2/Omi (which correlates with survival of neurons)
and reduction in neurite length by bortezomib in vitro, however these off-target
effects do not occur with carfilzomib treatment.[50] Oprozomib is an orally
bioavailable epoxyketone that maintains the same efficacy of carfilzomib in
inhibiting the chymotrypsin-like catalytic site within the proteasome, however
gastrointestinal side effects have been frequently reported in in vivo pre-clinical
studies.[51]
The novel boronates including ixazomib and delanzomib inhibit the proteasome
reversibly, like bortezomib, and mainly act via inhibition of the beta-5
proteasome subunit. They potently inhibit nuclear-factor-kappa-B activation,
21
exert an anti-myeloma effect, an anti-angiogenic effect, and suppress osteoclasts.
Both are under investigation for their efficacy in parenteral administration,
however can also be used intravenously, like bortezomib. Ixazomib (or
MLN9708) converts to its active form MLN2238 when exposed to water.[51] This
compound has successfully completed Phase 1 clinical trials in relapsed and
refractory multiple myeloma as previously outlined.[26]
Marizomib, an alternative novel proteasome inhibitor, is a naturally occurring
substance extracted from Salinospora tropica marine bacteria. Marizomib has
been shown to inhibit irreversibly all three proteolytic sites: chymotrypsin-like,
trypsin-like and caspase-like activities in the proteasome. It has potential also for
use as an oral therapy in cancer.[51] In a phase 1 clinical trial involving 22
patients with non-small-cell lung cancer, melanoma or pancreatic cancer,
marizomib in combination with the histone deacetylase inhibitor vorinostat was
well tolerated by patients and resulted in disease stability in 61% and reduction
in tumour burden in 39% of patients evaluated.[52] These results encourage
assessment of marizomib for other malignancies including multiple myeloma, in
which proteasome inhibitors are now well established as a successful therapy.
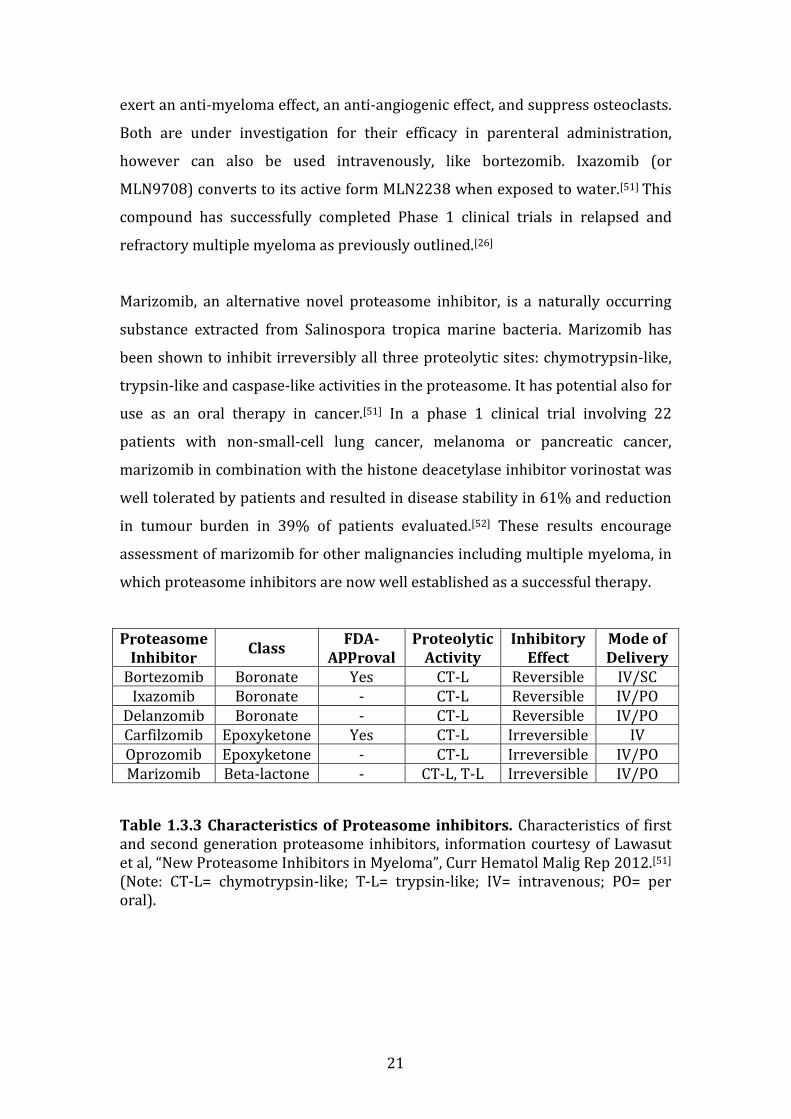
Proteasome
Inhibitor Class
FDA-
Approval
Proteolytic
Activity
Inhibitory
Effect
Mode of
Delivery
Bortezomib Boronate Yes CT-L Reversible IV/SC Ixazomib Boronate - CT-L Reversible IV/PO
Delanzomib Boronate - CT-L Reversible IV/PO Carfilzomib Epoxyketone Yes CT-L Irreversible IV Oprozomib Epoxyketone - CT-L Irreversible IV/PO Marizomib Beta-lactone - CT-L, T-L Irreversible IV/PO
Table 1.3.3 Characteristics of proteasome inhibitors. Characteristics of first and second generation proteasome inhibitors, information courtesy of Lawasut et al, “New Proteasome Inhibitors in Myeloma”, Curr Hematol Malig Rep 2012.[51] (Note: CT-L= chymotrypsin-like; T-L= trypsin-like; IV= intravenous; PO= per oral).
22
1.3.4 The Immunoproteasome
In the majority of cells in the body, stress caused by oxidative forces and
inflammatory cytokines results in an increase in production of what is known as
the immunoproteasome. For this reason, cells of the immune system express
greater levels of immunoproteasome rather than constitutive proteasome.
Immunoproteasomes have historically been documented for their pertinent role
in the process of major-histocompatibility class-1 antigen presentation within
cells in response to infections.[53]
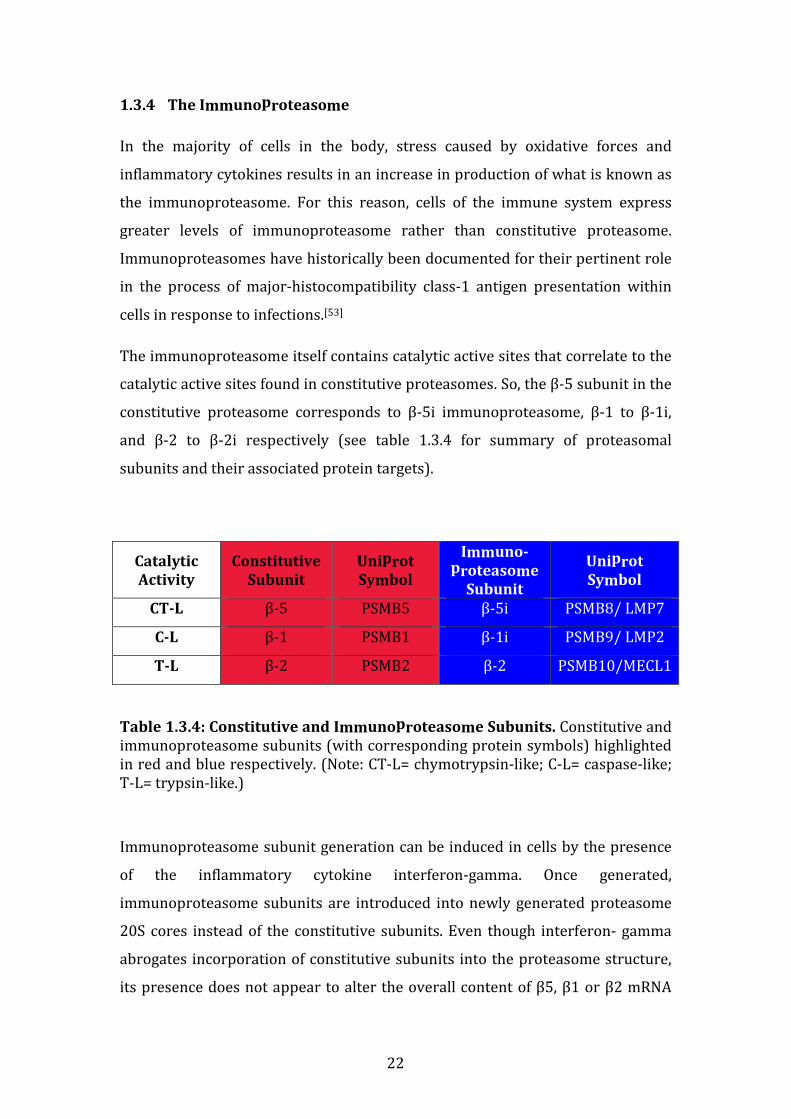
The immunoproteasome itself contains catalytic active sites that correlate to the
catalytic active sites found in constitutive proteasomes. So, the β-5 subunit in the
constitutive proteasome corresponds to β-5i immunoproteasome, β-1 to β-1i,
and β-2 to β-2i respectively (see table 1.3.4 for summary of proteasomal
subunits and their associated protein targets).
Catalytic
Activity
Constitutive
Subunit
Uniprot
Symbol
Immuno-
proteasome
Subunit
Uniprot
Symbol
CT-L β-5 PSMB5 β-5i PSMB8/ LMP7
C-L β-1 PSMB1 β-1i PSMB9/ LMP2
T-L β-2 PSMB2 β-2 PSMB10/MECL1
Table 1.3.4: Constitutive and Immunoproteasome Subunits. Constitutive and immunoproteasome subunits (with corresponding protein symbols) highlighted in red and blue respectively. (Note: CT-L= chymotrypsin-like; C-L= caspase-like; T-L= trypsin-like.)
Immunoproteasome subunit generation can be induced in cells by the presence
of the inflammatory cytokine interferon-gamma. Once generated,
immunoproteasome subunits are introduced into newly generated proteasome
20S cores instead of the constitutive subunits. Even though interferon- gamma
abrogates incorporation of constitutive subunits into the proteasome structure,
its presence does not appear to alter the overall content of β5, β1 or β2 mRNA

23
within cells. In fact following interferon-gamma stimulation of cells, cells are
found to contain proteasomes with a mixture of β5, β1 and β2 subunits, or β5i,
β1i and β2i subunits.[54]
In 2005, Altun et al demonstrated that myeloma cell lines contain both
constitutive and immunoproteasome subunits. At baseline, MM cell lines contain
more constitutive than immunoproteasome subunits, however the latter is up-
regulated by interferon-gamma. By 2-dimensional gel electrophoresis the active
catalytic subunits for β5, β1 and β2, or β5i, β1i and β2i were examined following
their treatment with bortezomib, with and without interferon-gamma pre-
treatment. They found that pre-treatment with interferon gamma up-regulated
the β5i subunit and that bortezomib had the ability to inhibit its catalytic activity,
in addition to its better known mode of action, i.e. inhibition of the constitutive
β5 active site.[55]
Secondly, in 2008, another group suggested a role for use of interferon-gamma to
ameliorate the effects of bortezomib in preclinical models of B cell neoplasms
including Burkitt’s lymphoma, mantle cell lymphoma and myeloma. They found
that pre-treatment with interferon-gamma of the B cell lymphoma cell line
KARPAS422, and in 5 out of 6 bortezomib-sensitive B cell neoplastic cell lines
tested (including RPMI8226 myeloma cell line) induced a marked increase in the
sensitivity of these cell lines to bortezomib. The plasmacytoma cell line U266
demonstrated the greatest increase in sensitivity to bortezomib when pre-
treated with interferon-gamma. These findings may be mediated at least in part
by increased immunoproteasome assembly as demonstrated by RT-PCR subunit
expression levels following interferon-gamma pre-treatment.[56] Interferon-
gamma however is also known to alter transcription of a large number of genes
including caspase-8 that promotes apoptosis,[57] and Mitsiades et al have also
demonstrated caspase-8 up-regulation by bortezomib.[40] Therefore we cannot
assume that the synergistic effects of interferon-gamma with bortezomib are
solely mediated by immunoproteasome subunit up-regulation. However these
data support a role for interferon-gamma pre-treatment with bortezomib to

24
augment its potency, and in particular support a role for interferon-gamma pre-
treatment in the setting of bortezomib-refractory myeloma.
1.3.5 Novel immunoproteasome inhibitors
Following an era of first and second generation proteasome inhibitors, the
immunoproteasome inhibitors are now coming to the forefront of research for
their use in haematological malignancies. PR-924, a tri-peptide epoxyketone
proteasome inhibitor has been shown to selectively inhibit PSMB8 (also known
as LMP7). Singh et al have shown in particular how PR-924 suppress
proliferation of and induce myeloma cell line apoptosis with subsequent
upregulation of caspase-3, caspase-8 and caspase-9. The same group also
demonstrated the efficacy of PR-924 in a human plasmacytoma mouse model in
vivo with reduction in tumour burden and increase in overall survival of PR-924
treated-mice over vehicle mice.[58] These findings pave the way for use of
immunoproteasome inhibitors in multiple myeloma in the future.
1.3.6 In Vitro Models of Bortezomib Resistance
In order to investigate bortezomib resistance (BR) in vitro, a number of
investigators have generated bortezomib resistant models of haematological and
solid tumour cell lines. On 2008 Oerlemans et al initially produced an acute
monocytic leukaemia BR-model (THP-1) exhibiting a 45-129 fold reduction in
sensitivity to bortezomib.[59] In the same year, Lu et al described a bortezomib
resistant T cell acute lymphoblastic leukaemia cell line (Jurkat), which
demonstrated an increase in IC50 from parental to bortezomib-resistant-model of
10nM to 268nM respectively after 24-hour treatment.[60] Both aforementioned
models identified a common mutation (G322A substitution) in the PSMB5
subunit as a causative factor for bortezomib resistance. Ri et al next described
the first model of BR in multiple myeloma in 2010, again demonstrating marked
resistance to the proteasome inhibitor, and confirming the previously published
PSMB5 mutation delineated by Oerlemans, in both KMS-11 and OPM-2 BR
models.[61] Perez-Galan et al in 2011 developed mantle cell lymphoma cell lines
(JEKO, HBL-2) that acquired a 40-80 fold reduction in bortezomib sensitivity
25
secondary to undergoing plasmacytic differentiation, but the previously
documented PSMB5 mutations were not detected in these models.[62] Suzuki et
al, again in 2011, chose a colon cancer model (HT-29) to study bortezomib
resistance and demonstrated further unique PSMB5 mutations.[63] Finally, Kuhn
et al in 2012 demonstrated an additional model of BR in MM, which although it
did not demonstrate PSMB5 mutations, underlined the efficacy of targeting the
insulin-like growth factor receptor to overcome bortezomib resistance.
1.3.7 Functional significance of PSMB5 mutations in vitro
There remains limited clinical evidence for the role of PSMB5 mutations in
bortezomib resistance in vivo to date. This can be perhaps explained by the
limited number of samples obtainable from bortezomib refractory patients, as it
is often not appropriate to repeat bone marrow biopsies late in the disease
course, in particular at a stage when patients require only palliative and
supportive care. An alternative explanation is perhaps the mechanisms of
bortezomib resistance may differ between the in vitro and in vivo setting. Much
functional evidence suggests that these mutations play a role in bortezomib
resistance thus far in vitro. For example, Oerlemans, using a bortezomib-
resistant AML cell line encoding the mutant G322A substitution in the PSMB5
gene, demonstrated that siRNA knockdown of the PSMB5 gene in the resistant
clone re-sensitised the cells to bortezomib.[59] Furthermore, Lu et al, who also
described the same G322A substitution in the PSMB5 gene in a T cell ALL model
of BR, demonstrated how retroviral insertion of the mutant-PSMB5 into parental
Jurkat cells rendered them resistant to bortezomib and also interfered with
chymotrypsin-like inhibition.[60] In MM, similar findings were confirmed when
this same PSMB5 mutation, found in a KMS-11 BR clone, was inserted into
parental KMS-11 cells, which resulted in a marked reduction in bortezomib-
associated apoptosis in the parental cells.[61] Suzuki described a novel PSMB5
mutation of particular interest, a Cys63Phe mutation, whereby Cys63 is a residue
with known critical drug binding affinity for bortezomib, and it’s substitution
with phenylalanine resulted in a change in the angle of the bortezomib active site
binding-helix, with resultant change in the orientation and conformation of
bound bortezomib within the active site, and thus may explain reduced
26
inhibition of chymotrypsin-like activity in the resistant clone.[63] Finally, Franke
et al furthermore demonstrated, by 3D in silico modelling, a number of PSMB5
mutations that alter the structural conformation of the bortezomib-binding
pocket within the β5 subunit, and impair bortezomib binding in vitro.[64] In
conclusion a vast body of evidence has outlined the potential role PSMB5
mutations play in bortezomib resistance in the in vitro setting.[65] However it
remains to be fully elucidated whether or not these findings translate clinically in
the in vivo setting.
1.4 GENETICS OF MULTIPLE MYELOMA
1.4.1 Cytogenetics
As part of their initial work-up, cytogenetic analysis of the CD138-positive
monoclonal plasma cells of patients with multiple myeloma are examined as
these anomalies can help assist in predicting outcome and this is examined by
conventional cytogenetics or fluorescent in situ hybridisation. The malignant
myeloma cells generally fall in into one of two groups: hypodiploid or
hyperdiploid. Hypodiploidy is associated with translocations t(4;14) or t(14;16)
and hyperdiploidy associated with t(11;14), the former of which is associated
with a poorer overall prognosis. Later on in the disease secondary aberrations
develop and these generally involve deletions such as del17p, del13q, del1p, or
amplification of 1q. Del17p is associated with a very poor prognosis.[66]
1.4.2 Whole genome mapping in MM
A highly comprehensive sequencing analysis involving whole exome sequencing
or whole genome sequencing of 38 MM patients in 2011, although did not focus
on resistance to therapy, underlined the invaluable application of whole genome
sequencing for determining pathogenesis mechanisms in MM. The previously
established role of the NF-ĸB pathway was further expanded by this study, by
demonstrating 11 distinct mutations implicated in its activation. Furthermore,
additional sequencing studies demonstrated mutations of BRAF kinase in 4% of
subjects, which have not been previously recognized in MM patients.[67] This
27
novel finding has high potential for rapid clinical translation as these patients
may benefit from BRAF kinase targeting via BRAF inhibitors, which are now used
in metastatic malignant melanoma.[68]
1.4.3 Role of PSMB5 mutations in MM in the clinical setting
Despite vast evidence for the role of PSMB5 mutations in bortezomib resistance
in vitro, no evidence of these mutations have yet been implicated in bortezomib
resistance in vivo. A recent study was undertaken whereby whole exome
sequencing of 76 MM patients was completed to include the following groups: 10
patients with reduced sensitivity to single agent bortezomib (where bortezomib
insensitivity was defined as minimal response/ stable disease/ progressive
disease) and 6 MM patients who relapsed on single agent bortezomib after
having achieved a partial response. Alterations in the PSMB5 gene were not
found to be associated with bortezomib refractoriness in these 16 patients. Also,
the PSMB5 mutation previously described by Lu, Oerlemans and Ri was not
identified in the in vivo analysis. However the sample size was somewhat limited
(n=16). Therefore the question still remains unclear as to whether or not PSMB5
mutations are implicated in bortezomib resistance in multiple myeloma in vivo.
Larger studies are needed to clarify this question.[69]
1.5 EXTRINSIC RESISTANCE MECHANISMS: ROLE OF THE BONE
MARROW MICROENVIRONMENT
1.5.1 The role of the bone marrow accessory cells in MM pathogenesis
The role of the bone marrow microenvironment in MM pathogenesis has been
studied in great detail and the protective effect it confers to clonal plasma cells in
multiple myeloma patients has been well documented. The “seed and soil”
hypothesis was first introduced in the late 1800s by a British surgeon, Dr.
Stephen Paget, who proposed a neoplastic growth (the seed i.e. the myeloma
cell) will proliferate in an environment (the soil i.e. the bone marrow
microenvironment) that supports its survival.[70] Since then vast evidence has
emerged demonstrating the role of the myeloma cells local environment in
augmenting its survival, in particular in relation to the protective effects
conferred to myeloma cells by bone marrow stromal cells and osteoclasts
28
(OCs).[71-73] In normal bones, osteoclasts function in bone remodelling or
breakdown, so that osteoblasts can replace damaged bone with new healthy
bone. In multiple myeloma, osteoclasts are activated and are responsible for the
lytic lesions seen at clinical presentation and throughout the disease course. In
contrast, MM cells suppress osteoblast (OB) activity that would normally allow
bone remodelling following its reabsorption by activated OCs, compounding the
burden of lytic bone lesions in patients with multiple myeloma.
In relation to bone marrow stromal cells, direct interaction of these and clonal
plasma cells via adhesion molecules on the cell surface of each has been shown
to induce nuclear-factor-kappa-B activation and up-regulation of interleukin-6,
both of which contribute to the survival of the malignant plasma cell clone.[74]
In relation to osteoclasts, a vicious cycle of interactions between these accessory
cells and myeloma cells allows co-operative survival of both entities. Firstly,
myeloma cells attach to osteoclasts directly by numerous adhesion molecules
such as vascular cell adhesion molecule-1 (VCAM-1), with resultant stimulation
of osteoclastogenesis.[75] It has also been shown that reduction of
osteoprotegerin (which normally allows bone remodelling via osteoblasts)
occurs when myeloma cells are co-cultured with bone marrow stromal cells,
with resultant increase in myeloma cell survival and increased production of
osteoclasts.[76] A further study involving co-culture of osteoclasts with myeloma
cells in vitro has demonstrated osteoclast-induced increase in myeloma cell
viability, (compared to myeloma cells culture in isolation), in addition to
reduction in myeloma cell apoptosis.[77]
1.5.2 The role of osteoblasts in multiple myeloma
Osteoblasts are large mononuclear cells found abundantly in bone and function
to secrete and mineralise bone matrix. They arise primarily from pluripotent
mesenchymal stem cells (MSCs) and when these progenitors over-express
RUNX2 (Runt-related transcription factor 2) they become committed to the
osteoblastic lineage of differentiation. The most immature form of osteoblast
secretes low levels of osteopontin and very high levels of collagen type 1, and
these are termed “pre-osteoblasts”. As they mature, they secrete additional

29
factors involved in bone formation in particular osteocalcin, osteopontin and
alkaline phosphatase, (ALP) and can now produce osteogenic matrix, but at this
stage RUNX2 expression is reduced compared to pre-osteoblasts. As they mature
further their osteocalcin expression increases further allowing for bone
mineralization.[78]
The effects of MM cells on attenuation of osteoblastic activity can be explained
partly by inhibition of pre-osteoblastic differentiation into mature OBs. The main
pathway involved in inhibition of osteoblastogenesis is by direct cell-to-cell
contact between the mesenchymal stem cells (MSCs) and MM cells. Adhesion of
these two entities via VCAM-1 and very late antigen-4 (VLA-4) results in a
reduction in RUNX2 expression, a critical factor involved in osteoblast
maturation.[79] Secondly, MM cells secrete factors that inhibit differentiation of
osteoblasts, such as Dickkopf 1 (DKK-1), soluble frizzled related protein-2
(SFRP-2), tumour necrosis factor alpha (TNF-α) and Activin A. DKK-1 and SFRP-
2 act by inhibiting the Wnt pathway, a pathway that plays a significant role in
osteoblastic maturation.[80, 81] More recently p38 mitogen-activated protein
kinase (MAPK) has been identified as a major regulator of Wnt inhibition via
DKK-1 by up-regulating DKK-1 secretion in MM cells.[82] TNF-α inhibits
differentiation of MCSc into mature osteoblasts and also induces apoptosis of
mature osteoblasts and this appears to be RUNX2-dependent, mediated by a
RUNX2 transcriptional inhibitor, Gfi1.[83] Activin A (which is expressed at high
levels in patients with lytic bone disease) has also been shown to attenuate
osteoblastic differentiation, in addition to increasing osteoclastic activity, via the
Activin type-2A receptor, and thus concurrently worsens myelomatous bone
disease.[84] A pro-inflammatory chemokine, CCL3 (i.e. MIP-1α) that has known
stimulatory effects on osteoclasts has also recently been implicated in inhibition
of mature osteoblasts by suppressing osteocalcin secretion and thus abrogating
bone mineralisation.[85] Thus not only do myeloma cells deter differentiation of
immature osteoblasts into osteogenic cells, but also inhibit the essential function
of bone mineralisation in mature osteoblasts.
Research efforts to stimulate osteoblastogenesis and hence improve
myelomatous bone disease have been at the forefront of myeloma research in
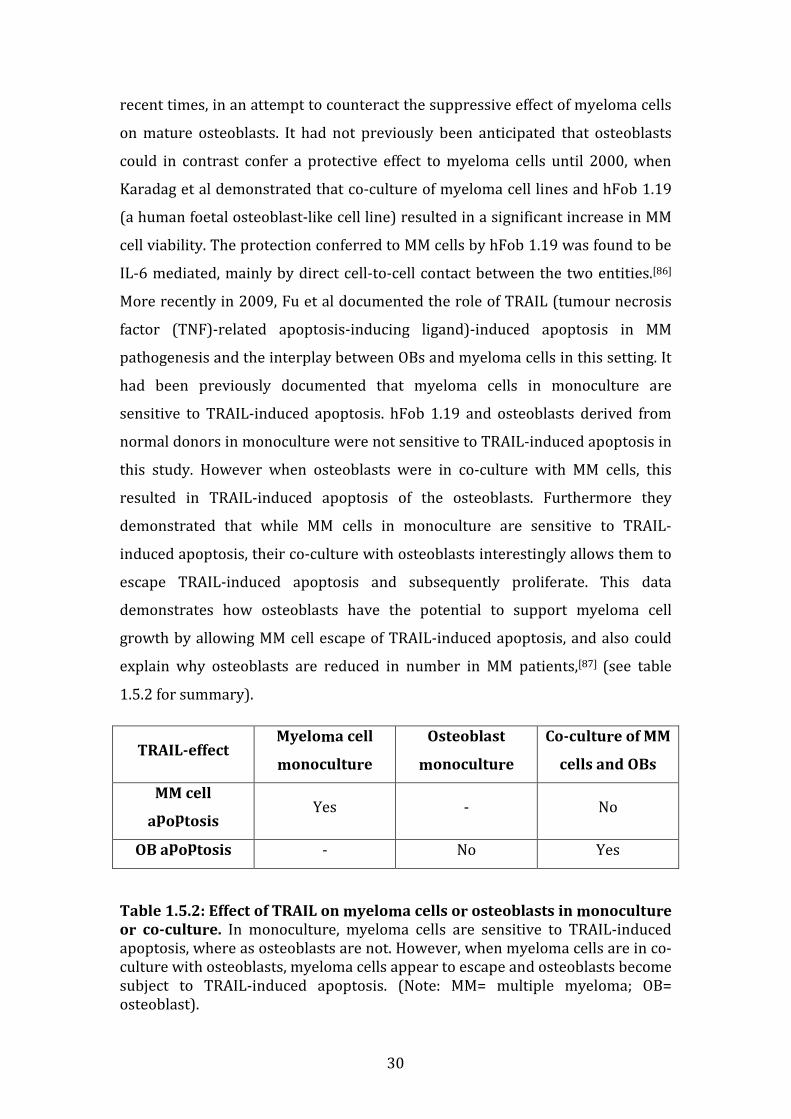
30
recent times, in an attempt to counteract the suppressive effect of myeloma cells
on mature osteoblasts. It had not previously been anticipated that osteoblasts
could in contrast confer a protective effect to myeloma cells until 2000, when
Karadag et al demonstrated that co-culture of myeloma cell lines and hFob 1.19
(a human foetal osteoblast-like cell line) resulted in a significant increase in MM
cell viability. The protection conferred to MM cells by hFob 1.19 was found to be
IL-6 mediated, mainly by direct cell-to-cell contact between the two entities.[86]
More recently in 2009, Fu et al documented the role of TRAIL (tumour necrosis
factor (TNF)-related apoptosis-inducing ligand)-induced apoptosis in MM
pathogenesis and the interplay between OBs and myeloma cells in this setting. It
had been previously documented that myeloma cells in monoculture are
sensitive to TRAIL-induced apoptosis. hFob 1.19 and osteoblasts derived from
normal donors in monoculture were not sensitive to TRAIL-induced apoptosis in
this study. However when osteoblasts were in co-culture with MM cells, this
resulted in TRAIL-induced apoptosis of the osteoblasts. Furthermore they
demonstrated that while MM cells in monoculture are sensitive to TRAIL-
induced apoptosis, their co-culture with osteoblasts interestingly allows them to
escape TRAIL-induced apoptosis and subsequently proliferate. This data
demonstrates how osteoblasts have the potential to support myeloma cell
growth by allowing MM cell escape of TRAIL-induced apoptosis, and also could
explain why osteoblasts are reduced in number in MM patients,[87] (see table
1.5.2 for summary).
TRAIL-effect Myeloma cell
monoculture
Osteoblast
monoculture
Co-culture of MM
cells and OBs
MM cell
apoptosis Yes - No
OB apoptosis - No Yes
Table 1.5.2: Effect of TRAIL on myeloma cells or osteoblasts in monoculture
or co-culture. In monoculture, myeloma cells are sensitive to TRAIL-induced apoptosis, where as osteoblasts are not. However, when myeloma cells are in co-culture with osteoblasts, myeloma cells appear to escape and osteoblasts become subject to TRAIL-induced apoptosis. (Note: MM= multiple myeloma; OB= osteoblast).
31
In summary, while the majority of previously published literature
demonstrates MM cell suppression of osteoblast differentiation and
function, some data exists to support the hypothesis that osteoblasts
themselves may confer survival advantage to malignant plasma cells.
1.5.3 Role of the microenvironment in drug resistance in multiple
myeloma
In general two forms of microenvironment-mediated drug resistance occur: (i)
cytokine-mediated resistance and (ii) adhesion-mediated resistance.
Cytokine-mediated drug resistance is mainly secondary to interleukin-6, which
alone also contributes to myeloma cell survival even before treatment is
commenced.[88] When myeloma cells and bone marrow stromal cells adhere to
one another, interleukin-6 production is up-regulated and has been shown to
contribute to bortezomib resistance, and subsequent blockade of IL-6 using a
monoclonal antibody for IL-6 (CNTO 328) results in resensitisation of the cells to
bortezomib.[89]
Insulin-like growth factor-1 (IGF-1) has also been found to contribute to drug
resistance in myeloma. In particular IGF-1 cytokine production (that is up-
regulated secondary to adhesion of bone marrow accessory cells and myeloma
cells) has been shown to contribute to bortezomib resistance in both a
bortezomib resistant cell line and myeloma cells taken from patients with
bortezomib-resistant disease. Inhibition of IGF-1 or IGF-1R, (insulin-like growth
factor-1 receptor) resulted in resensitisation of resistant cells to bortezomib.[65]
Nuclear-factor-kappa-B has been found to be over-expressed in the bone
marrow stromal cells of patients with multiple myeloma, in association with
over-expression of interleukin-8, and contributes to drug resistance in multiple
myeloma including resistance to bortezomib.[90]
Finally adhesion-mediated resistance in multiple myeloma is mainly as a result
of myeloma cells adhering to bone marrow stromal cells by beta-1 integrins.
Noborio-Hatano et al in 2009 revealed VLA-4 as a pivotal adhesion molecule
contributing to drug resistance to vincristine, doxorubicin and dexamethasone,
32
and bortezomib treatment appeared to down-regulated CD49d (or alpha4-
integrin, a subunit of VLA-4) and overcome adhesion-mediated resistance.[91]
1.6 SUMMARY
In summary, multiple myeloma is an incurable malignancy of terminally
differentiated B-lymphocytes or plasma cells. Increased survival has been
observed with the introduction of bortezomib. Patients present with
hypercalcaemia, lytic bone lesions, renal failure or anaemia, and a monoclonal
protein detected in the serum or urine. Induction therapy with a bortezomib-
containing regimen is recommended as first-line treatment, and bortezomib can
also be used as part of consolidation or maintenance therapy. A number of other
classes of novel therapies have also become available in recent years including
panobinostat (HDAC inhibitor), carfilzomib (second generation proteasome
inhibitor), and pomalidomide (immunomodulator).
Relapsed and refractory myeloma is defined as a patient who has achieved at
least a minimal response to treatment, then develops progressive disease,
undergoes salvage chemotherapy, and either does not respond or relapses
within 60 days of salvage therapy. Patients with multiple myeloma refractory to
bortezomib or an IMiD have a 5-month event free survival and a 9-month overall
survival. Relapsed and refractory myeloma chemotherapy regimens also
incorporate bortezomib with a number of additional therapies such as another
novel approved therapy or one as part of a clinical trial. The reasoning behind
this is because bortezomib attacks malignant plasma cells by a number of means:
inhibiting NF-ĸB which is pertinent to the survival of the cancerous clone,
overcoming resistance to conventional therapies and improving myelomatous
bone disease.
Second generation proteasome inhibitors are now being investigated for their
use in myeloma, and following the success of bortezomib, carfilzomib has also
been recently approved for use in myeloma. A number of oral therapies are also
being investigated such as oprozomib and ixazomib. The immunoproteasome is
also known to be subject to proteasomal inhibition by bortezomib and its
subunits can be up-regulated by interferon-gamma. Immunoproteasome
33
inhibitors such as PR-924 are also being investigated in preclinical studies for
their use in myeloma.
Resistance to bortezomib in the in vitro setting has been so far mainly attributed
to mutations of the PSMB5 gene, through which bortezomib principally inhibits
the proteasome. However mutations in PSMB5 have not yet been found to be
clinically significant in the in vivo setting. Cytogenetic abnormalities such as
hypodiploidy and translocations t(4;14) and t(14;16), in addition to del17p,
del13q and del1p are associated with a poor prognosis in the in vivo setting.
Genetic mutations of NF-ĸB and BRAF-kinase have been shown to contribute to
multiple myeloma pathogenesis in the in vivo setting also. To further complicate
things, myeloma is now known to express not just one but multiple clones with
varying genotypes at diagnosis, each which can further mutate as the disease
progresses.
Extrinsic mechanisms of multiple myeloma pathogenesis induced by the bone
marrow microenvironment include again NF-ĸB, but also increased secretion of
IL-6. Cell-to-cell adhesion of MM cells and BMSCs occurs by the adhesion
molecule VCAM-1. Osteoclasts also contribute to MM pathogenesis by increasing
the proliferation rate of MM cells, contributing to drug resistance, and conversely
MM cells promote osteoclastogenesis. Historically, osteoblasts were not assumed
to contribute to MM pathogenesis as it has been shown that mature osteoblasts
are suppressed by clonal plasma cells, mediated by interactions between
malignant plasma cells and bone marrow stromal cells that results in
suppression of RUNX-2, which is a major determinant of osteoblast maturation.
However the osteoblast-like cell line hFob 1.19 has been shown to promote
myeloma cell survival and this is thought to be mediated by TRAIL-induced
apoptosis, whereby reciprocal TRAIL-induced apoptosis of mature osteoblasts
occurs instead of apoptosis of myeloma cells when the two entities are in co-
culture. Drug resistance in the in vitro setting again has also been attributed to
the over-expression of IL-6; in the case of bortezomib resistance specifically, IGF-
1 has been implicated.
34
The aetiology of proteasome inhibitor resistance is clearly multifactorial and is
secondary to both intrinsic and extrinsic mechanisms. Given the complexity of
multi-clonal plasma cells and their interaction with the bone marrow milieu we
chose to further examine the potential intrinsic mechanisms of specifically
bortezomib resistance by examining the genomic, proteomic and mutational
profile of a bortezomib resistant cell line (termed VDR) developed in the
laboratory of Dr Mitsiades. We next examined the effect of HS-5 bone marrow
stromal cells on the sensitivity of this bortezomib resistant cell line to
proteasome inhibitors and other novel therapies. We also examined the
osteoblast-induced changes in proliferation rate and drug sensitivity in a number
of myeloma cell lines, to ascertain whether not osteoblasts can contribute to
myeloma cell survival and drug resistance. Finally, we examined the proteasome
subunit expression of β-5 (PSMB5) and β-5i (PSMB8) in bone marrow trephine
samples of patients with bortezomib-refractory myeloma, to determine whether
or not a PSMB8 inhibitor might be useful in this setting.

35
1.7 AIMS OF THE THESIS
To:
• Examine the sensitivity of bortezomib-resistant VDR and parental MM.1R to conventional, novel and investigational therapies in vitro.
• To determine if bortezomib sensitivity is restored in VDR by the combination of bortezomib with a p-glycoprotein inhibitor, elacridar.
• Determine if our in vitro model retains its resistance to bortezomib in an in vivo mouse model.
• By whole exome sequencing define mutations present in VDR compared to MM.1R.
• Examine the gene expression profile of VDR compared to MM.1R to determine which genes or sets of genes in a given pathway are over-expressed or suppressed in bortezomib-resistant VDR.
• Examine the proteomic profile of VDR compared to MM.1R to determine which individual proteins or groups of proteins in a given pathway are over-expressed or suppressed in bortezomib-resistant VDR.
• Determine the effect of HS-5 stromal cells and hFob 1.19 osteoblast-like cells on proliferation rate and drug sensitivity in VDR and other multiple myeloma cell lines.
• Examine the expression of proteasome subunits PSMB5 and PSMB8 in bone marrow trephine samples of patients with newly diagnosed and relapsed and refractory multiple myeloma.

36
Chapter 2
Materials and
Methods
37
CHAPTER 2. MATERIALS AND METHODS
2.1 Ultrapure H20, glassware and sterilisation procedures
Ultrapure water was used when preparing media or any solutions or compounds
requiring dilution. The water was purified to a standard of 12-18 MΩ/cm
resistance by a reverse osmosis system (Millipore Milli-RO 10 Plus, Elgastat
UHP), and the quality of the water was monitored continuously by a conductivity
metre within the system.
Sterile glass bottles were used for storing cells or solutions during experiments.
These bottles were submerged in a 2% solution of RBS-25 (AGB Scientific) for 1
hour, subsequently rinsed off with tap water, then further washed in an
industrial dishwasher using Neodisher detergent and then twice rinsed with
ultrapure water. Finally glass bottles were autoclaved at 121°C for 20 minutes,
then allowed to dry completely.
2.2 Preparation of cell culture media
Roswell Park Memorial Institute medium (RPMI)-1640 purchased from Cellgro
Mediatech, Manassas, VA, USA was used for culture of all myeloma cell lines. A
1:1 mixture of Ham's F12 Dulbecco's Modified Eagle's Medium (DMEM), with 2.5
mM L-glutamine (without phenol red) was used for culture of hFob 1.19
osteoblast-like cell line, which was purchased from Sigma-Aldrich. Foetal calf
serum (FCS) 10% (purchased from GIBCO/BRL, Gaithersburg, MD, USA), in
addition to 100U/L of penicillin and 100ug/ml streptomycin (Cellgro) were
added to media containers as needed. Media prepared as outlined were stored at
4°C for up to a maximum of 2 weeks.
2.3 Cells / cell culture/ subculturing / freezing / thawing / co-
culture studies
The cell lines used in our studies were as follows: MM1S-mcl (here termed
MM.1S), MM1R-gfp-luc (here termed MM.1R), MM.1VDR-gfp-luc (here termed
VDR), RPMI8226-Dox40-mcl (termed Dox40), KMS11-mcl, OPM2-mcl, OCI-my-5-
mcl, KMS34-mcl, RPMI8226-mcl, luciferase-negative MM.1S, HS-5 and hFob1.19.
38
All multiple myeloma cell lines were stably transduced with lentiviral vectors
that expressed M-Cherry (denoted “mc”) or green-fluorescent protein (denoted
“gfp”), and a luciferase-containing vector (denoted “l” or “luc”), as previously
described.[92, 93] Thus cell lines above with suffix “mcl” contain an M-cherry and
luciferase vector; cell lines with suffix “gfp-luc” contain a green fluorescent
protein and luciferase vector. Stromal cells HS-5 and osteoblast-like hFob 1.19
were both negative for M-Cherry, GFP and luciferase.
All myeloma cell lines and HS-5 stromal cell line were cultured in RPMI 1640
media containing 10% foetal bovine serum, 100 U/mL penicillin and 100 μg/mL
streptomycin at 37°C under sterile conditions. hFob 1.19 was cultured in Ham’s
F12 DMEM containing 10% foetal bovine serum, 100 U/mL penicillin and 100
μg/mL streptomycin at 37°C under sterile conditions.
Cells were passaged twice weekly. For semi-adherent cell lines, cells were first
scraped using a cell-scraper. Seventy-five percent of old media was removed and
discarded, and replaced with an equal volume of fresh RPMI media, flasks were
then placed back in the incubator.
For hFob 1.19 and HS-5, cells were detached from the tissue culture flask as
follows: all media was removed by suctioning, then 10mL of Trypsin EDTA 1x
(Cellgro) was added, the flask replaced in the incubator for 10 minutes to allow
cells to detach, then 50% of old media was removed and fresh Ham’s F12 DMEM
(for hFob 1.19) or RPMI media (for HS-5) was added. Flasks were then placed
back in the incubator.
In order to preserve early passage numbers of cell lines, aliquots of cells were
stored in liquid nitrogen for future use as follows: Cell lines were removed from
tissue culture flasks as outlined above. Cells were next counted using a
haemocytometer. Aliquots of 2 million cells were transferred to clean eppendorf
tubes. Tubes were centrifuged and supernatant removed. Next, cells were
washed with 20mL Phosphate-Buffered Saline 1X (PBS; from Cellgro),
recentrifuged, and supernatant removed. This was repeated a second time. Then
the cell pellet was re-solubilised in a solution of foetal calf serum containing 10%
DMSO (Dimethyl sulfoxide, Sigma Aldrich) and transferred to a cryovial, which
39
was snap-frozen in liquid nitrogen. Then cells were transported to the liquid
nitrogen tank on dry ice and stored in liquid nitrogen tanks up for up to 2 years.
On thawing, media was heated to 37°C in the water bath prior to removal of the
cryovial tubes from the liquid nitrogen. Tissue culture flasks were labelled with
cell line name, passage number, cell line source, and date of thawing. Cryovials
containing frozen cells were removed carefully from the liquid nitrogen tank and
placed on dry ice. Cells were then quickly brought to the water bath and thawed
at 37°C. Once cells were completely thawed, they were added to 20mL of fresh
warm media (as described above) and washed twice with PBS (as described
above) before adding them to tissue culture flasks (in order to remove any
DMSO). Tissue culture flasks containing thawed cells were then transferred to
the incubator.
For in vitro tissue culture studies requiring subsequent drug treatment, aliquots
of cells were removed from tissue culture flasks as described above. Cells were
washed twice with fresh media, and then counted using a haemocytometer. Cells
were diluted as necessary for plating on a 96-well or 384-well flat, clear-bottom
tissue culture plate (Corning). For single cell line testing of sensitivity to
compounds, cell lines were plated at all times at least 6 hours prior to drug
treatment to allow the cells to re-adhere. In the case of co-culture with HS-5 or
hFob 1.19, stromal cell to myeloma cell ratio used was 2:1 and 1:1 respectively
(unless otherwise stated in results section). For all co-cultures, stromal cells
were first plated at stated seeding densities, and allowed to adhere for at least 6
hours. Then myeloma cells were added, and the conditions allowed to co-culture
for at least 24 hours prior to drug treatment (unless otherwise specified in
results section). Cells were cultured in a total volume of 100uL (50uL each for
myeloma cells and accessory cells if co-cultured) in 96-well plates, or 40uL total
volume when 384-well plates were used (20uL each for myeloma cells and
accessory cells when in co-culture).
2.4 STR analysis of cell lines
The identification of our stock of cell lines were frequently examined as per
departmental protocol by analysing their short tandem repeats (STR). QIAamp
40
DNA Mini Kit (Quiagen) was used to extract DNA from cell pellets as per protocol
provided, and 5ng/uL of DNA in 10uL of AE Buffer was transported to the Dana-
Farber Cancer Institute Molecular Diagnostics core facility where routine STR
testing as per departmental protocol was performed.
2.5 Reagents
Bortezomib was purchased from Millennium Pharmaceuticals; lenalidomide
from Fisher-Scientific; dexamethasone, doxorubicin and elacridar from Sigma
Aldrich; vorinostat from Merck; carfilzomib from Selleck; oprozomib from Onyx;
pomalidomide from VWR; vorinostat and MLN2238 from Selleck; JQ1 was made
available by the Bradner laboratory at DFCI; MLN4924 from Active-Biochem;
and interferon-gamma from R&D Systems. FDA-approved datasets for high-
throughput screening were obtained from the Developmental Therapeutics
Program of the National Cancer Institute (NCI). All compounds were
reconstituted as per protocol provided under sterile conditions and stored as
recommended on product datasheet. See table 2.5 below for complete list of
compounds tested in high-throughput screen.
In 96-well plates, compounds were added to plates containing cells in a total
volume of 50uL at stated concentrations (or 25uL each when 2 compounds were
added); or in 384-well plates compounds were added in a total volume of 10uL.
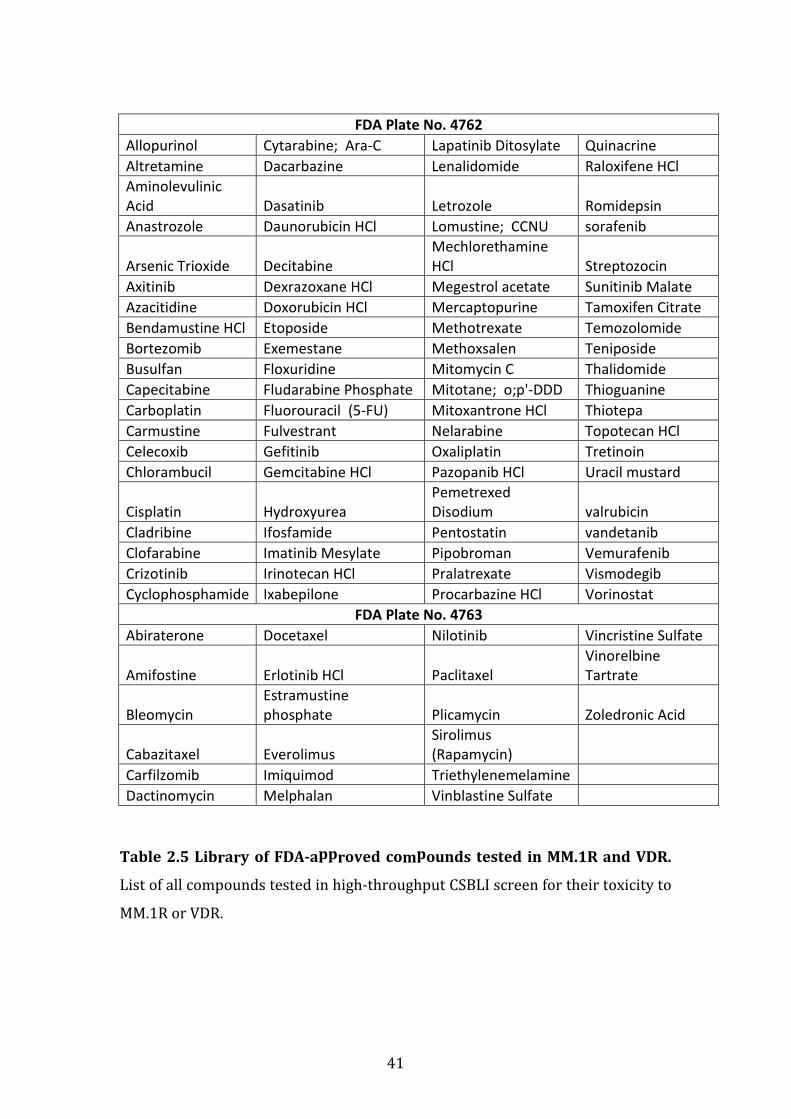
41
FDA Plate No. 4762
Allopurinol Cytarabine; Ara-C Lapatinib Ditosylate Quinacrine
Altretamine Dacarbazine Lenalidomide Raloxifene HCl
Aminolevulinic
Acid Dasatinib Letrozole Romidepsin
Anastrozole Daunorubicin HCl Lomustine; CCNU sorafenib
Arsenic Trioxide Decitabine
Mechlorethamine
HCl Streptozocin
Axitinib Dexrazoxane HCl Megestrol acetate Sunitinib Malate
Azacitidine Doxorubicin HCl Mercaptopurine Tamoxifen Citrate
Bendamustine HCl Etoposide Methotrexate Temozolomide
Bortezomib Exemestane Methoxsalen Teniposide
Busulfan Floxuridine Mitomycin C Thalidomide
Capecitabine Fludarabine Phosphate Mitotane; o;p'-DDD Thioguanine
Carboplatin Fluorouracil (5-FU) Mitoxantrone HCl Thiotepa
Carmustine Fulvestrant Nelarabine Topotecan HCl
Celecoxib Gefitinib Oxaliplatin Tretinoin
Chlorambucil Gemcitabine HCl Pazopanib HCl Uracil mustard
Cisplatin Hydroxyurea
Pemetrexed
Disodium valrubicin
Cladribine Ifosfamide Pentostatin vandetanib
Clofarabine Imatinib Mesylate Pipobroman Vemurafenib
Crizotinib Irinotecan HCl Pralatrexate Vismodegib
Cyclophosphamide Ixabepilone Procarbazine HCl Vorinostat
FDA Plate No. 4763
Abiraterone Docetaxel Nilotinib Vincristine Sulfate
Amifostine Erlotinib HCl Paclitaxel
Vinorelbine
Tartrate
Bleomycin
Estramustine
phosphate Plicamycin Zoledronic Acid
Cabazitaxel Everolimus
Sirolimus
(Rapamycin)
Carfilzomib Imiquimod Triethylenemelamine
Dactinomycin Melphalan Vinblastine Sulfate
Table 2.5 Library of FDA-approved compounds tested in MM.1R and VDR.
List of all compounds tested in high-throughput CSBLI screen for their toxicity to
MM.1R or VDR.
42
2.6 Generation of a bortezomib resistant cell line.
The bortezomib-resistant cell line was generated at the laboratory of Dr
Mitsiades at the Dana-Farber Cancer Institute by Mr Joseph Negri as follows:
MM.1R-gfp-luc cells were plated at a density of ~1 cell/well in 384-well-plates,
and treated with Bortezomib 2.5nM. Resistant clones that survived in the
presence of Bortezomib were collected and subsequently progressively exposed
to increasing concentrations of bortezomib (5-40nM). Serial dose-response
analyses confirmed the generation of several clones with variable reduction in
bortezomib-sensitivity (IC50 range 80-100nM vs. <10nM for parental MM.1R).
One of these clones termed VDR that displayed stable bortezomib resistance
(IC50 60nM) was used for this study.
2.7 In vitro toxicity assays measuring cell viability
In vitro cell viability assays used in these studies included CTG (Cell Titre Glo),
CSBLI (Compartment-specific bioluminescence imaging), or MTT (3-(4,5-
dimethylthiazol-2-yl)-2,5-diphenyltetrazolium bromide).
CTG (or Cell Titre Glo) purchased from Promega is a homogeneous method to
determine the number of viable cells in culture based on quantitation of the ATP
present, which signals the presence of metabolically active cells. At the end of
drug treatment, CTG is added to each well in a ratio of 1:10. This results in cell
lysis and the release of ATP that generates a luminescent signal proportional to
the amount of ATP released. Luminescent signal is recorded by a luminometer.
CSBLI was used to determine percentage cell viability of myeloma cell lines when
treated with reagents alone or following co-culture. CSBLI is particularly useful
in co-culture experiments because myeloma cells have been transduced with a
luciferase-containing vector, and our stromal or accessory cells do not contain
luciferase vectors. Following drug treatment luciferin (2.5 mg/mL stock,
Xenogen Corp) is added at a ratio of 1:10 to each well and incubated for 30
minutes at 37°C; then the bioluminescence signal is measured with a
Luminoskan (Labsystems) or Envision (Perkin Elmer) luminometer. The degree
of luminescence detected correlates to the relative number of viable cells in each
43
well, and this is reflective of luciferase-positive cells only; i.e. will detect relative
viability of myeloma cells only despite their co-culture with accessory cells.[92, 93]
MTT (3-(4,5-dimethylthiazol-2-yl)-2,5-diphenyltetrazolium bromide) assay is
used to determine cell viability as a function of redox potential. Cells that are
actively respiring convert water-soluble MTT to insoluble formazan, which is
purple in colour. After drug treatment MTT is added at a ratio of 1:10 and plates
are then incubated at 37°C for 4 hours. Then the plates are centrifuged for
10mins at maximum speed and supernatant removed. Then DMSO is quickly
added to solubilise the formazan and its absorbance determined by optical
density. The absorbance calculated directly correlates with relative cell viability.
2.8 In vivo mouse model treatment with bortezomib or
carfilzomib
This in vivo study including analysis of results was kindly completed by Ms.
Amanda Christie at the Lurie-Family Imaging Centre at Dana-Farbcer Cancer
Institute, under the supervision of Dr. Nancy Kohl. Seventy-five mice were
injected intravenously with either MM1R (n=38) or VDR cells (n=37). All mice
were imaged at least once weekly until disease burden was established by
Xenogen imaging, which detects the bioluminescent signal of the MM.1R or VDR
cells due to the presence of their luciferase-containing vectors. At this point mice
from each cell line were divided into four treatment groups (n=7 or 8 per group):
1.Velcade (bortezomib) 0.75mg/kg
2.Carfilzomib 1.5mg/kg
3. Carfilzomib 3mg/kg
4. Vehicle.
All treatments were administered intravenously (IV) twice weekly. The two
weekly doses of Velcade/bortezomib were administered 72 hours apart, while
doses for Carfilzomib and vehicle were administered 24 hours apart. Due to the
declining condition of the tail veins that compromised IV dosing (especially
noticeable in the carfilzomib-treated mice), starting with the 5th week of dosing
for both cell lines Velcade/bortezomib was switched to subcutaneous dosing and
44
carfilzomib was switched to treatment with oprozomib (the oral analogue of
carfilzomib). Oprozomib was dosed PO at 15mg/kg (for carfilzomib 1.5mg/kg
mice) or 30mg/kg (for carfilzomib 3mg/kg mice) on the same dosing schedule.
Mice were weighed and imaged weekly until all mice were sacrificed in the VDR
group. At this point the few remaining mice in the MM1R group were imaged
every 7-14 days until sacrifice. All mice were sacrificed when they became
paralyzed or suffered from hydrocephalus, at which time whole mice were fixed
in 10% formalin. Tukey’s multiple comparison test was used to analyse for
statistical significance between treatment groups for reduction in tumour
burden and overall survival.
2.9 Immunoblot
Whole cell pellets of MM.1S, MM.1R and VDR were collected at 4°C, centrifuged
and supernatant removed, and stored at -80°C. The following day, cell pellets
were lysed using a mixture of proteinase and phosphatase inhibitors. Protein
concentration was determined using the Bradford curve and 20ug of protein
loaded into 4-12% gels (Invitrogen). Once gel run was completed, proteins were
transferred to methanol-activated PVDF membrane. Protein transfer was
confirmed by Ponceau stain. Membranes were blocked in 5% milk and probed
with primary antibody overnight. The following day, membranes were washed
with TBST (Tri-buffered saline with 0.1% Tween), probed with secondary
antibody for 1 hour and re-washed. Membranes were exposed to Pico
Chemiluminescent Substrate (Thermo Scientific, 1:1 ratio) and films developed
in the dark room.
Immunoblot validation studies on proteins of interest were performed using the
following antibodies:
Primary Antibody Secondary Source Catalogue Number
GAPDH HRP-
conjugated (no
secondary)
Abcam 9482
Anti-PSMB5 Rabbit Abcam 3330

45
Primary Antibody Secondary Source Catalogue Number
Anti-PSMB8 Mouse Abcam 58094
Anti-NEDD8 Rabbit Epitomics 1571-1
Anti-Poly-Ub Mouse Cell Signal 3936
2.10 Whole exome sequencing
Whole cell pellets of MM.1R and VDR were collected at 4°C and 600ng DNA
extracted as previously described using QIAamp DNA Mini Kit (Quiagen). Whole
exome sequencing on the 2 cell lines was performed at the Centre for Cancer
Genome Discovery (CCGD) at DFCI as per departmental protocol. Prior to library
preparation DNA was fragmented using Covaris sonication to 150 bp and further
cleaned up to under 100 bp using Agencourt AMPure XP beads. 50ng of size
selected DNA was then ligated to specific adaptors during library preparation
(Illumina TruSeq). All the steps of library preparation were performed according
to departmental standards and had sufficient yield to continue with hybrid
capture. Each library was made with sample specific molecular barcodes and
quantified by qPCR. Capture was performed with the Agilent Sure-Select all exon
v2.0 hybrid capture kit using 500ng input DNA per capture. The minimum
criterion for CCGD is that 80% of all targets are covered at least 30x times. This
was reached for all samples. Point mutation analysis was performed using
MuTect v1.0.27200 developed by the Cancer Biology group at the Broad Institute
(https://confluence.broadinstitute.org/display/CGATools/MuTect). Functional
annotation clustering tool (http://david.abcc.ncifcrf.gov/tools.jsp) from DAVID
Bioinformatics Resources 6.7 was used to find statistically significant gene-
clusters with in the gene list obtained from the SNV and Indel reports. Whole
exome sequencing and resultant statistical analysis were completed by the team
at CCGD, and results interpreted with their expertise and the expertise of Dr
Mitsiades.
46
2.11 Validation of mutPSMB5 in VDR cell line
A PSMB5 (proteasome subunit, beta type, 5) mutation in exon 2 of the PSMB5
gene was detected by WES in VDR cell line, that was absent in parental cell line
MM1R and was validated by Sanger sequencing. DNA was extracted from freshly
collected cell pellets of MM1R and VDR, and exon 2 of the PSMB5 subunit was
amplified by polymerase chain reaction (PCR) using melting temperature of 50⁰C
with the following primers purchased from IDT, Integrated DNA Technologies:
PSMβ5 forward: 5'-CCTCTGATCTTAACAGTTCC-3', PSMβ5 reverse: 5'-
GTGGTTGCAGCTTAACTCAC-3'. The complete PCR product was separated in 2%
agarose gel (with TAE buffer and ethidium bromide 0.5ug/mL), and the purified
product extracted from the gel using Qiagen Gel Extraction kit (#28704). Sanger
sequencing was then completed at the DF/HCC DNA Resource Core that
confirmed the presence of mutPSMB5 that was originally identified by whole
exome sequencing.
2.12 Gene expression profiling
Whole cell pellets containing 2x10⁶ MM.1R and VDR cells were collected at 4°C.
RNA was extracted as per protocol using RNEasy Mini kit (Qiagen) and 500ng
RNA sent to Beth Israel Deaconess Medical Centre Genomics Core facility for
oligonucleotide microarrray analysis using Human Gene 1.0 ST Gene Arrays,
(catalogue # 901085). CEL files from Affymetrix Human Gene 1.0 ST Arrays
(HuGene-1_0-st) were analysed by Gene Pattern using RMA method and
collapsed probe set to maximum values, this analysis was kindly provided by Dr.
Panisinee Lawasut. Expression values comparison (t-test) was made by d-Chip.
Fold change of greater than 1.2 and p-values less than or equal to 0.05 were used
as level of significance.
(Gene Pattern: http://www.broadinstitute.org/cancer/software/genepattern)
(dChip: http://www.hsph.harvard.edu/cli/complab/dchip/)
2.13 shRNA knockdown studies
27 genes were selected for shRNA knockdown studies to determine if their
knockdown would resensitise VDR to bortezomib. 5 puromycin-resistant
lentiviral hairpins were used for knockdown of each specific gene examined and

47
this study was undertaken at the DFCI RNA Interference (RNAi) Screening
Facility under the supervision of Dr. Anna Shinzel. On day 1 cells were plated at a
density of 400x103 cells/mL in 384-well-plates, in the presence of polybrene
(8ug/mL), and allowed to adhere overnight. The following day small hairpins for
each vector were added (5 hairpins for each gene analysed in triplicate in
individual wells) and plates were then centrifuged at 2000rpm for 30 minutes at
37°C. Twenty-four hours following lentiviral infection plates were centrifuged
for 10mins at 2000rpm and media containing virus removed and discarded as
per departmental protocol. Then fresh media containing puromycin 2.5ug/mL
was added to each condition and incubated for 48 hours so that only cells that
had been successfully infected with puromycin-resistant lentivirus were further
analysed. Plates were then treated with bortezomib 50nM (i.e. the IC20 for
MM1VDR), or vehicle (fresh media) for 24 hours and relative cell viability
analysed by CTG. Empty vector and LacZ were used as control hairpins in this
study.
Given that PSMB5 is known to play a pertinent role in bortezomibs mode of
action, and that we also identified a mutation in the PSMB5 gene in VDR, we
chose to validate the successful knockdown of PSMB5 gene and completed same
as follows:
Day 1: MM.1R and VDR cells were seeded in 12-well plates at a concentration of
1 million cells/well in 2mL of fresh media. Polybrene (8ug/mL) was added to the
media-containing cells prior to plating. Cells were allowed to adhere overnight.
Two duplicate 12-well plates per cell line were set up as follows: one for
treatment with bortezomib, and one for collection of cell pellets for validation of
PSMB5 knockdown by immunoblot.
Day 2: 300uL lentivirus containing 5x PSMB5 hairpins or 2x control hairpins
were added to each cell line. Plates were then centrifuged at 2000rpm for
30mins at 37°C.
Day 3: 24-hours after infection: plates were centrifuged for 10mins at 2000rpm,
then media containing lentivirus was discarded and 2mL fresh media added with
puromycin 2.5ug/mL to each condition.

48
Day 5: One plate for each cell line was used for drug treatment: all wells scraped
with a fresh cell scraper; 1mL fresh media added to each well; transferred to 96
well plate for dose response curve using bortezomib 0-40nM for 24hours, and
subsequently relative cell viability analysed using CTG. For duplicate plates: cells
scraped using a fresh cell scraper for each well, cell pellets collected and
prepared for immunoblot to determine PSMB5 expression in MM.1R or VDR for
the following 7 conditions: 5x PSMB5 lentiviral hairpins and 2x control hairpins.
2.14 Lentiviral infection of mutPSMB5 in bortezomib-sensitive
cell lines
We investigated whether or not mutant PSMB5 that was identified by the whole
exome sequencing study, when introduced into bortezomib-sensitive cells,
would render them resistant to bortezomib. On day 1, KMS11mcl cells were
plated in a 12-well plate at a seeding density of 200,000 cells/mL in 400uL of
RPMI media with polybrene 8ug/mL, with 3 biological replicates for each
condition. The cells were subsequently allowed to adhere for 6 hours. Next
122uL of lentiviral construct as provided by the DFCI RNA Interference (RNAi)
Screening Facility of BFP-control, wild-type PSMB5 or mutant PSMB5 blasticidin-
resistant lentiviral vectors, were added. The solution within each well was mixed
using a pipette briefly, then centrifuged at 2000rpm for 90 minutes each at 37°C,
then placed back in the incubator. On day 3, the plates were again centrifuged at
2500rpm for 10 minutes, the supernatant was removed and quickly replaced
with fresh RPMI media containing blasticidin 10ug/mL. The plates were
returned to the incubator and subsequently reviewed daily by light microscopy.
Every 3 days 1mL of old media was removed and 1mL media containing
blasticidin (10ug/mL) was added to each condition, until each well was
approximately 75% confluent, therefore allowing sufficient number of cells to
perform a dose response curve. As previously described, a dose response curve
for each condition was performed to assess the sensitivity of the cell line to
bortezomib (0-40nM for 24 hours) in the setting of BFP-control, wtPSMB5 and
mutPSMB5 and cell viability was analysed by CTG.
Lentiviral infection of MM.1S and MM.1R cell lines was also tried; however
difficulty with lentiviral infection of above constructs proved technically
49
challenging most likely because MM.1S and MM.1R are semi-adherent cells,
compared to KMS11 cells which are fully adherent, allowing a greater degree of
lentiviral infection as the viral constructs and cells both rest at the bottom of the
wells, thus allowing increased infection rate.
2.15 Label-free mass spectrometry
Triplicates of cell pellets containing 10x 106 cells each for MM.1R and VDR were
collected at 4°C and stored at -80°C until time of mass spectrometry. Mass
spectrometry was completed at the National Institute for Cellular Biotechnology
in Dublin, Ireland, under the supervision of Dr Paul Dowling. Protein extraction
was achieved by the addition of lysis buffer (6M urea, 2M thiourea, 10mM Tris,
pH 8) to each sample, with subsequent removal of ionic contaminants using 2D
Clean-Up Kit (BioRad) and stored in acetone overnight. The following day all
tubes were centrifuged, the supernatant discarded, and pellet re-suspended in
the aforementioned lysis buffer. 10ug of protein per sample was determined by
Bradford curve and each was transferred to a fresh tube. Each sample then
underwent reduction (using dithiothreitol at 37°C for 20mins), alkylation (using
iodoacetamide in ammonium bicarbonate for 20minutes), and protein digestion
(via Lys-C for 4 hours, and then trypsin overnight). Peptide purification was
achieved using Pep-Clean C-18 Spin Columns as per protocol (Thermo Scientific).
Finally, protein quantification was determined based on measurements of ion
intensity changes and on spectral counting of identified peptides after MS-MS
analysis. Fold change, Mascot scores (a measure of confidence for the identity of
a given protein) and ANOVA scores for differentially expressed proteins were
determined using the Progenesis LC-MS software (http://www.nonlinear.com) as
previously described.[94-98]
2.16 Transwell co-cultures of hFob 1.19 and MM.1S cells
Transwell plates purchased from Westnet (HTS Transwell®-96 Permeable
Support with 0.4µm Pore Polycarbonate Membrane, catalogue number 3881)
and used to determine whether or not drug resistance in MM.1S, which appeared
to be induced by hFob 1.19, required direct cell-to-cell contact for same to occur.
In the Transwell system two different cell types can be co-cultured but without
direct contact by placing one cell line in the lower chamber and the other cell line

50
in the upper chamber. The upper chamber sits into the lower chamber during
culture, so that cytokines secreted by either cell line are free to move across the
membrane that separates the two cell lines, however the cells are never in direct
contact.
On day 1, 2,000 MM.1S-mcl cells were added to the lower well in 200uL of media
and 8,000 hFob 1.19 cells added to the upper chamber in 50uL of media, then
upper chamber inserted into lower wells. Cells were allowed to culture without
direct contact for 24hours. For comparison a duplicate experiment was
performed where by MM.1S-mcl cells and hFob 1.19 cells were co-cultured in a
single chamber 96-well plate system whereby the cells were in direct contact.
Twenty-four hours later, doxorubicin 62ng/mL, vorinostat 0.5uM or
lenalidomide 2uM, or fresh media as a control was added to each condition in
both the direct co-culture plates and Transwell plates. When treatment was
complete, plates were briefly centrifuged to ensure cells in the lower chambers
of the Transwell had adhered. Then the upper chamber was removed from the
Transwell plates and luciferase was added as previously outlined to determine
viability of MM.1S-mcl cells by bioluminescence. Results of cell viability of
MM.1S-mcl cells from Transwell versus non-Transwell co-cultures were then
compared.
2.17 Characteristics of bortezomib-refractory patients selected
from Multiple Myeloma BioBank
The clinical data pertaining to bone marrow trephine samples previously stored
following patient consent and as per departmental protocol in the Mater
Misericordiae University Hospital Multiple Myeloma biobank were kindly
analysed by Dr. Kay Reen Ting and Dr. Colm Cosgrove. A number of samples
were selected from patients for immunohistochemical analysis of PSMB5 and
PSMB8 proteasomal subunits. Clinical response to treatment were as per IMWG
response criteria (Introduction section 1.2.1). Samples were selected as follows:
• 7 diagnostic samples of patients who achieved at least a VGPR following
one bortezomib-based regimen (called “Diagnostic: Responder”)

51
• 6 diagnostic samples of patients who received a bortezomib-based
regimen and subsequently relapsed (called “Diagnostic: Non-responder”)
• 7 samples from patients who relapsed following a bortezomib-based
regimen (6 of which correlate to aforementioned “Diagnostic: Non-
responders”, (called “Relapsed: Non-responder”).
See tables 2.1.7.1 and 2.1.7.2 below that provides further clinical details for each
sample tested.
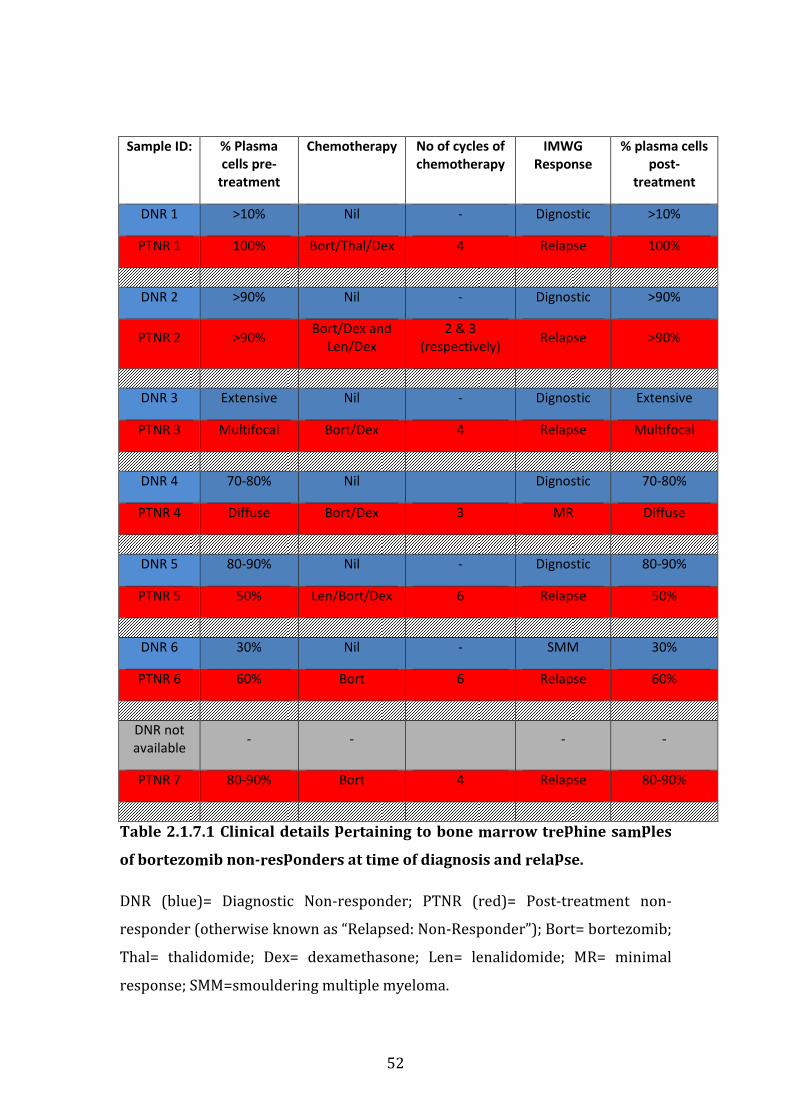
52
Sample ID: % Plasma
cells pre-
treatment
Chemotherapy No of cycles of
chemotherapy
IMWG
Response
% plasma cells
post-
treatment
DNR 1 >10% Nil - Dignostic >10%
PTNR 1 100% Bort/Thal/Dex 4 Relapse 100%
DNR 2 >90% Nil - Dignostic >90%
PTNR 2 >90% Bort/Dex and
Len/Dex
2 & 3
(respectively) Relapse >90%
DNR 3 Extensive Nil - Dignostic Extensive
PTNR 3 Multifocal Bort/Dex 4 Relapse Multifocal
DNR 4 70-80% Nil
Dignostic 70-80%
PTNR 4 Diffuse Bort/Dex 3 MR Diffuse
DNR 5 80-90% Nil - Dignostic 80-90%
PTNR 5 50% Len/Bort/Dex 6 Relapse 50%
DNR 6 30% Nil - SMM 30%
PTNR 6 60% Bort 6 Relapse 60%
DNR not
available - -
- -
PTNR 7 80-90% Bort 4 Relapse 80-90%
Table 2.1.7.1 Clinical details pertaining to bone marrow trephine samples
of bortezomib non-responders at time of diagnosis and relapse.
DNR (blue)= Diagnostic Non-responder; PTNR (red)= Post-treatment non-
responder (otherwise known as “Relapsed: Non-Responder”); Bort= bortezomib;
Thal= thalidomide; Dex= dexamethasone; Len= lenalidomide; MR= minimal
response; SMM=smouldering multiple myeloma.
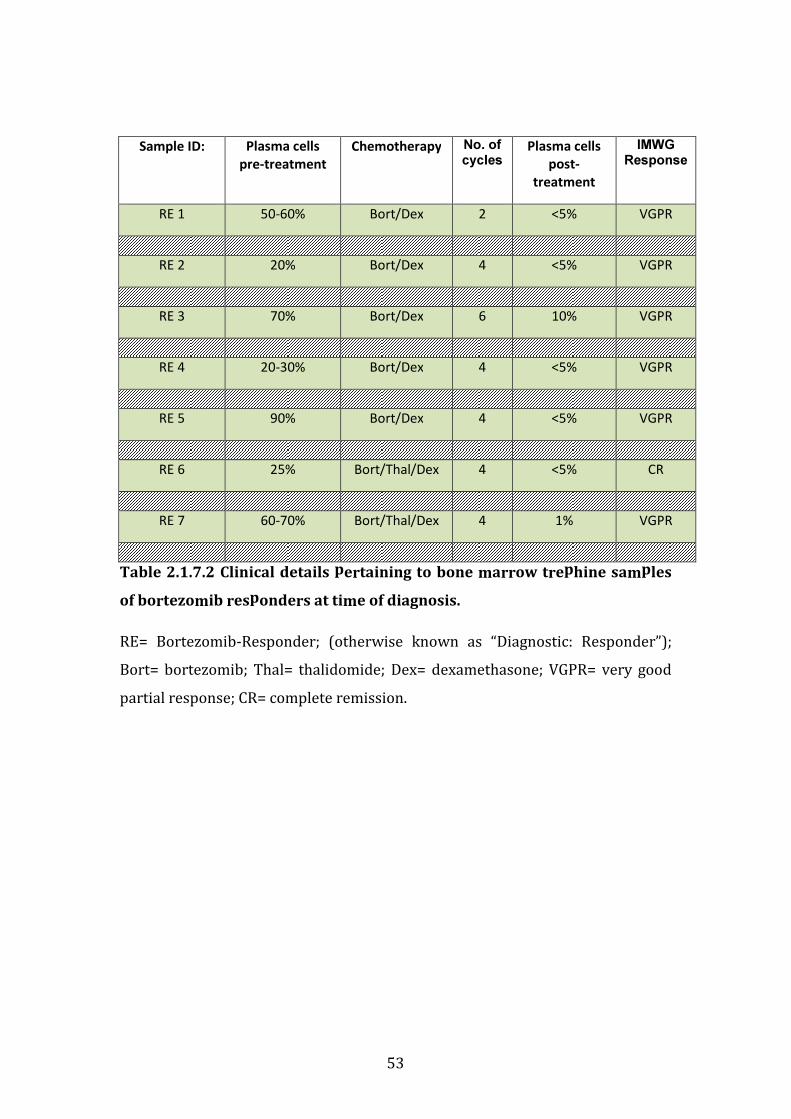
53
Sample ID: Plasma cells
pre-treatment
Chemotherapy No. of cycles
Plasma cells
post-
treatment
IMWG Response
RE 1 50-60% Bort/Dex 2 <5% VGPR
RE 2 20% Bort/Dex 4 <5% VGPR
RE 3 70% Bort/Dex 6 10% VGPR
RE 4 20-30% Bort/Dex 4 <5% VGPR
RE 5 90% Bort/Dex 4 <5% VGPR
RE 6 25% Bort/Thal/Dex 4 <5% CR
RE 7 60-70% Bort/Thal/Dex 4 1% VGPR
Table 2.1.7.2 Clinical details pertaining to bone marrow trephine samples
of bortezomib responders at time of diagnosis.
RE= Bortezomib-Responder; (otherwise known as “Diagnostic: Responder”);
Bort= bortezomib; Thal= thalidomide; Dex= dexamethasone; VGPR= very good
partial response; CR= complete remission.
54
2.18 Immunohistochemistry
5-micrometre sections of formalin-fixed paraffin-embedded bone marrow
trephine biopsies were kindly prepared by the pathology team at the Mater
Misericordiae University hospital pathology laboratory, in preparation for
immunohistochemistry.
The following reagents were utilised for the immunohistochemistry analysis:
DAKO peroxidase blocking solution, DAB stain (containing 1mL of substrate
buffer and 140mL chromogen), Real ENVision visualisation system (prepared
according to manufacturer’s instructions); haematoxylin; PSMB5 primary
antibody (Abcam catalogue no. Ab3330, at a dilution of 1:350), PSMB8 primary
antibody (Abcam catalogue no. Ab58094, at a dilution of 1:300); negative control
(DAKO antibody diluent) and DAKO wash buffer (10x solution diluted in
deionised water).
Slides were initially heat treated for antigen retrieval at 97°C in pH of 9 for 20
minutes. Dako REAL EnVision Detection System (Dako) was used for
immunohistochemical analysis of the bone marrow trephines according to
manufacturer’s instructions. Briefly slides were blocked for endogenous
peroxidase activity and subsequently washed with DAKO wash buffer. Next
slides were treated with PSMB5 or PSMB8 primary antibody diluted in DAKO
antibody diluent, or negative controls treated with DAKO antibody diluent alone.
Slides were again washed with DAKO wash buffer. Slides were then stained with
Dako Real Envision Detection system and stained with DAB chromogen. Finally
slides were counter-stained using haematoxylin and glass coversliped.
All slides were analysed by light microscopy, and images acquired at 20x and 40x
magnification. Images depicted in results section 3.5.8 are those taken at 40x
magnification. Slides were scored semi-quantitatively according to the intensity
of the staining: negative, weakly positive, or strongly positive.
2.19 Statistical Analysis
Statistical analysis to determine statistically significant differences between
treatment groups in in vitro studies was analysed using Prism GraphPad
55
software, (http://www.graphpad.com/scientific-software/prism/), whereby t-
test was used and a p value of statistical significance was set at <0.05 with a FDR
(false discovery rate) set at 1%. Figures in results section with an overlying
asterix (*) represent data-points with p values <0.05.
Statistical analysis for in vivo mouse study was completed by Ms. Amanda
Christie and Dr. Nancy Kohl at the Lurie Family Imaging Centre. Statistical
analysis of whole exome sequencing was performed at the Centre for Cancer
Genome Discovery (CCGD) core facility at DFCI. Statistical analysis for gene
expression profiling was kindly provided by Dr. Panisinee Lawasut as outlined in
methods section 2.12. Statistical analysis of label-free mass spectrometry data
was completed by Dr. Paul Dowling using Progenesis LC-MS software as per
departmental protocol at Dublin City University as outlined in section 2.15.

56
Chapter 3
Results
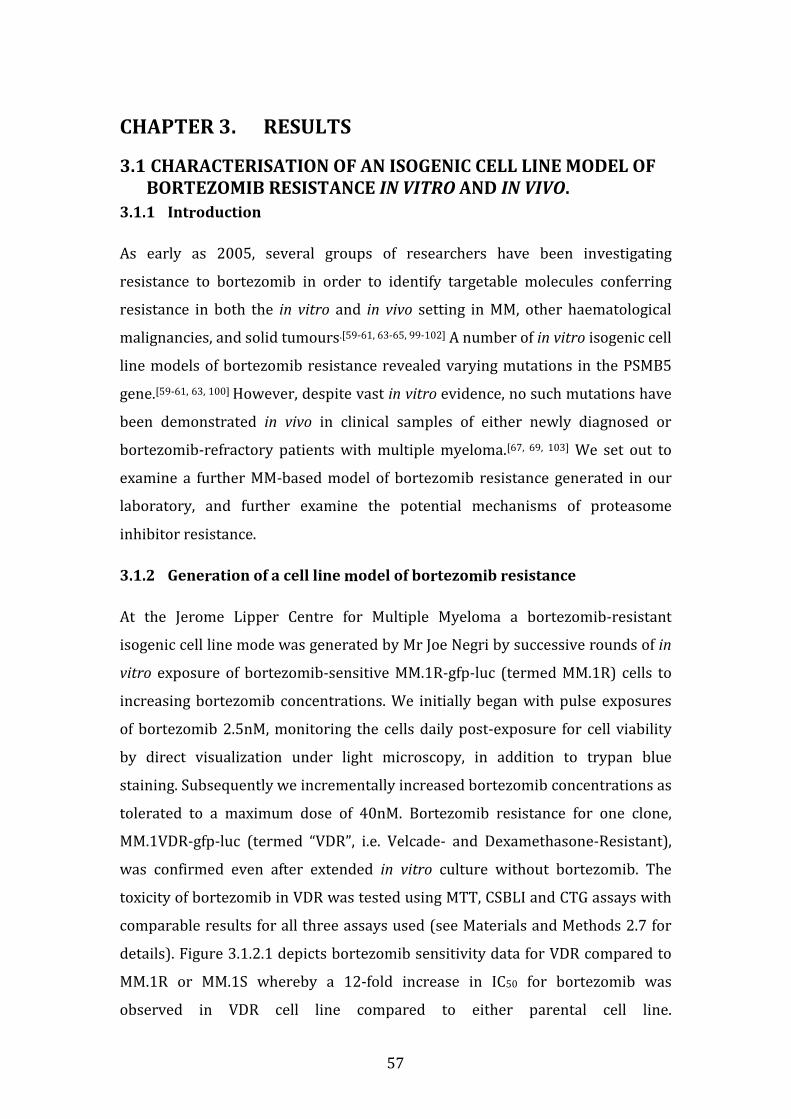
57
CHAPTER 3. RESULTS
3.1 CHARACTERISATION OF AN ISOGENIC CELL LINE MODEL OF
BORTEZOMIB RESISTANCE IN VITRO AND IN VIVO.
3.1.1 Introduction
As early as 2005, several groups of researchers have been investigating
resistance to bortezomib in order to identify targetable molecules conferring
resistance in both the in vitro and in vivo setting in MM, other haematological
malignancies, and solid tumours.[59-61, 63-65, 99-102] A number of in vitro isogenic cell
line models of bortezomib resistance revealed varying mutations in the PSMB5
gene.[59-61, 63, 100] However, despite vast in vitro evidence, no such mutations have
been demonstrated in vivo in clinical samples of either newly diagnosed or
bortezomib-refractory patients with multiple myeloma.[67, 69, 103] We set out to
examine a further MM-based model of bortezomib resistance generated in our
laboratory, and further examine the potential mechanisms of proteasome
inhibitor resistance.
3.1.2 Generation of a cell line model of bortezomib resistance
At the Jerome Lipper Centre for Multiple Myeloma a bortezomib-resistant
isogenic cell line mode was generated by Mr Joe Negri by successive rounds of in
vitro exposure of bortezomib-sensitive MM.1R-gfp-luc (termed MM.1R) cells to
increasing bortezomib concentrations. We initially began with pulse exposures
of bortezomib 2.5nM, monitoring the cells daily post-exposure for cell viability
by direct visualization under light microscopy, in addition to trypan blue
staining. Subsequently we incrementally increased bortezomib concentrations as
tolerated to a maximum dose of 40nM. Bortezomib resistance for one clone,
MM.1VDR-gfp-luc (termed “VDR”, i.e. Velcade- and Dexamethasone-Resistant),
was confirmed even after extended in vitro culture without bortezomib. The
toxicity of bortezomib in VDR was tested using MTT, CSBLI and CTG assays with
comparable results for all three assays used (see Materials and Methods 2.7 for
details). Figure 3.1.2.1 depicts bortezomib sensitivity data for VDR compared to
MM.1R or MM.1S whereby a 12-fold increase in IC50 for bortezomib was
observed in VDR cell line compared to either parental cell line.
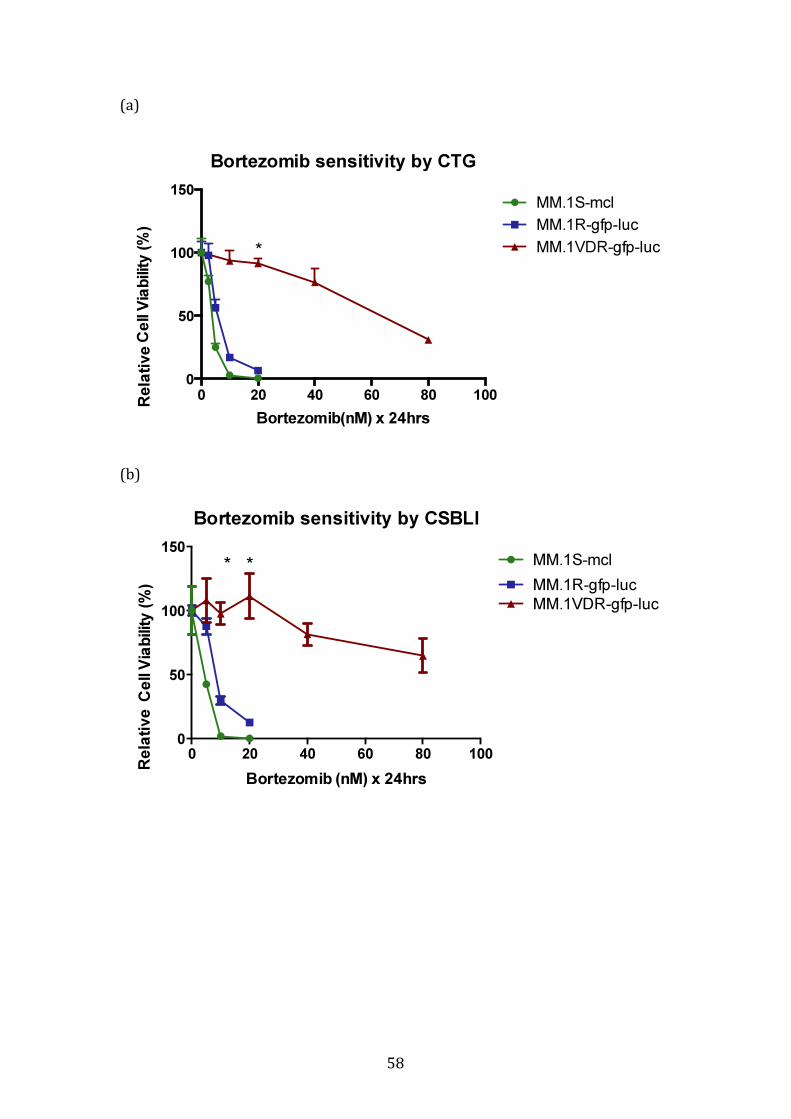
58
(a)
(b)
Bortezomib sensitivity by CTG
Bortezomib(nM) x 24hrs
Ce
ll V
iab
ility
(%
)
0 20 40 60 80 100
0
50
100
150MM.1S-mcl
MM.1R-gfp-luc
MM.1VDR-gfp-luc*
Bortezomib sensitivity by CSBLI
Bortezomib (nM) x 24hrs
Ce
ll V
iab
ility
(%
)
0 20 40 60 80 100
0
50
100
150MM.1S-mcl
MM.1VDR-gfp-luc
MM.1R-gfp-luc
* *
Rela
tive
R
ela
tive

59
(c)
Figure 3.1.2.1 Sensitivity of isogenic cell lines to bortezomib.
Following evolution of one bortezomib resistant clone that we termed VDR, we
tested these cells using 3 separate assays. Figure 3.1.2.1a demonstrates cell
viability of the 3 cell lines following a Cell Titre Glo Assay, and demonstrates the
marked increase in IC50 for bortezomib in VDR cell line. A 12-fold increase in IC50
in VDR (red) was observed, with an IC50 60nM, versus 5nM for parental MM.1R
(blue) or MM.1S (green). This experiment was repeated using (b) a luciferase-
based assay (CSBLI) and (c) an MTT assay with comparable results regardless of
the assay utilised. *p<0.05 when MM1R compared to VDR.
Bortezomib sensitivity by MTT
0 10 20 30 40 60 80 100
0
50
100
150
Bortezomib (nM) x 24hrs
Ce
ll V
iab
ility
(%
)
MM.1R-gfp-luc
MM.1VDR-gfp-luc*
Rela
tive
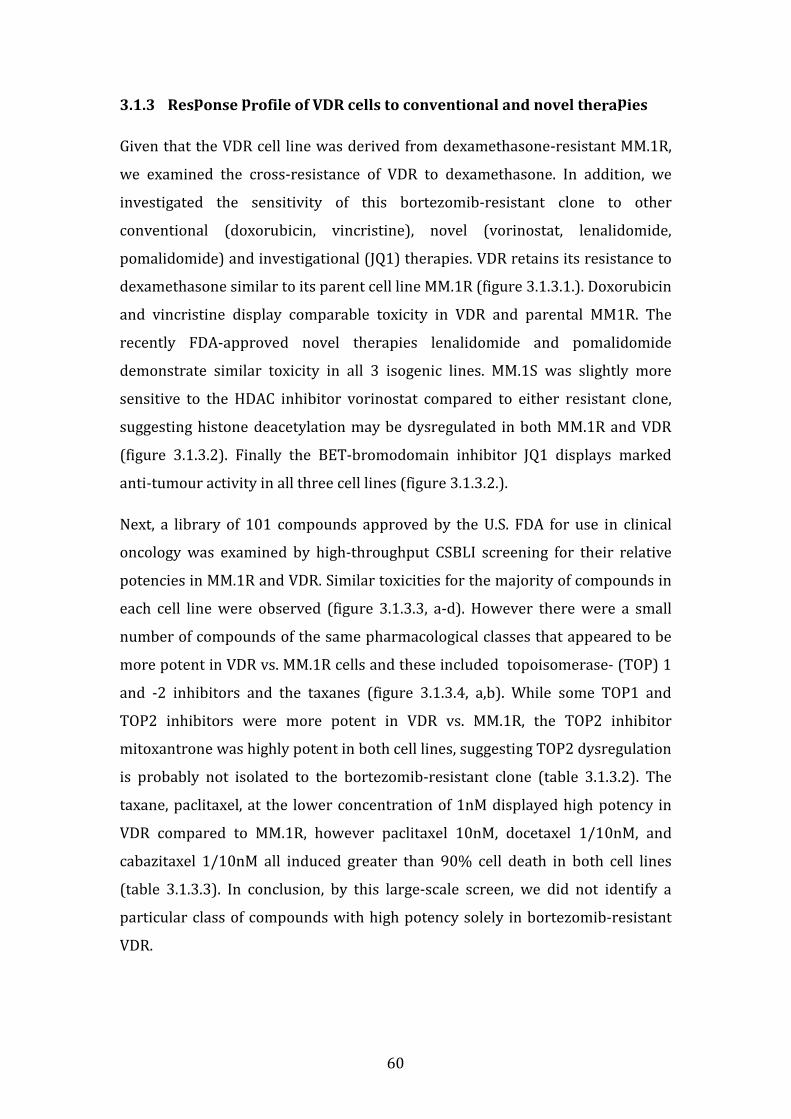
60
3.1.3 Response profile of VDR cells to conventional and novel therapies
Given that the VDR cell line was derived from dexamethasone-resistant MM.1R,
we examined the cross-resistance of VDR to dexamethasone. In addition, we
investigated the sensitivity of this bortezomib-resistant clone to other
conventional (doxorubicin, vincristine), novel (vorinostat, lenalidomide,
pomalidomide) and investigational (JQ1) therapies. VDR retains its resistance to
dexamethasone similar to its parent cell line MM.1R (figure 3.1.3.1.). Doxorubicin
and vincristine display comparable toxicity in VDR and parental MM1R. The
recently FDA-approved novel therapies lenalidomide and pomalidomide
demonstrate similar toxicity in all 3 isogenic lines. MM.1S was slightly more
sensitive to the HDAC inhibitor vorinostat compared to either resistant clone,
suggesting histone deacetylation may be dysregulated in both MM.1R and VDR
(figure 3.1.3.2). Finally the BET-bromodomain inhibitor JQ1 displays marked
anti-tumour activity in all three cell lines (figure 3.1.3.2.).
Next, a library of 101 compounds approved by the U.S. FDA for use in clinical
oncology was examined by high-throughput CSBLI screening for their relative
potencies in MM.1R and VDR. Similar toxicities for the majority of compounds in
each cell line were observed (figure 3.1.3.3, a-d). However there were a small
number of compounds of the same pharmacological classes that appeared to be
more potent in VDR vs. MM.1R cells and these included topoisomerase- (TOP) 1
and -2 inhibitors and the taxanes (figure 3.1.3.4, a,b). While some TOP1 and
TOP2 inhibitors were more potent in VDR vs. MM.1R, the TOP2 inhibitor
mitoxantrone was highly potent in both cell lines, suggesting TOP2 dysregulation
is probably not isolated to the bortezomib-resistant clone (table 3.1.3.2). The
taxane, paclitaxel, at the lower concentration of 1nM displayed high potency in
VDR compared to MM.1R, however paclitaxel 10nM, docetaxel 1/10nM, and
cabazitaxel 1/10nM all induced greater than 90% cell death in both cell lines
(table 3.1.3.3). In conclusion, by this large-scale screen, we did not identify a
particular class of compounds with high potency solely in bortezomib-resistant
VDR.
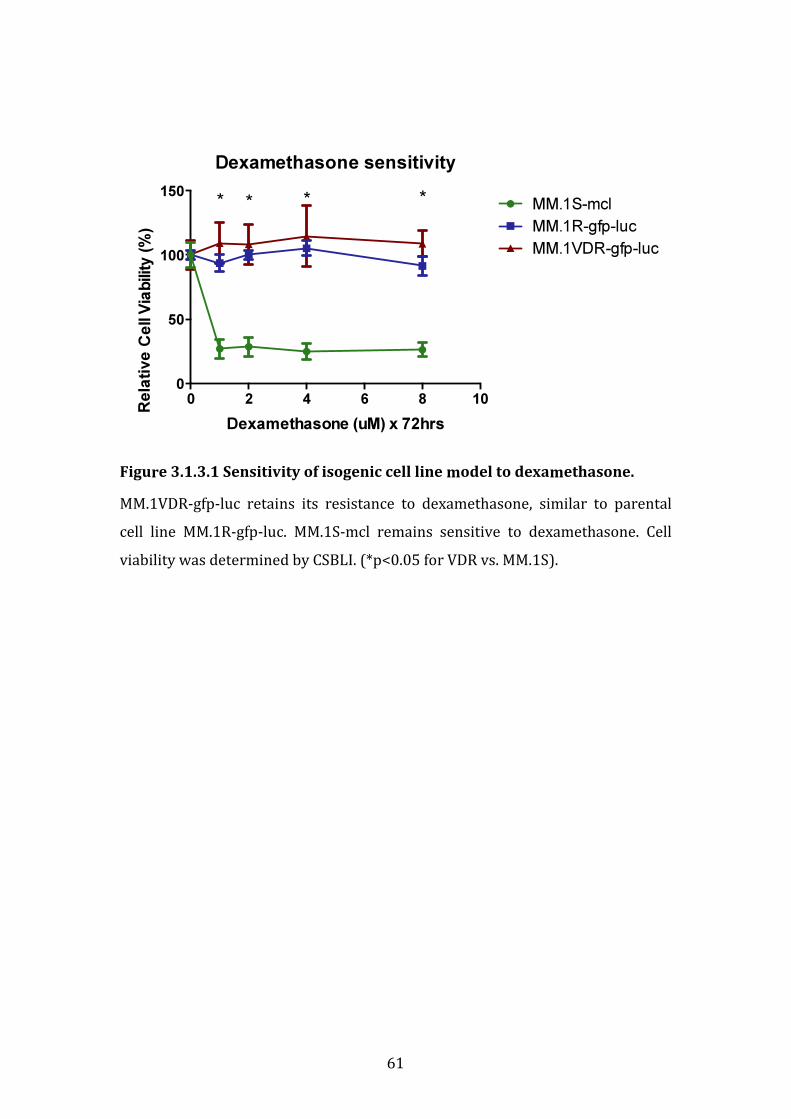
61
Figure 3.1.3.1 Sensitivity of isogenic cell line model to dexamethasone.
MM.1VDR-gfp-luc retains its resistance to dexamethasone, similar to parental
cell line MM.1R-gfp-luc. MM.1S-mcl remains sensitive to dexamethasone. Cell
viability was determined by CSBLI. (*p<0.05 for VDR vs. MM.1S).
Dexamethasone sensitivity
Dexamethasone (uM) x 72hrs
Ce
ll V
iab
ility
(%
)
0 2 4 6 8 10
0
50
100
150MM.1S-mcl
MM.1R-gfp-luc
MM.1VDR-gfp-luc
* * **
Rela
tive

62
Figure 3.1.3.2. Sensitivity of isogenic cell lines to other therapies.
The toxicity of conventional, novel and investigational reagents to all 3 cells lines
is comparable (green=MM.1S, blue= MM.1R and red=VDR), with the exception of
MM.1Smcl which displays a greater degree of sensitisation to vorinostat
compared to either MM.1R or VDR (*p<0.05). Relative cell viability was
determined here by CSBLI in all assays demonstrated.
Doxorubicin sensitivity
Doxorubicin (ng/mL) x48hrs
Ce
ll V
iab
ility
(%
)
0 100 200 300
0
50
100
150
MM.1S-mcl
MM.1R-gfp-luc
MM.1VDR-gfp-luc
Lenalidomide sensitivity
Lenalidomide (uM) x 72hrs
Ce
ll V
iab
ility
(%
)
0 2 4 6 8 10
0
50
100
150
MM.1Smcl
MM.1Rgfp-luc
MM.1VDR-gfp-luc
Vorinostat sensitivity
Vorinostat (uM) x 72hrs
Ce
ll V
iab
ility
(%
)
0.0 0.5 1.0 1.5 2.0 2.5
0
50
100
150
MM.1S-mcl
MM.1Rgfp-luc
MM.1VDR-gfp-luc
*
Vincristine sensitivity
Vincristine sulphate (nM) x72hrs
Ce
ll V
iab
ility
(%
)
0 5 10 15
0
50
100
150
MM.1R-gfp-luc
MM.1VDR-gfp-luc
Pomalidomide sensitivity
Pomalidomide (uM) x72hrs
Ce
ll V
iab
ility
(%
)
0 1 2 3 4 5
0
50
100
150
MM.1S-mcl
MM.1Rgfp-luc
MM.1VDR-gfp-luc
JQ1 sensitivity
JQ1 (nM) x 72hr
Ce
ll V
iab
ility
(%
)
0 500 1000 1500
0
50
100
150
MM.1S-mcl
MM.1Rgfp-luc
MM.1VDR-gfp-luc
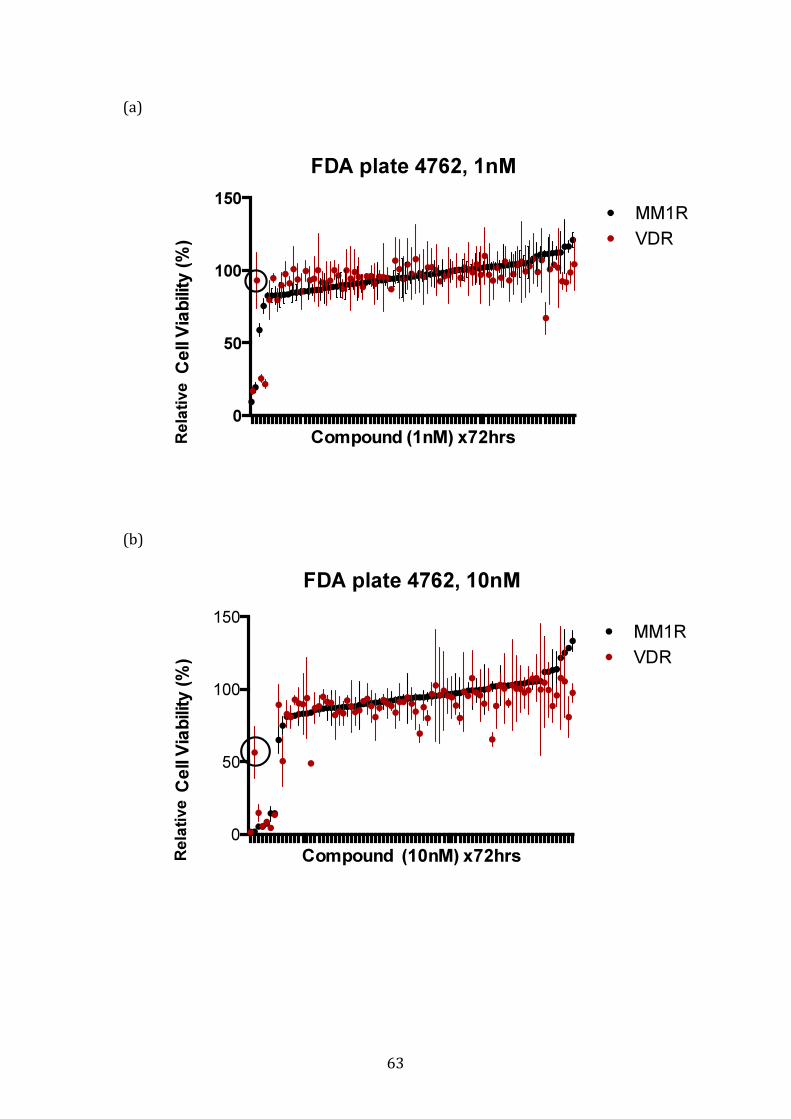
63
FDA plate 4762, 1nM
0
50
100
150
Cell V
iability (%
)
Compound (1nM) x72hrs
MM1R
VDR
FDA plate 4762, 10nM
0
50
100
150
Ce
ll V
iab
ility (%
)
Compound (10nM) x72hrs
MM1R
VDR
Rela
tive
Rela
tive
(a)
(b)
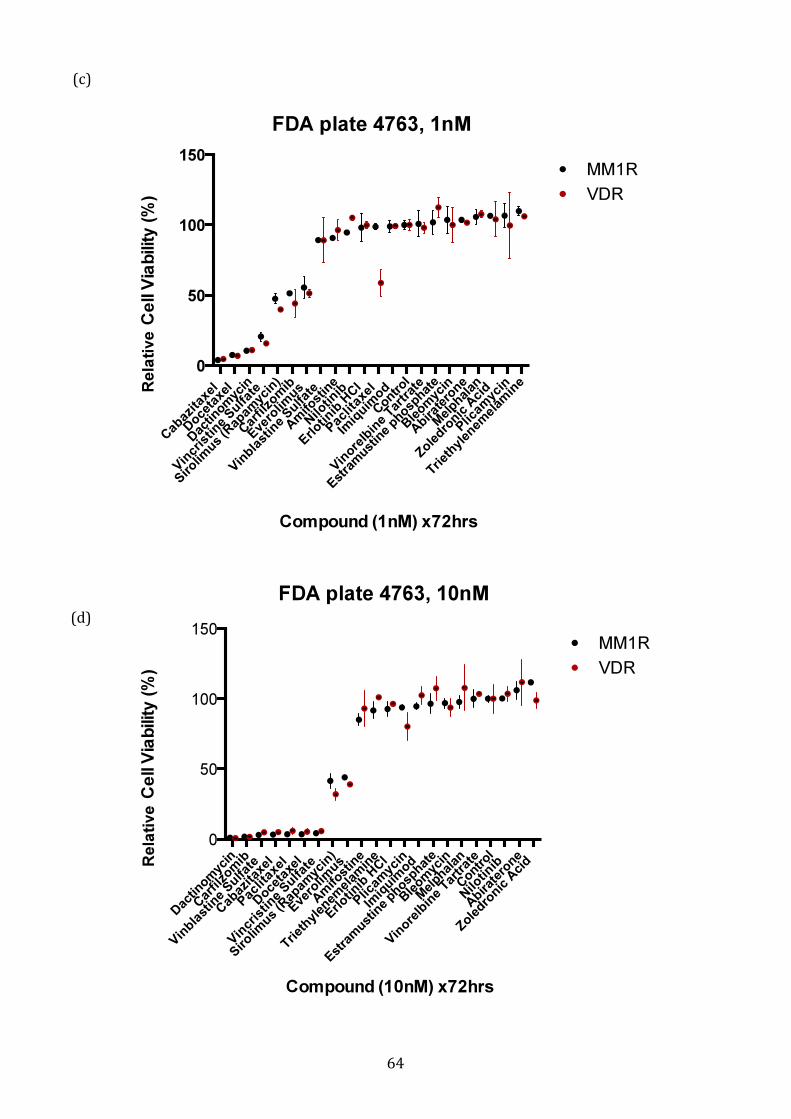
64
FDA plate 4763, 1nM
Cab
azita
xel
Doce
taxe
l
Dac
tinom
ycin
Vin
cris
tine
Sulfa
te
Siro
limus
(Rap
amyc
in)
Car
filzo
mib
Eve
rolim
us
Vin
blast
ine
Sulfa
te
Am
ifost
ine
Nilo
tinib
Erlotin
ib H
Cl
Pac
litax
el
Imiq
uimod
Contr
ol
Vin
orelb
ine
Tartrat
e
Est
ram
ustin
e phosp
hate
Ble
omyc
in
Abira
tero
ne
Mel
phalan
Zoledro
nic A
cid
Plic
amyc
in
Triet
hylen
emel
amin
e
0
50
100
150C
ell V
iab
ilit
y (
%)
MM1R
VDR
Compound (1nM) x72hrs
FDA plate 4763, 10nM
Dac
tinom
ycin
Car
filzo
mib
Vin
blast
ine
Sulfa
te
Cab
azita
xel
Pac
litax
el
Doce
taxe
l
Vin
cris
tine
Sulfa
te
Sirolim
us (R
apam
ycin
)
Eve
rolim
us
Am
ifost
ine
Triet
hylen
emel
amin
e
Erlotin
ib H
Cl
Plic
amyc
in
Imiq
uimod
Estra
must
ine
phosphat
e
Ble
omyc
in
Mel
phalan
Vin
orelb
ine
Tartrat
e
Contr
ol
Nilo
tinib
Abira
tero
ne
Zoledro
nic A
cid
0
50
100
150
Ce
ll V
iab
ilit
y (
%)
MM1R
VDR
Compound (10nM) x72hrs
(c)
(d)
Rela
tive
R
ela
tive
65
Figure 3.1.3.3 High-throughput screening of FDA-approved compounds for
use in oncology.
(a-d) The majority of the 101 FDA-approved compounds tested displayed
comparable toxicity in MM1R and VDR in a high throughput screen using CSBLI
(results for 1nM and 10nM concentrations shown here). Fig. 3.1.3.3 (a, b):
bortezomib was used as a control in FDA plate no. 4762, and again demonstrated
resistance to bortezomib in VDR in comparison to MM.1R, highlighted by black
circles in plate number 4762.
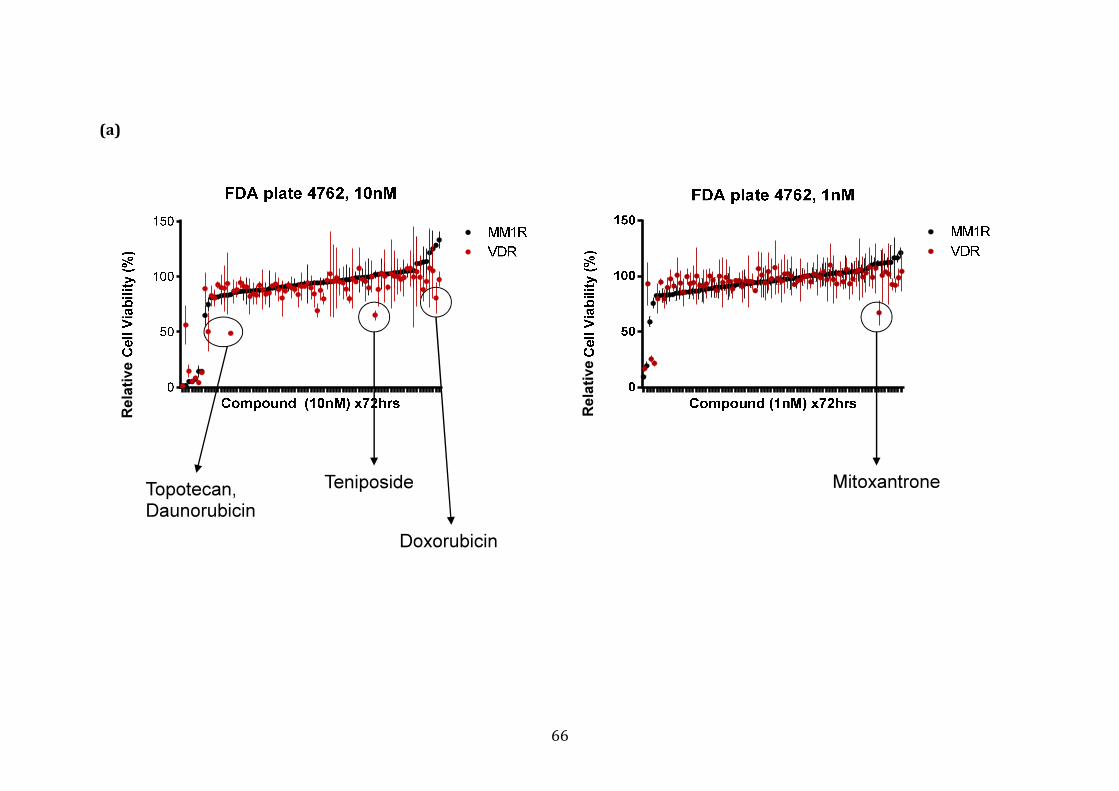
66
(a)
Topotecan,
Daunorubicin
Teniposide
Doxorubicin
Mitoxantrone
Rela
tive
Rela
tive
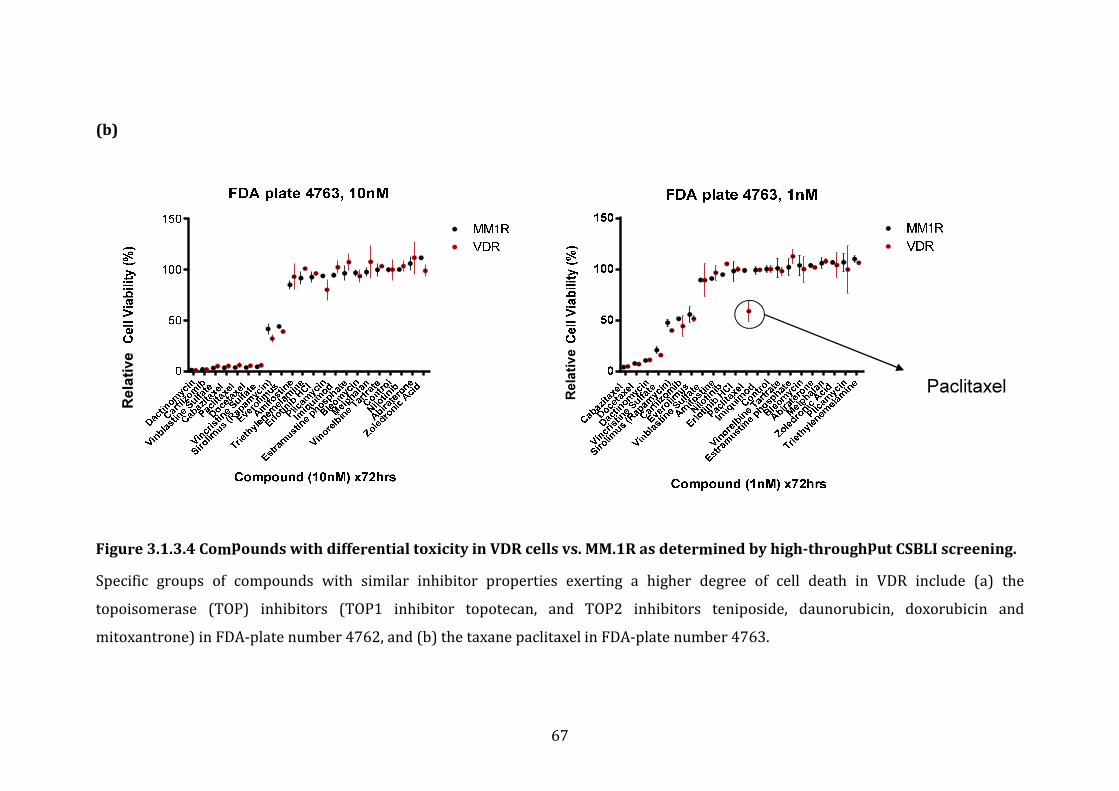
67
(b)
Figure 3.1.3.4 Compounds with differential toxicity in VDR cells vs. MM.1R as determined by high-throughput CSBLI screening.
Specific groups of compounds with similar inhibitor properties exerting a higher degree of cell death in VDR include (a) the
topoisomerase (TOP) inhibitors (TOP1 inhibitor topotecan, and TOP2 inhibitors teniposide, daunorubicin, doxorubicin and
mitoxantrone) in FDA-plate number 4762, and (b) the taxane paclitaxel in FDA-plate number 4763.
Paclitaxel
Rela
tive
Rela
tiv
e
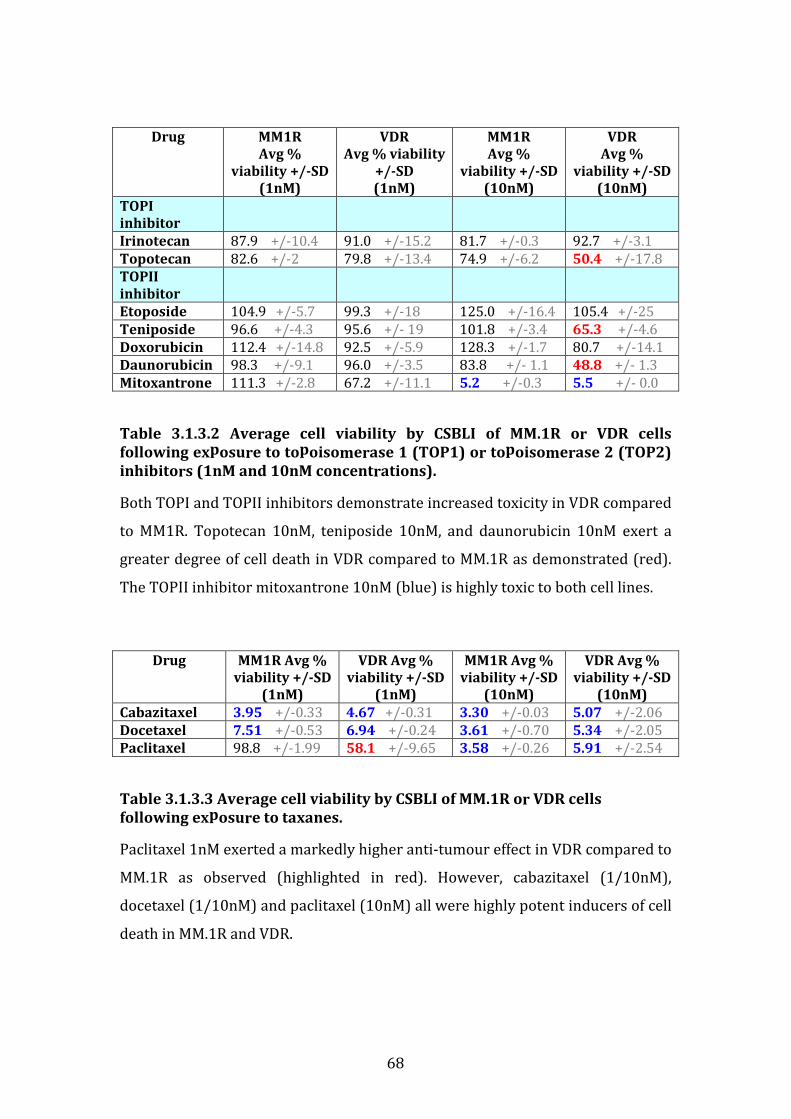
68
Drug MM1R
Avg %
viability +/-SD
(1nM)
VDR
Avg % viability
+/-SD
(1nM)
MM1R
Avg %
viability +/-SD
(10nM)
VDR
Avg %
viability +/-SD
(10nM)
TOPI
inhibitor
Irinotecan 87.9 +/-10.4 91.0 +/-15.2 81.7 +/-0.3 92.7 +/-3.1
Topotecan 82.6 +/-2 79.8 +/-13.4 74.9 +/-6.2 50.4 +/-17.8
TOPII
inhibitor
Etoposide 104.9 +/-5.7 99.3 +/-18 125.0 +/-16.4 105.4 +/-25
Teniposide 96.6 +/-4.3 95.6 +/- 19 101.8 +/-3.4 65.3 +/-4.6
Doxorubicin 112.4 +/-14.8 92.5 +/-5.9 128.3 +/-1.7 80.7 +/-14.1
Daunorubicin 98.3 +/-9.1 96.0 +/-3.5 83.8 +/- 1.1 48.8 +/- 1.3
Mitoxantrone 111.3 +/-2.8 67.2 +/-11.1 5.2 +/-0.3 5.5 +/- 0.0
Table 3.1.3.2 Average cell viability by CSBLI of MM.1R or VDR cells
following exposure to topoisomerase 1 (TOP1) or topoisomerase 2 (TOP2)
inhibitors (1nM and 10nM concentrations).
Both TOPI and TOPII inhibitors demonstrate increased toxicity in VDR compared
to MM1R. Topotecan 10nM, teniposide 10nM, and daunorubicin 10nM exert a
greater degree of cell death in VDR compared to MM.1R as demonstrated (red).
The TOPII inhibitor mitoxantrone 10nM (blue) is highly toxic to both cell lines.
Drug MM1R Avg %
viability +/-SD
(1nM)
VDR Avg %
viability +/-SD
(1nM)
MM1R Avg %
viability +/-SD
(10nM)
VDR Avg %
viability +/-SD
(10nM)
Cabazitaxel 3.95 +/-0.33 4.67 +/-0.31 3.30 +/-0.03 5.07 +/-2.06
Docetaxel 7.51 +/-0.53 6.94 +/-0.24 3.61 +/-0.70 5.34 +/-2.05
Paclitaxel 98.8 +/-1.99 58.1 +/-9.65 3.58 +/-0.26 5.91 +/-2.54
Table 3.1.3.3 Average cell viability by CSBLI of MM.1R or VDR cells
following exposure to taxanes.
Paclitaxel 1nM exerted a markedly higher anti-tumour effect in VDR compared to
MM.1R as observed (highlighted in red). However, cabazitaxel (1/10nM),
docetaxel (1/10nM) and paclitaxel (10nM) all were highly potent inducers of cell
death in MM.1R and VDR.
69
3.1.4 Sensitivity of VDR to novel proteasome inhibitors
Previously documented models of bortezomib resistance in MM and solid
tumours were sensitive to the novel and irreversible proteasome inhibitor
carfilzomib.[48, 63] Therefore we next examined the toxicity of second-generation
proteasome inhibitors in our model. Carfilzomib, which exhibits irreversible
binding to multiple proteasome-associated catalytic subunits, was highly and
equally toxic to both MM.1R and VDR cells. However, we observed a marked
reduction in sensitivity to the investigational compound MLN2238, a novel orally
bioavailable reagent that specifically targets the proteasome beta-5 subunit,
suggesting that one mechanism of resistance to bortezomib in VDR can
potentially be mediated through the beta-5 proteasome subunit (figure 3.1.4.1).
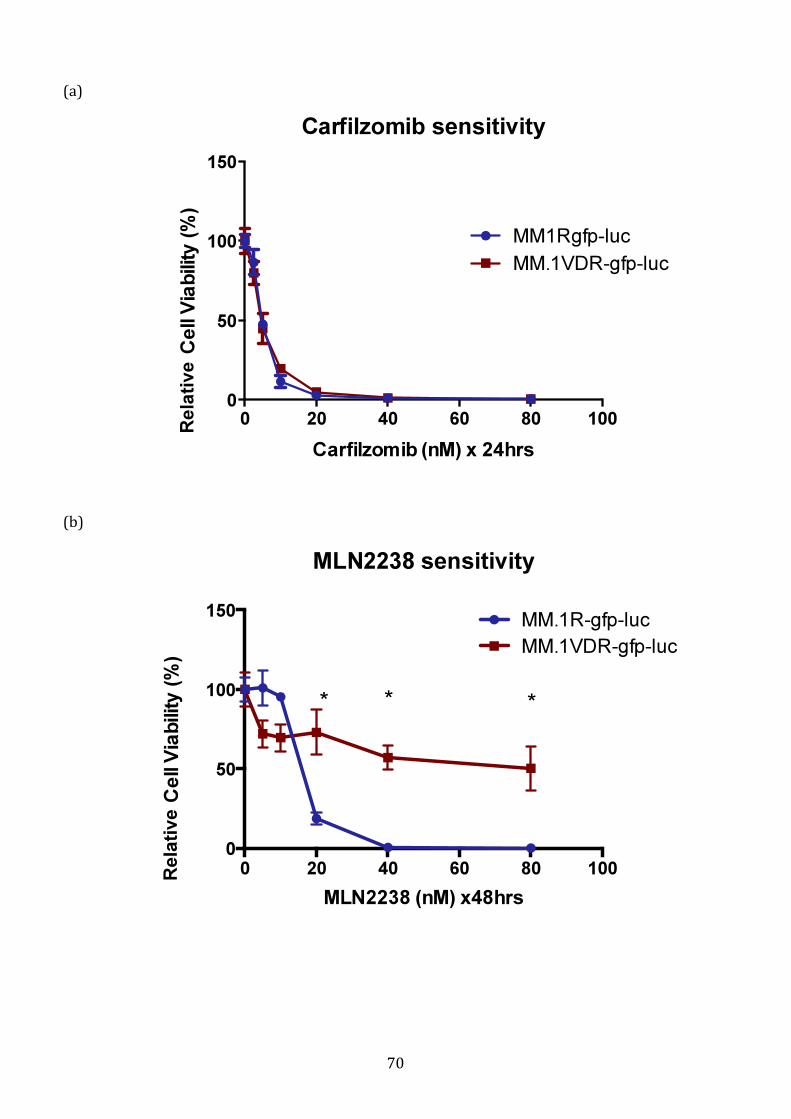
70
Carfilzomib sensitivity
Carfilzomib (nM) x 24hrs
Ce
ll V
iab
ilit
y (
%)
0 20 40 60 80 100
0
50
100
150
MM1Rgfp-luc
MM.1VDR-gfp-luc
MLN2238 sensitivity
MLN2238 (nM) x48hrs
Ce
ll V
iab
ilit
y (
%)
0 20 40 60 80 100
0
50
100
150MM.1R-gfp-luc
MM.1VDR-gfp-luc
* * *
(a)
(b)
Rela
tive
Rela
tive
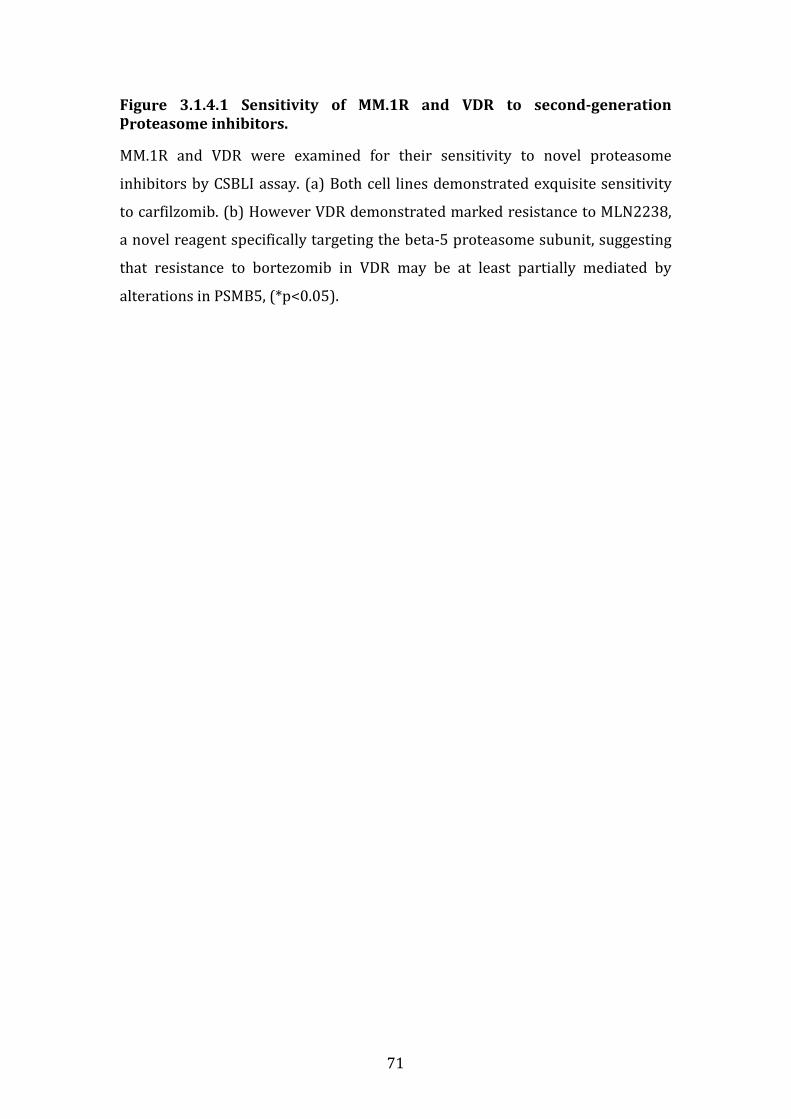
71
Figure 3.1.4.1 Sensitivity of MM.1R and VDR to second-generation
proteasome inhibitors.
MM.1R and VDR were examined for their sensitivity to novel proteasome
inhibitors by CSBLI assay. (a) Both cell lines demonstrated exquisite sensitivity
to carfilzomib. (b) However VDR demonstrated marked resistance to MLN2238,
a novel reagent specifically targeting the beta-5 proteasome subunit, suggesting
that resistance to bortezomib in VDR may be at least partially mediated by
alterations in PSMB5, (*p<0.05).
72
3.1.5 The role of p-glycoprotein in bortezomib resistance in VDR.
P-glycoprotein (P-gp) over-expression has been previously well documented for
it’s pertinent role in drug resistance in cancer in the in vitro and in vivo setting. In
particular, very recently the role of P-gp in bortezomib resistance has been
delineated and clarified that bortezomib also is subject to pharmacokinetic
resistance mediated by P-gp.[104] We compared the sensitivity of VDR (unknown
P-gp expression) and MM cell line RPMI-8226-Dox-40 (also known as “Dox40”
with known P-gp over-expression) to bortezomib, MLN2238 (active metabolite
of the orally bioavailable proteasome inhibitor MLN-9708) and carfilzomib in
combination with the P-gp inhibitor elacridar.
In Dox-40, resistance to bortezomib, MLN2238 and carfilzomib single agent
treatment was observed. When we individually combined these agents with the
P-gp inhibitor elacridar, resensitisation of Dox40-mcl cells to bortezomib 40nM
and carfilzomib 10nM was observed. This suggests that bortezomib and
carfilzomib resistance observed in Dox40-mcl may be partially mediated by P-gp,
and can be overcome by the addition of a P-gp inhibitor. However concomitant
P-gp inhibition with MLN2238 did not induce cell death in Dox40-mcl,
suggesting MLN2238 is not a P-gp substrate (figure 3.1.5.1).
VDR again displayed resistance to single agent exposure of bortezomib and
MLN2238, and was sensitive to carfilzomib. Bortezomib and elacridar in
combination did not result in synergistic cell death in VDR. Similar results were
observed for MLN2238 and elacridar in combination in VDR. These results
suggest that resistance to bortezomib and MLN2238 in VDR are unlikely to be
mediated by P-gp over-expression. Carfilzomib in combination with elacridar did
not demonstrate synergistic activity, mainly because the concentrations of
carfilzomib used in this assay are highly toxic to VDR cells even without the
addition of elacridar (figure 3.1.5.2).
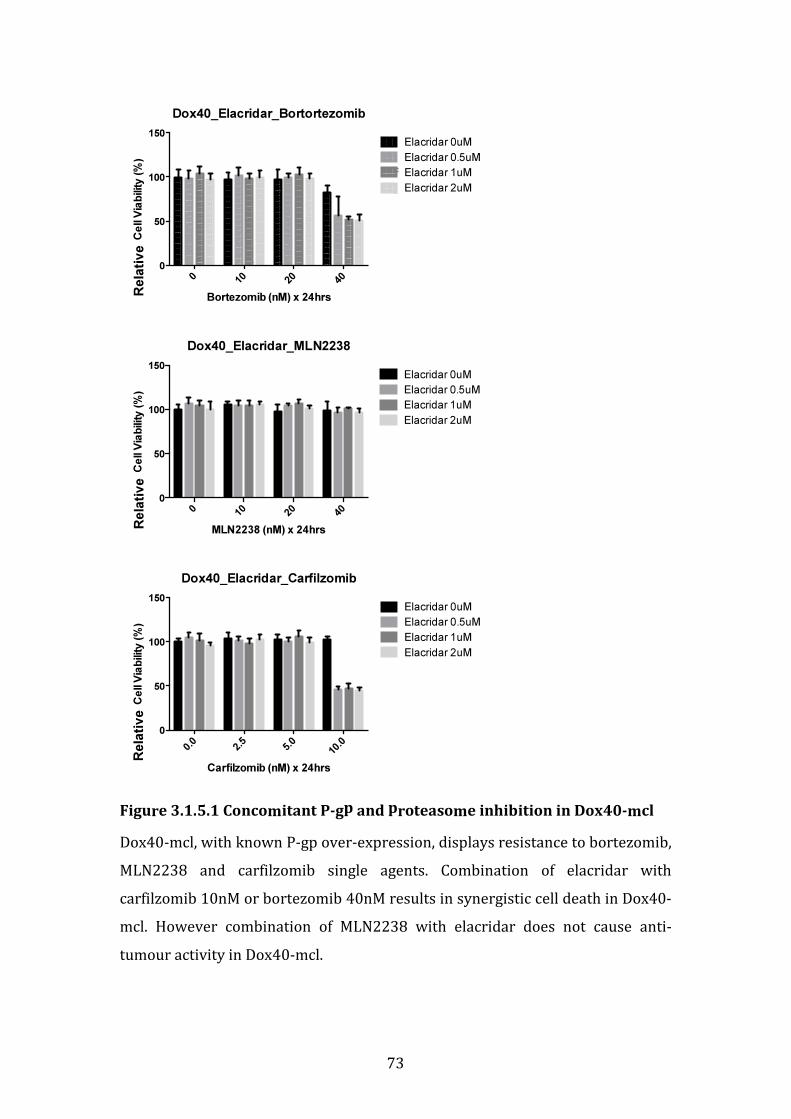
73
Figure 3.1.5.1 Concomitant P-gp and proteasome inhibition in Dox40-mcl
Dox40-mcl, with known P-gp over-expression, displays resistance to bortezomib,
MLN2238 and carfilzomib single agents. Combination of elacridar with
carfilzomib 10nM or bortezomib 40nM results in synergistic cell death in Dox40-
mcl. However combination of MLN2238 with elacridar does not cause anti-
tumour activity in Dox40-mcl.
Dox40_Elacridar_Bortortezomib
Bortezomib (nM) x 24hrs
Ce
ll V
iab
ility
(%
)
010
20
40
0
50
100
150Elacridar 0uM
Elacridar 0.5uM
Elacridar 1uM
Elacridar 2uM
Dox40_Elacridar_MLN2238
MLN2238 (nM) x 24hrs
Ce
ll V
iab
ility
(%
)
010
20
40
0
50
100
150
Elacridar 0uM
Elacridar 0.5uM
Elacridar 1uM
Elacridar 2uM
Dox40_Elacridar_Carfilzomib
Carfilzomib (nM) x 24hrs
Ce
ll V
iab
ility
(%
)
0.0
2.5
5.0
10.0
0
50
100
150Elacridar 0uM
Elacridar 0.5uM
Elacridar 1uM
Elacridar 2uM
Rela
tiv
e
Rela
tiv
e
Rela
tiv
e

74
Figure 3.1.5.2 Concomitant P-gp and proteasome inhibition in VDR
Bortezomib or MLN2238 combination with elacridar does not result in death of
VDR cells. Synergistic activity of carfilzomib and elacridar in VDR is not
observed, mainly because carfilzomib single agent is highly toxic to VDR cells.
These results suggest bortezomib and MLN2238 resistance in VDR is not P-gp-
mediated.
VDR_Elacridar_Bortezomib
Bortezomib (nM) x 24hrs
Ce
ll V
iab
ility
(%
)
010
20
40
0
50
100
150Elacridar 0uM
Elacridar 0.5uM
Elacridar 1uM
Elacridar 2uM
VDR_Elacridar_MLN2238
MLN2238 (nM) x 24hrs
Ce
ll V
iab
ility
(%
)
010
20
40
0
50
100
150
Elacridar 0uM
Elacridar 0.5uM
Elacridar 1uM
Elacridar 2uM
VDR_Elacridar_Carfilzomib
Carfilzomib (nM) x 24hrs
Ce
ll V
iab
ility
(%
)
0.0
2.5
5.0
10.0
0
50
100
150Elacridar 0uM
Elacridar 0.5uM
Elacridar 1uM
Elacridar 2uM
Rela
tiv
e
Rela
tiv
e
Rela
tiv
e
75
3.1.6 Baseline proliferation rate of MM.1R and VDR cell lines
To investigate if resistance to bortezomib in VDR was secondary to differences in
proliferation rate of VDR compared to MM.1R, we undertook serial
measurements of both MM.1R and VDR cell line proliferation rates. MM.1R or
VDR cells were plated at a seeding density of 100 x 103 cells/mL in 100uL of
RPMI media on a 96-well plate in triplicate for each of the following timeframes
of culture: 0, 24, 48, 72 and 96 hours. The cell viability of each condition was
measured by CSBLI at the appropriate timepoint (figure 3.1.6 (a)).
In addition one week later, MM.1R and VDR cells were plated in 6-well plates at a
seeding density of 250 x 103 cells/mL in biological triplicate and allowed to
culture for 0, 24, 48 and 72 hours. In this experiment, at each timepoint the
number of cells per condition were physically counted under light microscopy
using a haemocytometer, and apoptotic bodies that stained positive for trypan
blue were excluded (figure 3.1.6 (b)).
No statistically significant increase in proliferation rate was observed by either
means of measurement of proliferation rate in VDR cell line versus MM.1R.
Therefore a greater proliferation rate in VDR does not explain its observed
resistance to bortezomib.
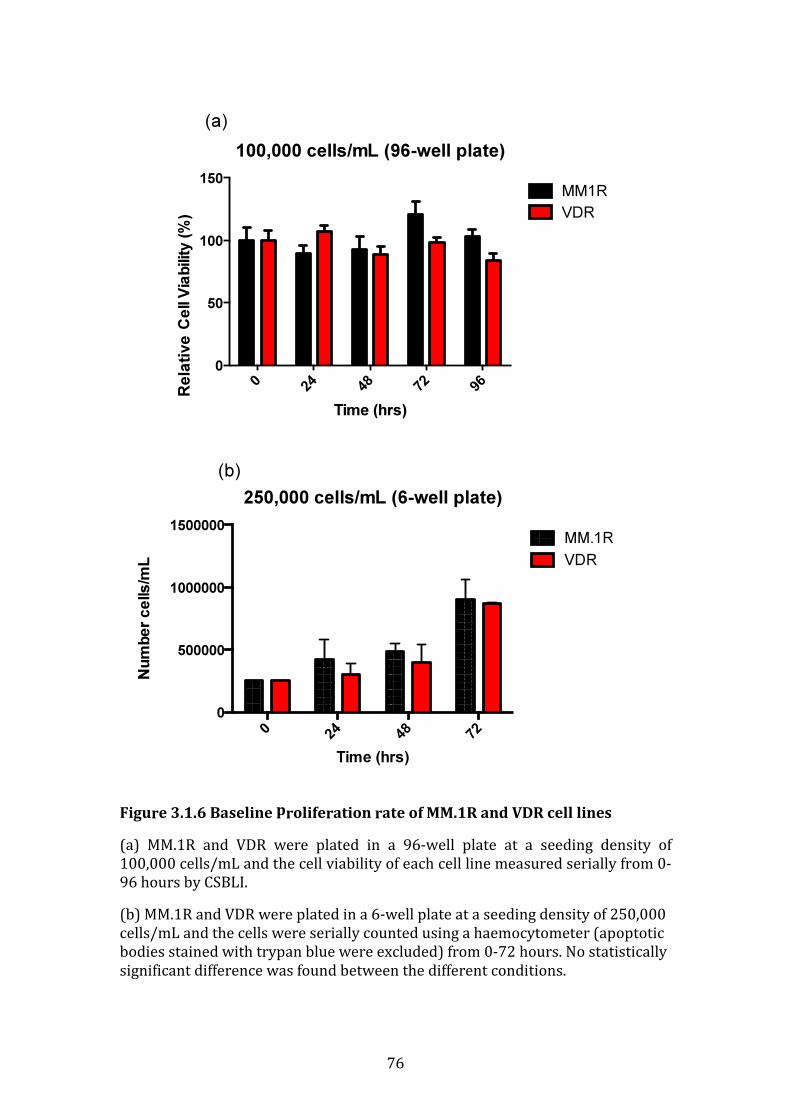
76
Figure 3.1.6 Baseline proliferation rate of MM.1R and VDR cell lines
(a) MM.1R and VDR were plated in a 96-well plate at a seeding density of
100,000 cells/mL and the cell viability of each cell line measured serially from 0-
96 hours by CSBLI.
(b) MM.1R and VDR were plated in a 6-well plate at a seeding density of 250,000
cells/mL and the cells were serially counted using a haemocytometer (apoptotic
bodies stained with trypan blue were excluded) from 0-72 hours. No statistically
significant difference was found between the different conditions.
100,000 cells/mL (96-well plate)
Time (hrs)
Ce
ll V
iab
ility
(%
)
024
48
72
96
0
50
100
150MM1R
VDR
(a)
250,000 cells/mL (6-well plate)
Time (hrs)
Nu
mb
er c
ells
/mL
024
48
72
0
500000
1000000
1500000MM.1R
VDR
(b)
Rela
tive
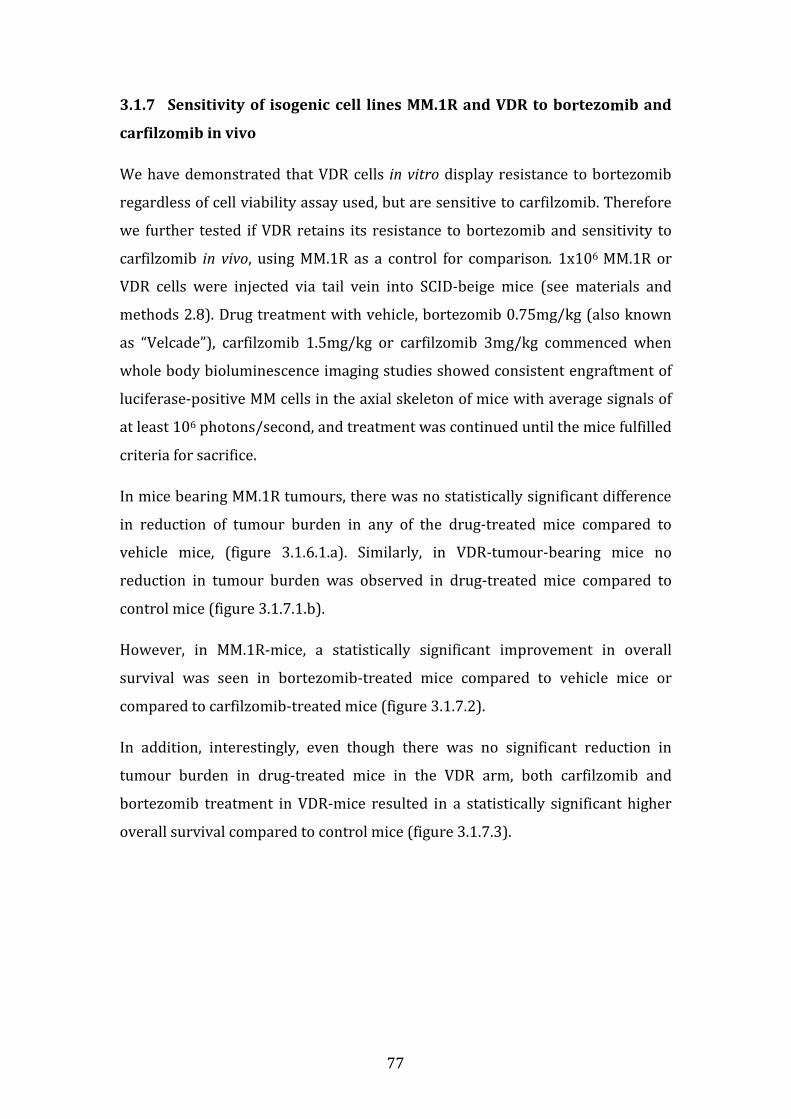
77
3.1.7 Sensitivity of isogenic cell lines MM.1R and VDR to bortezomib and
carfilzomib in vivo
We have demonstrated that VDR cells in vitro display resistance to bortezomib
regardless of cell viability assay used, but are sensitive to carfilzomib. Therefore
we further tested if VDR retains its resistance to bortezomib and sensitivity to
carfilzomib in vivo, using MM.1R as a control for comparison. 1x10⁶ MM.1R or
VDR cells were injected via tail vein into SCID-beige mice (see materials and
methods 2.8). Drug treatment with vehicle, bortezomib 0.75mg/kg (also known
as “Velcade”), carfilzomib 1.5mg/kg or carfilzomib 3mg/kg commenced when
whole body bioluminescence imaging studies showed consistent engraftment of
luciferase-positive MM cells in the axial skeleton of mice with average signals of
at least 106 photons/second, and treatment was continued until the mice fulfilled
criteria for sacrifice.
In mice bearing MM.1R tumours, there was no statistically significant difference
in reduction of tumour burden in any of the drug-treated mice compared to
vehicle mice, (figure 3.1.6.1.a). Similarly, in VDR-tumour-bearing mice no
reduction in tumour burden was observed in drug-treated mice compared to
control mice (figure 3.1.7.1.b).
However, in MM.1R-mice, a statistically significant improvement in overall
survival was seen in bortezomib-treated mice compared to vehicle mice or
compared to carfilzomib-treated mice (figure 3.1.7.2).
In addition, interestingly, even though there was no significant reduction in
tumour burden in drug-treated mice in the VDR arm, both carfilzomib and
bortezomib treatment in VDR-mice resulted in a statistically significant higher
overall survival compared to control mice (figure 3.1.7.3).
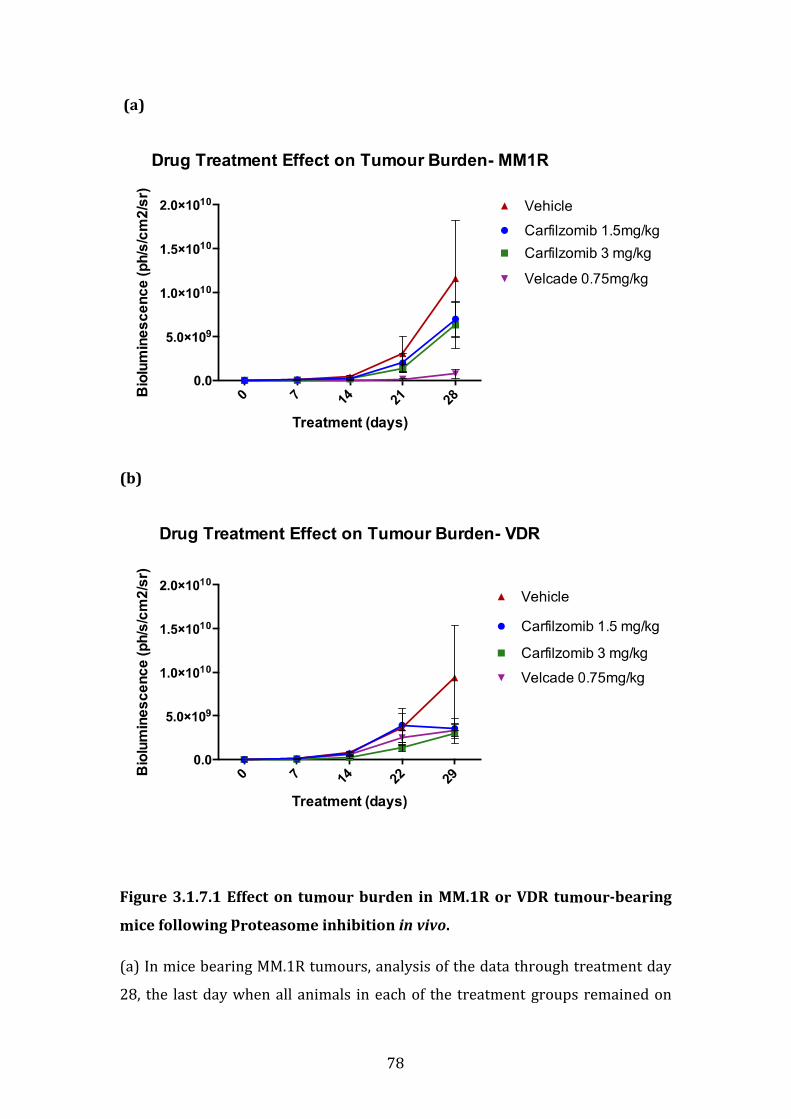
78
(a)
(b)
Figure 3.1.7.1 Effect on tumour burden in MM.1R or VDR tumour-bearing
mice following proteasome inhibition in vivo.
(a) In mice bearing MM.1R tumours, analysis of the data through treatment day
28, the last day when all animals in each of the treatment groups remained on

79
study, using Tukey’s multiple comparison test indicates that none of the groups
are statistically significantly different from each other.
(b) In mice bearing VDR tumours, analysis of the data through day 29, the last
day when all animals in each of the treatment groups remained on study, using
Turkey’s multiple comparison test indicates that none of the groups are
statistically significantly different from each other.
(Note: Velcade= bortezomib)

80
(a)
Overall p-value: 0.0006 (Log-rank test). P values for pairwise comparisons are:
MM1R Velcade Carfilzomib 1.5mg/kg Carfilzomib 3mg/kg
Vehicle 0.0048 0.1525 0.6929
Carfilzomib 1.5mg/kg 0.0006
Carfilzomib 3mg/kg 0.0048 0.0702
Figure 3.1.7.2 Survival of MM.1R-tumour-bearing mice.
While there was no statistically significant difference in tumour volume among
the treatment groups through treatment day 28, the Velcade/bortezomib group
had significantly prolonged survival compared to all other groups.
Percen
t su
rviv
al
81
Overall p-value: 0.0006 (Log-rank test). P values for pairwise comparisons are:
MM1VDR Velcade Carfilzomib 1.5mg/kg Carfilzomib 3mg/kg
Vehicle 0.0004 0.0086 0.0063
Carfilzomib 1.5mg/kg 0.4621
Carfilzomib 3mg/kg 0.5516 0.2661
Figure 3.1.7.3 Survival of VDR-tumour-bearing mice.
While there was no statistically significant difference in tumour volume among
the treatment groups through treatment day 29, all three drug-treated groups
had significantly prolonged survival compared to the Vehicle group. (Note:
Velcade= bortezomib)

82
3.1.8 Summary of in vitro and in vivo studies
In conclusion, VDR demonstrated marked resistance to bortezomib in the in vitro
setting compared to MM.1R, in a number of toxicological in vitro assays tested.
VDR retained its resistance to dexamethasone in vitro, similar to parental MM.1R.
MM.1R and VDR displayed comparable toxicity in a number of conventional and
novel therapies examined. Both MM.1R and VDR were more resistant to the
HDAC inhibitor vorinostat compared to bortezomib-and-dexamethasone-
sensitive MM.1S.
High-throughput screen of a database of compounds with FDA-approval for use
in oncology demonstrated that VDR has marked sensitivity to the taxanes and
topoisomerase-1 and -2 inhibitors. VDR is highly sensitive to the irreversible
proteasome inhibitor carfilzomib but is resistant to another PSMB5-specific
proteasome inhibitor MLN2238 in vitro.
Bortezomib resistance in VDR did not appear to be mediated by p-glycoprotein.
No difference in proliferation rate between MM.1R and VDR was observed, thus
proliferation rate does cannot be accountable for the resistance observed.
Finally, an in vivo study examining the effect of bortezomib or carfilzomib in
MM.1R or VDR did not reveal a statistically significant reduction in tumour
burden in either cell lines for any drug treatment or schedule used compared to
vehicle mice. However in MM.1R-mice, a statistically significant overall survival
was observed in bortezomib treated mice compared to controls and compared to
carfilzomib treated mice. In addition, VDR mice displayed a statistically
significant improvement in overall survival in both bortezomib treated and
carfilzomib treated mice compared to vehicle treated mice.
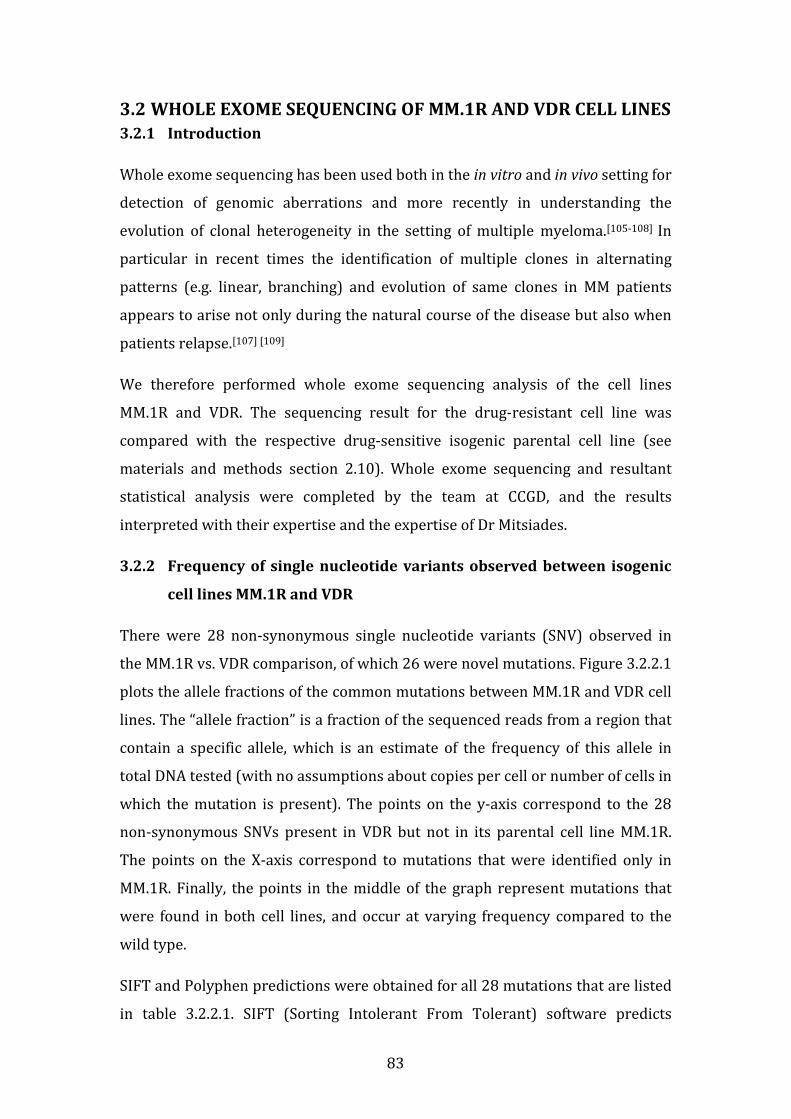
83
3.2 WHOLE EXOME SEQUENCING OF MM.1R AND VDR CELL LINES
3.2.1 Introduction
Whole exome sequencing has been used both in the in vitro and in vivo setting for
detection of genomic aberrations and more recently in understanding the
evolution of clonal heterogeneity in the setting of multiple myeloma.[105-108] In
particular in recent times the identification of multiple clones in alternating
patterns (e.g. linear, branching) and evolution of same clones in MM patients
appears to arise not only during the natural course of the disease but also when
patients relapse.[107] [109]
We therefore performed whole exome sequencing analysis of the cell lines
MM.1R and VDR. The sequencing result for the drug-resistant cell line was
compared with the respective drug-sensitive isogenic parental cell line (see
materials and methods section 2.10). Whole exome sequencing and resultant
statistical analysis were completed by the team at CCGD, and the results
interpreted with their expertise and the expertise of Dr Mitsiades.
3.2.2 Frequency of single nucleotide variants observed between isogenic
cell lines MM.1R and VDR
There were 28 non-synonymous single nucleotide variants (SNV) observed in
the MM.1R vs. VDR comparison, of which 26 were novel mutations. Figure 3.2.2.1
plots the allele fractions of the common mutations between MM.1R and VDR cell
lines. The “allele fraction” is a fraction of the sequenced reads from a region that
contain a specific allele, which is an estimate of the frequency of this allele in
total DNA tested (with no assumptions about copies per cell or number of cells in
which the mutation is present). The points on the y-axis correspond to the 28
non-synonymous SNVs present in VDR but not in its parental cell line MM.1R.
The points on the X-axis correspond to mutations that were identified only in
MM.1R. Finally, the points in the middle of the graph represent mutations that
were found in both cell lines, and occur at varying frequency compared to the
wild type.
SIFT and Polyphen predictions were obtained for all 28 mutations that are listed
in table 3.2.2.1. SIFT (Sorting Intolerant From Tolerant) software predicts
84
whether an amino acid substitution is likely to affect protein function based on
sequence homology and the physico-chemical similarity between the alternate
amino acids. The data provided for each amino acid substitution gives a
qualitative prediction (either 'tolerated' or 'damaging').[110] Polyphen-2 is a tool
that predicts possible impact of an amino acid substitution on the structure and
function of a human protein using physical and comparative considerations.[111]
Of the 28 SNVs detected in VDR but not MM.1R, 7 SNVs were found to be
“damaging” by both algorithms, 6 SNVs were found to be “damaging” by one of
the algorithms, and the remaining 15 SNVs were found to be “tolerated” by one
or both of the algorithms.
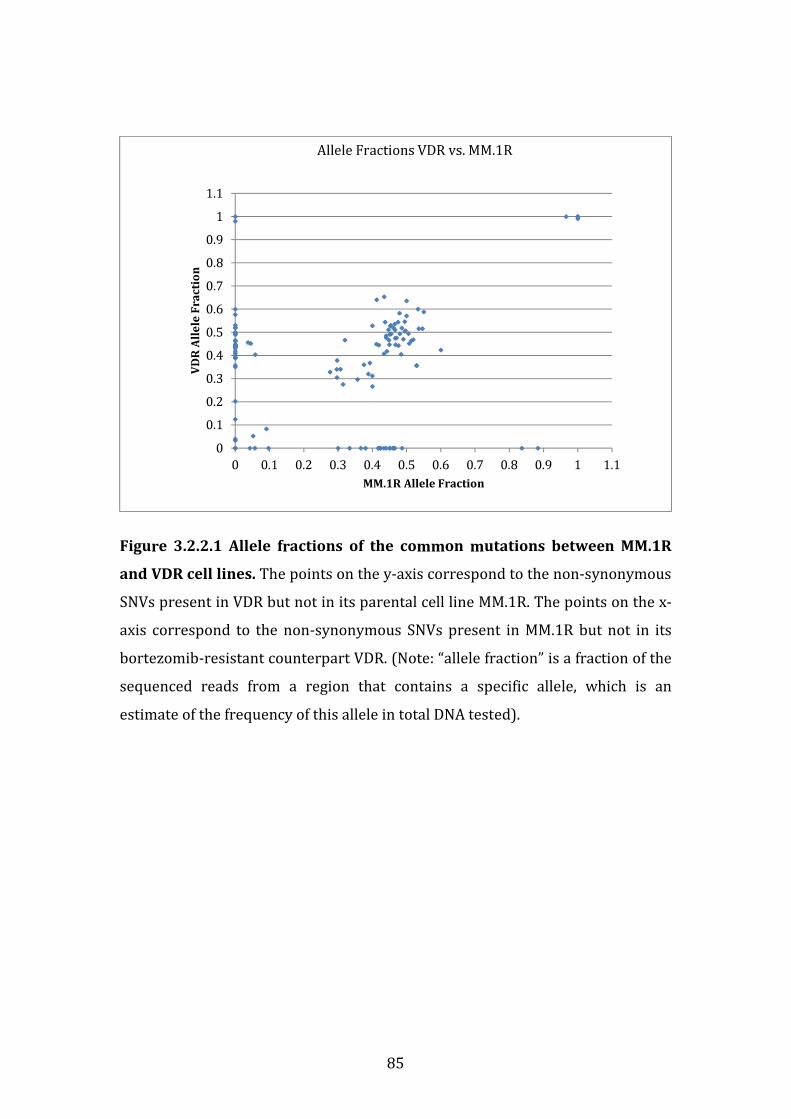
85
Figure 3.2.2.1 Allele fractions of the common mutations between MM.1R
and VDR cell lines. The points on the y-axis correspond to the non-synonymous
SNVs present in VDR but not in its parental cell line MM.1R. The points on the x-
axis correspond to the non-synonymous SNVs present in MM.1R but not in its
bortezomib-resistant counterpart VDR. (Note: “allele fraction” is a fraction of the
sequenced reads from a region that contains a specific allele, which is an
estimate of the frequency of this allele in total DNA tested).
0
0.1
0.2
0.3
0.4
0.5
0.6
0.7
0.8
0.9
1
1.1
0 0.1 0.2 0.3 0.4 0.5 0.6 0.7 0.8 0.9 1 1.1
VD
R A
lle
le F
ra
ctio
n
MM.1R Allele Fraction
Allele Fractions VDR vs. MM.1R

86
GENE CHR POSITION AA CHANGE CODON_CHANGE
SPARCL1 4 g.88415159T>A p.N265Y c.(793-795)AAC>TAC
ZER1 9 g.131503072G>T p.S611Y c.(1831-1833)TCC>TAC
TPH2 12 g.72366351G>T p.G221C c.(661-663)GGT>TGT
MFGE8 15 g.89444941C>A p.K237N c.(709-711)AAG>AAT
CCDC113 16 g.58292291A>T p.E137V c.(409-411)GAA>GTA
FAM59A 18 g.29890224C>G p.V109L c.(325-327)GTG>CTG
ATP5J 21 g.27102074G>A p.S11F c.(31-33)TCT>TTT
TTLL1 22 g.43447822C>A p.K321N c.(961-963)AAG>AAT
SARS 1 g.109756659C>A p.D15E c.(43-45)GAC>GAA
H2AFV 7 g.44874131A>G p.I119T c.(355-357)ATT>ACT
ROD1 9 g.114982551G>T - -
MKL2 16 g.14312805C>G p.P215A c.(643-645)CCA>GCA
PSMB5 14 g.23502844T>C p.T80A c.(238-240)ACA>GCA
KCNN3 1 g.154698487C>A p.A536S c.(1606-1608)GCC>TCC
TAF5L 1 g.229750100C>T p.A44T c.(130-132)GCC>ACC
SEMA4F 2 g.74907071G>A p.R683H c.(2047-2049)CGT>CAT
SLC6A18 5 g.1242940C>T p.P365S c.(1093-1095)CCC>TCC
GCM2 6 g.10876129A>G p.S193P c.(577-579)TCC>CCC
COL9A1 6 g.70992692C>T - -
H2AFV 7 g.44874113T>C p.Q125R c.(373-375)CAG>CGG
ZER1 9 g.131503073A>G p.S611P c.(1831-1833)TCC>CCC
CDK2 12 g.56365357C>A p.A282D c.(844-846)GCT>GAT
NCOR2 12 g.124856844T>C p.K844R c.(2530-2532)AAG>AGG
C14orf177 14 g.99183598T>C p.M122T c.(364-366)ATG>ACG
STAC2 17 g.37374251G>T p.A89D c.(265-267)GCT>GAT
ITGB4 17 g.73745009G>A p.V1067I c.(3199-3201)GTT>ATT
TMC6 17 g.76118778G>A p.H379Y c.(1135-1137)CAC>TAC
ZNF579 19 g.56090288C>T p.A240T c.(718-720)GCC>ACC
Table 3.2.2.1 Single nucleotide variants found in VDR but not MM.1R
List of gene mutations identified in bortezomib resistant VDR but not
bortezomib sensitive MM.1R. SIFT and Polyphen predictions were obtained for
all 28 mutations listed in table 3.2.2.1. Of these, 7 SNVs were found to be
damaging by both algorithms (blue), 6 SNVs were found to be damaging by one
of the algorithms (red), and the remaining 15 SNVs were found to be tolerated by
one or both of the algorithms (green).
87
3.2.3 Insertions and deletions identified in VDR vs. MM.1R
Besides SNVs, 1 deletion was identified in VDR cell line using Indel Locator
(https://confluence.broadinstitute.org/display/CGATools/Indelocator), when
comparing MM.1R and VDR. No insertions were identified between the MM.1R
and VDR comparisons. One deletion was identified in VDR in ABCA7 gene, i.e.
ATP-binding cassette sub-family A member 7 gene however, that was not
present in MM.1R (table 3.2.3.1).
The ABCA7 gene belongs to a superfamily of ABC (ATP-binding cassette)
transporters. The protein products of ABC genes are responsible for transporting
numerous substances across cell membranes (both intra- and extra-cellularly).
There are 7 ABC subfamilies, of which ABCA7 belongs to the ABC1 subfamily.
The ABCA7 protein is expressed at the highest level in peripheral leucocytes,
thymus gland, bone marrow and splenic tissue. Kaminski et al first described
ABCA7 in 2000 when its role in lipid transport across macrophage membranes
was elucidated.[112]
In 2012 Meurs et al investigated the effect of macrophage ABCA7 knockdown in
mice to determine its role in atherosclerosis, given its known involvement in
lipid transport. While they did not find a correlation between ABCA7 knockdown
and atherosclerosis in the mice, they revealed that concomitant knockdown of
ABCA7 and ABCA1 (the promoter of initiating step in cholesterol transport)
resulted in massive splenomegaly due to cellular fat accumulation, down-
regulation of number of CD3+ T cells, and promoted erythropoietic regulators.
Their data suggested that ABCA7 might be involved in splenic proliferation of T
cells and erythrocytes.[113]
In relation to its potential role in cancer pathogenesis, in a cohort of 51 patients
with colorectal cancer, a correlation between reduced transcript levels of ABCA7
gene and shortening of disease free interval following treatment has been
established (p=0.033, log rank test).[114] However neither ABCA7 gene down-
regulation nor deletion in this gene have been implicated in haematological
malignancy in the in vivo setting to date.
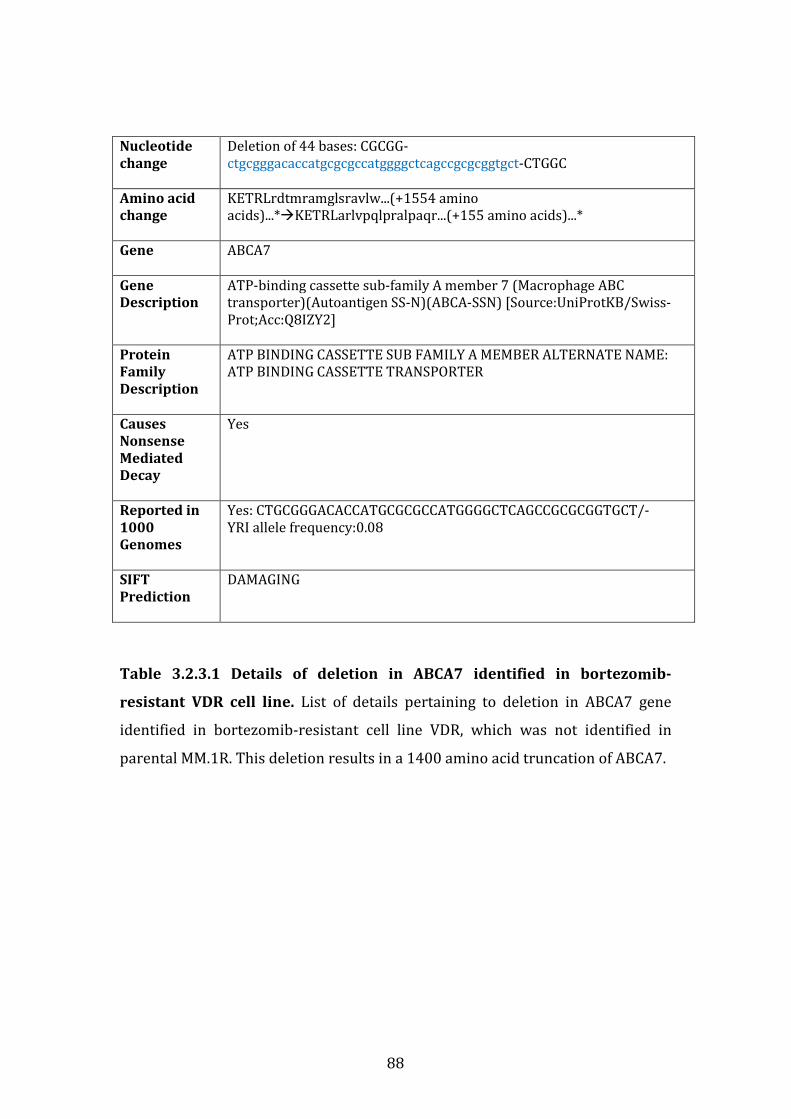
88
Nucleotide
change
Deletion of 44 bases: CGCGG-
ctgcgggacaccatgcgcgccatggggctcagccgcgcggtgct-CTGGC
Amino acid
change
KETRLrdtmramglsravlw...(+1554 amino
acids)...*�KETRLarlvpqlpralpaqr...(+155 amino acids)...*
Gene ABCA7
Gene
Description
ATP-binding cassette sub-family A member 7 (Macrophage ABC
transporter)(Autoantigen SS-N)(ABCA-SSN) [Source:UniProtKB/Swiss-
Prot;Acc:Q8IZY2]
Protein
Family
Description
ATP BINDING CASSETTE SUB FAMILY A MEMBER ALTERNATE NAME:
ATP BINDING CASSETTE TRANSPORTER
Causes
Nonsense
Mediated
Decay
Yes
Reported in
1000
Genomes
Yes: CTGCGGGACACCATGCGCGCCATGGGGCTCAGCCGCGCGGTGCT/-
YRI allele frequency:0.08
SIFT
Prediction
DAMAGING
Table 3.2.3.1 Details of deletion in ABCA7 identified in bortezomib-
resistant VDR cell line. List of details pertaining to deletion in ABCA7 gene
identified in bortezomib-resistant cell line VDR, which was not identified in
parental MM.1R. This deletion results in a 1400 amino acid truncation of ABCA7.
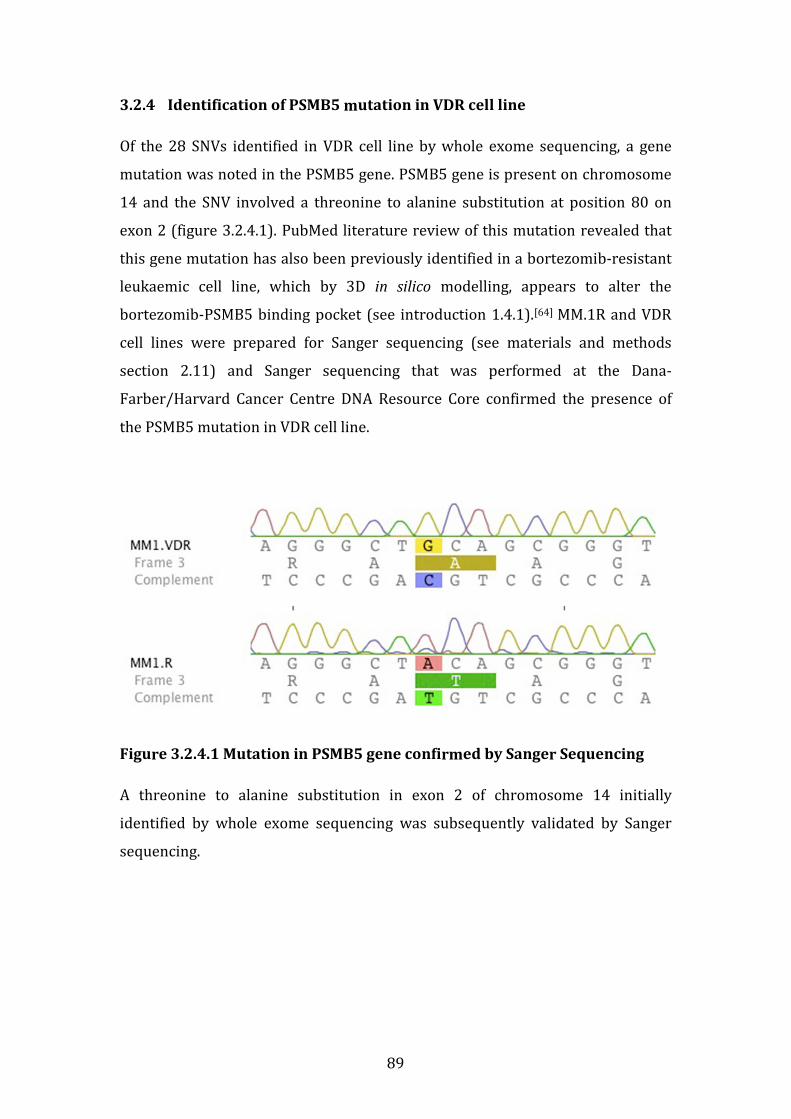
89
3.2.4 Identification of PSMB5 mutation in VDR cell line
Of the 28 SNVs identified in VDR cell line by whole exome sequencing, a gene
mutation was noted in the PSMB5 gene. PSMB5 gene is present on chromosome
14 and the SNV involved a threonine to alanine substitution at position 80 on
exon 2 (figure 3.2.4.1). PubMed literature review of this mutation revealed that
this gene mutation has also been previously identified in a bortezomib-resistant
leukaemic cell line, which by 3D in silico modelling, appears to alter the
bortezomib-PSMB5 binding pocket (see introduction 1.4.1).[64] MM.1R and VDR
cell lines were prepared for Sanger sequencing (see materials and methods
section 2.11) and Sanger sequencing that was performed at the Dana-
Farber/Harvard Cancer Centre DNA Resource Core confirmed the presence of
the PSMB5 mutation in VDR cell line.
Figure 3.2.4.1 Mutation in PSMB5 gene confirmed by Sanger Sequencing
A threonine to alanine substitution in exon 2 of chromosome 14 initially
identified by whole exome sequencing was subsequently validated by Sanger
sequencing.

90
3.2.5 Sensitivity of KMS11 cell line to bortezomib following lentiviral
infection with mutPSMB5
Next to determine the potential functional significance of the PSMB5 mutation
identified in VDR cell line, we undertook lentiviral infection of mutPSMB5 into
bortezomib-sensitive cell lines, to ascertain if over-expression of mutPSMB5 in
bortezomib sensitive cell lines rendered them resistant to bortezomib.
We undertook mutPSMB5 lentiviral infection into bortezomib-sensitive cell line
KMS11 (see materials and methods section 2.14) to ascertain if over-expression
of mutPSMB5 in a bortezomib sensitive cell line could result in altered sensitivity
of this cell line to bortezomib. KMS11 cells were infected with a control (BFP)
lentivirus, wt-PSMB5 (wild-type), and mutPSMB5, and subsequently treated with
bortezomib. We observed a modest reduction in sensitivity of KMS11 cells
infected with wtPSMB5 to bortezomib, however an even greater degree of
reduction in sensitivity to bortezomib was observed when KMS11 was infected
with mutPSMB5 (figure 3.2.5.1).
A trial of infection of both MM.1S and MM.1R cell lines was conducted on 2
separate occasions; however due to exquisite sensitivity of these cell lines to
blasticidin and their semi-adherent nature, lentiviral infection was unsuccessful.
In conclusion, our data suggest that over-expression of mutPSMB5 in KMS11 cell
line causes a marked reduction in sensitivity to bortezomib compared to KMS11
infected with BFP-control lentivirus.
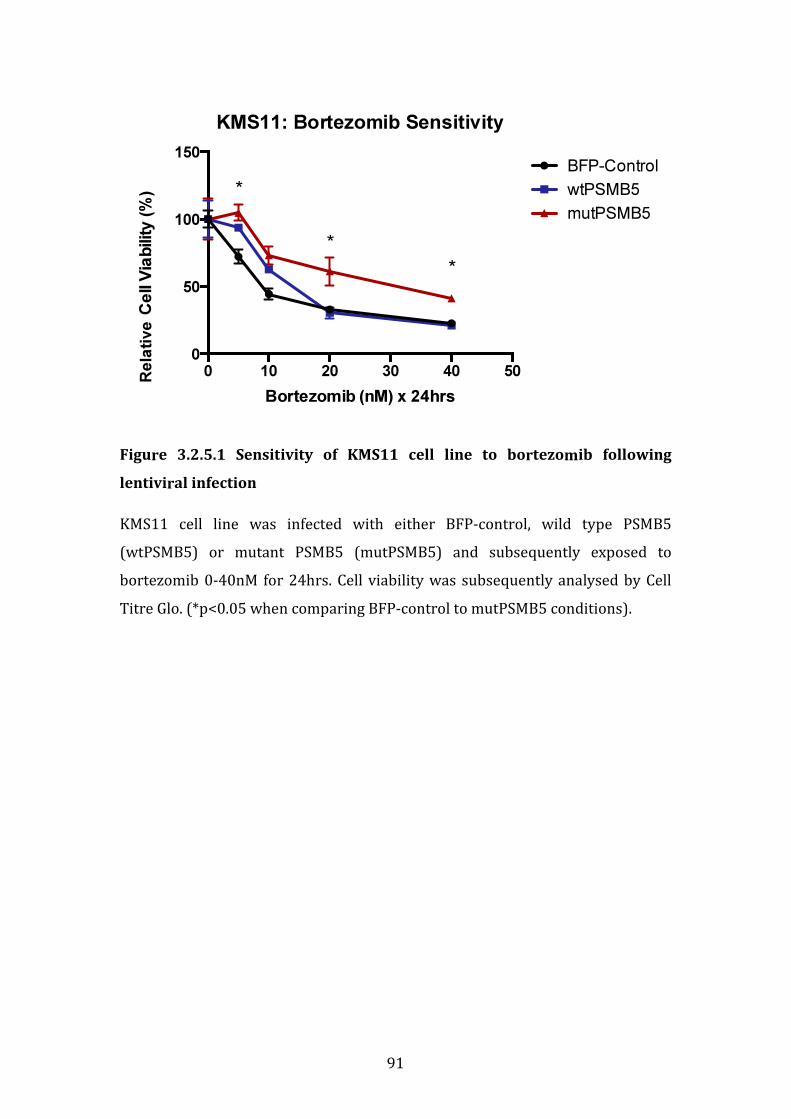
91
Figure 3.2.5.1 Sensitivity of KMS11 cell line to bortezomib following
lentiviral infection
KMS11 cell line was infected with either BFP-control, wild type PSMB5
(wtPSMB5) or mutant PSMB5 (mutPSMB5) and subsequently exposed to
bortezomib 0-40nM for 24hrs. Cell viability was subsequently analysed by Cell
Titre Glo. (*p<0.05 when comparing BFP-control to mutPSMB5 conditions).
KMS11: Bortezomib Sensitivity
Bortezomib (nM) x 24hrs
Ce
ll V
iab
ilit
y (
%)
0 10 20 30 40 50
0
50
100
150BFP-Control
wtPSMB5
mutPSMB5
*
*
*
Rela
tive
92
3.2.6 Summary of whole exome sequencing study
We performed whole exome sequencing analysis of the cell lines MM.1R and VDR
to determine SNVs, insertions or deletions that were present in bortezomib
resistant VDR but not bortezomib-sensitive MM.1R cell line. 28 non-synonymous
single nucleotide variants (SNV) were detected in VDR that were not present in
MM.1R, of which 26 were novel mutations. SIFT and Polyphen predictions found
7 SNVs to be “damaging” by both algorithms and 6 SNVs were found to be
“damaging” by either SIFT or Polyphen algorithms.
A deletion in ABCA7 gene was found in VDR but not MM.1R. The ABCA7 gene
belongs to a superfamily of ABC (ATP-binding cassette) transporters. ABCA7
protein is expressed at the highest level in peripheral leucocytes, thymus gland,
bone marrow and splenic tissue. In 2012 Meurs et al outlined that concomitant
knockdown of ABCA7 and ABCA1 resulted in massive splenomegaly in mice due
to cellular fat accumulation, down-regulation of number of CD3+ T cells, and
promoted erythropoietic regulators, suggesting that ABCA7 may be involved in
splenic proliferation of T cells and erythrocytes.[113] In a cohort of 51 patients
with colorectal cancer, reduced transcript levels of ABCA7 gene has been
correlated with shortening of disease free interval in patients with colorectal
cancer following treatment (p=0.033, log rank test).[114] However neither ABCA7
gene down-regulation nor deletion in this gene have been implicated in
haematological malignancy in the in vivo setting to date. Of note, no insertions
were identified between the MM.1R and VDR comparisons.
Of the 28 SNVs identified in VDR cell line by whole exome sequencing, a gene
mutation was noted in the PSMB5 gene involving a threonine to alanine
substitution at position 80 on exon 2. This mutation has been previously
described in a bortezomib-resistant leukaemic cell line model, and 3D in silico
modelling of the mutation appears to alter the bortezomib-PSMB5 binding
pocket.[64] We thus next undertook lentiviral infection of mutPSMB5 into
bortezomib-sensitive cell line KMS11, to ascertain if over-expression of
mutPSMB5 in KMS11 rendered these cells resistant to bortezomib. We observed
a degree of reduction in sensitivity of KMS11 cells infected with wtPSMB5 to

93
bortezomib, however an even greater degree of reduction in sensitivity to
bortezomib was observed when KMS11 was infected with mutPSMB5
In conclusion, our whole exome sequencing results revealed a number of novel
SNVs; a deletion of ABCA7 gene whose role in haematological malignancies in the
in vivo setting is yet to be investigated; and finally that reintroduction of
mutPSMB5 into bortezomib-sensitive KMS11 appears to cause a marked
reduction in sensitivity of this cell line to bortezomib. The latter finding suggests
that mutPSMB5 may play a role in bortezomib resistance in the in vitro setting.
94
3.3 GENE EXPRESSION PROFILING OF MM.1R AND VDR
3.3.1 Introduction
In order to determine the transcriptional profiles of the bortezomib sensitive
(MM.1R) and bortezomib resistant (VDR) cell lines, each was cultured in 4
biological replicates at 37°C at a density of 10x 106 cells per condition for 24
hours, then the cells were collected at 4°C. RNA was extracted using miRNeasy
Mini Kit (# 217004) as per protocol, and this was stored at -20°C. Affymetrix
oligonucleotide arrays were undertaken at Beth Israel Deaconess Medical Centre
Core Genomic Facility using GeneChip Human Gene 1.0 ST Whole Genome
Cartridge Gene Arrays (catalogue # 901085), (see materials and methods section
2.12).
In total, 20,724 genes were compared between MM1R and VDR cell lines. Genes
from this list were filtered to include only those whereby the difference in fold
change between the two conditions was >1.2 and demonstrated a p value ≤ 0.01,
of which 437 transcripts fulfilled these criteria. Of these transcripts, 353 were
over-expressed in VDR compared to MM.1R. In comparison only 84 genes were
down regulated in VDR compared to MM.1R. The reason for this difference
between number of genes up-regulated versus down-regulated is unclear.
Subsequently a number of target transcripts of interest were chosen for shRNA
knockdown studies. Briefly, transcripts of particular interest underwent shRNA
knockdown and subsequent treatment with bortezomib to determine which
genes, following their shRNA knockdown, resulted in resensitisation of VDR cells
to bortezomib. PSMB5 transcript was subsequently selected for validation
studies, given the fact that bortezomib inhibits the proteasome mainly via
PSMB5.

95
3.3.2 Transcripts over-expressed in VDR compared to MM.1R
By applying the aforementioned cut-off criteria of a fold change >1.2 and an p
value ≤ 0.01, 353 transcripts were found to be over-expressed in bortezomib-
resistant cell line VDR compared to its bortezomib-sensitive parental cell line
MM.1R, see table 3.3.2.1.
DAVID functional annotation tool (http://david.abcc.ncifcrf.gov/) was utilised to
determine in which cellular processes transcripts up-regulated in VDR compared
to MM.1R are involved, whereby adjusted p value ≤0.05 (here p value correlates
with strength of association of gene to named cellular process); fold change
between control and experimental genes in a given process was ≥1.2; and the
“percentage of genes” equals the total number of genes over-expressed in VDR
vs. MM.1R that are involved in a specific pathway. Table 3.3.2.2 reveals all
cellular processes in which genes over-expressed in VDR compared to MM.1R
are involved. Table 3.3.2.3 lists specific genes over-expressed in VDR involved in
7 separate cellular processes, whereby at least 27 of a total 353 transcripts up-
regulated in VDR play a role in each pathway listed.
Pathway analysis again via DAVID functional annotation tool revealed “cellular
apoptosis” as a specific pathway in which 4 transcripts up-regulated in VDR play
a role. These genes include CFLAR (CASP8 and FADD-like apoptosis regulator),
caspase-8 (CASP8, apoptosis-related cysteine peptidase), caspase-10 (CASP10,
apoptosis-related cysteine peptidase) and NFKBIA (nuclear factor of kappa light
polypeptide gene enhancer in B-cells inhibitor, alpha), (figure 3.3.2.1). Again p
value equals ≤0.05 for strength of association of each specific gene to cellular
apoptosis.
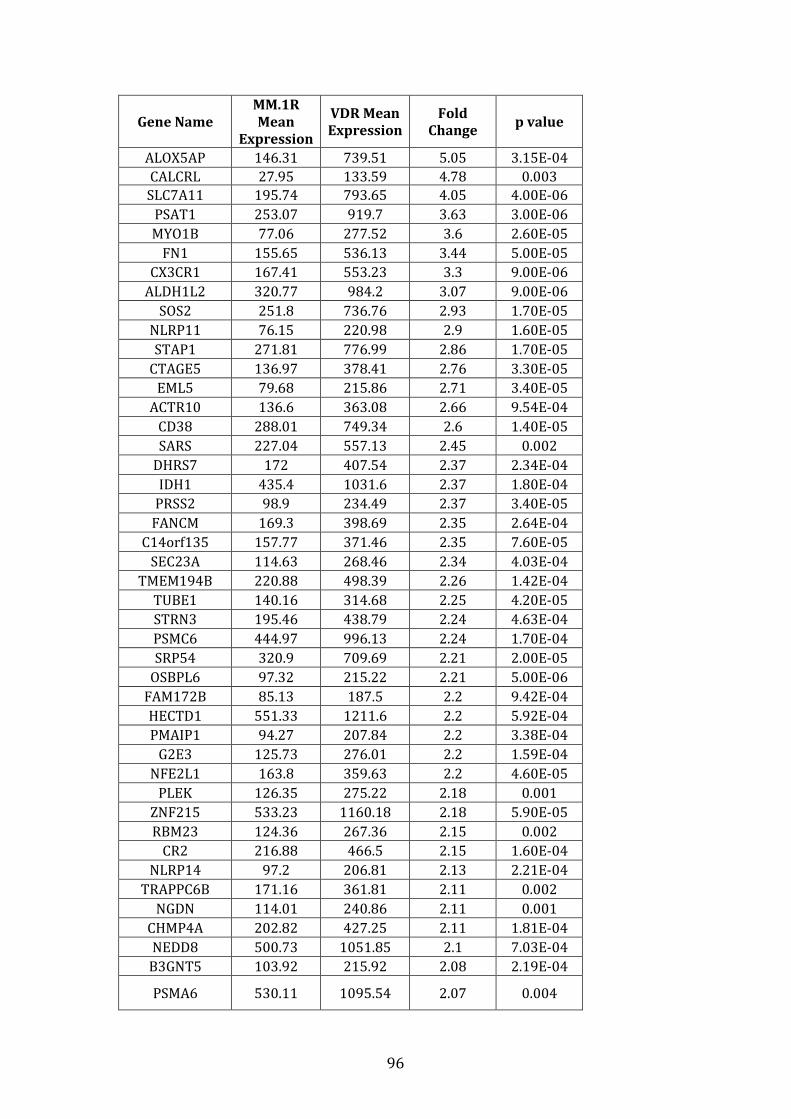
96
Gene Name
MM.1R
Mean
Expression
VDR Mean
Expression
Fold
Change p value
ALOX5AP 146.31 739.51 5.05 3.15E-04
CALCRL 27.95 133.59 4.78 0.003
SLC7A11 195.74 793.65 4.05 4.00E-06
PSAT1 253.07 919.7 3.63 3.00E-06
MYO1B 77.06 277.52 3.6 2.60E-05
FN1 155.65 536.13 3.44 5.00E-05
CX3CR1 167.41 553.23 3.3 9.00E-06
ALDH1L2 320.77 984.2 3.07 9.00E-06
SOS2 251.8 736.76 2.93 1.70E-05
NLRP11 76.15 220.98 2.9 1.60E-05
STAP1 271.81 776.99 2.86 1.70E-05
CTAGE5 136.97 378.41 2.76 3.30E-05
EML5 79.68 215.86 2.71 3.40E-05
ACTR10 136.6 363.08 2.66 9.54E-04
CD38 288.01 749.34 2.6 1.40E-05
SARS 227.04 557.13 2.45 0.002
DHRS7 172 407.54 2.37 2.34E-04
IDH1 435.4 1031.6 2.37 1.80E-04
PRSS2 98.9 234.49 2.37 3.40E-05
FANCM 169.3 398.69 2.35 2.64E-04
C14orf135 157.77 371.46 2.35 7.60E-05
SEC23A 114.63 268.46 2.34 4.03E-04
TMEM194B 220.88 498.39 2.26 1.42E-04
TUBE1 140.16 314.68 2.25 4.20E-05
STRN3 195.46 438.79 2.24 4.63E-04
PSMC6 444.97 996.13 2.24 1.70E-04
SRP54 320.9 709.69 2.21 2.00E-05
OSBPL6 97.32 215.22 2.21 5.00E-06
FAM172B 85.13 187.5 2.2 9.42E-04
HECTD1 551.33 1211.6 2.2 5.92E-04
PMAIP1 94.27 207.84 2.2 3.38E-04
G2E3 125.73 276.01 2.2 1.59E-04
NFE2L1 163.8 359.63 2.2 4.60E-05
PLEK 126.35 275.22 2.18 0.001
ZNF215 533.23 1160.18 2.18 5.90E-05
RBM23 124.36 267.36 2.15 0.002
CR2 216.88 466.5 2.15 1.60E-04
NLRP14 97.2 206.81 2.13 2.21E-04
TRAPPC6B 171.16 361.81 2.11 0.002
NGDN 114.01 240.86 2.11 0.001
CHMP4A 202.82 427.25 2.11 1.81E-04
NEDD8 500.73 1051.85 2.1 7.03E-04
B3GNT5 103.92 215.92 2.08 2.19E-04
PSMA6 530.11 1095.54 2.07 0.004
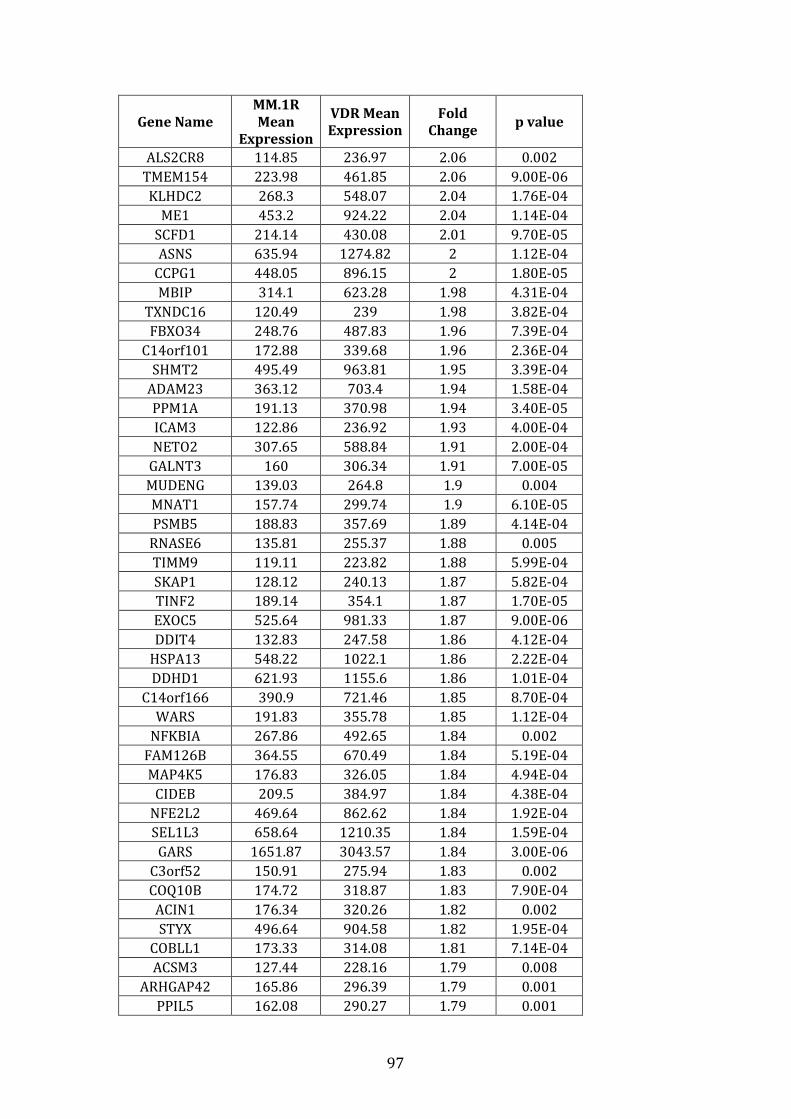
97
Gene Name
MM.1R
Mean
Expression
VDR Mean
Expression
Fold
Change p value
ALS2CR8 114.85 236.97 2.06 0.002
TMEM154 223.98 461.85 2.06 9.00E-06
KLHDC2 268.3 548.07 2.04 1.76E-04
ME1 453.2 924.22 2.04 1.14E-04
SCFD1 214.14 430.08 2.01 9.70E-05
ASNS 635.94 1274.82 2 1.12E-04
CCPG1 448.05 896.15 2 1.80E-05
MBIP 314.1 623.28 1.98 4.31E-04
TXNDC16 120.49 239 1.98 3.82E-04
FBXO34 248.76 487.83 1.96 7.39E-04
C14orf101 172.88 339.68 1.96 2.36E-04
SHMT2 495.49 963.81 1.95 3.39E-04
ADAM23 363.12 703.4 1.94 1.58E-04
PPM1A 191.13 370.98 1.94 3.40E-05
ICAM3 122.86 236.92 1.93 4.00E-04
NETO2 307.65 588.84 1.91 2.00E-04
GALNT3 160 306.34 1.91 7.00E-05
MUDENG 139.03 264.8 1.9 0.004
MNAT1 157.74 299.74 1.9 6.10E-05
PSMB5 188.83 357.69 1.89 4.14E-04
RNASE6 135.81 255.37 1.88 0.005
TIMM9 119.11 223.82 1.88 5.99E-04
SKAP1 128.12 240.13 1.87 5.82E-04
TINF2 189.14 354.1 1.87 1.70E-05
EXOC5 525.64 981.33 1.87 9.00E-06
DDIT4 132.83 247.58 1.86 4.12E-04
HSPA13 548.22 1022.1 1.86 2.22E-04
DDHD1 621.93 1155.6 1.86 1.01E-04
C14orf166 390.9 721.46 1.85 8.70E-04
WARS 191.83 355.78 1.85 1.12E-04
NFKBIA 267.86 492.65 1.84 0.002
FAM126B 364.55 670.49 1.84 5.19E-04
MAP4K5 176.83 326.05 1.84 4.94E-04
CIDEB 209.5 384.97 1.84 4.38E-04
NFE2L2 469.64 862.62 1.84 1.92E-04
SEL1L3 658.64 1210.35 1.84 1.59E-04
GARS 1651.87 3043.57 1.84 3.00E-06
C3orf52 150.91 275.94 1.83 0.002
COQ10B 174.72 318.87 1.83 7.90E-04
ACIN1 176.34 320.26 1.82 0.002
STYX 496.64 904.58 1.82 1.95E-04
COBLL1 173.33 314.08 1.81 7.14E-04
ACSM3 127.44 228.16 1.79 0.008
ARHGAP42 165.86 296.39 1.79 0.001
PPIL5 162.08 290.27 1.79 0.001
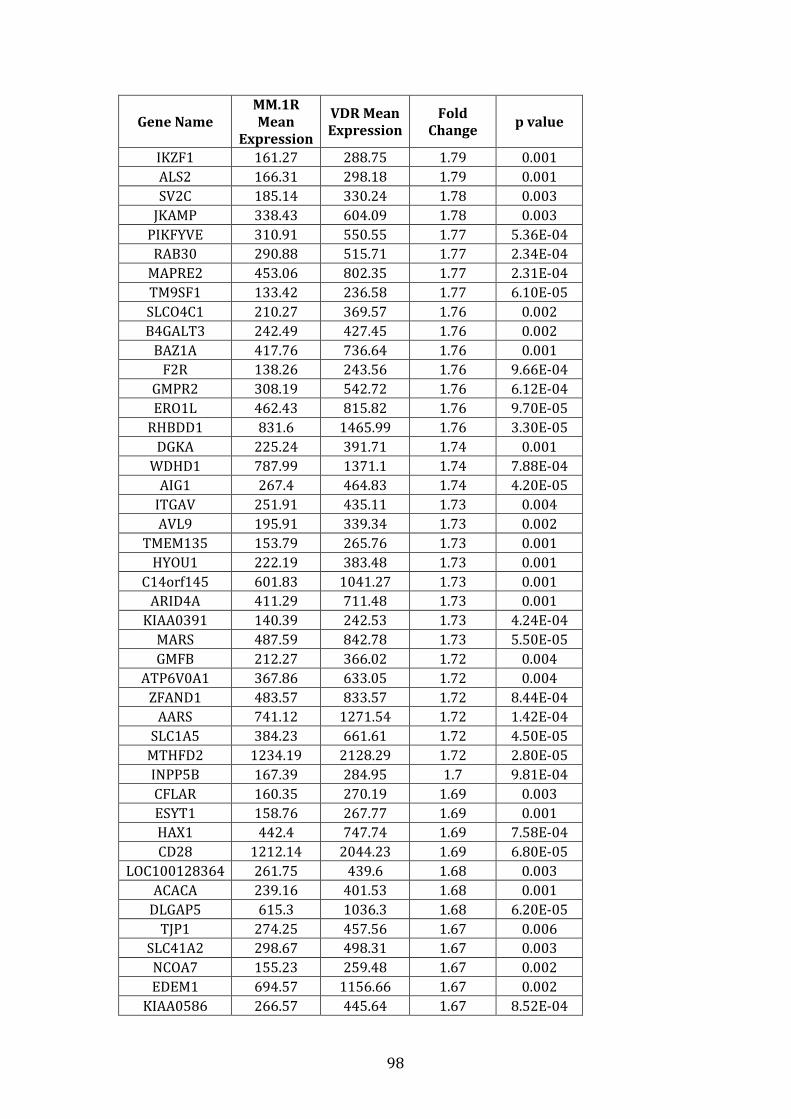
98
Gene Name
MM.1R
Mean
Expression
VDR Mean
Expression
Fold
Change p value
IKZF1 161.27 288.75 1.79 0.001
ALS2 166.31 298.18 1.79 0.001
SV2C 185.14 330.24 1.78 0.003
JKAMP 338.43 604.09 1.78 0.003
PIKFYVE 310.91 550.55 1.77 5.36E-04
RAB30 290.88 515.71 1.77 2.34E-04
MAPRE2 453.06 802.35 1.77 2.31E-04
TM9SF1 133.42 236.58 1.77 6.10E-05
SLCO4C1 210.27 369.57 1.76 0.002
B4GALT3 242.49 427.45 1.76 0.002
BAZ1A 417.76 736.64 1.76 0.001
F2R 138.26 243.56 1.76 9.66E-04
GMPR2 308.19 542.72 1.76 6.12E-04
ERO1L 462.43 815.82 1.76 9.70E-05
RHBDD1 831.6 1465.99 1.76 3.30E-05
DGKA 225.24 391.71 1.74 0.001
WDHD1 787.99 1371.1 1.74 7.88E-04
AIG1 267.4 464.83 1.74 4.20E-05
ITGAV 251.91 435.11 1.73 0.004
AVL9 195.91 339.34 1.73 0.002
TMEM135 153.79 265.76 1.73 0.001
HYOU1 222.19 383.48 1.73 0.001
C14orf145 601.83 1041.27 1.73 0.001
ARID4A 411.29 711.48 1.73 0.001
KIAA0391 140.39 242.53 1.73 4.24E-04
MARS 487.59 842.78 1.73 5.50E-05
GMFB 212.27 366.02 1.72 0.004
ATP6V0A1 367.86 633.05 1.72 0.004
ZFAND1 483.57 833.57 1.72 8.44E-04
AARS 741.12 1271.54 1.72 1.42E-04
SLC1A5 384.23 661.61 1.72 4.50E-05
MTHFD2 1234.19 2128.29 1.72 2.80E-05
INPP5B 167.39 284.95 1.7 9.81E-04
CFLAR 160.35 270.19 1.69 0.003
ESYT1 158.76 267.77 1.69 0.001
HAX1 442.4 747.74 1.69 7.58E-04
CD28 1212.14 2044.23 1.69 6.80E-05
LOC100128364 261.75 439.6 1.68 0.003
ACACA 239.16 401.53 1.68 0.001
DLGAP5 615.3 1036.3 1.68 6.20E-05
TJP1 274.25 457.56 1.67 0.006
SLC41A2 298.67 498.31 1.67 0.003
NCOA7 155.23 259.48 1.67 0.002
EDEM1 694.57 1156.66 1.67 0.002
KIAA0586 266.57 445.64 1.67 8.52E-04
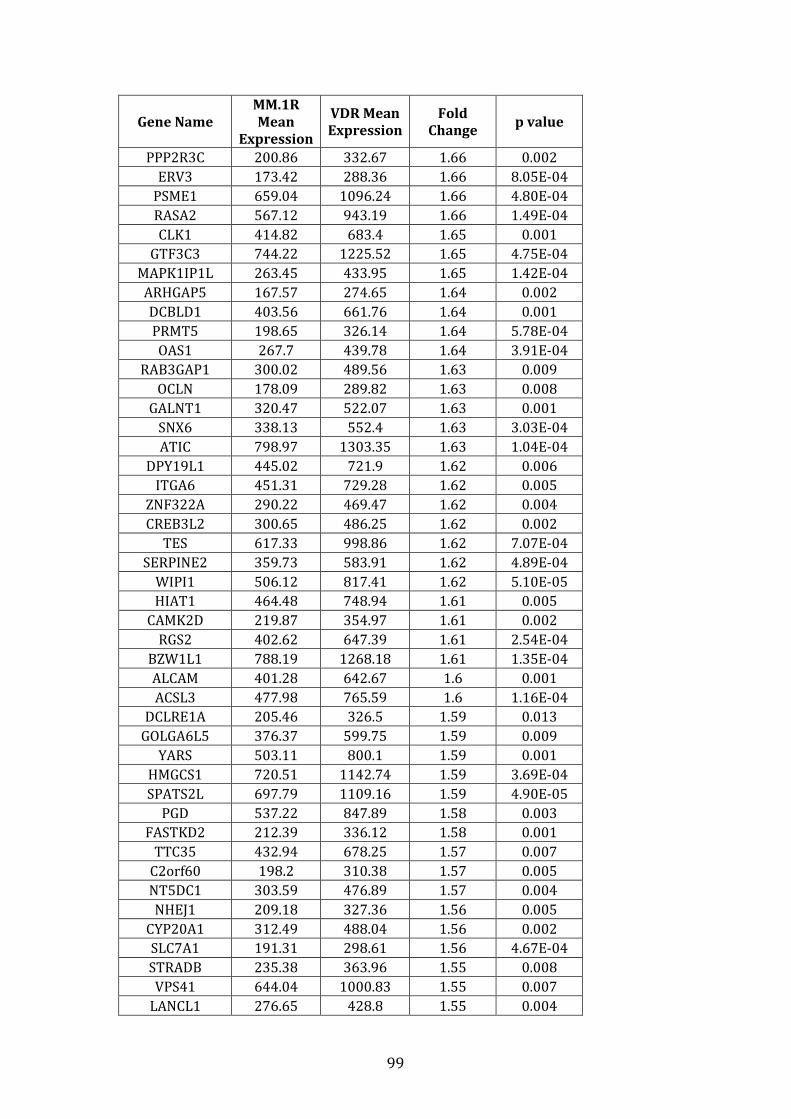
99
Gene Name
MM.1R
Mean
Expression
VDR Mean
Expression
Fold
Change p value
PPP2R3C 200.86 332.67 1.66 0.002
ERV3 173.42 288.36 1.66 8.05E-04
PSME1 659.04 1096.24 1.66 4.80E-04
RASA2 567.12 943.19 1.66 1.49E-04
CLK1 414.82 683.4 1.65 0.001
GTF3C3 744.22 1225.52 1.65 4.75E-04
MAPK1IP1L 263.45 433.95 1.65 1.42E-04
ARHGAP5 167.57 274.65 1.64 0.002
DCBLD1 403.56 661.76 1.64 0.001
PRMT5 198.65 326.14 1.64 5.78E-04
OAS1 267.7 439.78 1.64 3.91E-04
RAB3GAP1 300.02 489.56 1.63 0.009
OCLN 178.09 289.82 1.63 0.008
GALNT1 320.47 522.07 1.63 0.001
SNX6 338.13 552.4 1.63 3.03E-04
ATIC 798.97 1303.35 1.63 1.04E-04
DPY19L1 445.02 721.9 1.62 0.006
ITGA6 451.31 729.28 1.62 0.005
ZNF322A 290.22 469.47 1.62 0.004
CREB3L2 300.65 486.25 1.62 0.002
TES 617.33 998.86 1.62 7.07E-04
SERPINE2 359.73 583.91 1.62 4.89E-04
WIPI1 506.12 817.41 1.62 5.10E-05
HIAT1 464.48 748.94 1.61 0.005
CAMK2D 219.87 354.97 1.61 0.002
RGS2 402.62 647.39 1.61 2.54E-04
BZW1L1 788.19 1268.18 1.61 1.35E-04
ALCAM 401.28 642.67 1.6 0.001
ACSL3 477.98 765.59 1.6 1.16E-04
DCLRE1A 205.46 326.5 1.59 0.013
GOLGA6L5 376.37 599.75 1.59 0.009
YARS 503.11 800.1 1.59 0.001
HMGCS1 720.51 1142.74 1.59 3.69E-04
SPATS2L 697.79 1109.16 1.59 4.90E-05
PGD 537.22 847.89 1.58 0.003
FASTKD2 212.39 336.12 1.58 0.001
TTC35 432.94 678.25 1.57 0.007
C2orf60 198.2 310.38 1.57 0.005
NT5DC1 303.59 476.89 1.57 0.004
NHEJ1 209.18 327.36 1.56 0.005
CYP20A1 312.49 488.04 1.56 0.002
SLC7A1 191.31 298.61 1.56 4.67E-04
STRADB 235.38 363.96 1.55 0.008
VPS41 644.04 1000.83 1.55 0.007
LANCL1 276.65 428.8 1.55 0.004
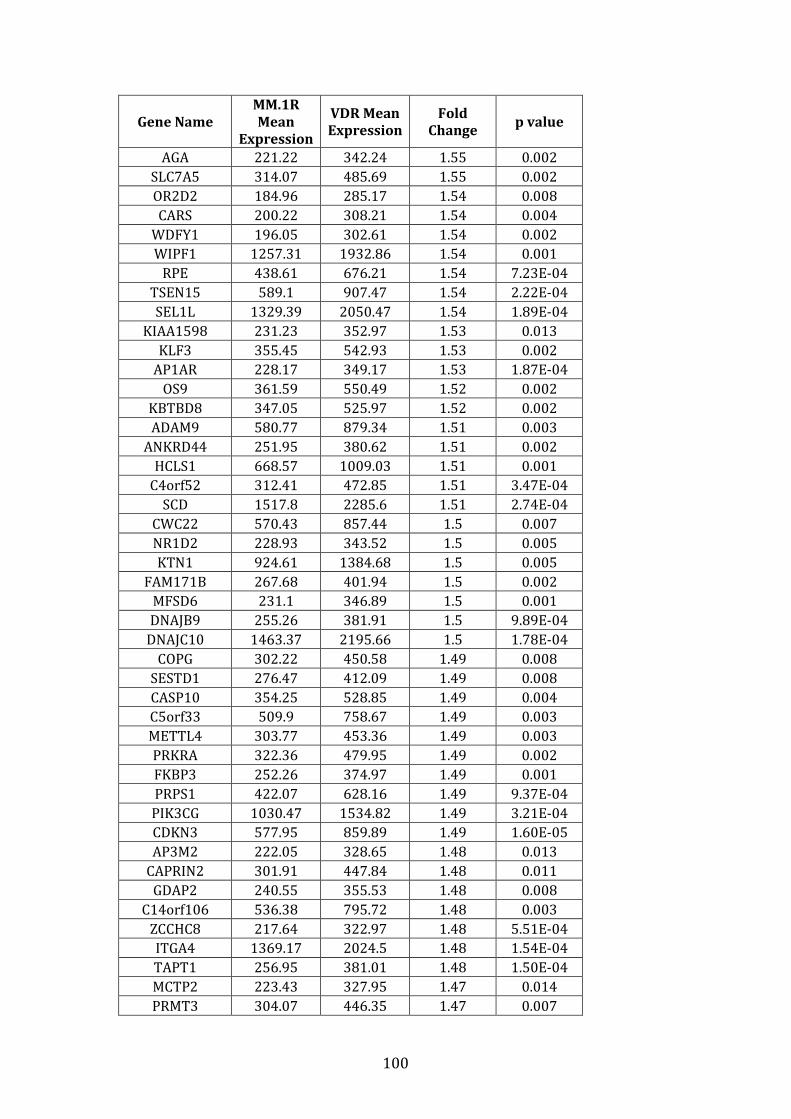
100
Gene Name
MM.1R
Mean
Expression
VDR Mean
Expression
Fold
Change p value
AGA 221.22 342.24 1.55 0.002
SLC7A5 314.07 485.69 1.55 0.002
OR2D2 184.96 285.17 1.54 0.008
CARS 200.22 308.21 1.54 0.004
WDFY1 196.05 302.61 1.54 0.002
WIPF1 1257.31 1932.86 1.54 0.001
RPE 438.61 676.21 1.54 7.23E-04
TSEN15 589.1 907.47 1.54 2.22E-04
SEL1L 1329.39 2050.47 1.54 1.89E-04
KIAA1598 231.23 352.97 1.53 0.013
KLF3 355.45 542.93 1.53 0.002
AP1AR 228.17 349.17 1.53 1.87E-04
OS9 361.59 550.49 1.52 0.002
KBTBD8 347.05 525.97 1.52 0.002
ADAM9 580.77 879.34 1.51 0.003
ANKRD44 251.95 380.62 1.51 0.002
HCLS1 668.57 1009.03 1.51 0.001
C4orf52 312.41 472.85 1.51 3.47E-04
SCD 1517.8 2285.6 1.51 2.74E-04
CWC22 570.43 857.44 1.5 0.007
NR1D2 228.93 343.52 1.5 0.005
KTN1 924.61 1384.68 1.5 0.005
FAM171B 267.68 401.94 1.5 0.002
MFSD6 231.1 346.89 1.5 0.001
DNAJB9 255.26 381.91 1.5 9.89E-04
DNAJC10 1463.37 2195.66 1.5 1.78E-04
COPG 302.22 450.58 1.49 0.008
SESTD1 276.47 412.09 1.49 0.008
CASP10 354.25 528.85 1.49 0.004
C5orf33 509.9 758.67 1.49 0.003
METTL4 303.77 453.36 1.49 0.003
PRKRA 322.36 479.95 1.49 0.002
FKBP3 252.26 374.97 1.49 0.001
PRPS1 422.07 628.16 1.49 9.37E-04
PIK3CG 1030.47 1534.82 1.49 3.21E-04
CDKN3 577.95 859.89 1.49 1.60E-05
AP3M2 222.05 328.65 1.48 0.013
CAPRIN2 301.91 447.84 1.48 0.011
GDAP2 240.55 355.53 1.48 0.008
C14orf106 536.38 795.72 1.48 0.003
ZCCHC8 217.64 322.97 1.48 5.51E-04
ITGA4 1369.17 2024.5 1.48 1.54E-04
TAPT1 256.95 381.01 1.48 1.50E-04
MCTP2 223.43 327.95 1.47 0.014
PRMT3 304.07 446.35 1.47 0.007
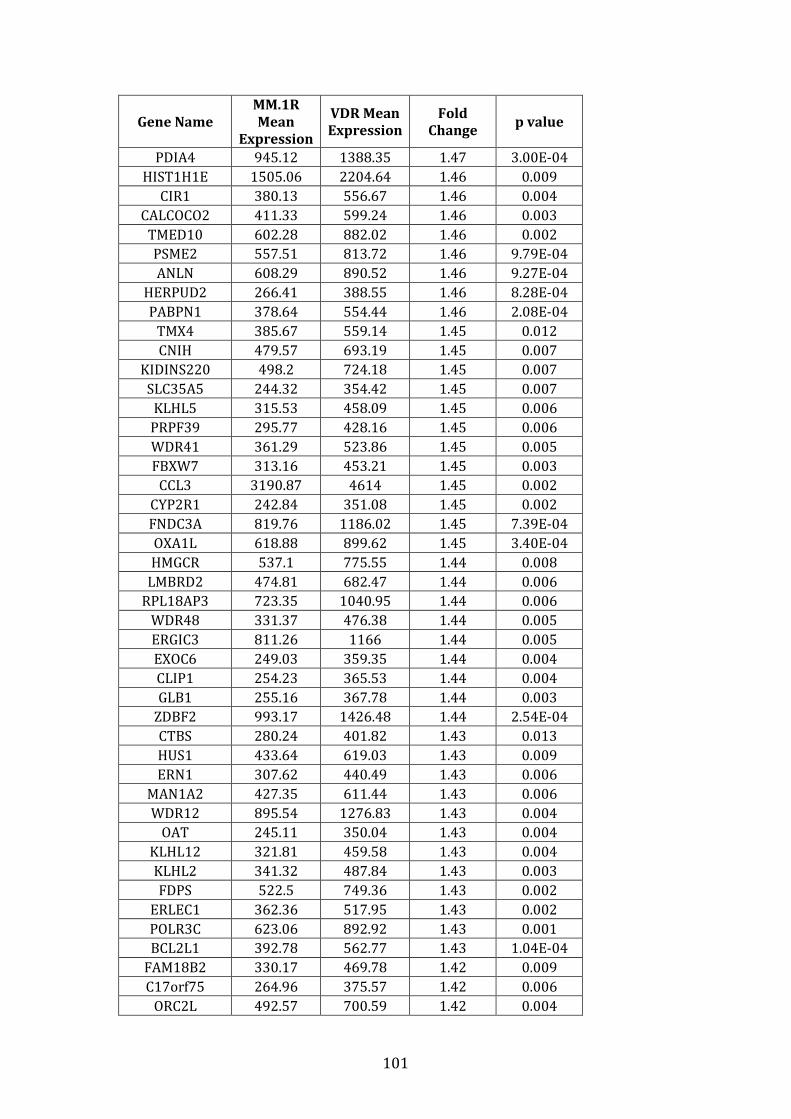
101
Gene Name
MM.1R
Mean
Expression
VDR Mean
Expression
Fold
Change p value
PDIA4 945.12 1388.35 1.47 3.00E-04
HIST1H1E 1505.06 2204.64 1.46 0.009
CIR1 380.13 556.67 1.46 0.004
CALCOCO2 411.33 599.24 1.46 0.003
TMED10 602.28 882.02 1.46 0.002
PSME2 557.51 813.72 1.46 9.79E-04
ANLN 608.29 890.52 1.46 9.27E-04
HERPUD2 266.41 388.55 1.46 8.28E-04
PABPN1 378.64 554.44 1.46 2.08E-04
TMX4 385.67 559.14 1.45 0.012
CNIH 479.57 693.19 1.45 0.007
KIDINS220 498.2 724.18 1.45 0.007
SLC35A5 244.32 354.42 1.45 0.007
KLHL5 315.53 458.09 1.45 0.006
PRPF39 295.77 428.16 1.45 0.006
WDR41 361.29 523.86 1.45 0.005
FBXW7 313.16 453.21 1.45 0.003
CCL3 3190.87 4614 1.45 0.002
CYP2R1 242.84 351.08 1.45 0.002
FNDC3A 819.76 1186.02 1.45 7.39E-04
OXA1L 618.88 899.62 1.45 3.40E-04
HMGCR 537.1 775.55 1.44 0.008
LMBRD2 474.81 682.47 1.44 0.006
RPL18AP3 723.35 1040.95 1.44 0.006
WDR48 331.37 476.38 1.44 0.005
ERGIC3 811.26 1166 1.44 0.005
EXOC6 249.03 359.35 1.44 0.004
CLIP1 254.23 365.53 1.44 0.004
GLB1 255.16 367.78 1.44 0.003
ZDBF2 993.17 1426.48 1.44 2.54E-04
CTBS 280.24 401.82 1.43 0.013
HUS1 433.64 619.03 1.43 0.009
ERN1 307.62 440.49 1.43 0.006
MAN1A2 427.35 611.44 1.43 0.006
WDR12 895.54 1276.83 1.43 0.004
OAT 245.11 350.04 1.43 0.004
KLHL12 321.81 459.58 1.43 0.004
KLHL2 341.32 487.84 1.43 0.003
FDPS 522.5 749.36 1.43 0.002
ERLEC1 362.36 517.95 1.43 0.002
POLR3C 623.06 892.92 1.43 0.001
BCL2L1 392.78 562.77 1.43 1.04E-04
FAM18B2 330.17 469.78 1.42 0.009
C17orf75 264.96 375.57 1.42 0.006
ORC2L 492.57 700.59 1.42 0.004
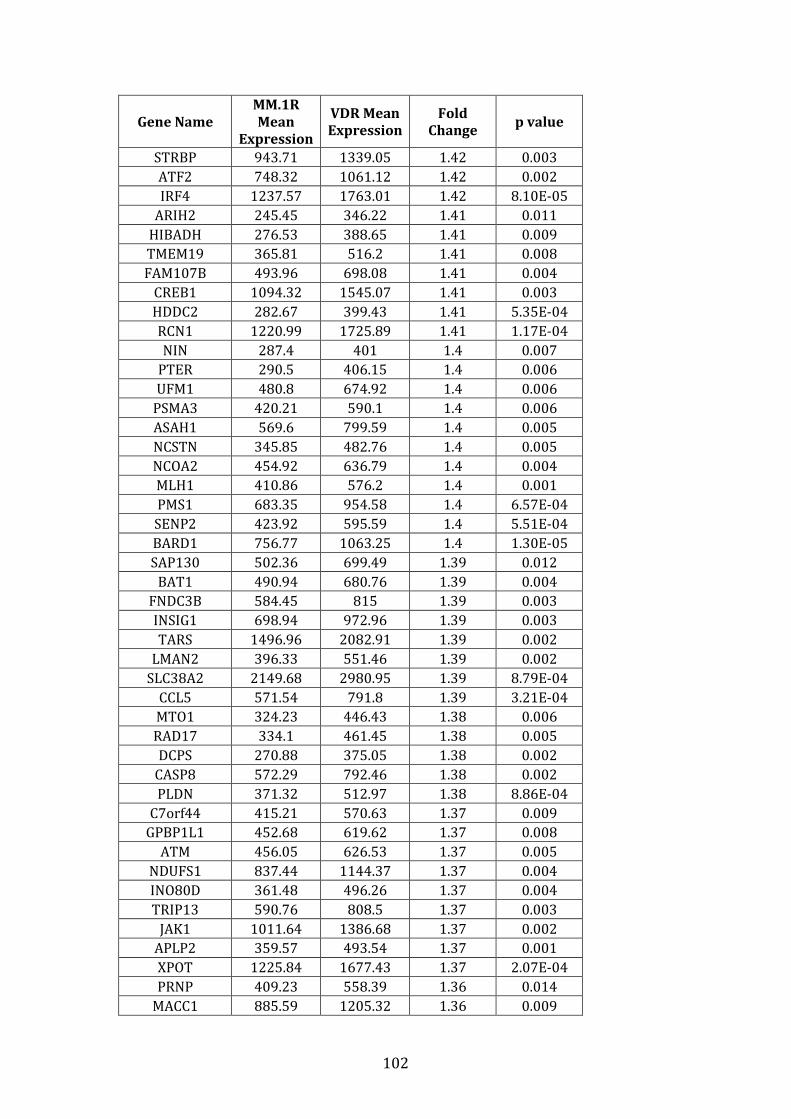
102
Gene Name
MM.1R
Mean
Expression
VDR Mean
Expression
Fold
Change p value
STRBP 943.71 1339.05 1.42 0.003
ATF2 748.32 1061.12 1.42 0.002
IRF4 1237.57 1763.01 1.42 8.10E-05
ARIH2 245.45 346.22 1.41 0.011
HIBADH 276.53 388.65 1.41 0.009
TMEM19 365.81 516.2 1.41 0.008
FAM107B 493.96 698.08 1.41 0.004
CREB1 1094.32 1545.07 1.41 0.003
HDDC2 282.67 399.43 1.41 5.35E-04
RCN1 1220.99 1725.89 1.41 1.17E-04
NIN 287.4 401 1.4 0.007
PTER 290.5 406.15 1.4 0.006
UFM1 480.8 674.92 1.4 0.006
PSMA3 420.21 590.1 1.4 0.006
ASAH1 569.6 799.59 1.4 0.005
NCSTN 345.85 482.76 1.4 0.005
NCOA2 454.92 636.79 1.4 0.004
MLH1 410.86 576.2 1.4 0.001
PMS1 683.35 954.58 1.4 6.57E-04
SENP2 423.92 595.59 1.4 5.51E-04
BARD1 756.77 1063.25 1.4 1.30E-05
SAP130 502.36 699.49 1.39 0.012
BAT1 490.94 680.76 1.39 0.004
FNDC3B 584.45 815 1.39 0.003
INSIG1 698.94 972.96 1.39 0.003
TARS 1496.96 2082.91 1.39 0.002
LMAN2 396.33 551.46 1.39 0.002
SLC38A2 2149.68 2980.95 1.39 8.79E-04
CCL5 571.54 791.8 1.39 3.21E-04
MTO1 324.23 446.43 1.38 0.006
RAD17 334.1 461.45 1.38 0.005
DCPS 270.88 375.05 1.38 0.002
CASP8 572.29 792.46 1.38 0.002
PLDN 371.32 512.97 1.38 8.86E-04
C7orf44 415.21 570.63 1.37 0.009
GPBP1L1 452.68 619.62 1.37 0.008
ATM 456.05 626.53 1.37 0.005
NDUFS1 837.44 1144.37 1.37 0.004
INO80D 361.48 496.26 1.37 0.004
TRIP13 590.76 808.5 1.37 0.003
JAK1 1011.64 1386.68 1.37 0.002
APLP2 359.57 493.54 1.37 0.001
XPOT 1225.84 1677.43 1.37 2.07E-04
PRNP 409.23 558.39 1.36 0.014
MACC1 885.59 1205.32 1.36 0.009
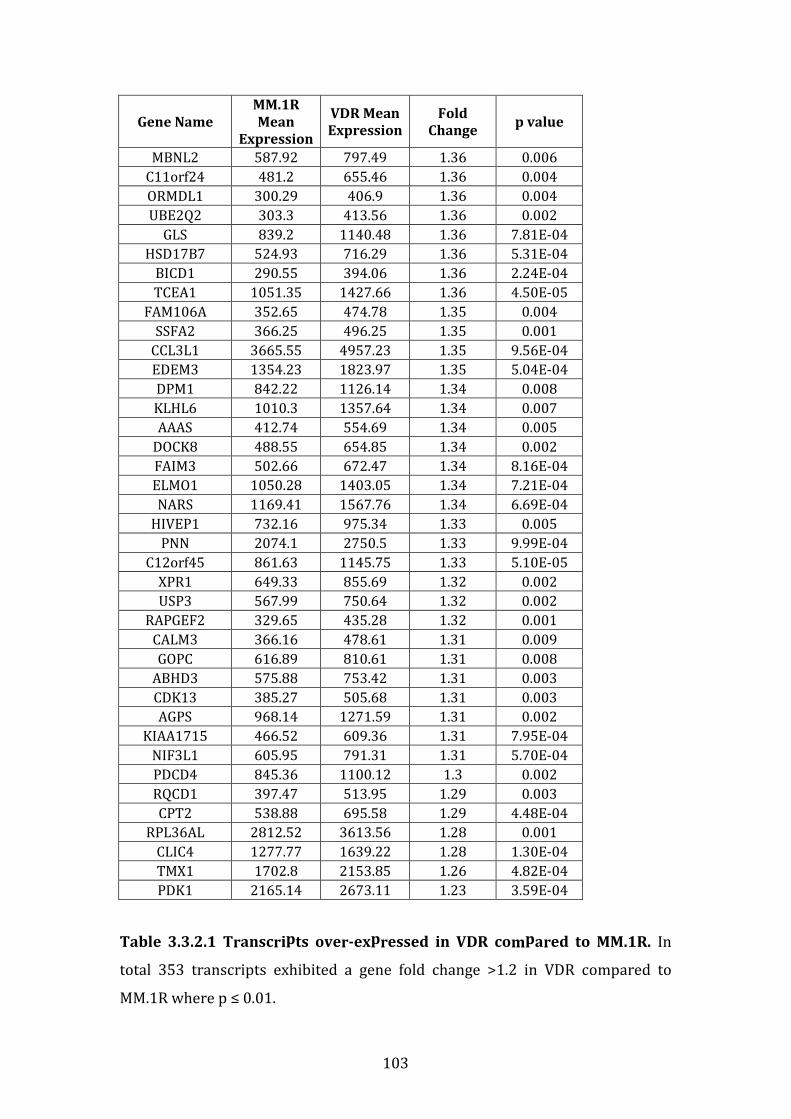
103
Gene Name
MM.1R
Mean
Expression
VDR Mean
Expression
Fold
Change p value
MBNL2 587.92 797.49 1.36 0.006
C11orf24 481.2 655.46 1.36 0.004
ORMDL1 300.29 406.9 1.36 0.004
UBE2Q2 303.3 413.56 1.36 0.002
GLS 839.2 1140.48 1.36 7.81E-04
HSD17B7 524.93 716.29 1.36 5.31E-04
BICD1 290.55 394.06 1.36 2.24E-04
TCEA1 1051.35 1427.66 1.36 4.50E-05
FAM106A 352.65 474.78 1.35 0.004
SSFA2 366.25 496.25 1.35 0.001
CCL3L1 3665.55 4957.23 1.35 9.56E-04
EDEM3 1354.23 1823.97 1.35 5.04E-04
DPM1 842.22 1126.14 1.34 0.008
KLHL6 1010.3 1357.64 1.34 0.007
AAAS 412.74 554.69 1.34 0.005
DOCK8 488.55 654.85 1.34 0.002
FAIM3 502.66 672.47 1.34 8.16E-04
ELMO1 1050.28 1403.05 1.34 7.21E-04
NARS 1169.41 1567.76 1.34 6.69E-04
HIVEP1 732.16 975.34 1.33 0.005
PNN 2074.1 2750.5 1.33 9.99E-04
C12orf45 861.63 1145.75 1.33 5.10E-05
XPR1 649.33 855.69 1.32 0.002
USP3 567.99 750.64 1.32 0.002
RAPGEF2 329.65 435.28 1.32 0.001
CALM3 366.16 478.61 1.31 0.009
GOPC 616.89 810.61 1.31 0.008
ABHD3 575.88 753.42 1.31 0.003
CDK13 385.27 505.68 1.31 0.003
AGPS 968.14 1271.59 1.31 0.002
KIAA1715 466.52 609.36 1.31 7.95E-04
NIF3L1 605.95 791.31 1.31 5.70E-04
PDCD4 845.36 1100.12 1.3 0.002
RQCD1 397.47 513.95 1.29 0.003
CPT2 538.88 695.58 1.29 4.48E-04
RPL36AL 2812.52 3613.56 1.28 0.001
CLIC4 1277.77 1639.22 1.28 1.30E-04
TMX1 1702.8 2153.85 1.26 4.82E-04
PDK1 2165.14 2673.11 1.23 3.59E-04
Table 3.3.2.1 Transcripts over-expressed in VDR compared to MM.1R. In
total 353 transcripts exhibited a gene fold change >1.2 in VDR compared to
MM.1R where p ≤ 0.01.
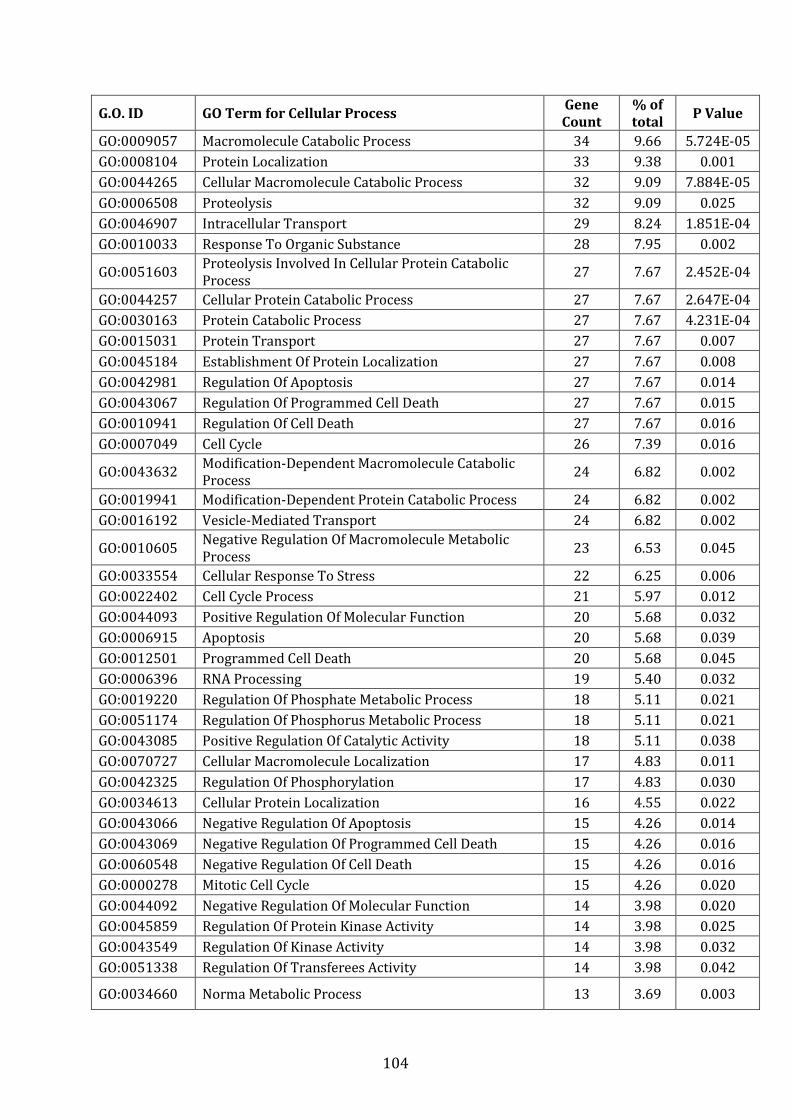
104
G.O. ID GO Term for Cellular Process Gene
Count
% of
total P Value
GO:0009057 Macromolecule Catabolic Process 34 9.66 5.724E-05
GO:0008104 Protein Localization 33 9.38 0.001
GO:0044265 Cellular Macromolecule Catabolic Process 32 9.09 7.884E-05
GO:0006508 Proteolysis 32 9.09 0.025
GO:0046907 Intracellular Transport 29 8.24 1.851E-04
GO:0010033 Response To Organic Substance 28 7.95 0.002
GO:0051603 Proteolysis Involved In Cellular Protein Catabolic
Process 27 7.67 2.452E-04
GO:0044257 Cellular Protein Catabolic Process 27 7.67 2.647E-04
GO:0030163 Protein Catabolic Process 27 7.67 4.231E-04
GO:0015031 Protein Transport 27 7.67 0.007
GO:0045184 Establishment Of Protein Localization 27 7.67 0.008
GO:0042981 Regulation Of Apoptosis 27 7.67 0.014
GO:0043067 Regulation Of Programmed Cell Death 27 7.67 0.015
GO:0010941 Regulation Of Cell Death 27 7.67 0.016
GO:0007049 Cell Cycle 26 7.39 0.016
GO:0043632 Modification-Dependent Macromolecule Catabolic
Process 24 6.82 0.002
GO:0019941 Modification-Dependent Protein Catabolic Process 24 6.82 0.002
GO:0016192 Vesicle-Mediated Transport 24 6.82 0.002
GO:0010605 Negative Regulation Of Macromolecule Metabolic
Process 23 6.53 0.045
GO:0033554 Cellular Response To Stress 22 6.25 0.006
GO:0022402 Cell Cycle Process 21 5.97 0.012
GO:0044093 Positive Regulation Of Molecular Function 20 5.68 0.032
GO:0006915 Apoptosis 20 5.68 0.039
GO:0012501 Programmed Cell Death 20 5.68 0.045
GO:0006396 RNA Processing 19 5.40 0.032
GO:0019220 Regulation Of Phosphate Metabolic Process 18 5.11 0.021
GO:0051174 Regulation Of Phosphorus Metabolic Process 18 5.11 0.021
GO:0043085 Positive Regulation Of Catalytic Activity 18 5.11 0.038
GO:0070727 Cellular Macromolecule Localization 17 4.83 0.011
GO:0042325 Regulation Of Phosphorylation 17 4.83 0.030
GO:0034613 Cellular Protein Localization 16 4.55 0.022
GO:0043066 Negative Regulation Of Apoptosis 15 4.26 0.014
GO:0043069 Negative Regulation Of Programmed Cell Death 15 4.26 0.016
GO:0060548 Negative Regulation Of Cell Death 15 4.26 0.016
GO:0000278 Mitotic Cell Cycle 15 4.26 0.020
GO:0044092 Negative Regulation Of Molecular Function 14 3.98 0.020
GO:0045859 Regulation Of Protein Kinase Activity 14 3.98 0.025
GO:0043549 Regulation Of Kinase Activity 14 3.98 0.032
GO:0051338 Regulation Of Transferees Activity 14 3.98 0.042
GO:0034660 Norma Metabolic Process 13 3.69 0.003
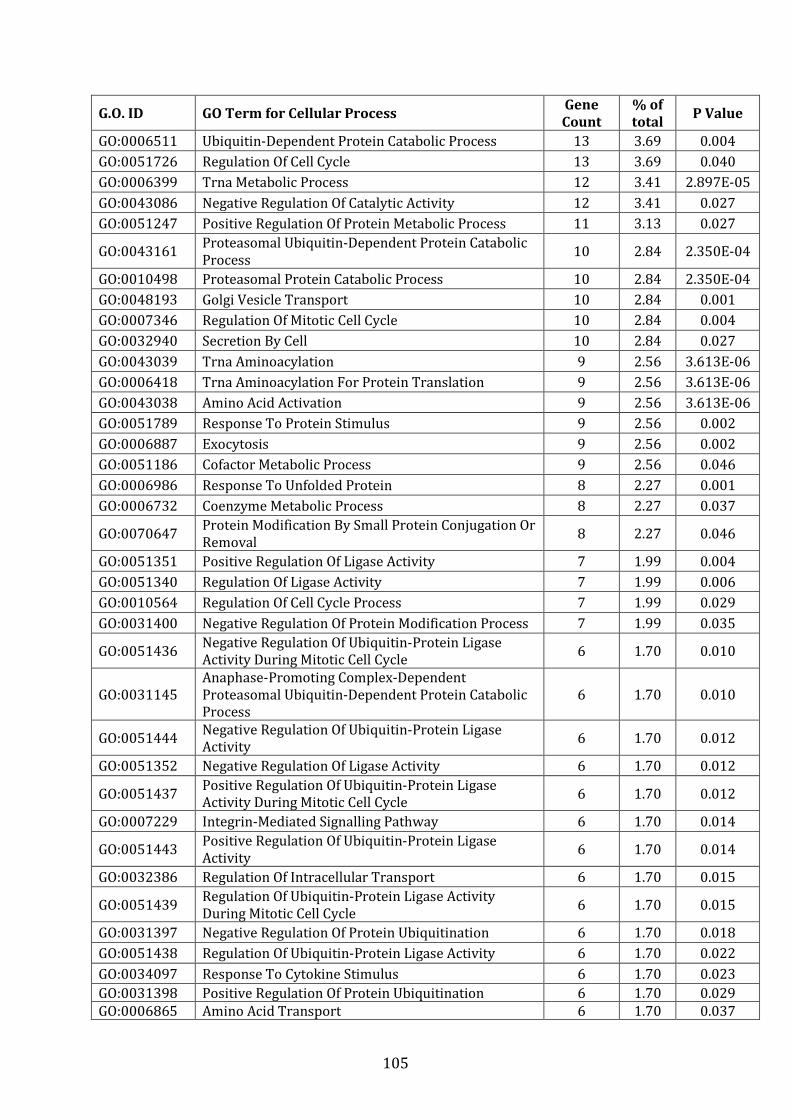
105
G.O. ID GO Term for Cellular Process Gene
Count
% of
total P Value
GO:0006511 Ubiquitin-Dependent Protein Catabolic Process 13 3.69 0.004
GO:0051726 Regulation Of Cell Cycle 13 3.69 0.040
GO:0006399 Trna Metabolic Process 12 3.41 2.897E-05
GO:0043086 Negative Regulation Of Catalytic Activity 12 3.41 0.027
GO:0051247 Positive Regulation Of Protein Metabolic Process 11 3.13 0.027
GO:0043161 Proteasomal Ubiquitin-Dependent Protein Catabolic
Process 10 2.84 2.350E-04
GO:0010498 Proteasomal Protein Catabolic Process 10 2.84 2.350E-04
GO:0048193 Golgi Vesicle Transport 10 2.84 0.001
GO:0007346 Regulation Of Mitotic Cell Cycle 10 2.84 0.004
GO:0032940 Secretion By Cell 10 2.84 0.027
GO:0043039 Trna Aminoacylation 9 2.56 3.613E-06
GO:0006418 Trna Aminoacylation For Protein Translation 9 2.56 3.613E-06
GO:0043038 Amino Acid Activation 9 2.56 3.613E-06
GO:0051789 Response To Protein Stimulus 9 2.56 0.002
GO:0006887 Exocytosis 9 2.56 0.002
GO:0051186 Cofactor Metabolic Process 9 2.56 0.046
GO:0006986 Response To Unfolded Protein 8 2.27 0.001
GO:0006732 Coenzyme Metabolic Process 8 2.27 0.037
GO:0070647 Protein Modification By Small Protein Conjugation Or
Removal 8 2.27 0.046
GO:0051351 Positive Regulation Of Ligase Activity 7 1.99 0.004
GO:0051340 Regulation Of Ligase Activity 7 1.99 0.006
GO:0010564 Regulation Of Cell Cycle Process 7 1.99 0.029
GO:0031400 Negative Regulation Of Protein Modification Process 7 1.99 0.035
GO:0051436 Negative Regulation Of Ubiquitin-Protein Ligase
Activity During Mitotic Cell Cycle 6 1.70 0.010
GO:0031145
Anaphase-Promoting Complex-Dependent
Proteasomal Ubiquitin-Dependent Protein Catabolic
Process
6 1.70 0.010
GO:0051444 Negative Regulation Of Ubiquitin-Protein Ligase
Activity 6 1.70 0.012
GO:0051352 Negative Regulation Of Ligase Activity 6 1.70 0.012
GO:0051437 Positive Regulation Of Ubiquitin-Protein Ligase
Activity During Mitotic Cell Cycle 6 1.70 0.012
GO:0007229 Integrin-Mediated Signalling Pathway 6 1.70 0.014
GO:0051443 Positive Regulation Of Ubiquitin-Protein Ligase
Activity 6 1.70 0.014
GO:0032386 Regulation Of Intracellular Transport 6 1.70 0.015
GO:0051439 Regulation Of Ubiquitin-Protein Ligase Activity
During Mitotic Cell Cycle 6 1.70 0.015
GO:0031397 Negative Regulation Of Protein Ubiquitination 6 1.70 0.018
GO:0051438 Regulation Of Ubiquitin-Protein Ligase Activity 6 1.70 0.022
GO:0034097 Response To Cytokine Stimulus 6 1.70 0.023
GO:0031398 Positive Regulation Of Protein Ubiquitination 6 1.70 0.029
GO:0006865 Amino Acid Transport 6 1.70 0.037
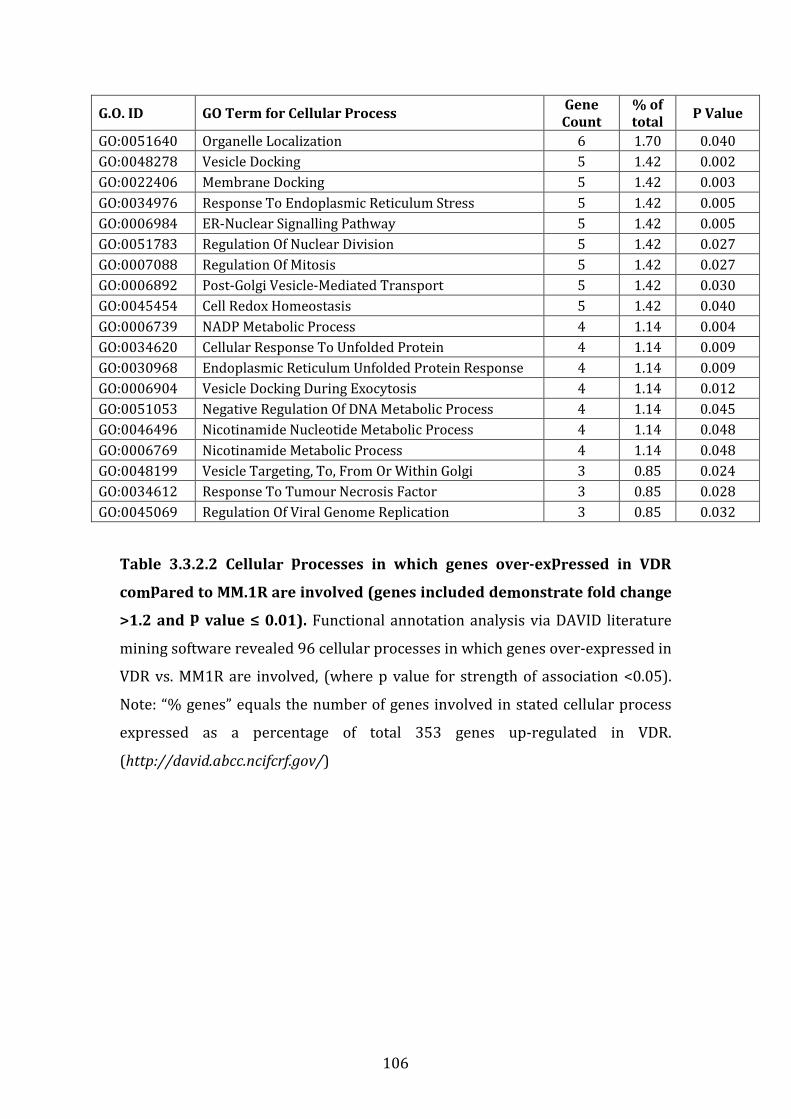
106
G.O. ID GO Term for Cellular Process Gene
Count
% of
total P Value
GO:0051640 Organelle Localization 6 1.70 0.040
GO:0048278 Vesicle Docking 5 1.42 0.002
GO:0022406 Membrane Docking 5 1.42 0.003
GO:0034976 Response To Endoplasmic Reticulum Stress 5 1.42 0.005
GO:0006984 ER-Nuclear Signalling Pathway 5 1.42 0.005
GO:0051783 Regulation Of Nuclear Division 5 1.42 0.027
GO:0007088 Regulation Of Mitosis 5 1.42 0.027
GO:0006892 Post-Golgi Vesicle-Mediated Transport 5 1.42 0.030
GO:0045454 Cell Redox Homeostasis 5 1.42 0.040
GO:0006739 NADP Metabolic Process 4 1.14 0.004
GO:0034620 Cellular Response To Unfolded Protein 4 1.14 0.009
GO:0030968 Endoplasmic Reticulum Unfolded Protein Response 4 1.14 0.009
GO:0006904 Vesicle Docking During Exocytosis 4 1.14 0.012
GO:0051053 Negative Regulation Of DNA Metabolic Process 4 1.14 0.045
GO:0046496 Nicotinamide Nucleotide Metabolic Process 4 1.14 0.048
GO:0006769 Nicotinamide Metabolic Process 4 1.14 0.048
GO:0048199 Vesicle Targeting, To, From Or Within Golgi 3 0.85 0.024
GO:0034612 Response To Tumour Necrosis Factor 3 0.85 0.028
GO:0045069 Regulation Of Viral Genome Replication 3 0.85 0.032
Table 3.3.2.2 Cellular processes in which genes over-expressed in VDR
compared to MM.1R are involved (genes included demonstrate fold change
>1.2 and p value ≤ 0.01). Functional annotation analysis via DAVID literature
mining software revealed 96 cellular processes in which genes over-expressed in
VDR vs. MM1R are involved, (where p value for strength of association <0.05).
Note: “% genes” equals the number of genes involved in stated cellular process
expressed as a percentage of total 353 genes up-regulated in VDR.
(http://david.abcc.ncifcrf.gov/)

107
G.O. ID Cellular
Process
Gene
Count
%
Genes P Value Gene IDs
GO:0009057
Macromolecule
Catabolic
Process
34 9.66 5.724E-
05
USP3, MLH1, NEDD8, EDEM3,
EDEM1, ERLEC1, OS9, DCPS,
PSMB5, G2E3, FBXW7, ARIH2,
UFM1, CASP8, PPIL5, CTBS,
ADAM9, HECTD1, AGA, RNASE6,
UBE2Q2, ATM, WDR48, NCSTN,
SENP2, MNAT1, PSMC6, PSMA6,
PSME1, PSME2, PSMA3, KLHL12,
FBXO34, BARD1
GO 0008104 Protein
Localization 33 9.38 0.001
ALS2, OXA1L, PLDN, SNX6, AP1AR,
HMP4A, NFKBIA, NEDD8, PDIA4,
LMAN2, KLHL2, MUDENG, OS9,
AP3M2, GOPC, PIKFYVE, TIMM9,
TMED10, EXOC6, EXOC5, TINF2,
SEC23A, SRP54, STAP1, PLEK,
VPS41, STRADB, SENP2, SCFD1,
RAB30, FBX034, COPG, F2R
GO:0044265
Cellular
Macromolecule
Catabolic
Process
32 9.09 7.884E-
05
USP3, MLH1, NEDD8, EDEM3,
EDEM1, ERLEC1, OS9, DCPS,
PSMB5, G2E3, FBXW7, ARIH2,
UFM1, CASP8, PPIL5, ADAM9,
HECTD1, RNASE6, UBE2Q2, ATM,
WDR48, NCSTN, SENP2, MNAT1,
PSMC6, PSMA6, PSME1, PSME2,
PSMA3, KLHL12, FBXO34, BARD1
GO:0006508 Proteolysis 32 9.09 0.025
USP3, NEDD8, EDEM3, EDEM1,
ERLEC1, OS9, PSMB5, G2E3,
FBXW7, ARIH2, UFM1, PRSS2,
CASP8, PPIL5, ADAM9, HECTD1,
CFLAR, CR2, ADAM23, UBE2Q2,
NCSTN, SENP2, WDR48, CASP10,
PSMC6, PSMA6, PSME1, PSME2,
PSMA3, KLHL12, FBXO34, BARD1
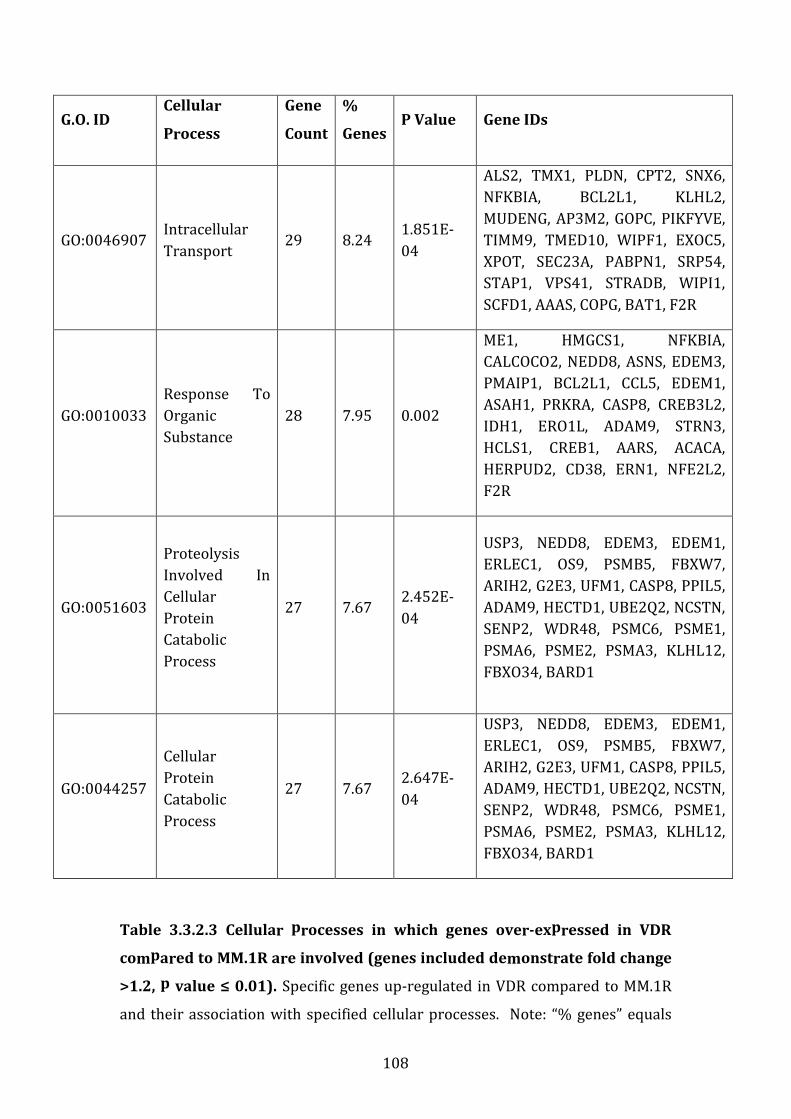
108
G.O. ID Cellular
Process
Gene
Count
%
Genes P Value Gene IDs
GO:0046907 Intracellular
Transport 29 8.24
1.851E-
04
ALS2, TMX1, PLDN, CPT2, SNX6,
NFKBIA, BCL2L1, KLHL2,
MUDENG, AP3M2, GOPC, PIKFYVE,
TIMM9, TMED10, WIPF1, EXOC5,
XPOT, SEC23A, PABPN1, SRP54,
STAP1, VPS41, STRADB, WIPI1,
SCFD1, AAAS, COPG, BAT1, F2R
GO:0010033
Response To
Organic
Substance
28 7.95 0.002
ME1, HMGCS1, NFKBIA,
CALCOCO2, NEDD8, ASNS, EDEM3,
PMAIP1, BCL2L1, CCL5, EDEM1,
ASAH1, PRKRA, CASP8, CREB3L2,
IDH1, ERO1L, ADAM9, STRN3,
HCLS1, CREB1, AARS, ACACA,
HERPUD2, CD38, ERN1, NFE2L2,
F2R
GO:0051603
Proteolysis
Involved In
Cellular
Protein
Catabolic
Process
27 7.67 2.452E-
04
USP3, NEDD8, EDEM3, EDEM1,
ERLEC1, OS9, PSMB5, FBXW7,
ARIH2, G2E3, UFM1, CASP8, PPIL5,
ADAM9, HECTD1, UBE2Q2, NCSTN,
SENP2, WDR48, PSMC6, PSME1,
PSMA6, PSME2, PSMA3, KLHL12,
FBXO34, BARD1
GO:0044257
Cellular
Protein
Catabolic
Process
27 7.67 2.647E-
04
USP3, NEDD8, EDEM3, EDEM1,
ERLEC1, OS9, PSMB5, FBXW7,
ARIH2, G2E3, UFM1, CASP8, PPIL5,
ADAM9, HECTD1, UBE2Q2, NCSTN,
SENP2, WDR48, PSMC6, PSME1,
PSMA6, PSME2, PSMA3, KLHL12,
FBXO34, BARD1
Table 3.3.2.3 Cellular processes in which genes over-expressed in VDR
compared to MM.1R are involved (genes included demonstrate fold change
>1.2, p value ≤ 0.01). Specific genes up-regulated in VDR compared to MM.1R
and their association with specified cellular processes. Note: “% genes” equals

109
the number of genes involved in stated cellular process expressed as a
percentage of total 353 genes up-regulated in VDR.
(http://david.abcc.ncifcrf.gov/)

110
Figure 3.3.2.1 Genes up-regulated in VDR compared to MM.1R and their
role in cellular apoptosis.
DAVID functional annotation tool revealed 4 genes up-regulated in VDR
compared to MM.1R that share an intracytoplasmic role in cellular apoptosis.
These transcripts include CFLAR, CASP8, CASP10 and NFKBIA.
(http://david.abcc.ncifcrf.gov/)
111
3.3.3 Transcripts downregulated in VDR compared to MM.1R
In contrast to the 353 transcripts upregulated in VDR compared to MM.1R, only
84 genes were downregulated in the resistant cell line compared to bortezomib-
sensitive MM.1R. The difference in the number of genes upregulated compared
to downregulated comparative analysis is unclear. It is not due to a difference in
proliferation rate between the two cell lines as none is evident (results section
3.16). Again for all 84 genes downregulated in VDR cell line, the list includes only
genes with a fold change difference <1.2 in VDR compared to MM.1R where p
value ≤ 0.01, (table 3.3.3.1).
Again the list of transcripts downregulated in VDR compared to MM.1R was
analysed for their involvement in cellular processes in Homo Sapiens.
Transcripts down-regulated in VDR are noted to participate in a number of
cellular processes mainly concerned with the immune system for example
antigen processing and presentation, immune response, T cell differentiation and
T cell selection, (table 3.3.3.2).
Table 3.3.3.3 demonstrates a list of specific genes down-regulated in VDR
compared to MM.1R and their association with specified cellular processes
where by at least 5% of genes down-regulated in VDR are involved in a common
cellular process. Genes listed here are involved in cellular process of antigen
processing and presentation (n=10 genes or 11.9% of total genes, p=3.98E-03),
or the immune response (n=5 genes or 5.95% of total genes, p=5.61E-04).
Finally figure 3.3.3.1 depicts the location of CD74 (CD74 molecule, MHC complex,
class 2 invariant chain) and HLA-DRA (major histocompatibility complex, class 2,
RD alpha) in the antigen processing and presentation pathway, both of which are
also down-regulated in VDR compared to MM.1R.
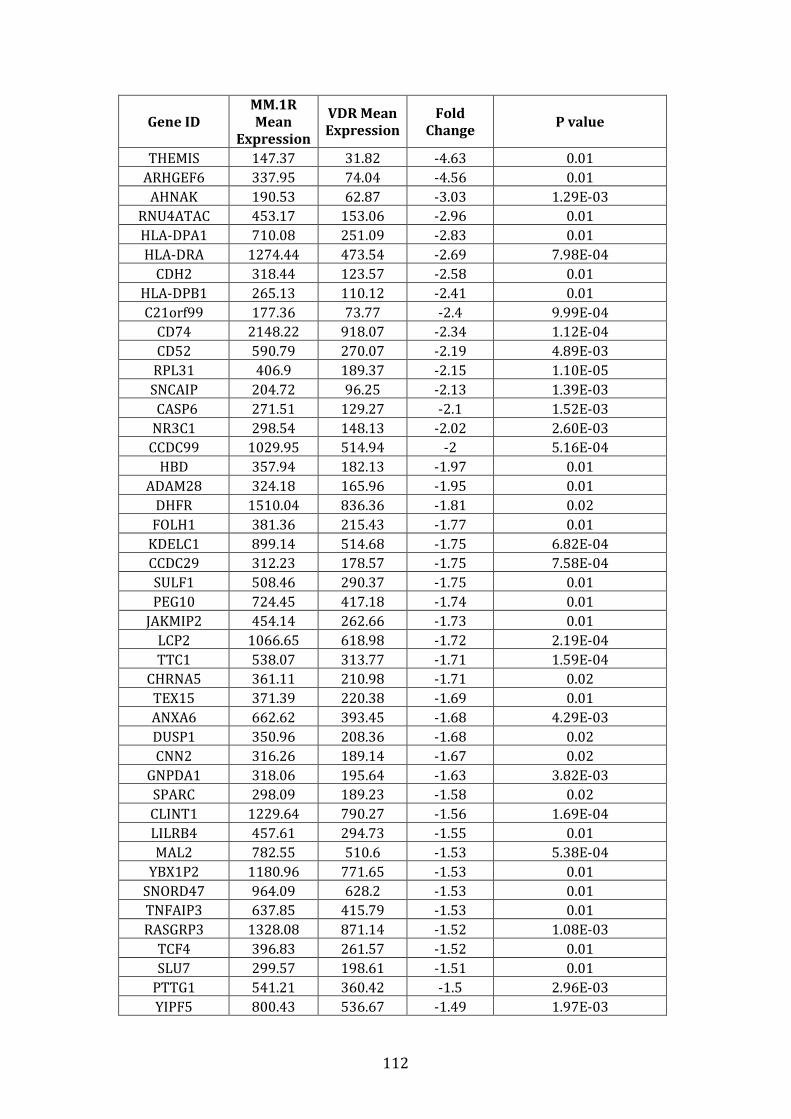
112
Gene ID
MM.1R
Mean
Expression
VDR Mean
Expression
Fold
Change P value
THEMIS 147.37 31.82 -4.63 0.01
ARHGEF6 337.95 74.04 -4.56 0.01
AHNAK 190.53 62.87 -3.03 1.29E-03
RNU4ATAC 453.17 153.06 -2.96 0.01
HLA-DPA1 710.08 251.09 -2.83 0.01
HLA-DRA 1274.44 473.54 -2.69 7.98E-04
CDH2 318.44 123.57 -2.58 0.01
HLA-DPB1 265.13 110.12 -2.41 0.01
C21orf99 177.36 73.77 -2.4 9.99E-04
CD74 2148.22 918.07 -2.34 1.12E-04
CD52 590.79 270.07 -2.19 4.89E-03
RPL31 406.9 189.37 -2.15 1.10E-05
SNCAIP 204.72 96.25 -2.13 1.39E-03
CASP6 271.51 129.27 -2.1 1.52E-03
NR3C1 298.54 148.13 -2.02 2.60E-03
CCDC99 1029.95 514.94 -2 5.16E-04
HBD 357.94 182.13 -1.97 0.01
ADAM28 324.18 165.96 -1.95 0.01
DHFR 1510.04 836.36 -1.81 0.02
FOLH1 381.36 215.43 -1.77 0.01
KDELC1 899.14 514.68 -1.75 6.82E-04
CCDC29 312.23 178.57 -1.75 7.58E-04
SULF1 508.46 290.37 -1.75 0.01
PEG10 724.45 417.18 -1.74 0.01
JAKMIP2 454.14 262.66 -1.73 0.01
LCP2 1066.65 618.98 -1.72 2.19E-04
TTC1 538.07 313.77 -1.71 1.59E-04
CHRNA5 361.11 210.98 -1.71 0.02
TEX15 371.39 220.38 -1.69 0.01
ANXA6 662.62 393.45 -1.68 4.29E-03
DUSP1 350.96 208.36 -1.68 0.02
CNN2 316.26 189.14 -1.67 0.02
GNPDA1 318.06 195.64 -1.63 3.82E-03
SPARC 298.09 189.23 -1.58 0.02
CLINT1 1229.64 790.27 -1.56 1.69E-04
LILRB4 457.61 294.73 -1.55 0.01
MAL2 782.55 510.6 -1.53 5.38E-04
YBX1P2 1180.96 771.65 -1.53 0.01
SNORD47 964.09 628.2 -1.53 0.01
TNFAIP3 637.85 415.79 -1.53 0.01
RASGRP3 1328.08 871.14 -1.52 1.08E-03
TCF4 396.83 261.57 -1.52 0.01
SLU7 299.57 198.61 -1.51 0.01
PTTG1 541.21 360.42 -1.5 2.96E-03
YIPF5 800.43 536.67 -1.49 1.97E-03
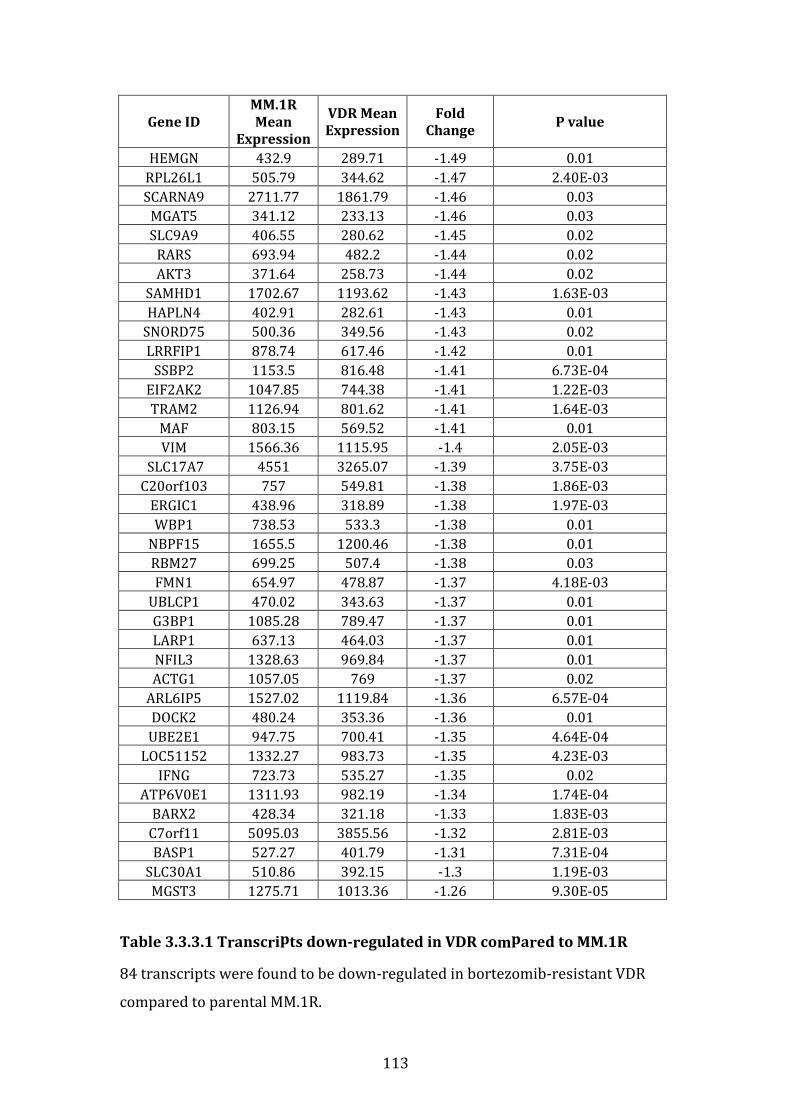
113
Gene ID
MM.1R
Mean
Expression
VDR Mean
Expression
Fold
Change P value
HEMGN 432.9 289.71 -1.49 0.01
RPL26L1 505.79 344.62 -1.47 2.40E-03
SCARNA9 2711.77 1861.79 -1.46 0.03
MGAT5 341.12 233.13 -1.46 0.03
SLC9A9 406.55 280.62 -1.45 0.02
RARS 693.94 482.2 -1.44 0.02
AKT3 371.64 258.73 -1.44 0.02
SAMHD1 1702.67 1193.62 -1.43 1.63E-03
HAPLN4 402.91 282.61 -1.43 0.01
SNORD75 500.36 349.56 -1.43 0.02
LRRFIP1 878.74 617.46 -1.42 0.01
SSBP2 1153.5 816.48 -1.41 6.73E-04
EIF2AK2 1047.85 744.38 -1.41 1.22E-03
TRAM2 1126.94 801.62 -1.41 1.64E-03
MAF 803.15 569.52 -1.41 0.01
VIM 1566.36 1115.95 -1.4 2.05E-03
SLC17A7 4551 3265.07 -1.39 3.75E-03
C20orf103 757 549.81 -1.38 1.86E-03
ERGIC1 438.96 318.89 -1.38 1.97E-03
WBP1 738.53 533.3 -1.38 0.01
NBPF15 1655.5 1200.46 -1.38 0.01
RBM27 699.25 507.4 -1.38 0.03
FMN1 654.97 478.87 -1.37 4.18E-03
UBLCP1 470.02 343.63 -1.37 0.01
G3BP1 1085.28 789.47 -1.37 0.01
LARP1 637.13 464.03 -1.37 0.01
NFIL3 1328.63 969.84 -1.37 0.01
ACTG1 1057.05 769 -1.37 0.02
ARL6IP5 1527.02 1119.84 -1.36 6.57E-04
DOCK2 480.24 353.36 -1.36 0.01
UBE2E1 947.75 700.41 -1.35 4.64E-04
LOC51152 1332.27 983.73 -1.35 4.23E-03
IFNG 723.73 535.27 -1.35 0.02
ATP6V0E1 1311.93 982.19 -1.34 1.74E-04
BARX2 428.34 321.18 -1.33 1.83E-03
C7orf11 5095.03 3855.56 -1.32 2.81E-03
BASP1 527.27 401.79 -1.31 7.31E-04
SLC30A1 510.86 392.15 -1.3 1.19E-03
MGST3 1275.71 1013.36 -1.26 9.30E-05
Table 3.3.3.1 Transcripts down-regulated in VDR compared to MM.1R
84 transcripts were found to be down-regulated in bortezomib-resistant VDR
compared to parental MM.1R.
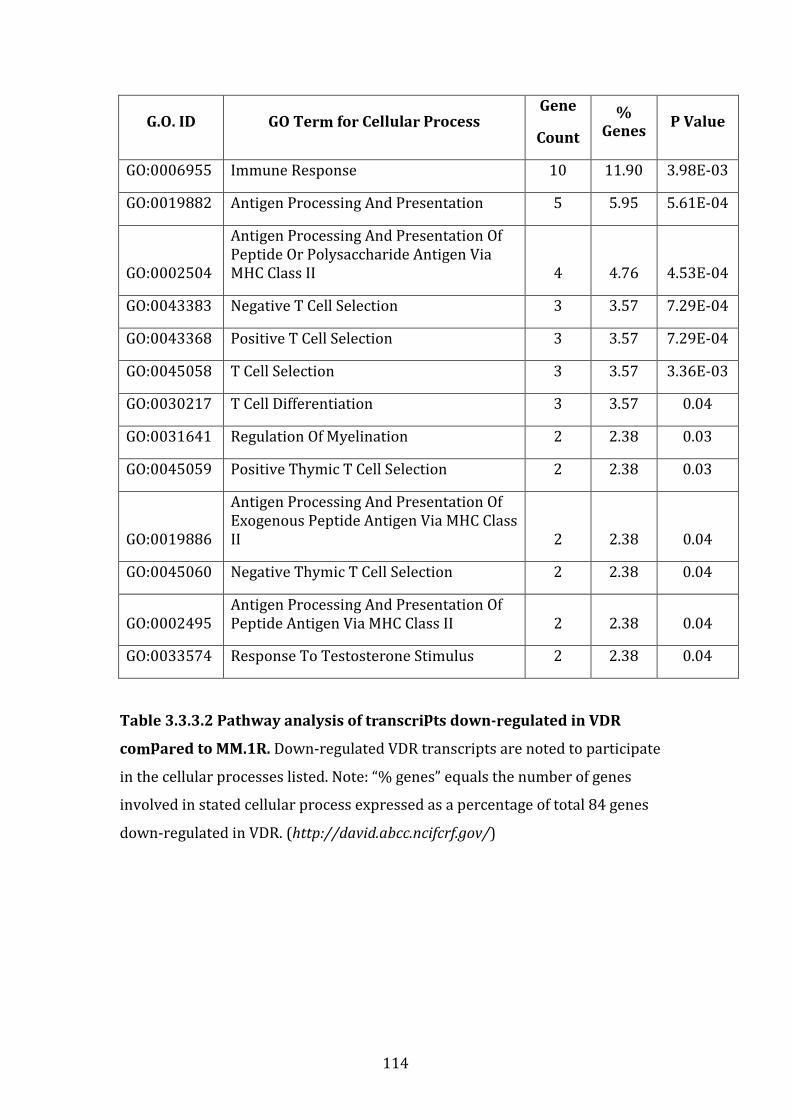
114
G.O. ID GO Term for Cellular Process Gene
Count
%
Genes P Value
GO:0006955 Immune Response 10 11.90 3.98E-03
GO:0019882 Antigen Processing And Presentation 5 5.95 5.61E-04
GO:0002504
Antigen Processing And Presentation Of
Peptide Or Polysaccharide Antigen Via
MHC Class II 4 4.76 4.53E-04
GO:0043383 Negative T Cell Selection 3 3.57 7.29E-04
GO:0043368 Positive T Cell Selection 3 3.57 7.29E-04
GO:0045058 T Cell Selection 3 3.57 3.36E-03
GO:0030217 T Cell Differentiation 3 3.57 0.04
GO:0031641 Regulation Of Myelination 2 2.38 0.03
GO:0045059 Positive Thymic T Cell Selection 2 2.38 0.03
GO:0019886
Antigen Processing And Presentation Of
Exogenous Peptide Antigen Via MHC Class
II 2 2.38 0.04
GO:0045060 Negative Thymic T Cell Selection 2 2.38 0.04
GO:0002495
Antigen Processing And Presentation Of
Peptide Antigen Via MHC Class II 2 2.38 0.04
GO:0033574 Response To Testosterone Stimulus 2 2.38 0.04
Table 3.3.3.2 Pathway analysis of transcripts down-regulated in VDR
compared to MM.1R. Down-regulated VDR transcripts are noted to participate
in the cellular processes listed. Note: “% genes” equals the number of genes
involved in stated cellular process expressed as a percentage of total 84 genes
down-regulated in VDR. (http://david.abcc.ncifcrf.gov/)
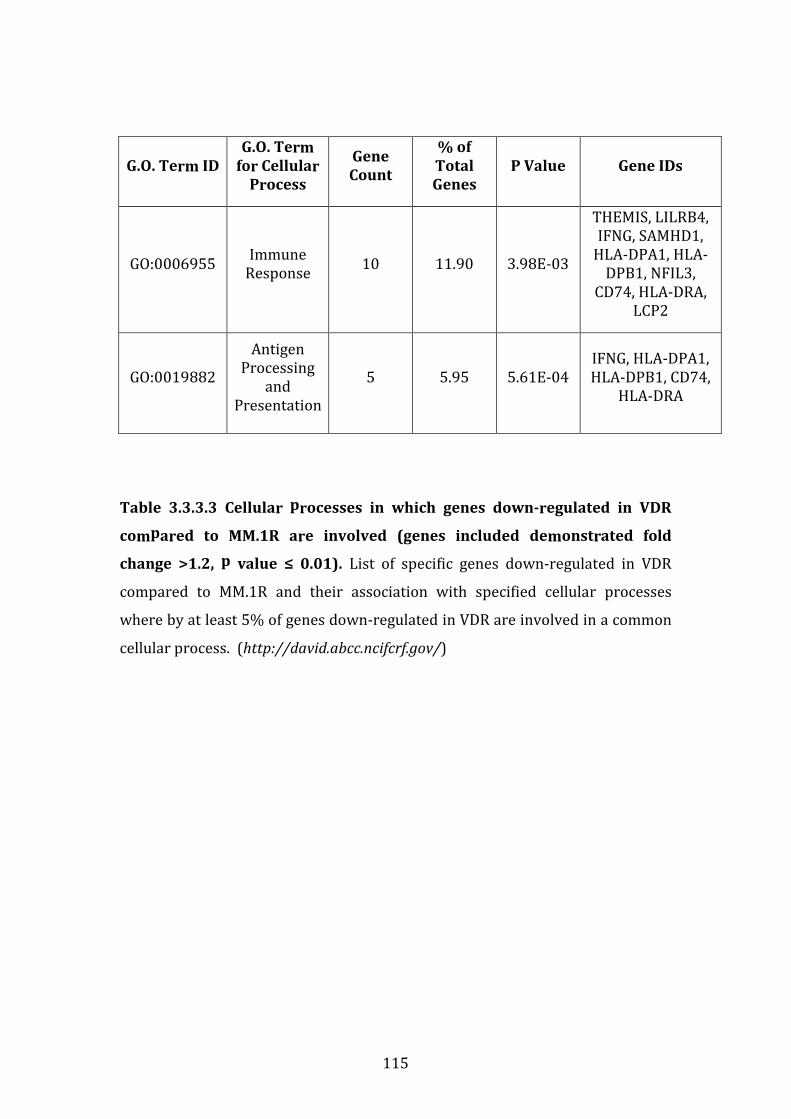
115
G.O. Term ID
G.O. Term
for Cellular
Process
Gene
Count
% of
Total
Genes
P Value Gene IDs
GO:0006955 Immune
Response 10 11.90 3.98E-03
THEMIS, LILRB4,
IFNG, SAMHD1,
HLA-DPA1, HLA-
DPB1, NFIL3,
CD74, HLA-DRA,
LCP2
GO:0019882
Antigen
Processing
and
Presentation
5 5.95 5.61E-04
IFNG, HLA-DPA1,
HLA-DPB1, CD74,
HLA-DRA
Table 3.3.3.3 Cellular processes in which genes down-regulated in VDR
compared to MM.1R are involved (genes included demonstrated fold
change >1.2, p value ≤ 0.01). List of specific genes down-regulated in VDR
compared to MM.1R and their association with specified cellular processes
where by at least 5% of genes down-regulated in VDR are involved in a common
cellular process. (http://david.abcc.ncifcrf.gov/)
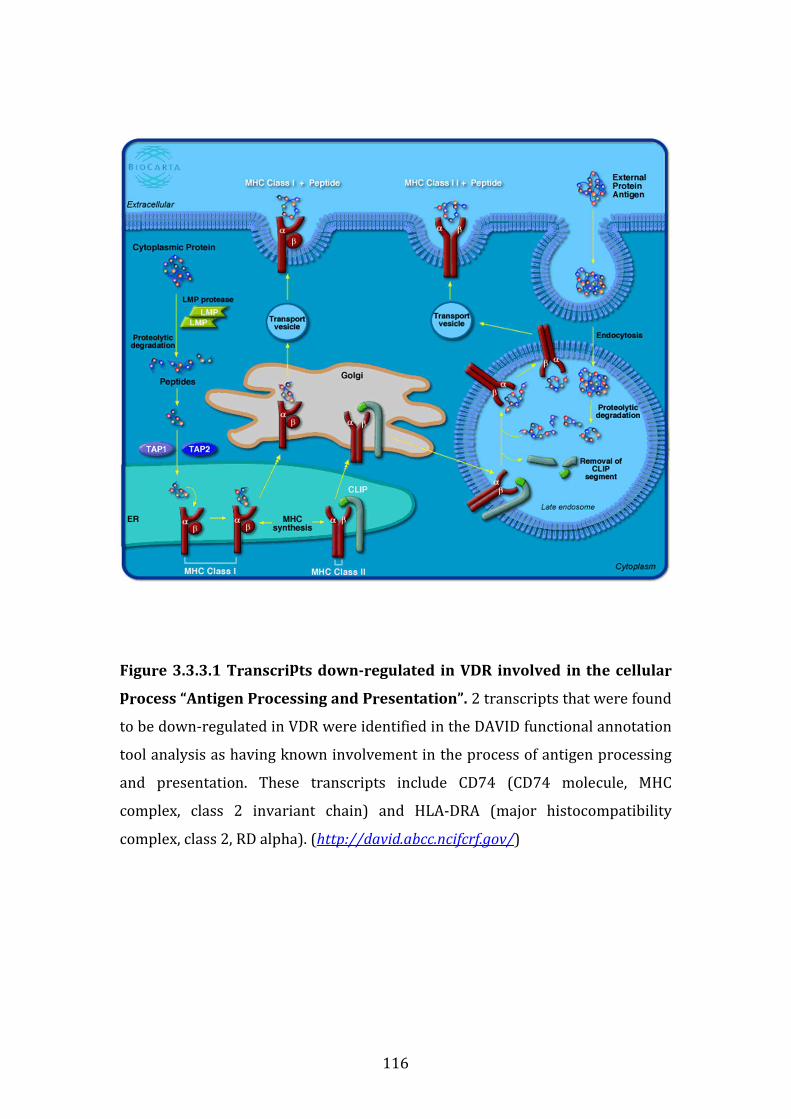
116
Figure 3.3.3.1 Transcripts down-regulated in VDR involved in the cellular
process “Antigen Processing and Presentation”. 2 transcripts that were found
to be down-regulated in VDR were identified in the DAVID functional annotation
tool analysis as having known involvement in the process of antigen processing
and presentation. These transcripts include CD74 (CD74 molecule, MHC
complex, class 2 invariant chain) and HLA-DRA (major histocompatibility
complex, class 2, RD alpha). (http://david.abcc.ncifcrf.gov/)
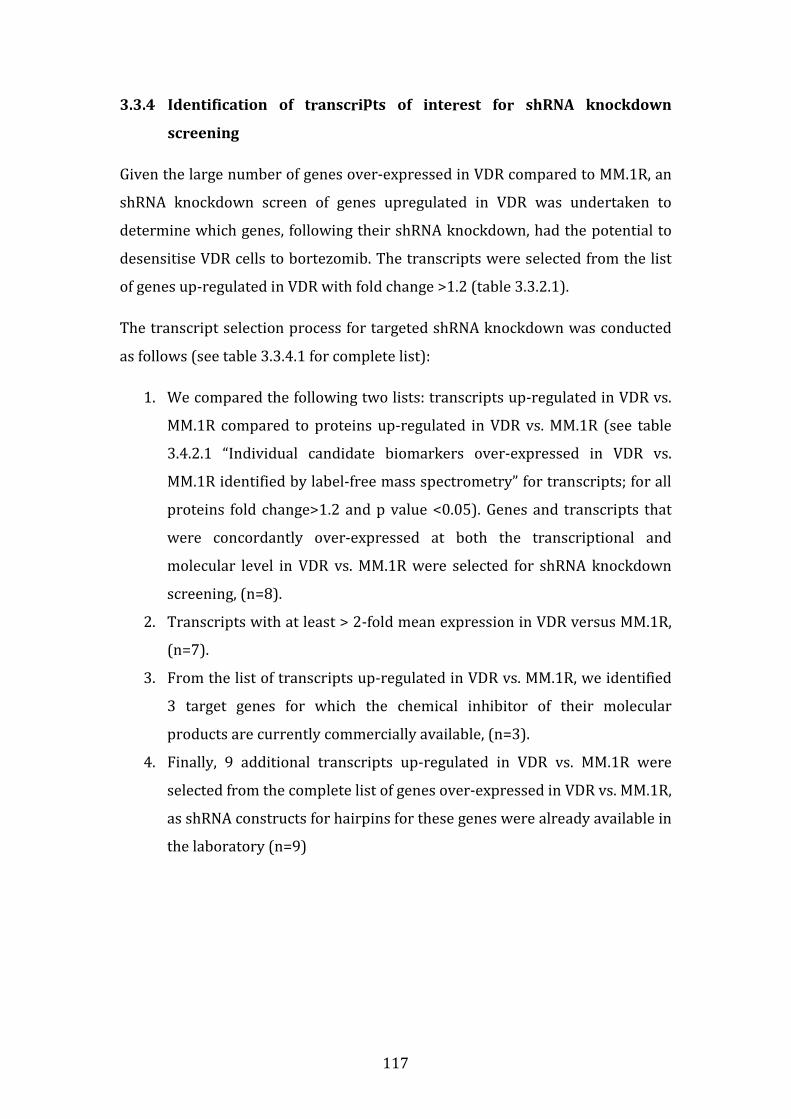
117
3.3.4 Identification of transcripts of interest for shRNA knockdown
screening
Given the large number of genes over-expressed in VDR compared to MM.1R, an
shRNA knockdown screen of genes upregulated in VDR was undertaken to
determine which genes, following their shRNA knockdown, had the potential to
desensitise VDR cells to bortezomib. The transcripts were selected from the list
of genes up-regulated in VDR with fold change >1.2 (table 3.3.2.1).
The transcript selection process for targeted shRNA knockdown was conducted
as follows (see table 3.3.4.1 for complete list):
1. We compared the following two lists: transcripts up-regulated in VDR vs.
MM.1R compared to proteins up-regulated in VDR vs. MM.1R (see table
3.4.2.1 “Individual candidate biomarkers over-expressed in VDR vs.
MM.1R identified by label-free mass spectrometry” for transcripts; for all
proteins fold change>1.2 and p value <0.05). Genes and transcripts that
were concordantly over-expressed at both the transcriptional and
molecular level in VDR vs. MM.1R were selected for shRNA knockdown
screening, (n=8).
2. Transcripts with at least > 2-fold mean expression in VDR versus MM.1R,
(n=7).
3. From the list of transcripts up-regulated in VDR vs. MM.1R, we identified
3 target genes for which the chemical inhibitor of their molecular
products are currently commercially available, (n=3).
4. Finally, 9 additional transcripts up-regulated in VDR vs. MM.1R were
selected from the complete list of genes over-expressed in VDR vs. MM.1R,
as shRNA constructs for hairpins for these genes were already available in
the laboratory (n=9)
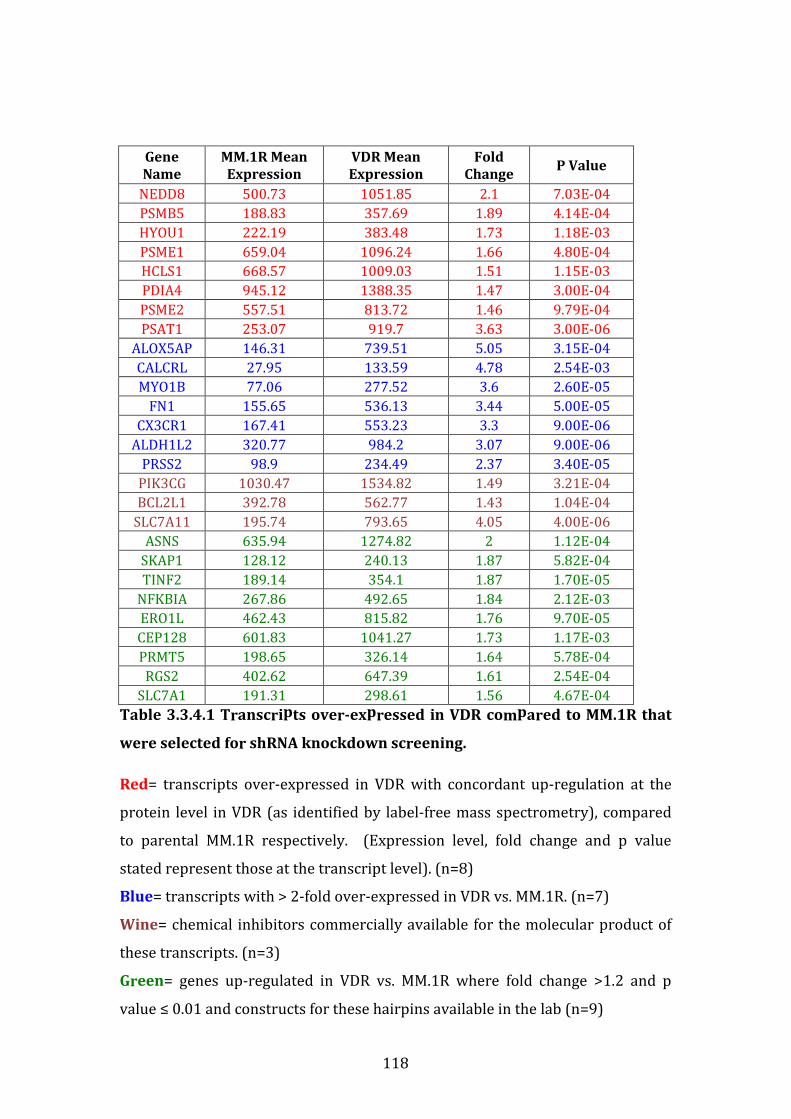
118
Gene
Name
MM.1R Mean
Expression
VDR Mean
Expression
Fold
Change P Value
NEDD8 500.73 1051.85 2.1 7.03E-04
PSMB5 188.83 357.69 1.89 4.14E-04
HYOU1 222.19 383.48 1.73 1.18E-03
PSME1 659.04 1096.24 1.66 4.80E-04
HCLS1 668.57 1009.03 1.51 1.15E-03
PDIA4 945.12 1388.35 1.47 3.00E-04
PSME2 557.51 813.72 1.46 9.79E-04
PSAT1 253.07 919.7 3.63 3.00E-06
ALOX5AP 146.31 739.51 5.05 3.15E-04
CALCRL 27.95 133.59 4.78 2.54E-03
MYO1B 77.06 277.52 3.6 2.60E-05
FN1 155.65 536.13 3.44 5.00E-05
CX3CR1 167.41 553.23 3.3 9.00E-06
ALDH1L2 320.77 984.2 3.07 9.00E-06
PRSS2 98.9 234.49 2.37 3.40E-05
PIK3CG 1030.47 1534.82 1.49 3.21E-04
BCL2L1 392.78 562.77 1.43 1.04E-04
SLC7A11 195.74 793.65 4.05 4.00E-06
ASNS 635.94 1274.82 2 1.12E-04
SKAP1 128.12 240.13 1.87 5.82E-04
TINF2 189.14 354.1 1.87 1.70E-05
NFKBIA 267.86 492.65 1.84 2.12E-03
ERO1L 462.43 815.82 1.76 9.70E-05
CEP128 601.83 1041.27 1.73 1.17E-03
PRMT5 198.65 326.14 1.64 5.78E-04
RGS2 402.62 647.39 1.61 2.54E-04
SLC7A1 191.31 298.61 1.56 4.67E-04
Table 3.3.4.1 Transcripts over-expressed in VDR compared to MM.1R that
were selected for shRNA knockdown screening.
Red= transcripts over-expressed in VDR with concordant up-regulation at the
protein level in VDR (as identified by label-free mass spectrometry), compared
to parental MM.1R respectively. (Expression level, fold change and p value
stated represent those at the transcript level). (n=8)
Blue= transcripts with > 2-fold over-expressed in VDR vs. MM.1R. (n=7)
Wine= chemical inhibitors commercially available for the molecular product of
these transcripts. (n=3)
Green= genes up-regulated in VDR vs. MM.1R where fold change >1.2 and p
value ≤ 0.01 and constructs for these hairpins available in the lab (n=9)
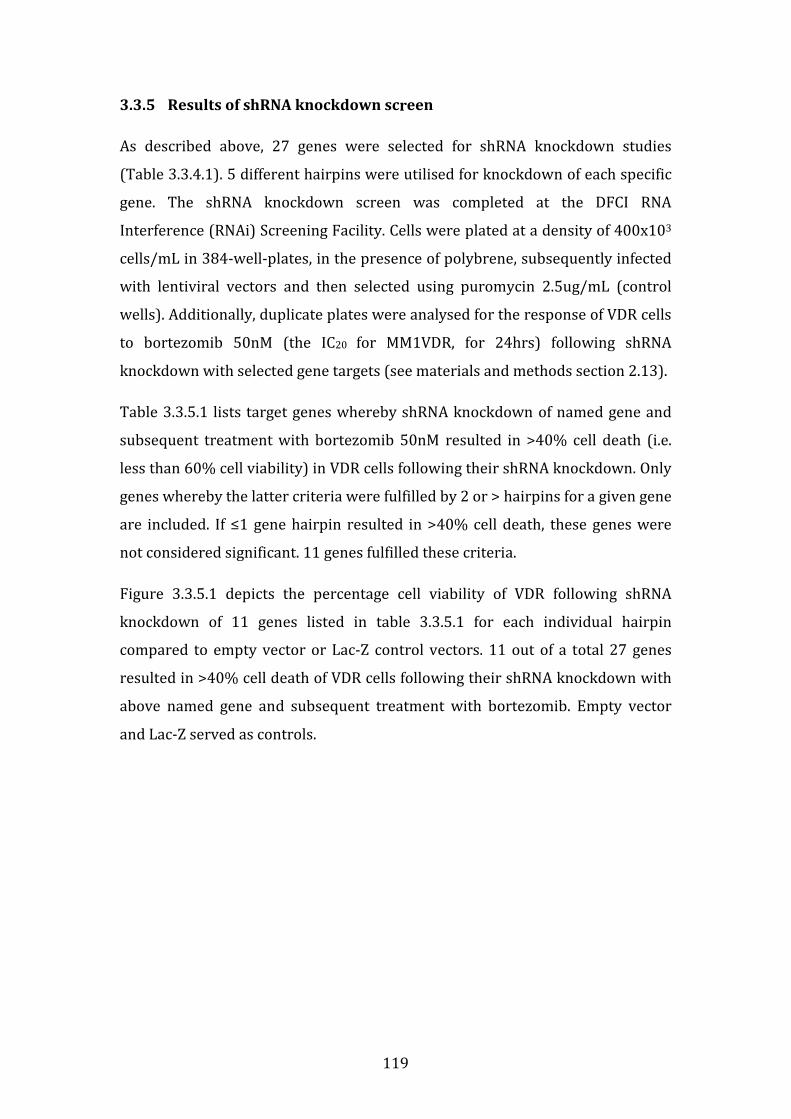
119
3.3.5 Results of shRNA knockdown screen
As described above, 27 genes were selected for shRNA knockdown studies
(Table 3.3.4.1). 5 different hairpins were utilised for knockdown of each specific
gene. The shRNA knockdown screen was completed at the DFCI RNA
Interference (RNAi) Screening Facility. Cells were plated at a density of 400x103
cells/mL in 384-well-plates, in the presence of polybrene, subsequently infected
with lentiviral vectors and then selected using puromycin 2.5ug/mL (control
wells). Additionally, duplicate plates were analysed for the response of VDR cells
to bortezomib 50nM (the IC20 for MM1VDR, for 24hrs) following shRNA
knockdown with selected gene targets (see materials and methods section 2.13).
Table 3.3.5.1 lists target genes whereby shRNA knockdown of named gene and
subsequent treatment with bortezomib 50nM resulted in >40% cell death (i.e.
less than 60% cell viability) in VDR cells following their shRNA knockdown. Only
genes whereby the latter criteria were fulfilled by 2 or > hairpins for a given gene
are included. If ≤1 gene hairpin resulted in >40% cell death, these genes were
not considered significant. 11 genes fulfilled these criteria.
Figure 3.3.5.1 depicts the percentage cell viability of VDR following shRNA
knockdown of 11 genes listed in table 3.3.5.1 for each individual hairpin
compared to empty vector or Lac-Z control vectors. 11 out of a total 27 genes
resulted in >40% cell death of VDR cells following their shRNA knockdown with
above named gene and subsequent treatment with bortezomib. Empty vector
and Lac-Z served as controls.
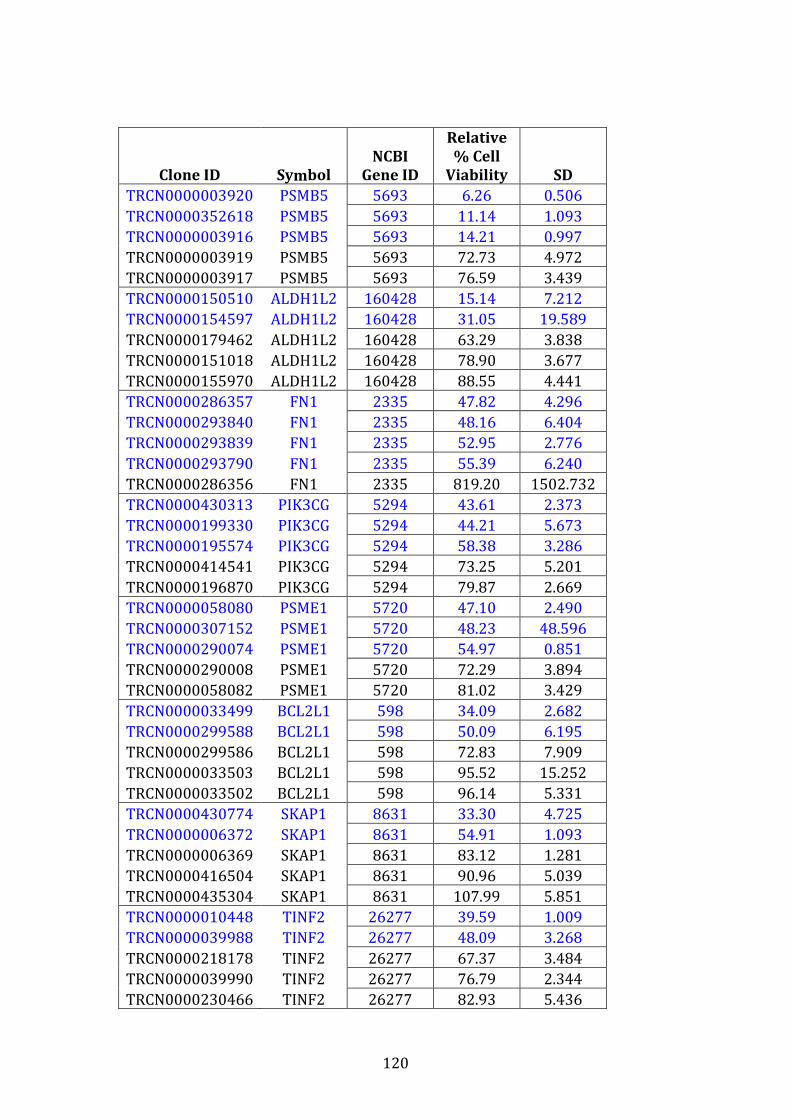
120
Clone ID Symbol
NCBI
Gene ID
Relative
% Cell
Viability SD
TRCN0000003920 PSMB5 5693 6.26 0.506
TRCN0000352618 PSMB5 5693 11.14 1.093
TRCN0000003916 PSMB5 5693 14.21 0.997
TRCN0000003919 PSMB5 5693 72.73 4.972
TRCN0000003917 PSMB5 5693 76.59 3.439
TRCN0000150510 ALDH1L2 160428 15.14 7.212
TRCN0000154597 ALDH1L2 160428 31.05 19.589
TRCN0000179462 ALDH1L2 160428 63.29 3.838
TRCN0000151018 ALDH1L2 160428 78.90 3.677
TRCN0000155970 ALDH1L2 160428 88.55 4.441
TRCN0000286357 FN1 2335 47.82 4.296
TRCN0000293840 FN1 2335 48.16 6.404
TRCN0000293839 FN1 2335 52.95 2.776
TRCN0000293790 FN1 2335 55.39 6.240
TRCN0000286356 FN1 2335 819.20 1502.732
TRCN0000430313 PIK3CG 5294 43.61 2.373
TRCN0000199330 PIK3CG 5294 44.21 5.673
TRCN0000195574 PIK3CG 5294 58.38 3.286
TRCN0000414541 PIK3CG 5294 73.25 5.201
TRCN0000196870 PIK3CG 5294 79.87 2.669
TRCN0000058080 PSME1 5720 47.10 2.490
TRCN0000307152 PSME1 5720 48.23 48.596
TRCN0000290074 PSME1 5720 54.97 0.851
TRCN0000290008 PSME1 5720 72.29 3.894
TRCN0000058082 PSME1 5720 81.02 3.429
TRCN0000033499 BCL2L1 598 34.09 2.682
TRCN0000299588 BCL2L1 598 50.09 6.195
TRCN0000299586 BCL2L1 598 72.83 7.909
TRCN0000033503 BCL2L1 598 95.52 15.252
TRCN0000033502 BCL2L1 598 96.14 5.331
TRCN0000430774 SKAP1 8631 33.30 4.725
TRCN0000006372 SKAP1 8631 54.91 1.093
TRCN0000006369 SKAP1 8631 83.12 1.281
TRCN0000416504 SKAP1 8631 90.96 5.039
TRCN0000435304 SKAP1 8631 107.99 5.851
TRCN0000010448 TINF2 26277 39.59 1.009
TRCN0000039988 TINF2 26277 48.09 3.268
TRCN0000218178 TINF2 26277 67.37 3.484
TRCN0000039990 TINF2 26277 76.79 2.344
TRCN0000230466 TINF2 26277 82.93 5.436
121
Clone ID Symbol
NCBI
Gene ID
Relative %
Cell
Viability SD
TRCN0000078149 ALOX5AP 241 40.73 4.037
TRCN0000078150 ALOX5AP 241 46.14 3.451
TRCN0000078152 ALOX5AP 241 82.93 5.652
TRCN0000078151 ALOX5AP 241 95.38 5.026
TRCN0000078148 ALOX5AP 241 98.37 5.846
TRCN0000142061 CEP128 145508 42.04 4.316
TRCN0000141520 CEP128 145508 45.38 3.412
TRCN0000144988 CEP128 145508 72.10 3.371
TRCN0000145094 CEP128 145508 75.97 5.388
TRCN0000144220 CEP128 145508 82.62 3.343
TRCN0000356922 CX3CR1 1524 46.58 2.845
TRCN0000011309 CX3CR1 1524 52.63 5.111
TRCN0000356923 CX3CR1 1524 64.41 7.534
TRCN0000011312 CX3CR1 1524 74.70 3.289
TRCN0000356860 CX3CR1 1524 79.59 9.859
TRCN0000000000 EMPTY -1 101.35 4.50
TRCN0000000000 EMPTY -1 101.45 3.21
TRCN0000000000 EMPTY -1 91.64 11.82
TRCN0000000000 EMPTY -1 90.12 9.99
TRCN0000000000 EMPTY -1 101.70 6.18
TRCN0000072240 lacZ -15 93.14 7.02
TRCN0000072236 lacZ -15 78.41 2.20
TRCN0000072242 lacZ -15 84.85 2.75
TRCN0000072242 lacZ -15 78.52 5.86
TRCN0000072236 lacZ -15 85.73 10.27
Table 3.3.5.1 Results of shRNA knockdown screen. List of 5 hairpins/clone
IDs for individual genes, NCBI gene ID, and relative cell viability of VDR cells
following their shRNA knockdown with each individual hairpin and subsequent
bortezomib treatment. Note: blue text represents shRNAs that when
incorporated into VDR cells and VDR subsequently exposure to bortezomib
50nM for 24 hours, results in <60% cell viability of VDR cells (or >40% cell
death). Relative cell viability of control (“empty” vector or lac Z also included).
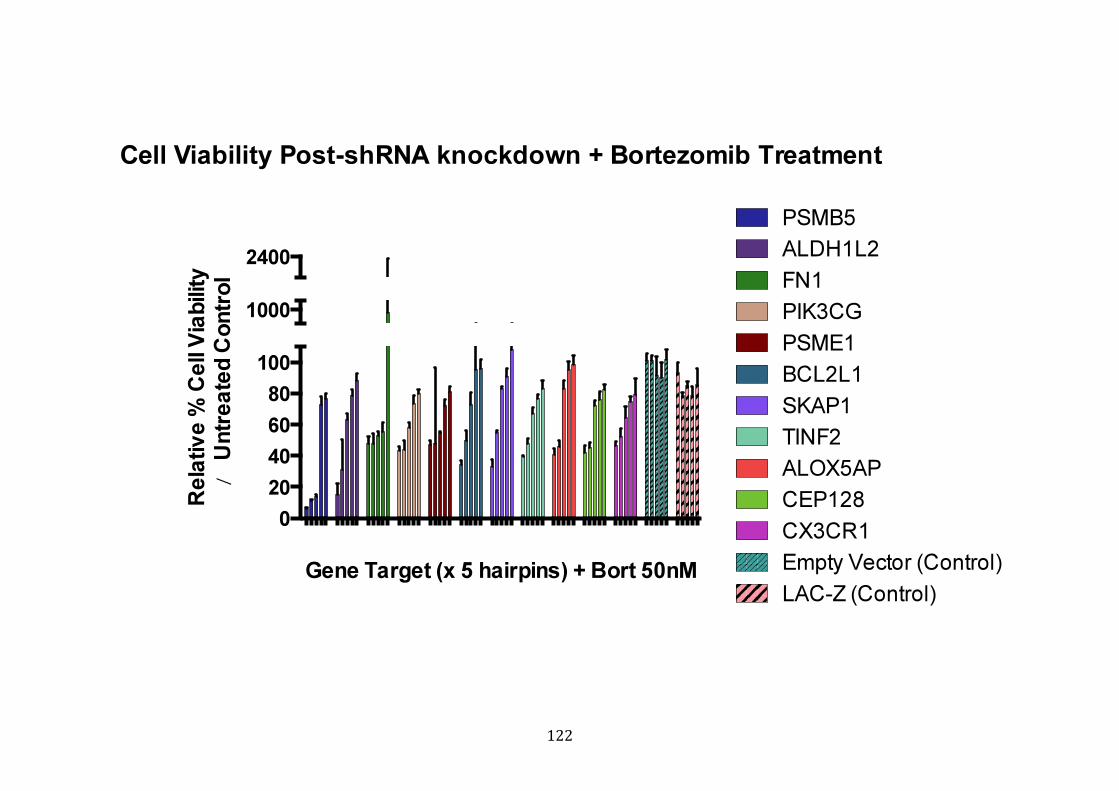
122
Cell Viability Post-shRNA knockdown + Bortezomib Treatment
0
20
40
60
80
100
1000
2400
Gene Target (x 5 hairpins) + Bort 50nM
Rela
tiv
e %
Cell
Via
bili
ty
vs
. Un
tre
ate
d C
on
tro
lPSMB5
ALDH1L2
FN1
PIK3CG
PSME1
BCL2L1
SKAP1
TINF2
ALOX5AP
CEP128
CX3CR1
Empty Vector (Control)
LAC-Z (Control)
/
123
Figure 3.3.5.1 Relative cell viability of VDR cells following shRNA knockdown of select target genes and subsequent treatment
with bortezomib 50nM for 24 hours. Figure depicts the percentage cell viability of VDR following shRNA knockdown of 11 genes or
control genes (those listed in table 3.3.5.1) for each 5 individual hairpins divided by untreated control. In total, 11 out of 27 genes
resulted in >40% relative cell death of VDR cells following their shRNA knockdown with above named gene and subsequent treatment
with bortezomib. Empty vector and LAC-Z served as control genes and are also depicted here. (Note: “relative cell viability” here
represents the percentage of treated MM cells divided by percentage of untreated MM cells.)
124
3.3.6 Validation of shRNA knockdown of PSMB5
Given the known inhibitory effect of bortezomib on PSMB5 specifically as it’s
major mode of cell death of myeloma cells, and the success of PSMB5 shRNA
knockdown in resensitising VDR cells to bortezomib, we chose to validate this
gene knockdown.
MM.1R and VDR cells again underwent shRNA knockdown of PSMB5 or control
vector. First, cell lysates were collected following shRNA knockdown of PSMB5
or control vector, and immunoblot confirmed the successful shRNA knockdown
of PSMB5 gene in MM.1R and VDR for PSMB5- associated hairpins E, F, G and H
(see materials and methods 2.13), (Figure 3.3.6.1).
Figure 3.3.6.2 depicts the cell viability of MM1R and VDR following PSMB5
knockdown with control hairpins or PSMB5 hairpins and subsequent
bortezomib treatment (0-20nM). In MM.1R, shRNA knockdown did not alter
sensitivity to bortezomib. In VDR, shRNA knockdown of PSMB5-hairpins E, H
and G followed by treatment with bortezomib 20nM and 40nM resulted in
significant increase in cell death of VDR cells compared to controls.
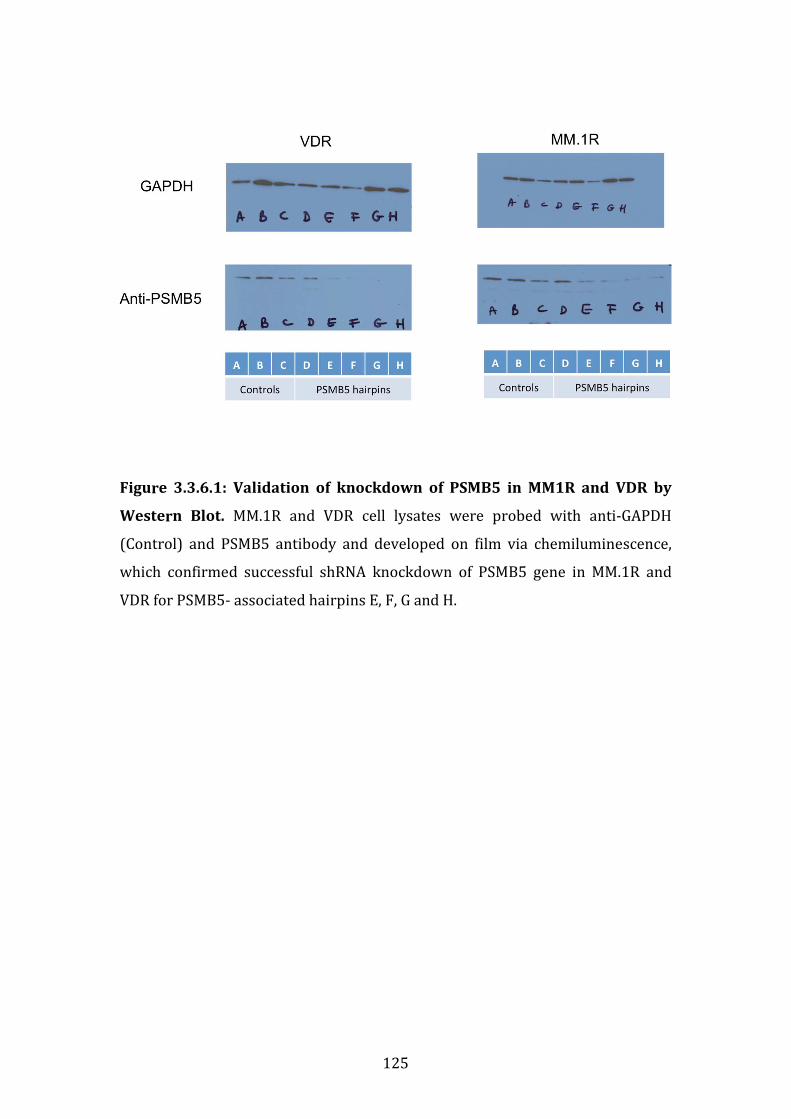
125
Figure 3.3.6.1: Validation of knockdown of PSMB5 in MM1R and VDR by
Western Blot. MM.1R and VDR cell lysates were probed with anti-GAPDH
(Control) and PSMB5 antibody and developed on film via chemiluminescence,
which confirmed successful shRNA knockdown of PSMB5 gene in MM.1R and
VDR for PSMB5- associated hairpins E, F, G and H.
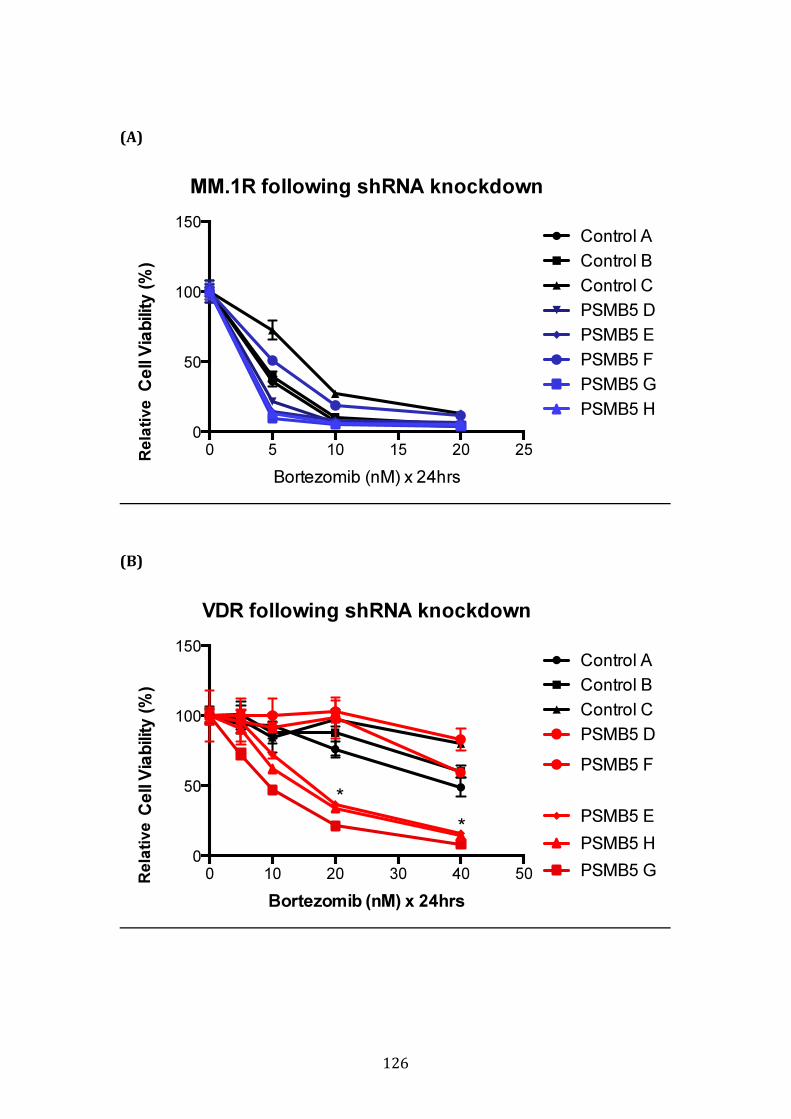
126
(A)
(B)
MM.1R following shRNA knockdown
Bortezomib (nM) x 24hrs
Ce
ll V
iab
ility
(%
)
0 5 10 15 20 25
0
50
100
150Control A
Control B
Control C
PSMB5 D
PSMB5 E
PSMB5 F
PSMB5 G
PSMB5 H
VDR following shRNA knockdown
Bortezomib (nM) x 24hrs
Ce
ll V
iab
ility
(%
)
0 10 20 30 40 50
0
50
100
150Control A
Control B
Control C
PSMB5 D
PSMB5 E
PSMB5 F
PSMB5 G
PSMB5 H
*
*
Rela
tive
R
ela
tive
127
Figure 3.3.6.2: Cell viability of VDR and MM1R following PSMB5 knockdown
post-bortezomib treatment. (A) In MM.1R, shRNA knockdown did not alter
sensitivity to bortezomib. (B) In VDR, shRNA knockdown of PSMB5-hairpins E, H
and G followed by treatment with bortezomib 20nM and 40nM resulted in
significant increase in cell death of VDR cells compared to controls. (Note: *=
p<0.05 for PSMB5 hairpins E, G, H compared to control vector).
128
3.3.7 Conclusion of gene expression profiling studies
In summary, 20,724 genes were evaluated in MM1R versus VDR cell lines. Genes
whereby fold change between the two conditions was >1.2 and demonstrated a p
value ≤ 0.01, of which 437 transcripts fulfilled this criteria, were included for
further studies. 353 were over-expressed in VDR compared to MM.1R. In
comparison only 84 genes were down-regulated in VDR compared to MM.1R.
The reasoning for the discrepancy between number of genes up-regulated versus
down-regulated is unclear.
Pathway analysis again via DAVID functional annotation tool revealed “cellular
apoptosis” as a specific pathway in which 4 transcripts up-regulated in VDR play
a role. These genes include CFLAR, CASP8, CASP10, and NFKBIA. By comparison,
VDR transcripts that were down-regulated compared to MM.1R were noted to
participate in a number of cellular processes mainly concerned with the immune
system for example antigen processing and presentation, immune response, T
cell differentiation and T cell selection, with specific attention to the antigen-
presenting pathway that involved CD74 and HLA-DRA.
A number of specific genes were selected for an shRNA knockdown screen, that
included transcripts over-expressed in VDR with concordant up-regulation at the
protein level in VDR (as identified by label-free mass spectrometry), transcripts
with > 2-fold over-expressed in VDR vs. MM.1R, transcripts whereby chemical
inhibitors are currently commercially available for the molecular product of
these transcripts, and a set of transcripts for which shRNAs were available were
selected from the complete list of all genes up-regulated in VDR vs. MM.1R where
fold change >1.2 and p value ≤ 0.01. Of 27 genes investigated in the shRNA
screen, which involved shRNA knock down of a specific target, with 5 hairpins in
use for each target individually, 11 genes were found to, following shRNA
knockdown and subsequent treatment with bortezomib (IC20), result in >40%
cell death of VDR cells compared to control hairpins.
Given that bortezomib specifically binds PSMB5 in myeloma cell lines and thus
induces cell death secondary to inhibition of the proteasome pathway, we chose
129
to further validate the role of PSMB5 knockdown in resensitisation of VDR cells
to bortezomib. First we demonstrated successful shRNA knockdown of PSMB5 in
MM.1R and VDR by immunoblot. Secondly, we demonstrated that shRNA
knockdown of PSMB5 and subsequent treatment of VDR cells (used at even
lower concentrations of bortezomib compared to initial screen: 50nM vs. 20-
40nM), resulted in significant resensitisation of VDR to bortezomib.
Our validation studies were somewhat limited by the technical challenge of
shRNA knockdown of semi-adherent cell lines, which when not adherent to the
surface of the tissue culture flask, prove to be much more difficult to successfully
infect with lentivirus and then subsequent selection initially resulted in cell
death of almost all cells. We overcame this difficulty by centrifuging the tissue
culture plates following infection with lentivirus for 30 minutes post-infection, to
allow both virus and cells to adhere to the base of the plates.
Future work could include validation studies of the remaining 10 genes that,
following their shRNA knockdown, resulted in a marked increase in sensitivity to
bortezomib in otherwise bortezomib-resistant VDR cells.
130
3.4 PROTEOMIC PROFILE OF MM.1R AND VDR BY LABEL-FREE
MASS SPECTROMETRY
3.4.1 Introduction
The role of gene expression profiling in MM patients for number of years as a
highly valued predictor of clinical outcome and response to therapy has been
well documented.[115, 116] More recently, advances in determining the proteomic
profile of MM patients by label-free mass spectrometry has provided the field of
haematology research with insight into biomarkers predicting response to
therapy.[117] Therefore we next examined the proteomic profiles of the isogenic
cell lines MM.1R and VDR, in addition to investigating the proteins differentially
expressed following their treatment with bortezomib.
We incubated MM.1R or VDR cells at equal cell densities over-night to allow the
cells to adhere and subsequently exposed them to bortezomib 40nM for 8 hours
in culture (or media only was added to the controls). Subsequently all conditions
were collected, counted and stored as cell pellets at -80°C in preparation for
label-free mass spectrometry (see Materials and Methods 2.15). We first
compared the proteomic profiles of MM.1R vs. VDR without drug treatment, next
each cell line following bortezomib treatment compared to its respective control,
and finally comparison of both cell lines following bortezomib treatment (see
table 3.4.1.1 for overview of comparative analyses).
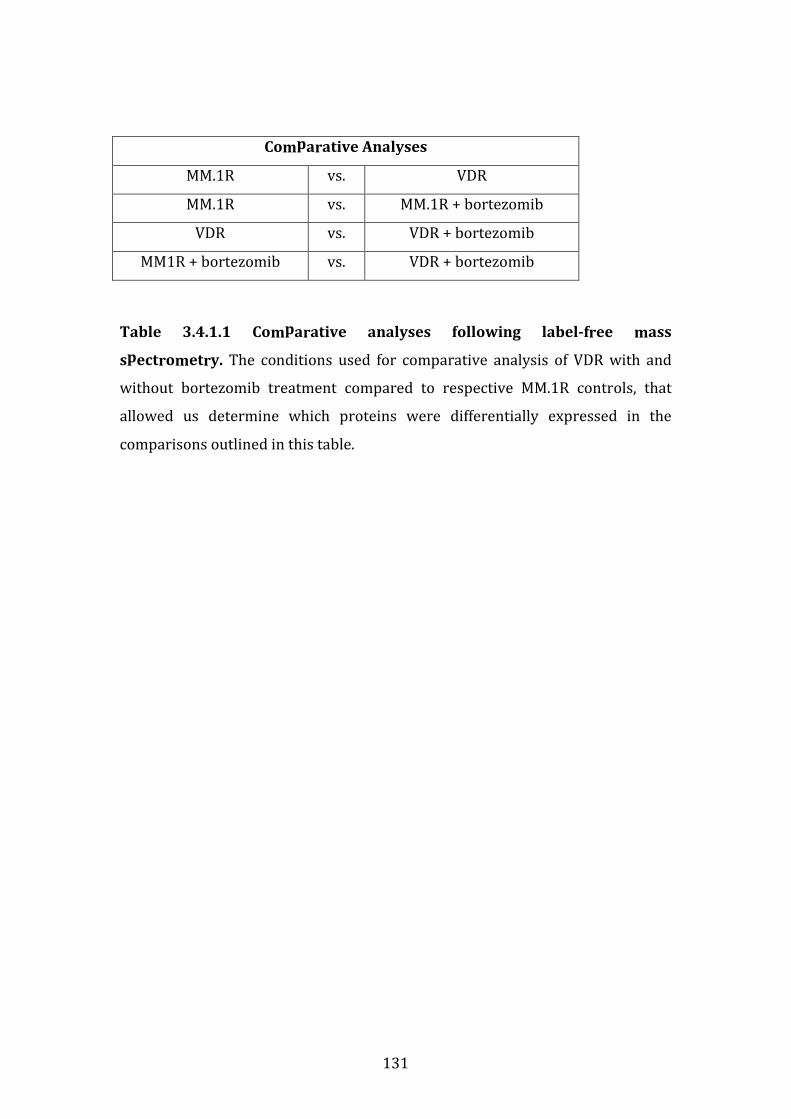
131
Comparative Analyses
MM.1R vs. VDR
MM.1R vs. MM.1R + bortezomib
VDR vs. VDR + bortezomib
MM1R + bortezomib vs. VDR + bortezomib
Table 3.4.1.1 Comparative analyses following label-free mass
spectrometry. The conditions used for comparative analysis of VDR with and
without bortezomib treatment compared to respective MM.1R controls, that
allowed us determine which proteins were differentially expressed in the
comparisons outlined in this table.
132
3.4.2 Proteins over-expressed in VDR vs. MM.1R
3.4.2.1 Individual proteins over-expressed in VDR vs. MM.1R
We identified 238 proteins differentially expressed in the MM.1R vs. VDR
comparison. Of these, 106 proteins had the highest expression level in VDR
compared to MM.1R (p<0.05), of which 36 of these had a fold change >2 (table
3.4.2.1). Two proteins displayed very high protein fold changes in VDR compared
to MM.1R (>200 fold change for each, p<0.05). These included:
(a) Ubiquitin-conjugating enzyme E2 N (UBE2N/ Ubc13) displayed a 433-
fold change increase in VDR (p=0.04). This protein plays a major role in
protein polyubiquitination in preparation for degradation, in addition to
activation of NF- κB in vitro. A small molecule inhibitor specifically
targeting this protein is presently commercially available and has been
shown to be a successful anti-tumour agent in diffuse large B cell
lymphoma in vitro. [118] However, it is important to note that the baseline
expression level of this protein was almost zero in MM.1R, and thus the
high protein fold change detected in VDR is potentially misleading as
UBE2N levels are low also in VDR at baseline in comparison to other
molecules detected by this method of quantification of protein
abundance.
(b) SH3 domain-binding glutamic acid-rich-like protein 3 (SH3BGRL3) had a
215-fold increase in VDR vs. MM.1R (p=0.04), an anti-apoptotic molecule
that safeguards both normal and cancer cells from tumour-necrosis-
factor (TNF)-induced apoptosis.[119] On review of the raw data of protein
abundance, SH3BGRL3 has a very low expression level in MM.1R and
markedly high expression levels in VDR, similar to the baseline
expression levels of most proteins within this analysis, thereby
encouraging the validity of this result.
In relation to both proteins UBE2N and SH3BGRL3, an alternative explanation
for the very high fold change observed in VDR may be that these proteins are not
expressed at all in MM.1R however are expressed in VDR, which in contrast
suggests a high potential for this protein in bortezomib resistance in VDR. Initial
133
examination into whether or not these proteins are implicated in bortezomib
pathogenesis in VDR should be first initiated by validating their expression levels
by immunoblot.
CCL3/MIP1-α (C-C motif ligand 3/ macrophage inflammatory protein 1-alpha)
was over-expressed in VDR compared to MM.1R with a 22-fold change
(p=0.013). CCL3 has been well documented previously in its role as a stimulator
of osteoclastogenesis, inhibition of osteoblastogenesis, and thus its contribution
to myelomatous bone disease.[85, 120] This protein is highly expressed in myeloma
cell lines and an inhibitor of CLL1, through which CCL3, is signals in currently in
pre-clinical investigation and has shown promising anti-myelomatous and anti-
osteolytic effects in a MM in vivo mouse model.[121] In the setting of the bone
marrow microenvironment in vivo, CCL3 could potentially markedly augment the
proliferation capacity and pro-osteolytic activity of VDR cells given its marked
over-expression compared to bortezomib sensitive MM.1R.
In addition, other proteins which are well known for their role in MM
pathogenesis, for example NEDD8, were found to be over-expressed 2.1-fold in
VDR (p=0.003). The success of NEDD8 inhibition by its selective inhibitor,
MLN4924 has been well documented and is now in phase 1 clinical trials for
relapsed/refractory MM and lymphoma. [34] In addition, PSMB5 protein had a
3.8-fold increase expression level in VDR vs. MM.1R (p=0.0004).
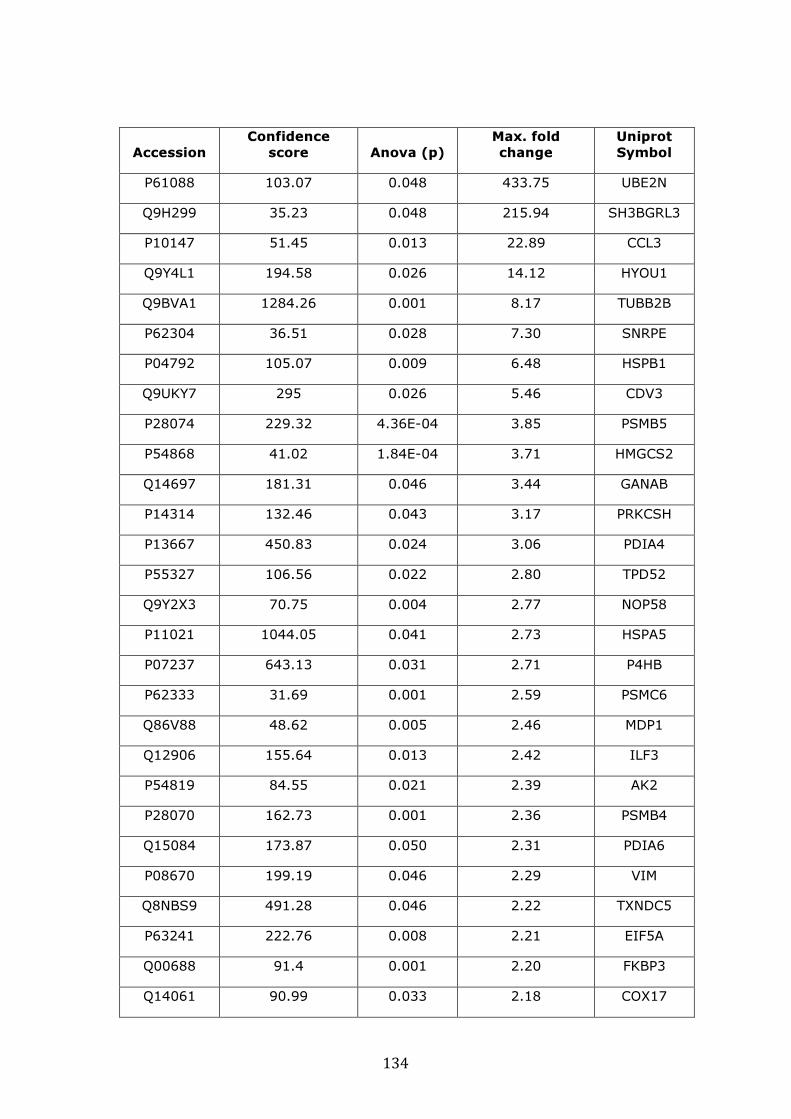
134
Accession
Confidence
score Anova (p)
Max. fold
change
Uniprot
Symbol
P61088 103.07 0.048 433.75 UBE2N
Q9H299 35.23 0.048 215.94 SH3BGRL3
P10147 51.45 0.013 22.89 CCL3
Q9Y4L1 194.58 0.026 14.12 HYOU1
Q9BVA1 1284.26 0.001 8.17 TUBB2B
P62304 36.51 0.028 7.30 SNRPE
P04792 105.07 0.009 6.48 HSPB1
Q9UKY7 295 0.026 5.46 CDV3
P28074 229.32 4.36E-04 3.85 PSMB5
P54868 41.02 1.84E-04 3.71 HMGCS2
Q14697 181.31 0.046 3.44 GANAB
P14314 132.46 0.043 3.17 PRKCSH
P13667 450.83 0.024 3.06 PDIA4
P55327 106.56 0.022 2.80 TPD52
Q9Y2X3 70.75 0.004 2.77 NOP58
P11021 1044.05 0.041 2.73 HSPA5
P07237 643.13 0.031 2.71 P4HB
P62333 31.69 0.001 2.59 PSMC6
Q86V88 48.62 0.005 2.46 MDP1
Q12906 155.64 0.013 2.42 ILF3
P54819 84.55 0.021 2.39 AK2
P28070 162.73 0.001 2.36 PSMB4
Q15084 173.87 0.050 2.31 PDIA6
P08670 199.19 0.046 2.29 VIM
Q8NBS9 491.28 0.046 2.22 TXNDC5
P63241 222.76 0.008 2.21 EIF5A
Q00688 91.4 0.001 2.20 FKBP3
Q14061 90.99 0.033 2.18 COX17

135
Accession
Confidence
score Anova (p)
Max. fold
change
Uniprot
Symbol
P10809 942.81 0.010 2.16 HSPD1
P27797 167.72 0.049 2.14 CALR
Q15843 50.64 0.004 2.14 NEDD8
Q9UL46 514.43 1.51E-04 2.11 PSME2
P61604 235.75 0.001 2.07 HSPE1
Q9BY43 118.65 0.001 2.06 CHMP4A
O75874 97.43 0.003 2.02 IDH1
P62937 840.02 0.009 2.00 PPIA
Table 3.4.2.1 Individual candidate biomarkers over-expressed in VDR vs.
MM.1R identified by label-free mass spectrometry. 106 proteins were over-
expressed in VDR compared to parental MM.1R and those with protein fold
change ≥2 are shown (p<0.05). UBE2N and SH3BGRL3 are markedly over-
expressed in VDR compared to MM.1R. NEDD8 and PSMB5, as anticipated, are
also over-expressed in the VDR cell line.
136
3.4.2.2 Functional protein-association mapping of proteins over-
expressed in VDR vs. MM.1R
In addition, functional protein association mapping of proteins with known
direct interactions as demonstrated by STRING networking (“Search Tool for the
Retrieval of Interacting Genes/Proteins”, http://string-db.org/) revealed the heat
shock proteins (HSP) (HSPB1, HSPE1, HSPD1, HSPA5) as a highly interactive
group of potential biomarkers that were over-expressed in VDR compared to
MM.1R, that had direct protein-to-protein interactions with a number of other
molecules that were concomitantly over-expressed in VDR (figure 3.4.2.2.1). The
heat shock proteins have been well documented for their role in MM
pathogenesis and specific inhibitors of HSP90AA1 (heat shock 90kDa AA1)
protein have completed phase 1 clinical trials.[122-125] HSP90AA1 itself was not
identified as having statistically significant over-expression in VDR, however
over-expression of HSPE1, HSPD1 and HSPD5, which interact with HSP90AA1
was observed (see figure 3.4.2.2.2 for interaction modelling).
Using the DAVID functional annotation tool (http://david.abcc.ncifcrf.gov/) a
number of proteins over-expressed in VDR compared to MM.1R were involved in
a number of cellular processes implicated in the pathogenesis of malignancy
including regulation of apoptosis, regulation of cellular metabolic processes,
cellular homeostasis, cell cycle process, and proteasomal ubiquitin-dependent
protein catabolic process, adjusted p value <0.05 (table 3.4.2.2.1).
Finally, 4 proteins that have established involvement in the proteasome-
ubiquitination pathway are displayed in Figure 3.4.2.2.3, which again are over-
expressed in VDR compared to MM.1R by label-free mass spectrometry (with
fold change >2, p<0.05) were found to be involved in the proteasome-
ubiquitination pathway, and these include PSME2, PSMC6, PSMB4 and PSMB5.
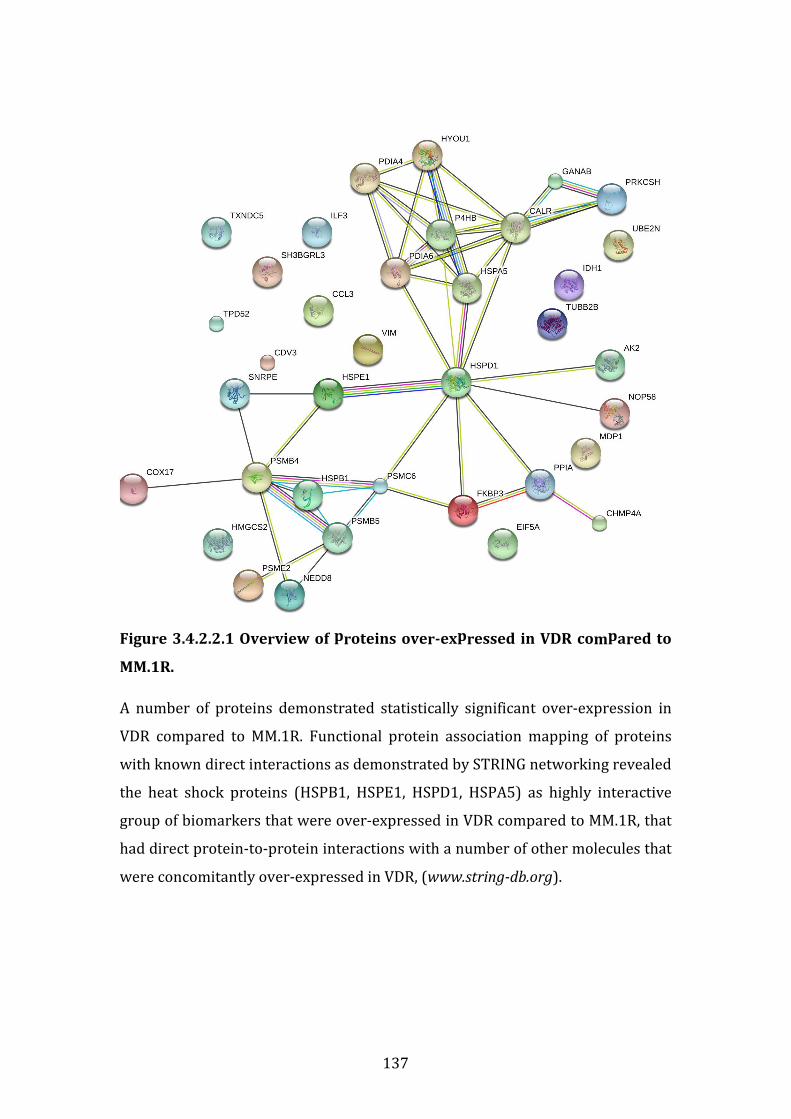
137
Figure 3.4.2.2.1 Overview of proteins over-expressed in VDR compared to
MM.1R.
A number of proteins demonstrated statistically significant over-expression in
VDR compared to MM.1R. Functional protein association mapping of proteins
with known direct interactions as demonstrated by STRING networking revealed
the heat shock proteins (HSPB1, HSPE1, HSPD1, HSPA5) as highly interactive
group of biomarkers that were over-expressed in VDR compared to MM.1R, that
had direct protein-to-protein interactions with a number of other molecules that
were concomitantly over-expressed in VDR, (www.string-db.org).
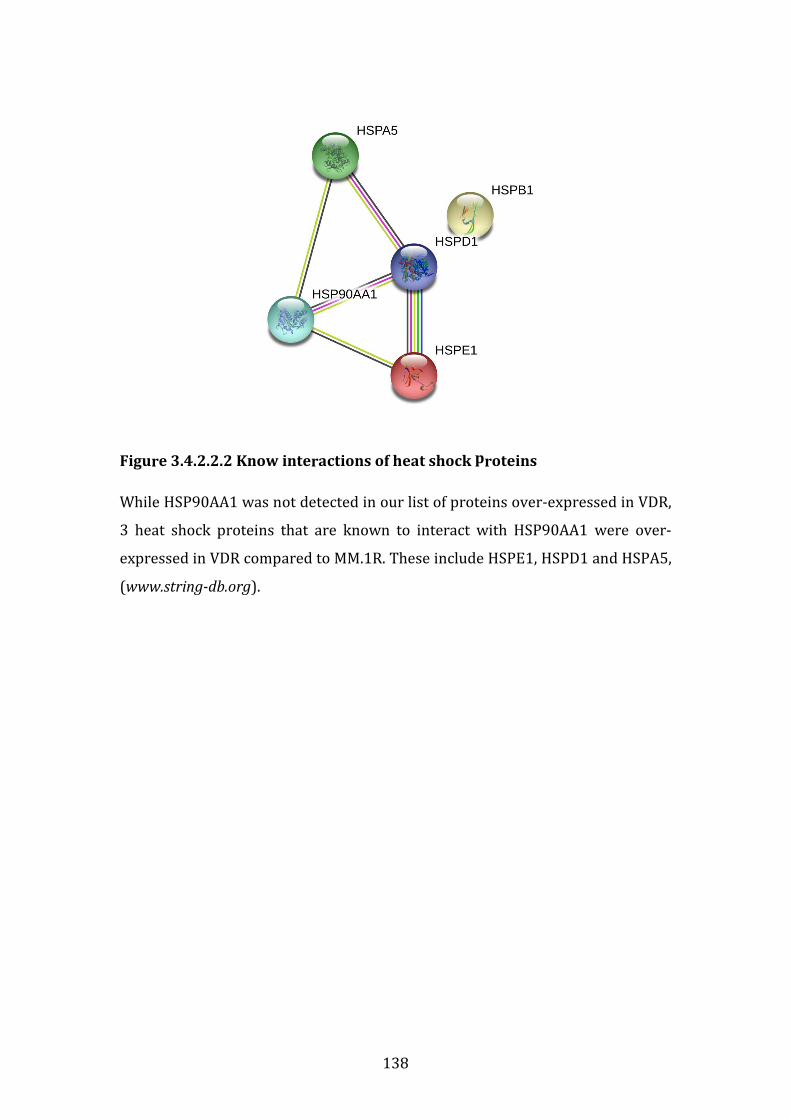
138
Figure 3.4.2.2.2 Know interactions of heat shock proteins
While HSP90AA1 was not detected in our list of proteins over-expressed in VDR,
3 heat shock proteins that are known to interact with HSP90AA1 were over-
expressed in VDR compared to MM.1R. These include HSPE1, HSPD1 and HSPA5,
(www.string-db.org).
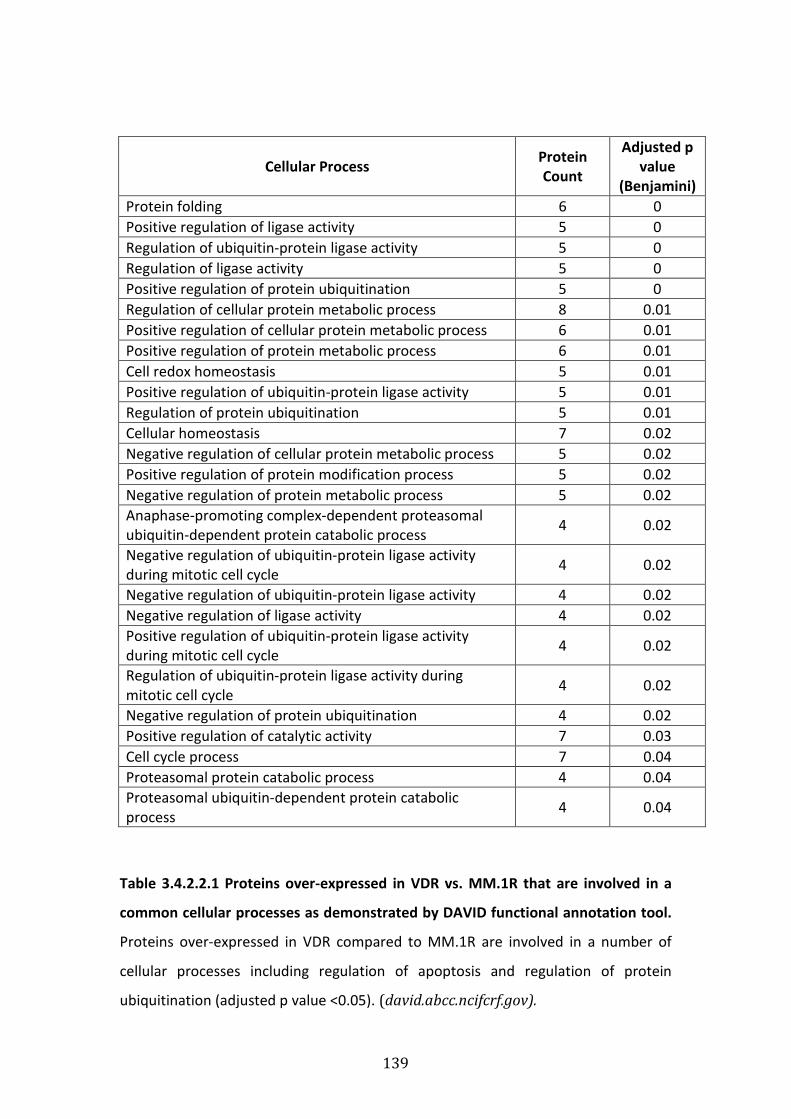
139
Cellular Process Protein
Count
Adjusted p
value
(Benjamini)
Protein folding 6 0
Positive regulation of ligase activity 5 0
Regulation of ubiquitin-protein ligase activity 5 0
Regulation of ligase activity 5 0
Positive regulation of protein ubiquitination 5 0
Regulation of cellular protein metabolic process 8 0.01
Positive regulation of cellular protein metabolic process 6 0.01
Positive regulation of protein metabolic process 6 0.01
Cell redox homeostasis 5 0.01
Positive regulation of ubiquitin-protein ligase activity 5 0.01
Regulation of protein ubiquitination 5 0.01
Cellular homeostasis 7 0.02
Negative regulation of cellular protein metabolic process 5 0.02
Positive regulation of protein modification process 5 0.02
Negative regulation of protein metabolic process 5 0.02
Anaphase-promoting complex-dependent proteasomal
ubiquitin-dependent protein catabolic process 4 0.02
Negative regulation of ubiquitin-protein ligase activity
during mitotic cell cycle 4 0.02
Negative regulation of ubiquitin-protein ligase activity 4 0.02
Negative regulation of ligase activity 4 0.02
Positive regulation of ubiquitin-protein ligase activity
during mitotic cell cycle 4 0.02
Regulation of ubiquitin-protein ligase activity during
mitotic cell cycle 4 0.02
Negative regulation of protein ubiquitination 4 0.02
Positive regulation of catalytic activity 7 0.03
Cell cycle process 7 0.04
Proteasomal protein catabolic process 4 0.04
Proteasomal ubiquitin-dependent protein catabolic
process 4 0.04
Table 3.4.2.2.1 Proteins over-expressed in VDR vs. MM.1R that are involved in a
common cellular processes as demonstrated by DAVID functional annotation tool.
Proteins over-expressed in VDR compared to MM.1R are involved in a number of
cellular processes including regulation of apoptosis and regulation of protein
ubiquitination (adjusted p value <0.05). (david.abcc.ncifcrf.gov).
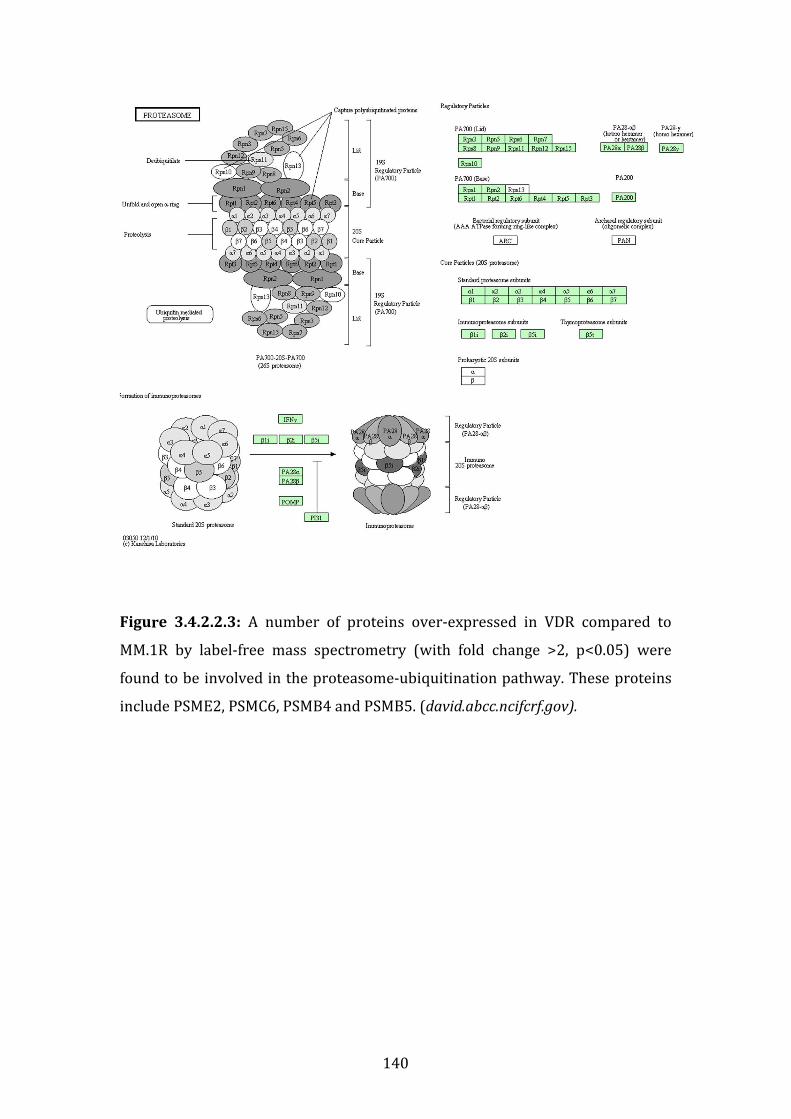
140
Figure 3.4.2.2.3: A number of proteins over-expressed in VDR compared to
MM.1R by label-free mass spectrometry (with fold change >2, p<0.05) were
found to be involved in the proteasome-ubiquitination pathway. These proteins
include PSME2, PSMC6, PSMB4 and PSMB5. (david.abcc.ncifcrf.gov).
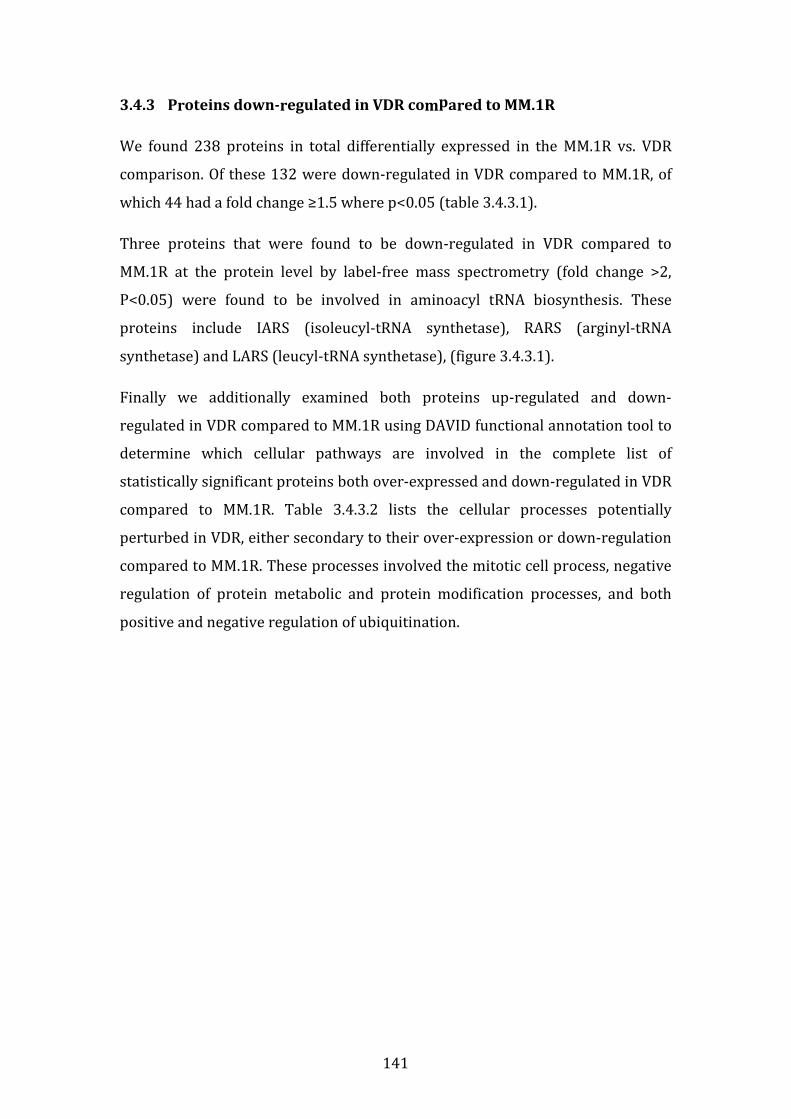
141
3.4.3 Proteins down-regulated in VDR compared to MM.1R
We found 238 proteins in total differentially expressed in the MM.1R vs. VDR
comparison. Of these 132 were down-regulated in VDR compared to MM.1R, of
which 44 had a fold change ≥1.5 where p<0.05 (table 3.4.3.1).
Three proteins that were found to be down-regulated in VDR compared to
MM.1R at the protein level by label-free mass spectrometry (fold change >2,
P<0.05) were found to be involved in aminoacyl tRNA biosynthesis. These
proteins include IARS (isoleucyl-tRNA synthetase), RARS (arginyl-tRNA
synthetase) and LARS (leucyl-tRNA synthetase), (figure 3.4.3.1).
Finally we additionally examined both proteins up-regulated and down-
regulated in VDR compared to MM.1R using DAVID functional annotation tool to
determine which cellular pathways are involved in the complete list of
statistically significant proteins both over-expressed and down-regulated in VDR
compared to MM.1R. Table 3.4.3.2 lists the cellular processes potentially
perturbed in VDR, either secondary to their over-expression or down-regulation
compared to MM.1R. These processes involved the mitotic cell process, negative
regulation of protein metabolic and protein modification processes, and both
positive and negative regulation of ubiquitination.
142
Accession Confidence
score
Anova (p) Max fold
change
Uniprot
P50224 51.33 7.85E-04 15.95 SULT1A3
Q09666 513.52 2.60E-06 7.12 AHNAK
Q9Y5X3 79.17 0.01 3.24 SNX5
P82970 42.85 1.94E-04 3.10 HMGN5
P46926 116.08 0.01 2.53 GNPDA1
P24941 95.46 0.04 2.31 CDK2
Q53GG5 44.86 8.29E-04 2.24 PDLIM3
P78347 61.60 0.03 2.15 GTF2I
O75461 30.94 3.12E-04 2.01 E2F6
P41252 295.37 3.22E-04 1.93 IARS
P21333 3263.52 4.63E-04 1.90 FLNA
P48539 206.65 0.01 1.90 PCP4
O14974 128.16 2.26E-03 1.89 PPP1R12A
P54136 213.18 3.96E-04 1.86 RARS
Q9H4M9 80.51 0.01 1.85 EHD1
P36405 90.34 0.03 1.83 ARL3
P51965 56.16 2.43E-03 1.80 UBE2E1
P09525 40.73 0.05 1.79 ANXA4
P80723 211.18 1.10E-03 1.79 BASP1
P11413 92.65 0.01 1.79 G6PD
O15247 82.44 1.28E-03 1.78 CLIC2
P78417 172.01 0.01 1.77 GSTO1
Q9P2J5 325.70 9.78E-04 1.74 LARS
Q32MZ4 184.84 0.02 1.74 LRRFIP1
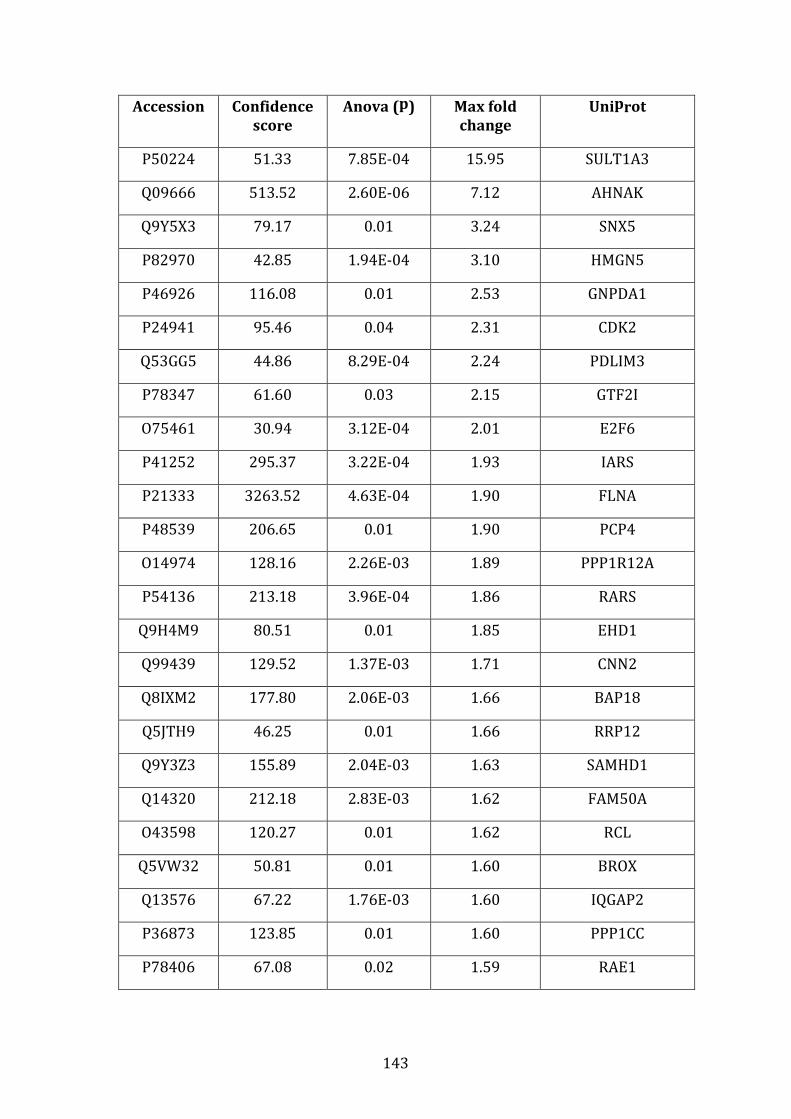
143
Accession Confidence
score
Anova (p) Max fold
change
Uniprot
P50224 51.33 7.85E-04 15.95 SULT1A3
Q09666 513.52 2.60E-06 7.12 AHNAK
Q9Y5X3 79.17 0.01 3.24 SNX5
P82970 42.85 1.94E-04 3.10 HMGN5
P46926 116.08 0.01 2.53 GNPDA1
P24941 95.46 0.04 2.31 CDK2
Q53GG5 44.86 8.29E-04 2.24 PDLIM3
P78347 61.60 0.03 2.15 GTF2I
O75461 30.94 3.12E-04 2.01 E2F6
P41252 295.37 3.22E-04 1.93 IARS
P21333 3263.52 4.63E-04 1.90 FLNA
P48539 206.65 0.01 1.90 PCP4
O14974 128.16 2.26E-03 1.89 PPP1R12A
P54136 213.18 3.96E-04 1.86 RARS
Q9H4M9 80.51 0.01 1.85 EHD1
Q99439 129.52 1.37E-03 1.71 CNN2
Q8IXM2 177.80 2.06E-03 1.66 BAP18
Q5JTH9 46.25 0.01 1.66 RRP12
Q9Y3Z3 155.89 2.04E-03 1.63 SAMHD1
Q14320 212.18 2.83E-03 1.62 FAM50A
O43598 120.27 0.01 1.62 RCL
Q5VW32 50.81 0.01 1.60 BROX
Q13576 67.22 1.76E-03 1.60 IQGAP2
P36873 123.85 0.01 1.60 PPP1CC
P78406 67.08 0.02 1.59 RAE1
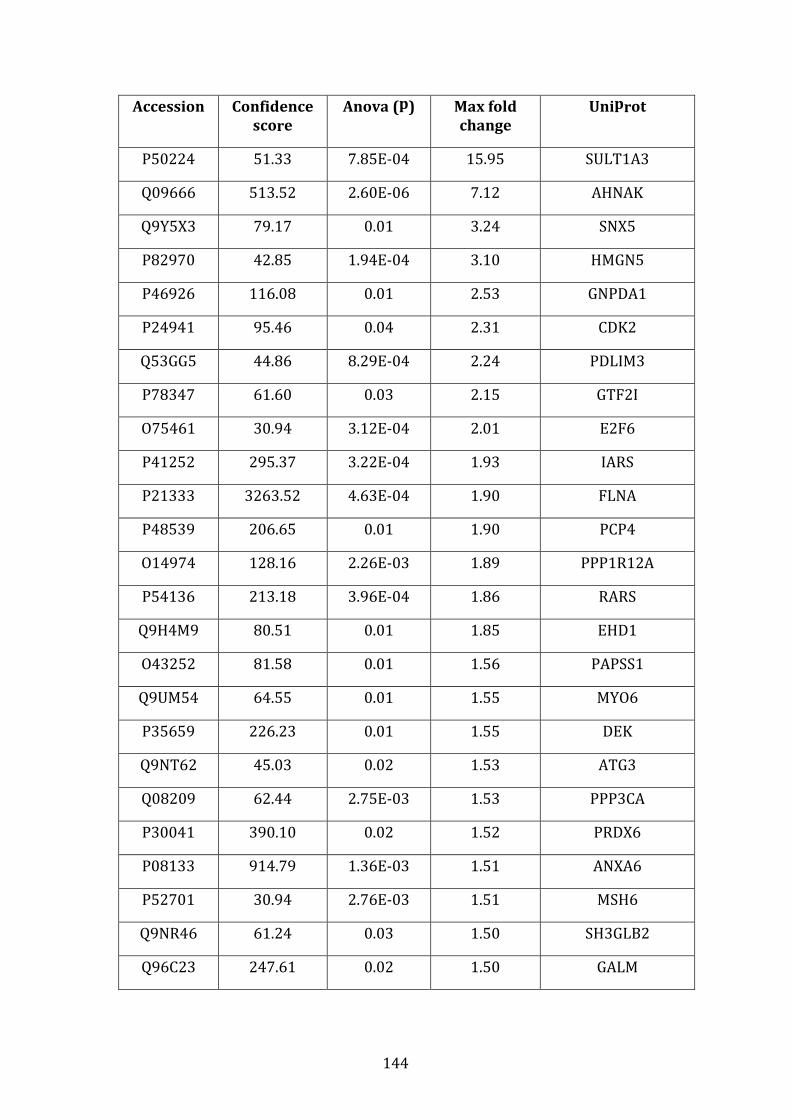
144
Accession Confidence
score
Anova (p) Max fold
change
Uniprot
P50224 51.33 7.85E-04 15.95 SULT1A3
Q09666 513.52 2.60E-06 7.12 AHNAK
Q9Y5X3 79.17 0.01 3.24 SNX5
P82970 42.85 1.94E-04 3.10 HMGN5
P46926 116.08 0.01 2.53 GNPDA1
P24941 95.46 0.04 2.31 CDK2
Q53GG5 44.86 8.29E-04 2.24 PDLIM3
P78347 61.60 0.03 2.15 GTF2I
O75461 30.94 3.12E-04 2.01 E2F6
P41252 295.37 3.22E-04 1.93 IARS
P21333 3263.52 4.63E-04 1.90 FLNA
P48539 206.65 0.01 1.90 PCP4
O14974 128.16 2.26E-03 1.89 PPP1R12A
P54136 213.18 3.96E-04 1.86 RARS
Q9H4M9 80.51 0.01 1.85 EHD1
O43252 81.58 0.01 1.56 PAPSS1
Q9UM54 64.55 0.01 1.55 MYO6
P35659 226.23 0.01 1.55 DEK
Q9NT62 45.03 0.02 1.53 ATG3
Q08209 62.44 2.75E-03 1.53 PPP3CA
P30041 390.10 0.02 1.52 PRDX6
P08133 914.79 1.36E-03 1.51 ANXA6
P52701 30.94 2.76E-03 1.51 MSH6
Q9NR46 61.24 0.03 1.50 SH3GLB2
Q96C23 247.61 0.02 1.50 GALM

145
Table 3.4.3.1 Proteins down-regulated in VDR compared to MM.1R by label
free mass spectrometry. 44 proteins were down-regulated in VDR compared to
MM.1R with a fold change ≥1.5 (p<0.05).
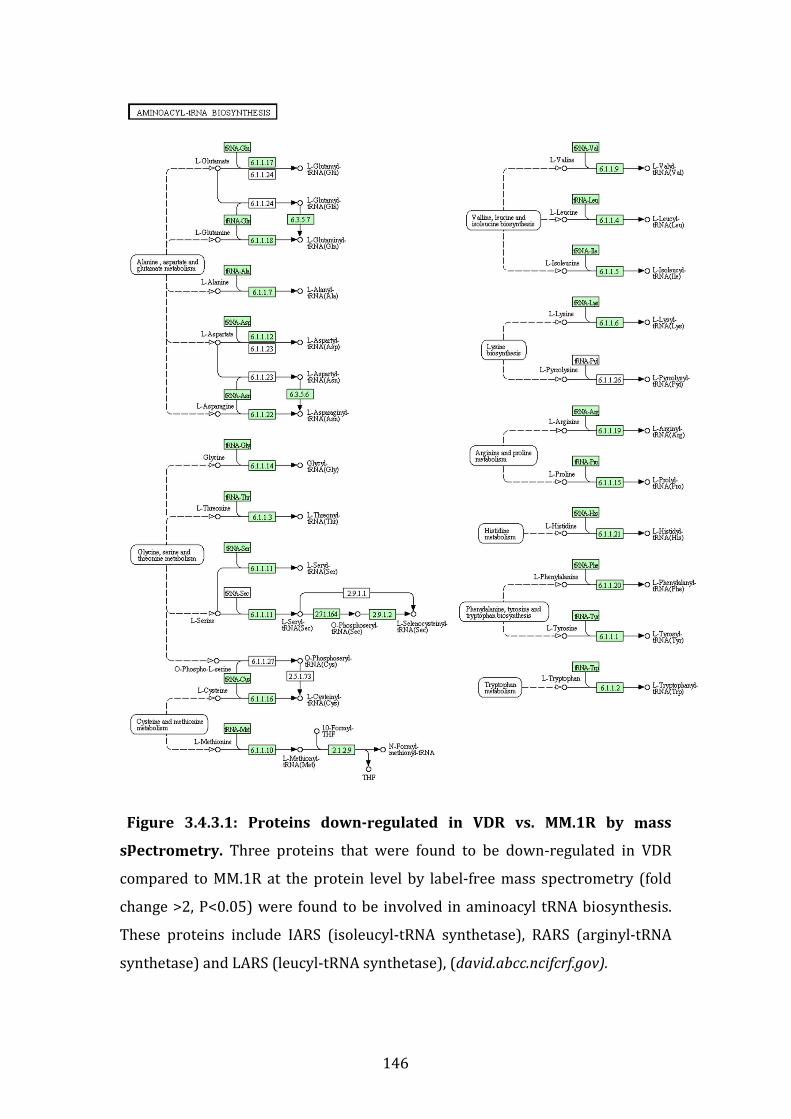
146
Figure 3.4.3.1: Proteins down-regulated in VDR vs. MM.1R by mass
spectrometry. Three proteins that were found to be down-regulated in VDR
compared to MM.1R at the protein level by label-free mass spectrometry (fold
change >2, P<0.05) were found to be involved in aminoacyl tRNA biosynthesis.
These proteins include IARS (isoleucyl-tRNA synthetase), RARS (arginyl-tRNA
synthetase) and LARS (leucyl-tRNA synthetase), (david.abcc.ncifcrf.gov).
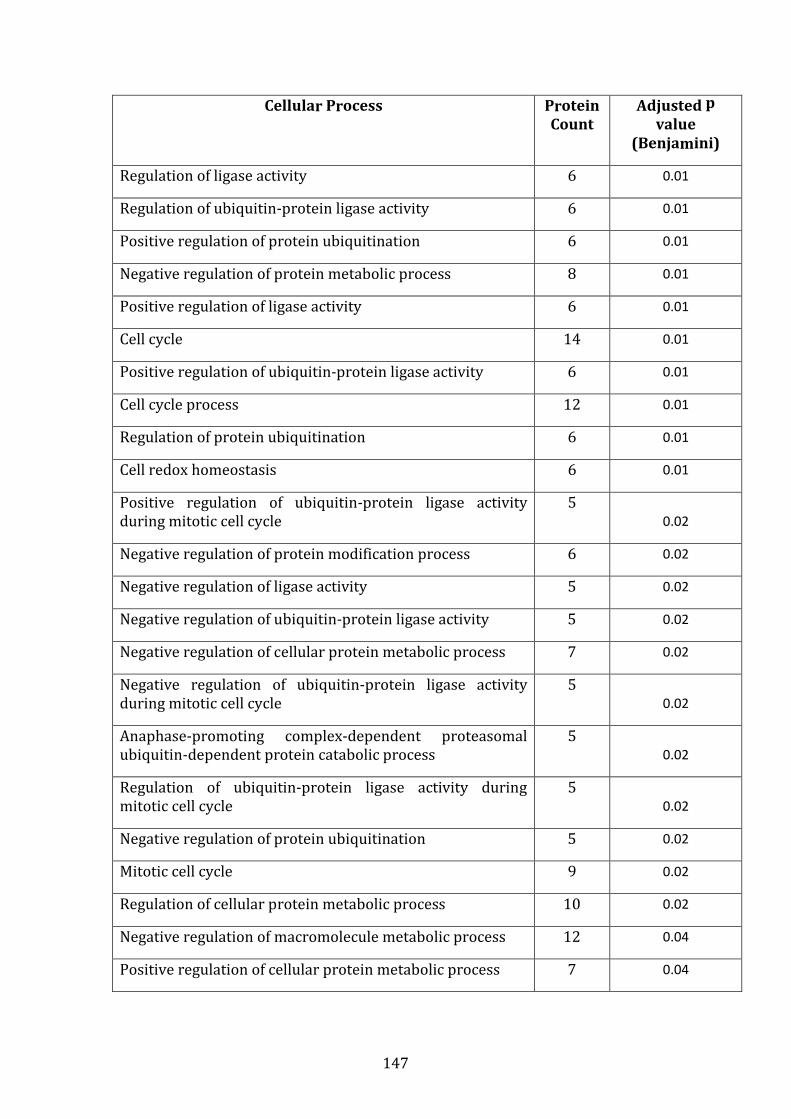
147
Cellular Process Protein
Count
Adjusted p
value
(Benjamini)
Regulation of ligase activity 6 0.01
Regulation of ubiquitin-protein ligase activity 6 0.01
Positive regulation of protein ubiquitination 6 0.01
Negative regulation of protein metabolic process 8 0.01
Positive regulation of ligase activity 6 0.01
Cell cycle 14 0.01
Positive regulation of ubiquitin-protein ligase activity 6 0.01
Cell cycle process 12 0.01
Regulation of protein ubiquitination 6 0.01
Cell redox homeostasis 6 0.01
Positive regulation of ubiquitin-protein ligase activity
during mitotic cell cycle
5 0.02
Negative regulation of protein modification process 6 0.02
Negative regulation of ligase activity 5 0.02
Negative regulation of ubiquitin-protein ligase activity 5 0.02
Negative regulation of cellular protein metabolic process 7 0.02
Negative regulation of ubiquitin-protein ligase activity
during mitotic cell cycle
5 0.02
Anaphase-promoting complex-dependent proteasomal
ubiquitin-dependent protein catabolic process
5 0.02
Regulation of ubiquitin-protein ligase activity during
mitotic cell cycle
5 0.02
Negative regulation of protein ubiquitination 5 0.02
Mitotic cell cycle 9 0.02
Regulation of cellular protein metabolic process 10 0.02
Negative regulation of macromolecule metabolic process 12 0.04
Positive regulation of cellular protein metabolic process 7 0.04

148
Table 3.4.3.2: Proteins both over-expressed and down-regulated in VDR
compared to MM.1R. The cellular processes in which these proteins are
involved are listed, with corresponding number of proteins involved in each
given pathway, and associated adjusted p value (<0.05).
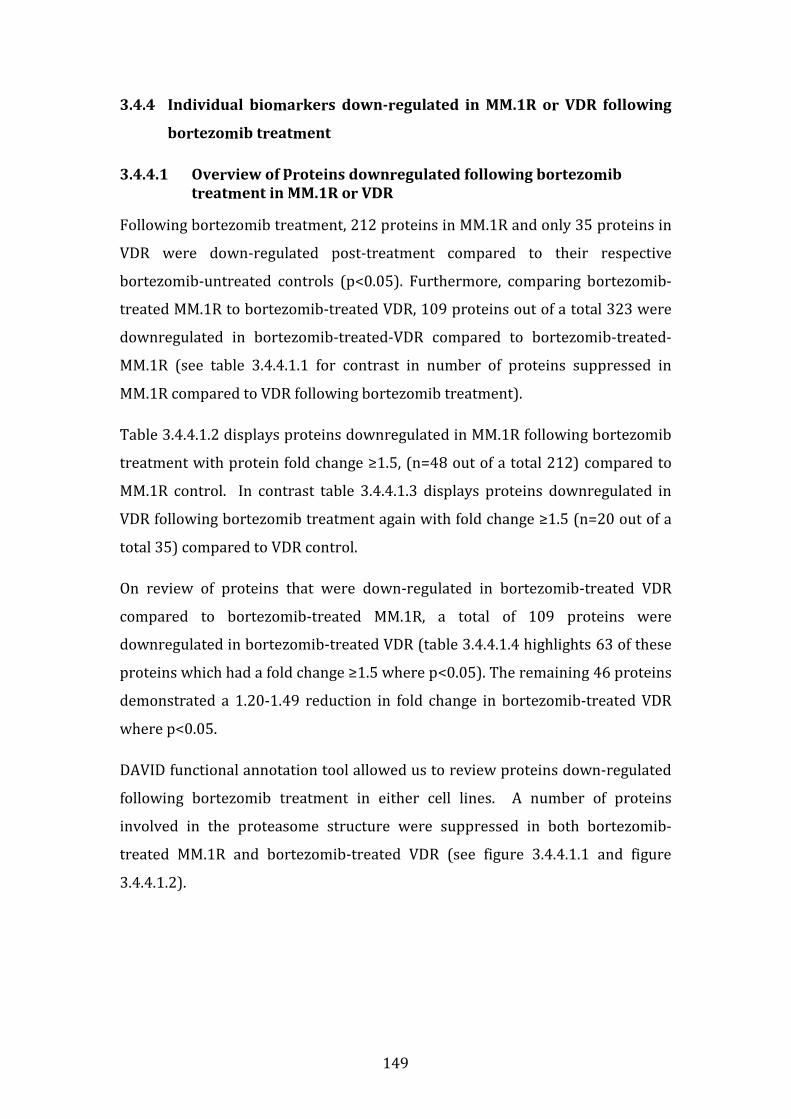
149
3.4.4 Individual biomarkers down-regulated in MM.1R or VDR following
bortezomib treatment
3.4.4.1 Overview of proteins downregulated following bortezomib
treatment in MM.1R or VDR
Following bortezomib treatment, 212 proteins in MM.1R and only 35 proteins in
VDR were down-regulated post-treatment compared to their respective
bortezomib-untreated controls (p<0.05). Furthermore, comparing bortezomib-
treated MM.1R to bortezomib-treated VDR, 109 proteins out of a total 323 were
downregulated in bortezomib-treated-VDR compared to bortezomib-treated-
MM.1R (see table 3.4.4.1.1 for contrast in number of proteins suppressed in
MM.1R compared to VDR following bortezomib treatment).
Table 3.4.4.1.2 displays proteins downregulated in MM.1R following bortezomib
treatment with protein fold change ≥1.5, (n=48 out of a total 212) compared to
MM.1R control. In contrast table 3.4.4.1.3 displays proteins downregulated in
VDR following bortezomib treatment again with fold change ≥1.5 (n=20 out of a
total 35) compared to VDR control.
On review of proteins that were down-regulated in bortezomib-treated VDR
compared to bortezomib-treated MM.1R, a total of 109 proteins were
downregulated in bortezomib-treated VDR (table 3.4.4.1.4 highlights 63 of these
proteins which had a fold change ≥1.5 where p<0.05). The remaining 46 proteins
demonstrated a 1.20-1.49 reduction in fold change in bortezomib-treated VDR
where p<0.05.
DAVID functional annotation tool allowed us to review proteins down-regulated
following bortezomib treatment in either cell lines. A number of proteins
involved in the proteasome structure were suppressed in both bortezomib-
treated MM.1R and bortezomib-treated VDR (see figure 3.4.4.1.1 and figure
3.4.4.1.2).
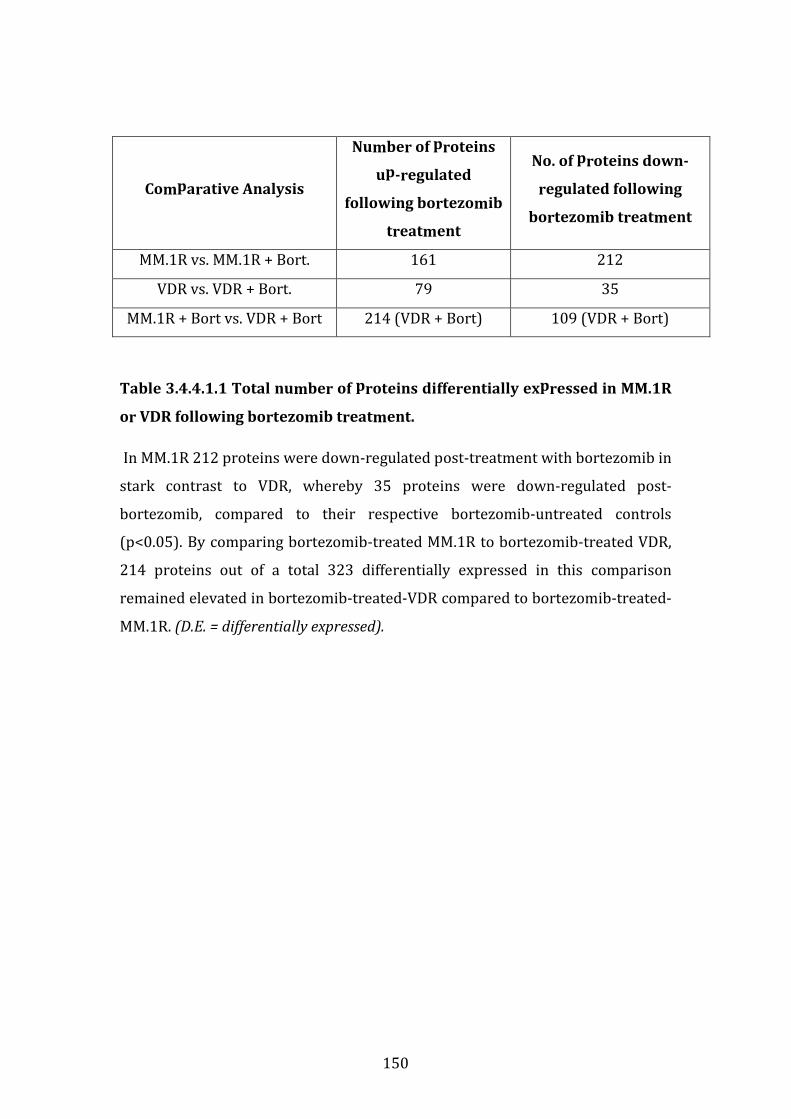
150
Comparative Analysis
Number of proteins
up-regulated
following bortezomib
treatment
No. of proteins down-
regulated following
bortezomib treatment
MM.1R vs. MM.1R + Bort. 161 212
VDR vs. VDR + Bort. 79 35
MM.1R + Bort vs. VDR + Bort 214 (VDR + Bort) 109 (VDR + Bort)
Table 3.4.4.1.1 Total number of proteins differentially expressed in MM.1R
or VDR following bortezomib treatment.
In MM.1R 212 proteins were down-regulated post-treatment with bortezomib in
stark contrast to VDR, whereby 35 proteins were down-regulated post-
bortezomib, compared to their respective bortezomib-untreated controls
(p<0.05). By comparing bortezomib-treated MM.1R to bortezomib-treated VDR,
214 proteins out of a total 323 differentially expressed in this comparison
remained elevated in bortezomib-treated-VDR compared to bortezomib-treated-
MM.1R. (D.E. = differentially expressed).
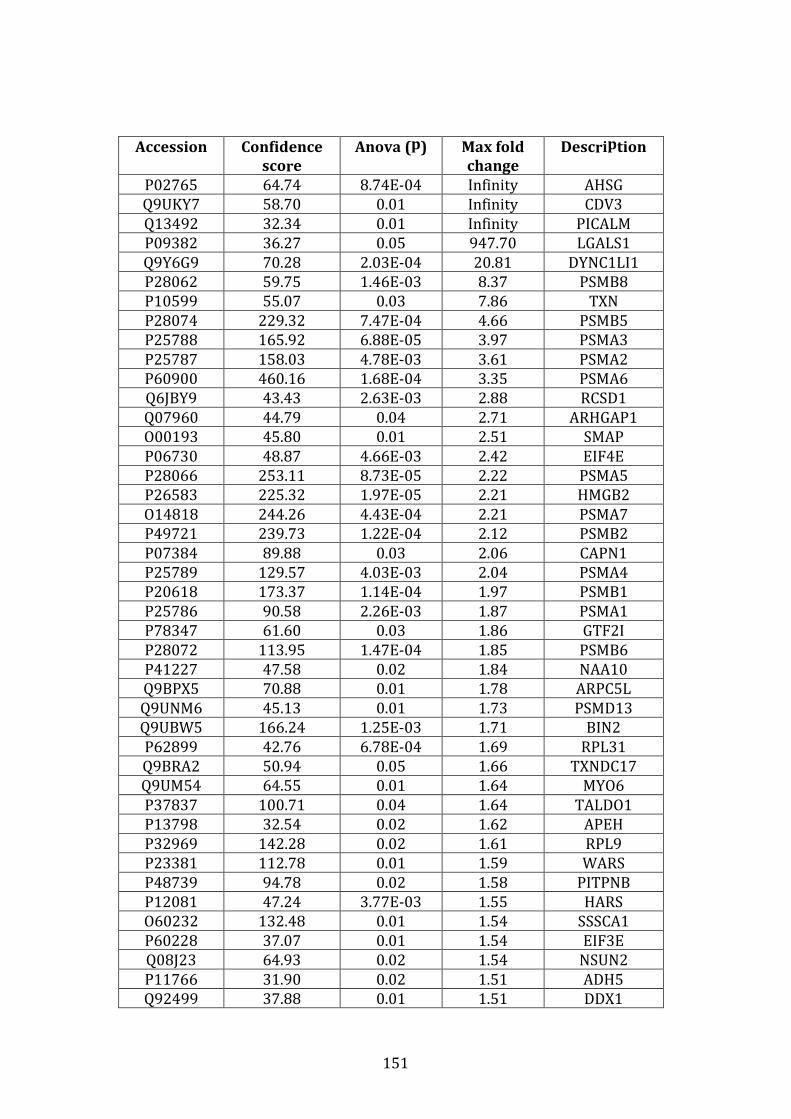
151
Accession Confidence
score
Anova (p) Max fold
change
Description
P02765 64.74 8.74E-04 Infinity AHSG
Q9UKY7 58.70 0.01 Infinity CDV3
Q13492 32.34 0.01 Infinity PICALM
P09382 36.27 0.05 947.70 LGALS1
Q9Y6G9 70.28 2.03E-04 20.81 DYNC1LI1
P28062 59.75 1.46E-03 8.37 PSMB8
P10599 55.07 0.03 7.86 TXN
P28074 229.32 7.47E-04 4.66 PSMB5
P25788 165.92 6.88E-05 3.97 PSMA3
P25787 158.03 4.78E-03 3.61 PSMA2
P60900 460.16 1.68E-04 3.35 PSMA6
Q6JBY9 43.43 2.63E-03 2.88 RCSD1
Q07960 44.79 0.04 2.71 ARHGAP1
O00193 45.80 0.01 2.51 SMAP
P06730 48.87 4.66E-03 2.42 EIF4E
P28066 253.11 8.73E-05 2.22 PSMA5
P26583 225.32 1.97E-05 2.21 HMGB2
O14818 244.26 4.43E-04 2.21 PSMA7
P49721 239.73 1.22E-04 2.12 PSMB2
P07384 89.88 0.03 2.06 CAPN1
P25789 129.57 4.03E-03 2.04 PSMA4
P20618 173.37 1.14E-04 1.97 PSMB1
P25786 90.58 2.26E-03 1.87 PSMA1
P78347 61.60 0.03 1.86 GTF2I
P28072 113.95 1.47E-04 1.85 PSMB6
P41227 47.58 0.02 1.84 NAA10
Q9BPX5 70.88 0.01 1.78 ARPC5L
Q9UNM6 45.13 0.01 1.73 PSMD13
Q9UBW5 166.24 1.25E-03 1.71 BIN2
P62899 42.76 6.78E-04 1.69 RPL31
Q9BRA2 50.94 0.05 1.66 TXNDC17
Q9UM54 64.55 0.01 1.64 MYO6
P37837 100.71 0.04 1.64 TALDO1
P13798 32.54 0.02 1.62 APEH
P32969 142.28 0.02 1.61 RPL9
P23381 112.78 0.01 1.59 WARS
P48739 94.78 0.02 1.58 PITPNB
P12081 47.24 3.77E-03 1.55 HARS
O60232 132.48 0.01 1.54 SSSCA1
P60228 37.07 0.01 1.54 EIF3E
Q08J23 64.93 0.02 1.54 NSUN2
P11766 31.90 0.02 1.51 ADH5
Q92499 37.88 0.01 1.51 DDX1

152
Accession Confidence
score
Anova (p) Max fold
change
Description
P14868 121.89 4.48E-03 1.51 DARS
P15374 129.68 2.65E-03 1.51 UCHL3
P55060 95.42 0.01 1.50 CSE1L
Q8N1G4 33.07 0.04 1.50 LRRC47
P62244 198.59 2.91E-03 1.50 RPS15A
Table 3.4.4.1.2 List of proteins downregulated in MM.1R following
bortezomib treatment compared to untreated control MM.1R. Proteins
downregulated in MM.1R following bortezomib treatment with protein fold
change ≥1.5, (n=48, out of a total 212 proteins where remaining protein fold
change ranges from 1.2-1.49).
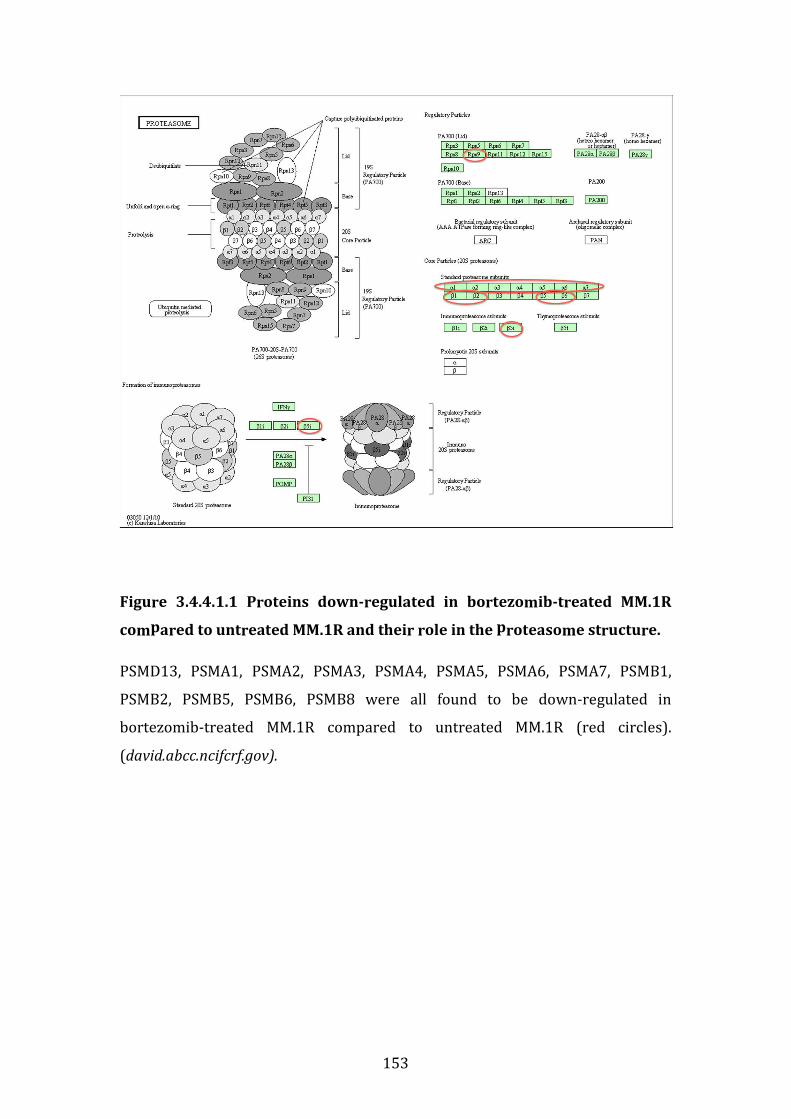
153
Figure 3.4.4.1.1 Proteins down-regulated in bortezomib-treated MM.1R
compared to untreated MM.1R and their role in the proteasome structure.
PSMD13, PSMA1, PSMA2, PSMA3, PSMA4, PSMA5, PSMA6, PSMA7, PSMB1,
PSMB2, PSMB5, PSMB6, PSMB8 were all found to be down-regulated in
bortezomib-treated MM.1R compared to untreated MM.1R (red circles).
(david.abcc.ncifcrf.gov).
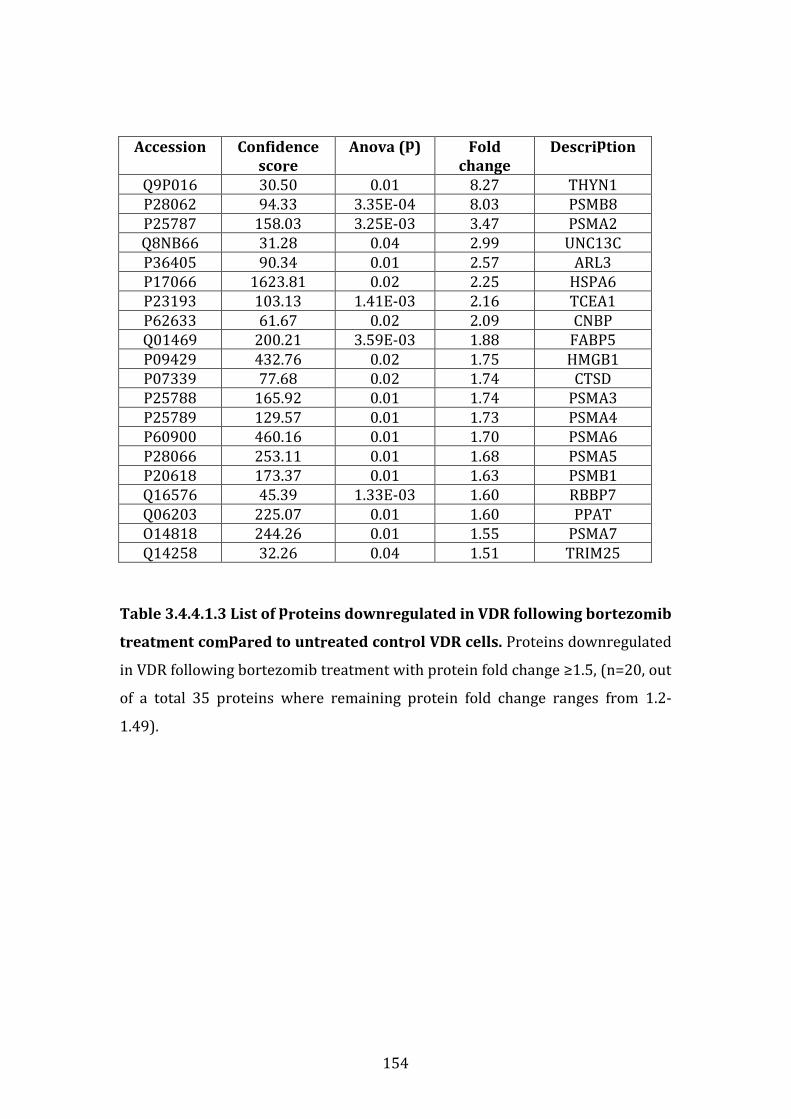
154
Accession Confidence
score
Anova (p) Fold
change
Description
Q9P016 30.50 0.01 8.27 THYN1
P28062 94.33 3.35E-04 8.03 PSMB8
P25787 158.03 3.25E-03 3.47 PSMA2
Q8NB66 31.28 0.04 2.99 UNC13C
P36405 90.34 0.01 2.57 ARL3
P17066 1623.81 0.02 2.25 HSPA6
P23193 103.13 1.41E-03 2.16 TCEA1
P62633 61.67 0.02 2.09 CNBP
Q01469 200.21 3.59E-03 1.88 FABP5
P09429 432.76 0.02 1.75 HMGB1
P07339 77.68 0.02 1.74 CTSD
P25788 165.92 0.01 1.74 PSMA3
P25789 129.57 0.01 1.73 PSMA4
P60900 460.16 0.01 1.70 PSMA6
P28066 253.11 0.01 1.68 PSMA5
P20618 173.37 0.01 1.63 PSMB1
Q16576 45.39 1.33E-03 1.60 RBBP7
Q06203 225.07 0.01 1.60 PPAT
O14818 244.26 0.01 1.55 PSMA7
Q14258 32.26 0.04 1.51 TRIM25
Table 3.4.4.1.3 List of proteins downregulated in VDR following bortezomib
treatment compared to untreated control VDR cells. Proteins downregulated
in VDR following bortezomib treatment with protein fold change ≥1.5, (n=20, out
of a total 35 proteins where remaining protein fold change ranges from 1.2-
1.49).

155
Figure 3.4.4.1.2: Proteins down-regulated in bortezomib-treated VDR
compared to untreated VDR.
It is interesting to note that many of the proteasome-alpha subunits again are
down-regulated in bortezomib-treated VDR (similar to bortezomib-treated
MM.1R). In addition PSMB8 (or beta-5-immunoproteasome subunit) was down-
regulated in bortezomib-treated VDR. PSMB5 however was not downregulated
in bortezomib-treated VDR.
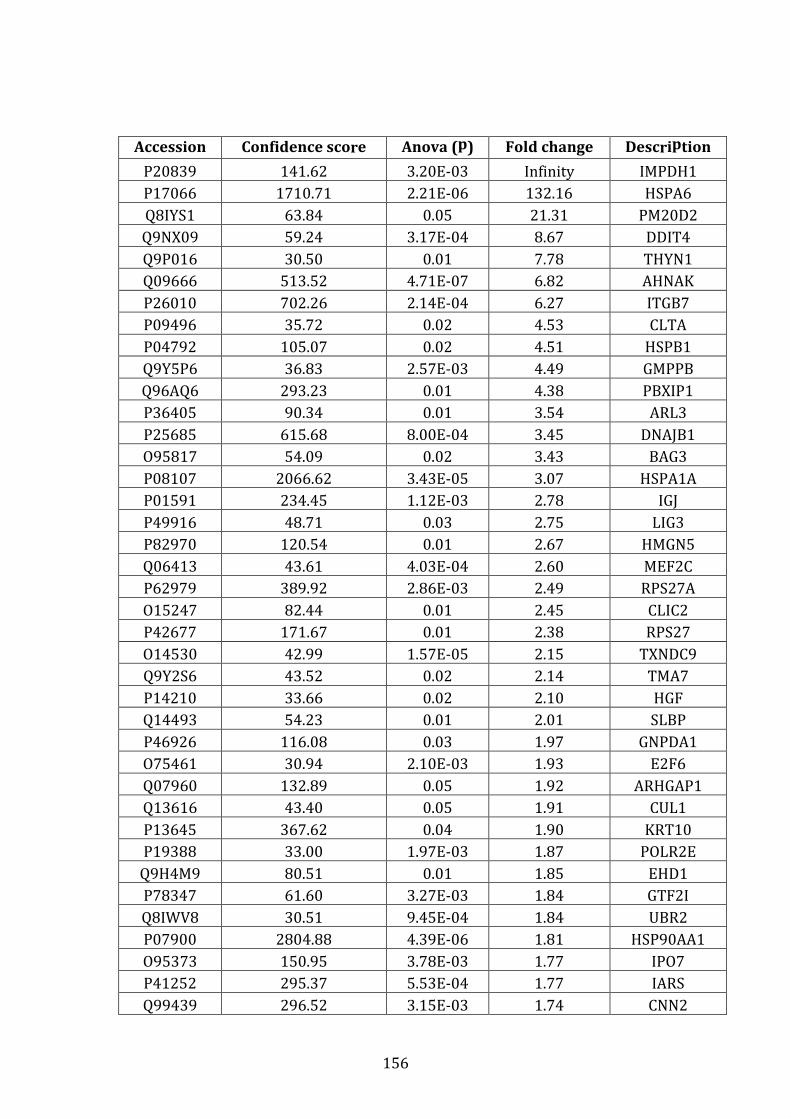
156
Accession Confidence score Anova (p) Fold change Description
P20839 141.62 3.20E-03 Infinity IMPDH1
P17066 1710.71 2.21E-06 132.16 HSPA6
Q8IYS1 63.84 0.05 21.31 PM20D2
Q9NX09 59.24 3.17E-04 8.67 DDIT4
Q9P016 30.50 0.01 7.78 THYN1
Q09666 513.52 4.71E-07 6.82 AHNAK
P26010 702.26 2.14E-04 6.27 ITGB7
P09496 35.72 0.02 4.53 CLTA
P04792 105.07 0.02 4.51 HSPB1
Q9Y5P6 36.83 2.57E-03 4.49 GMPPB
Q96AQ6 293.23 0.01 4.38 PBXIP1
P36405 90.34 0.01 3.54 ARL3
P25685 615.68 8.00E-04 3.45 DNAJB1
O95817 54.09 0.02 3.43 BAG3
P08107 2066.62 3.43E-05 3.07 HSPA1A
P01591 234.45 1.12E-03 2.78 IGJ
P49916 48.71 0.03 2.75 LIG3
P82970 120.54 0.01 2.67 HMGN5
Q06413 43.61 4.03E-04 2.60 MEF2C
P62979 389.92 2.86E-03 2.49 RPS27A
O15247 82.44 0.01 2.45 CLIC2
P42677 171.67 0.01 2.38 RPS27
O14530 42.99 1.57E-05 2.15 TXNDC9
Q9Y2S6 43.52 0.02 2.14 TMA7
P14210 33.66 0.02 2.10 HGF
Q14493 54.23 0.01 2.01 SLBP
P46926 116.08 0.03 1.97 GNPDA1
O75461 30.94 2.10E-03 1.93 E2F6
Q07960 132.89 0.05 1.92 ARHGAP1
Q13616 43.40 0.05 1.91 CUL1
P13645 367.62 0.04 1.90 KRT10
P19388 33.00 1.97E-03 1.87 POLR2E
Q9H4M9 80.51 0.01 1.85 EHD1
P78347 61.60 3.27E-03 1.84 GTF2I
Q8IWV8 30.51 9.45E-04 1.84 UBR2
P07900 2804.88 4.39E-06 1.81 HSP90AA1
O95373 150.95 3.78E-03 1.77 IPO7
P41252 295.37 5.53E-04 1.77 IARS
Q99439 296.52 3.15E-03 1.74 CNN2
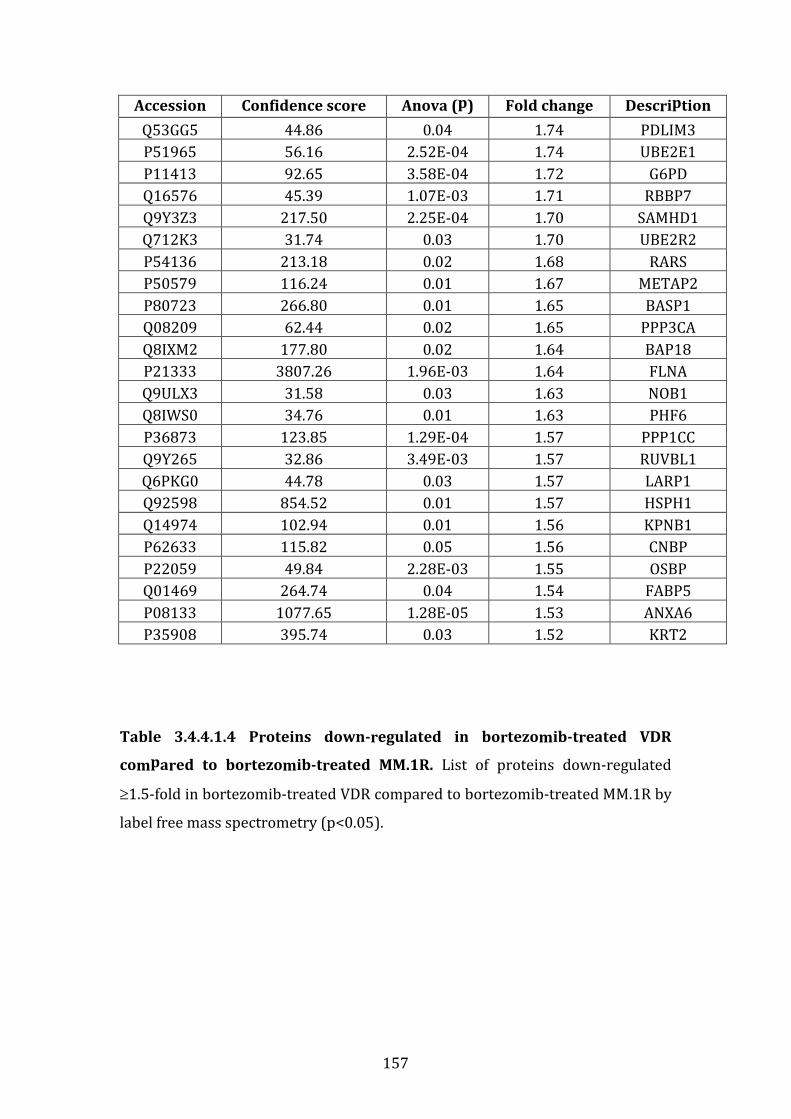
157
Accession Confidence score Anova (p) Fold change Description
Q53GG5 44.86 0.04 1.74 PDLIM3
P51965 56.16 2.52E-04 1.74 UBE2E1
P11413 92.65 3.58E-04 1.72 G6PD
Q16576 45.39 1.07E-03 1.71 RBBP7
Q9Y3Z3 217.50 2.25E-04 1.70 SAMHD1
Q712K3 31.74 0.03 1.70 UBE2R2
P54136 213.18 0.02 1.68 RARS
P50579 116.24 0.01 1.67 METAP2
P80723 266.80 0.01 1.65 BASP1
Q08209 62.44 0.02 1.65 PPP3CA
Q8IXM2 177.80 0.02 1.64 BAP18
P21333 3807.26 1.96E-03 1.64 FLNA
Q9ULX3 31.58 0.03 1.63 NOB1
Q8IWS0 34.76 0.01 1.63 PHF6
P36873 123.85 1.29E-04 1.57 PPP1CC
Q9Y265 32.86 3.49E-03 1.57 RUVBL1
Q6PKG0 44.78 0.03 1.57 LARP1
Q92598 854.52 0.01 1.57 HSPH1
Q14974 102.94 0.01 1.56 KPNB1
P62633 115.82 0.05 1.56 CNBP
P22059 49.84 2.28E-03 1.55 OSBP
Q01469 264.74 0.04 1.54 FABP5
P08133 1077.65 1.28E-05 1.53 ANXA6
P35908 395.74 0.03 1.52 KRT2
Table 3.4.4.1.4 Proteins down-regulated in bortezomib-treated VDR
compared to bortezomib-treated MM.1R. List of proteins down-regulated
≥1.5-fold in bortezomib-treated VDR compared to bortezomib-treated MM.1R by
label free mass spectrometry (p<0.05).

158
3.4.4.2 Functional annotation analysis of proteins down-regulated
following bortezomib treatment in VDR compared to bortezomib-
treated MM.1R.
Functional annotation analysis of the proteins downregulated in bortezomib-
treated VDR compared to bortezomib-treated MM.1R revealed 59 pathways in
which these proteins are involved and included positive regulation of protein
ubiquitination, negative regulation of programmed cell death, proteasomal
protein catabolic process, cell cycle processes and positive regulation of
ubiquitin-protein ligase activity. For all cellular processes identified the adjusted
Benjamini p value was <0.05, (see table 3.4.4.2.1).
Taking a closer look, we found 5 proteins that are down-regulated in
bortezomib-treated VDR compared to bortezomib-treated MM.1R in the MAP-
kinase signalling pathway (figure 3.4.4.2.1). The MAP-kinase signalling pathway,
when altered, is well documented for its role in carcinogenesis. These proteins
including FLNA, HSP72/HSPA6, PPP3C, MEF2C and HSP27/HSPB1 may
potentially contribute to bortezomib refractoriness in VDR.
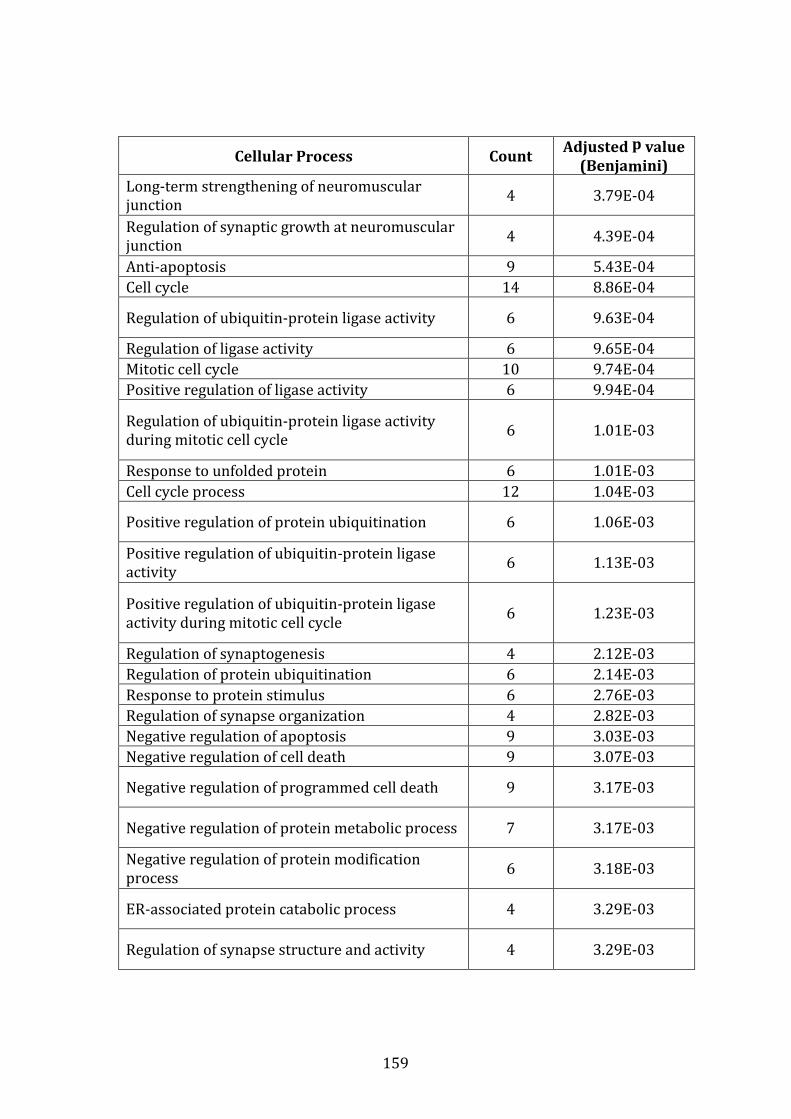
159
Cellular Process Count Adjusted p value
(Benjamini)
Long-term strengthening of neuromuscular
junction 4 3.79E-04
Regulation of synaptic growth at neuromuscular
junction 4 4.39E-04
Anti-apoptosis 9 5.43E-04
Cell cycle 14 8.86E-04
Regulation of ubiquitin-protein ligase activity 6 9.63E-04
Regulation of ligase activity 6 9.65E-04
Mitotic cell cycle 10 9.74E-04
Positive regulation of ligase activity 6 9.94E-04
Regulation of ubiquitin-protein ligase activity
during mitotic cell cycle 6 1.01E-03
Response to unfolded protein 6 1.01E-03
Cell cycle process 12 1.04E-03
Positive regulation of protein ubiquitination 6 1.06E-03
Positive regulation of ubiquitin-protein ligase
activity 6 1.13E-03
Positive regulation of ubiquitin-protein ligase
activity during mitotic cell cycle 6 1.23E-03
Regulation of synaptogenesis 4 2.12E-03
Regulation of protein ubiquitination 6 2.14E-03
Response to protein stimulus 6 2.76E-03
Regulation of synapse organization 4 2.82E-03
Negative regulation of apoptosis 9 3.03E-03
Negative regulation of cell death 9 3.07E-03
Negative regulation of programmed cell death 9 3.17E-03
Negative regulation of protein metabolic process 7 3.17E-03
Negative regulation of protein modification
process 6 3.18E-03
ER-associated protein catabolic process 4 3.29E-03
Regulation of synapse structure and activity 4 3.29E-03
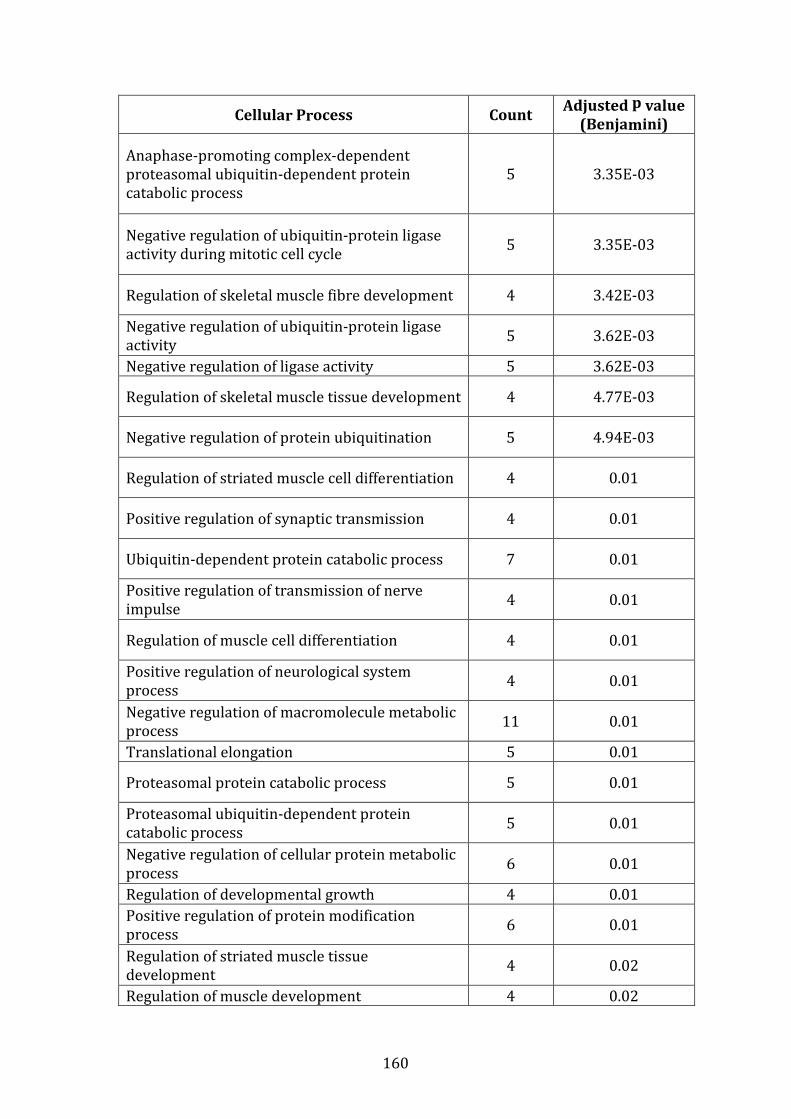
160
Cellular Process Count Adjusted p value
(Benjamini)
Anaphase-promoting complex-dependent
proteasomal ubiquitin-dependent protein
catabolic process
5 3.35E-03
Negative regulation of ubiquitin-protein ligase
activity during mitotic cell cycle 5 3.35E-03
Regulation of skeletal muscle fibre development 4 3.42E-03
Negative regulation of ubiquitin-protein ligase
activity 5 3.62E-03
Negative regulation of ligase activity 5 3.62E-03
Regulation of skeletal muscle tissue development 4 4.77E-03
Negative regulation of protein ubiquitination 5 4.94E-03
Regulation of striated muscle cell differentiation 4 0.01
Positive regulation of synaptic transmission 4 0.01
Ubiquitin-dependent protein catabolic process 7 0.01
Positive regulation of transmission of nerve
impulse 4 0.01
Regulation of muscle cell differentiation 4 0.01
Positive regulation of neurological system
process 4 0.01
Negative regulation of macromolecule metabolic
process 11 0.01
Translational elongation 5 0.01
Proteasomal protein catabolic process 5 0.01
Proteasomal ubiquitin-dependent protein
catabolic process 5 0.01
Negative regulation of cellular protein metabolic
process 6 0.01
Regulation of developmental growth 4 0.01
Positive regulation of protein modification
process 6 0.01
Regulation of striated muscle tissue
development 4 0.02
Regulation of muscle development 4 0.02

161
Cellular Process Count Adjusted p value
(Benjamini)
Regulation of protein modification process 7 0.02
Protein ubiquitination 5 0.02
Protein modification by small protein
conjugation 5 0.03
Regulation of synaptic transmission 5 0.03
Translation 7 0.03
Regulation of synaptic plasticity 4 0.03
Positive regulation of cellular protein metabolic
process 6 0.03
Regulation of cellular protein metabolic process 8 0.04
Regulation of transmission of nerve impulse 5 0.04
Positive regulation of protein metabolic process 6 0.04
Regulation of neurological system process 5 0.04
Protein modification by small protein
conjugation or removal 5 0.04
Table 3.4.4.2.1 Functional annotation analysis of proteins down-regulated
in bortezomib-treated VDR vs. bortezomib-treated MM.1R
A large number of pathways were identified by DAVID functional annotation
analysis generated from the list of proteins that were down-regulated in
bortezomib-treated VDR vs. bortezomib-treated MM.1R including a number of
proteins involved in negative regulation of macromolecule metabolic process,
cell cycle processes and anti-apoptotic processes. (david.abcc.ncifcrf.gov).
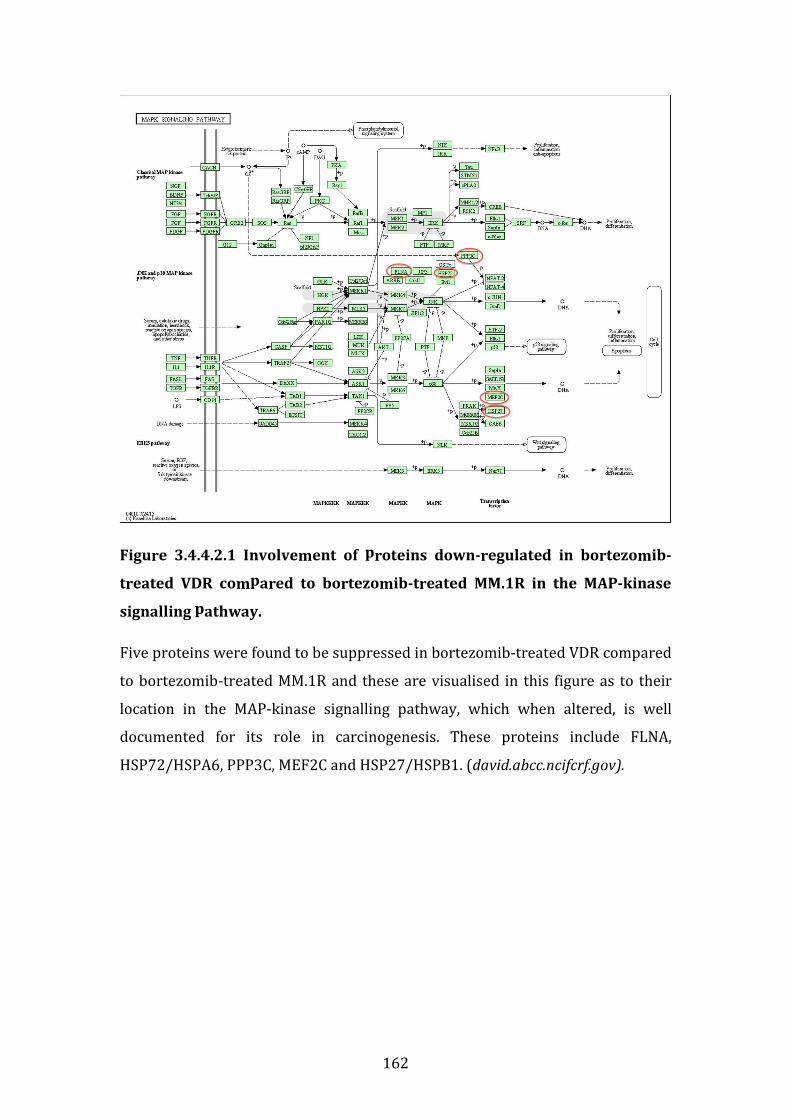
162
Figure 3.4.4.2.1 Involvement of proteins down-regulated in bortezomib-
treated VDR compared to bortezomib-treated MM.1R in the MAP-kinase
signalling pathway.
Five proteins were found to be suppressed in bortezomib-treated VDR compared
to bortezomib-treated MM.1R and these are visualised in this figure as to their
location in the MAP-kinase signalling pathway, which when altered, is well
documented for its role in carcinogenesis. These proteins include FLNA,
HSP72/HSPA6, PPP3C, MEF2C and HSP27/HSPB1. (david.abcc.ncifcrf.gov).

163
3.4.5 Proteins over-expressed in bortezomib treated VDR compared to
bortezomib treated MM.1R
3.4.5.1 Individual proteins over-expressed in bortezomib treated VDR
compared to bortezomib treated MM.1R
On review of proteins up-regulated in bortezomib-treated VDR compared to
bortezomib-treated MM.1R we found 215 proteins up-regulated in bortezomib-
treated VDR, of which 78 proteins had a fold change ≥2 (p<0.05), (see table
3.4.5.1.1).
Again PSMB5 was over-expressed in bortezomib-treated VDR compared to
bortezomib treated MM.1R (13.04 fold change, p=3.90E-05). Additionally, the
protein responsible for trypsin-like protein cleavage at the β2-subunit, PSMB7,
was over-expressed in bortezomib-treated VDR and demonstrated a 16-fold
increase compared to bortezomib-treated MM.1R (p=0.009). Finally, the protein
responsible for chymotrypsin-like proteolytic cleavage at the β-1 subunit,
PSMB6, was also upregulated in by 2.32 fold (p=0.001) in bortezomib-treated
VDR compared to bortezomib-treated MM.1R.
While NEDD8 did not meet our cut-off criteria for inclusion of proteins of
interest (i.e. fold change ≥2), on examination of the remaining 134 protein with a
fold change between 1.20 and 1.99, NEDD8 was found to be over-expressed in
bortezomib-treated VDR compared to bortezomib-treated MM.1R, fold change
1.98 (p=0.008). This suggests that addition of a NEDD8-activating enzyme
inhibitor may be useful in the setting of bortezomib resistant MM, however this
would be dependent on bone marrow microenvironmental effects. We have
demonstrated that the NEDD8-activating enzyme inhibitor MLN4924 was
subject to HS-5 stromal cell induced drug resistance in the VDR cell line (figure
3.5.3.1), and despite combination of MLN4924 with bortezomib, resistance to
this agent persisted in the presence of HS-5 stromal cells (figure 3.5.3.2), (see
chapter 5 results section). Therefore this point again emphasizes the need to
consider the bone marrow environmental impact on drug sensitivity testing
when considering novel therapies under investigation for the treatment of
multiple myeloma.
164
Previously we demonstrated that CCL3 is up-regulated in VDR at baseline
compared to MM.1R (table 3.4.2.1), a protein known to be involved in
stimulating MM cell growth and worsening osteolytic bone disease. When MM.1R
and VDR were treated with bortezomib, CCL3 remained markedly over-
expressed in bortezomib-treated VDR compared to bortezomib-treated MM.1R
(fold change 3.55, p=0.016). Thus bortezomib resistance in VDR may potentially
be augmented by its over-expression of CCL3, which remains elevated despite
bortezomib treatment.
GSTP1 (glutathione s-transferase pi 1) is an enzyme that detoxifies carcinogens
and variances of its detoxifying ability can be altered further by the GSTP1
rs1695 polymorphism,[126] although this polymorphism has not yet been
demonstrated in myeloma cell lines. It has been shown to inhibit JNK1 (c-Jun N-
terminal kinase) and alter kinase signalling in vitro.[127] Over-expression of the
GSTP1 gene has been implicated in progression of multiple myeloma and has
been suggested as a target biomarker for treatment of both MM and acute
myeloid leukaemia.[128, 129] We noted that GSTP1 was over-expressed in
bortezomib-treated VDR compared to bortezomib-treated MM.1R (fold change
2.76, p=0.004).
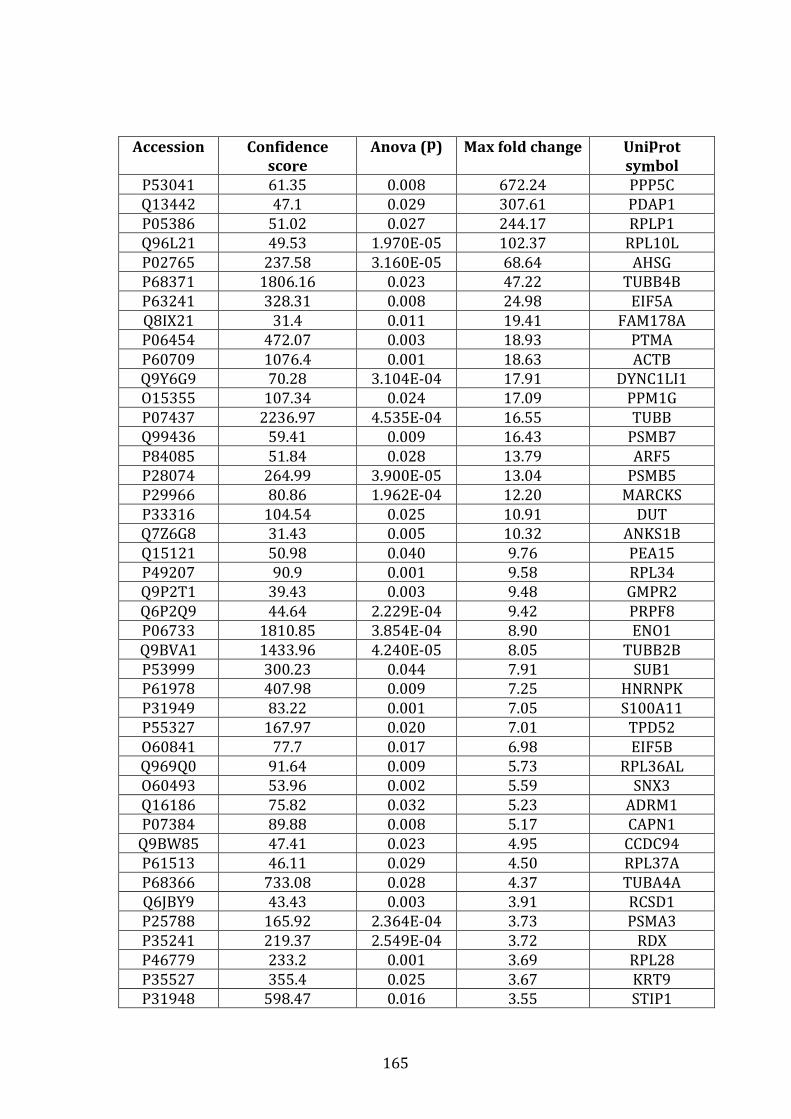
165
Accession Confidence
score
Anova (p) Max fold change Uniprot
symbol
P53041 61.35 0.008 672.24 PPP5C
Q13442 47.1 0.029 307.61 PDAP1
P05386 51.02 0.027 244.17 RPLP1
Q96L21 49.53 1.970E-05 102.37 RPL10L
P02765 237.58 3.160E-05 68.64 AHSG
P68371 1806.16 0.023 47.22 TUBB4B
P63241 328.31 0.008 24.98 EIF5A
Q8IX21 31.4 0.011 19.41 FAM178A
P06454 472.07 0.003 18.93 PTMA
P60709 1076.4 0.001 18.63 ACTB
Q9Y6G9 70.28 3.104E-04 17.91 DYNC1LI1
O15355 107.34 0.024 17.09 PPM1G
P07437 2236.97 4.535E-04 16.55 TUBB
Q99436 59.41 0.009 16.43 PSMB7
P84085 51.84 0.028 13.79 ARF5
P28074 264.99 3.900E-05 13.04 PSMB5
P29966 80.86 1.962E-04 12.20 MARCKS
P33316 104.54 0.025 10.91 DUT
Q7Z6G8 31.43 0.005 10.32 ANKS1B
Q15121 50.98 0.040 9.76 PEA15
P49207 90.9 0.001 9.58 RPL34
Q9P2T1 39.43 0.003 9.48 GMPR2
Q6P2Q9 44.64 2.229E-04 9.42 PRPF8
P06733 1810.85 3.854E-04 8.90 ENO1
Q9BVA1 1433.96 4.240E-05 8.05 TUBB2B
P53999 300.23 0.044 7.91 SUB1
P61978 407.98 0.009 7.25 HNRNPK
P31949 83.22 0.001 7.05 S100A11
P55327 167.97 0.020 7.01 TPD52
O60841 77.7 0.017 6.98 EIF5B
Q969Q0 91.64 0.009 5.73 RPL36AL
O60493 53.96 0.002 5.59 SNX3
Q16186 75.82 0.032 5.23 ADRM1
P07384 89.88 0.008 5.17 CAPN1
Q9BW85 47.41 0.023 4.95 CCDC94
P61513 46.11 0.029 4.50 RPL37A
P68366 733.08 0.028 4.37 TUBA4A
Q6JBY9 43.43 0.003 3.91 RCSD1
P25788 165.92 2.364E-04 3.73 PSMA3
P35241 219.37 2.549E-04 3.72 RDX
P46779 233.2 0.001 3.69 RPL28
P35527 355.4 0.025 3.67 KRT9
P31948 598.47 0.016 3.55 STIP1

166
Accession Confidence
score
Anova (p) Max fold change Uniprot
symbol
P10147 51.45 0.039 3.51 CCL3
P52566 285.3 3.534E-04 3.46 ARHGDIB
P60900 542.5 3.770E-04 3.41 PSMA6
Q9BY43 165.87 2.773E-04 3.36 CHMP4A
Q86V88 48.62 0.002 3.18 MDP1
Q9Y5B9 30.97 0.011 2.99 SUPT16H
P54868 41.02 2.510E-05 2.97 HMGCS2
P31146 979.24 0.009 2.96 CORO1A
P25787 203.79 0.004 2.88 PSMA2
P52565 229.83 0.005 2.88 ARHGDIA
Q00688 163.97 0.001 2.83 FKBP3
Q14103 276.02 0.023 2.80 HNRNPD
P09211 1156.32 0.004 2.76 GSTP1
P20073 153.12 0.046 2.65 ANXA7
P41250 320.35 0.030 2.62 GARS
O75874 97.43 0.001 2.47 IDH1
Q01081 76.53 0.006 2.42 U2AF1
Q9UL46 603.72 5.380E-05 2.39 PSME2
Q99959 62.08 0.004 2.33 PKP2
P28072 238.37 0.001 2.32 PSMB6
Q9NZB2 86.82 0.007 2.29 FAM120A
Q15637 48.07 0.049 2.28 SF1
P49721 239.73 3.156E-04 2.28 PSMB2
Q06323 820.35 0.001 2.09 PSME1
O15372 36.84 0.007 2.07 EIF3H
P30043 104.8 5.770E-06 2.06 BLVRB
P06744 430.26 0.036 2.03 GPI
P28066 283.21 0.001 2.01 PSMA5
O14818 244.26 0.001 2.00 PSMA7
Table 3.4.5.1.1 Proteins upregulated in bortezomib-treated VDR compared
to bortezomib-treated MM.1R by label free mass spectrometry
Proteins listed include those with fold change ≥2 where p<0.05. Proteins with
fold change >1,000 were excluded from this analysis. Of particular interest,
PSMB5 and CCL3 remained upregulated in bortezomib-treated VDR compared to
bortezomib-treated MM.1R.
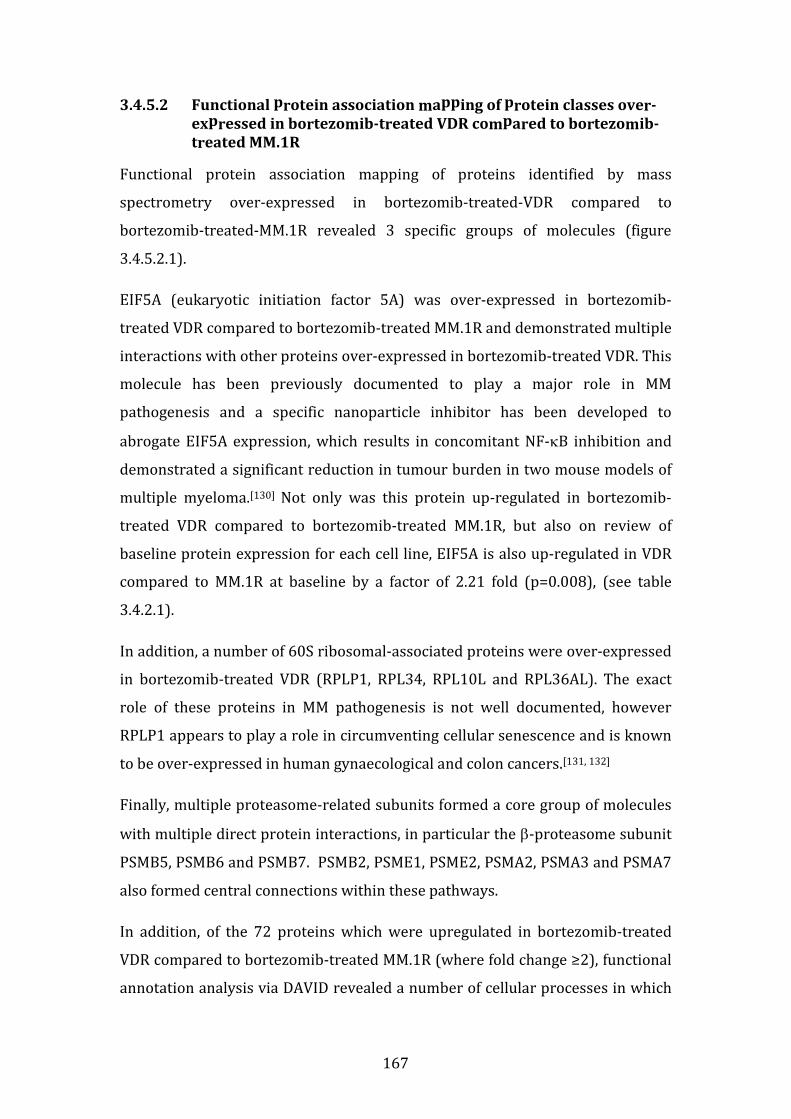
167
3.4.5.2 Functional protein association mapping of protein classes over-
expressed in bortezomib-treated VDR compared to bortezomib-
treated MM.1R
Functional protein association mapping of proteins identified by mass
spectrometry over-expressed in bortezomib-treated-VDR compared to
bortezomib-treated-MM.1R revealed 3 specific groups of molecules (figure
3.4.5.2.1).
EIF5A (eukaryotic initiation factor 5A) was over-expressed in bortezomib-
treated VDR compared to bortezomib-treated MM.1R and demonstrated multiple
interactions with other proteins over-expressed in bortezomib-treated VDR. This
molecule has been previously documented to play a major role in MM
pathogenesis and a specific nanoparticle inhibitor has been developed to
abrogate EIF5A expression, which results in concomitant NF-κB inhibition and
demonstrated a significant reduction in tumour burden in two mouse models of
multiple myeloma.[130] Not only was this protein up-regulated in bortezomib-
treated VDR compared to bortezomib-treated MM.1R, but also on review of
baseline protein expression for each cell line, EIF5A is also up-regulated in VDR
compared to MM.1R at baseline by a factor of 2.21 fold (p=0.008), (see table
3.4.2.1).
In addition, a number of 60S ribosomal-associated proteins were over-expressed
in bortezomib-treated VDR (RPLP1, RPL34, RPL10L and RPL36AL). The exact
role of these proteins in MM pathogenesis is not well documented, however
RPLP1 appears to play a role in circumventing cellular senescence and is known
to be over-expressed in human gynaecological and colon cancers.[131, 132]
Finally, multiple proteasome-related subunits formed a core group of molecules
with multiple direct protein interactions, in particular the β-proteasome subunit
PSMB5, PSMB6 and PSMB7. PSMB2, PSME1, PSME2, PSMA2, PSMA3 and PSMA7
also formed central connections within these pathways.
In addition, of the 72 proteins which were upregulated in bortezomib-treated
VDR compared to bortezomib-treated MM.1R (where fold change ≥2), functional
annotation analysis via DAVID revealed a number of cellular processes in which
168
these proteins are involved including negative regulation of protein
ubiquitination, negative regulation of cellular protein metabolic process and cell
cycle processes (table 3.4.5.2.1).
Finally, 2 proteins with established involvement in the glycolysis pathway were
found to be over-expressed in bortezomib-treated VDR compared to bortezomib-
treated MM.1R. These include glucose phosphate isomerase (GPI) and enolase
(ENO1). GPI is an enzyme early on in the glycolysis cycle that converts glucose-6-
phosphate to fructose-6-phosphate (and vice versa). ENO1 plays a role in the
second last step of pyruvate generation, by converting 2-phosphoglycerate to
phosphoenolpyruvate (prior to conversion of the latter by pyruvate kinase to
pyruvate), (figure 3.4.5.2.2), (david.abcc.ncifcrf.gov).
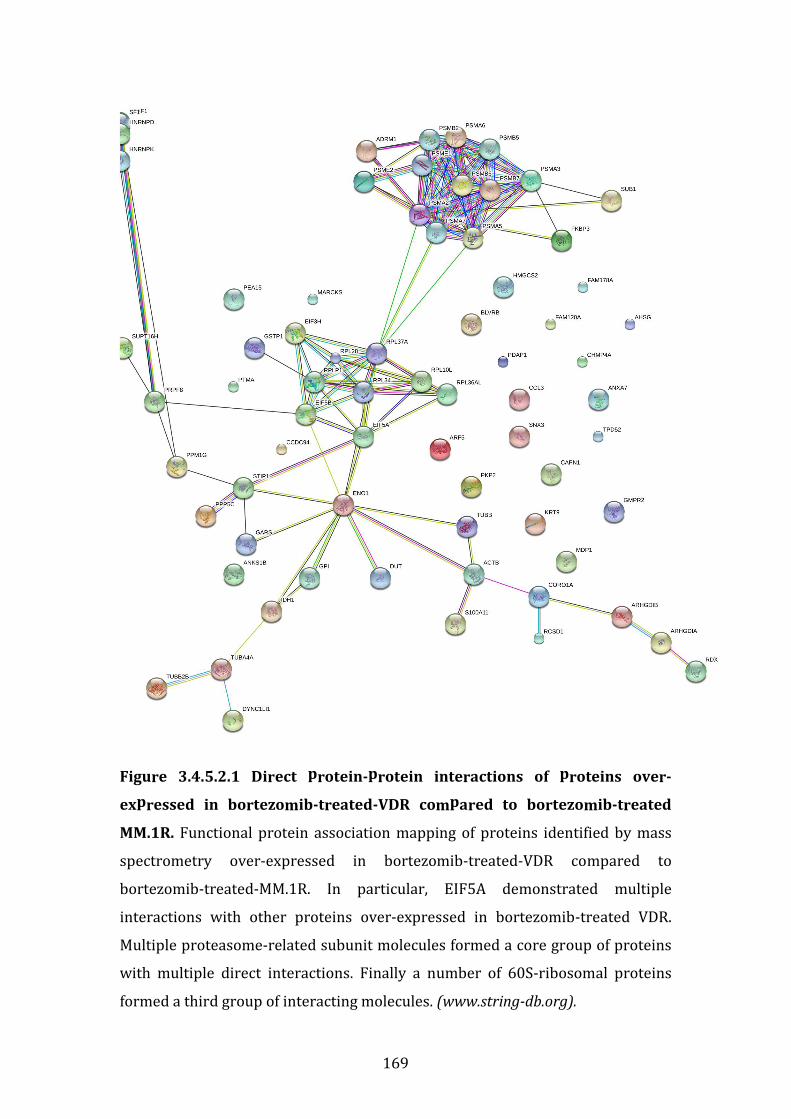
169
Figure 3.4.5.2.1 Direct protein-protein interactions of proteins over-
expressed in bortezomib-treated-VDR compared to bortezomib-treated
MM.1R. Functional protein association mapping of proteins identified by mass
spectrometry over-expressed in bortezomib-treated-VDR compared to
bortezomib-treated-MM.1R. In particular, EIF5A demonstrated multiple
interactions with other proteins over-expressed in bortezomib-treated VDR.
Multiple proteasome-related subunit molecules formed a core group of proteins
with multiple direct interactions. Finally a number of 60S-ribosomal proteins
formed a third group of interacting molecules. (www.string-db.org).
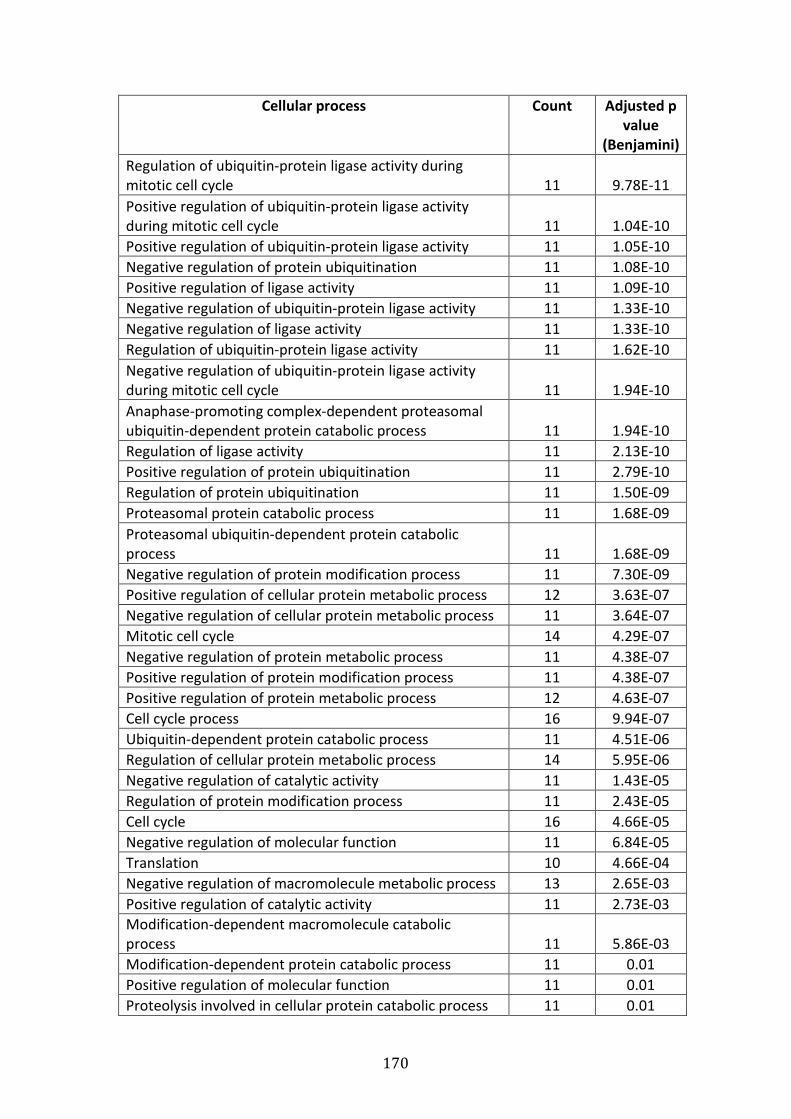
170
Cellular process Count Adjusted p
value
(Benjamini)
Regulation of ubiquitin-protein ligase activity during
mitotic cell cycle 11 9.78E-11
Positive regulation of ubiquitin-protein ligase activity
during mitotic cell cycle 11 1.04E-10
Positive regulation of ubiquitin-protein ligase activity 11 1.05E-10
Negative regulation of protein ubiquitination 11 1.08E-10
Positive regulation of ligase activity 11 1.09E-10
Negative regulation of ubiquitin-protein ligase activity 11 1.33E-10
Negative regulation of ligase activity 11 1.33E-10
Regulation of ubiquitin-protein ligase activity 11 1.62E-10
Negative regulation of ubiquitin-protein ligase activity
during mitotic cell cycle 11 1.94E-10
Anaphase-promoting complex-dependent proteasomal
ubiquitin-dependent protein catabolic process 11 1.94E-10
Regulation of ligase activity 11 2.13E-10
Positive regulation of protein ubiquitination 11 2.79E-10
Regulation of protein ubiquitination 11 1.50E-09
Proteasomal protein catabolic process 11 1.68E-09
Proteasomal ubiquitin-dependent protein catabolic
process 11 1.68E-09
Negative regulation of protein modification process 11 7.30E-09
Positive regulation of cellular protein metabolic process 12 3.63E-07
Negative regulation of cellular protein metabolic process 11 3.64E-07
Mitotic cell cycle 14 4.29E-07
Negative regulation of protein metabolic process 11 4.38E-07
Positive regulation of protein modification process 11 4.38E-07
Positive regulation of protein metabolic process 12 4.63E-07
Cell cycle process 16 9.94E-07
Ubiquitin-dependent protein catabolic process 11 4.51E-06
Regulation of cellular protein metabolic process 14 5.95E-06
Negative regulation of catalytic activity 11 1.43E-05
Regulation of protein modification process 11 2.43E-05
Cell cycle 16 4.66E-05
Negative regulation of molecular function 11 6.84E-05
Translation 10 4.66E-04
Negative regulation of macromolecule metabolic process 13 2.65E-03
Positive regulation of catalytic activity 11 2.73E-03
Modification-dependent macromolecule catabolic
process 11 5.86E-03
Modification-dependent protein catabolic process 11 0.01
Positive regulation of molecular function 11 0.01
Proteolysis involved in cellular protein catabolic process 11 0.01
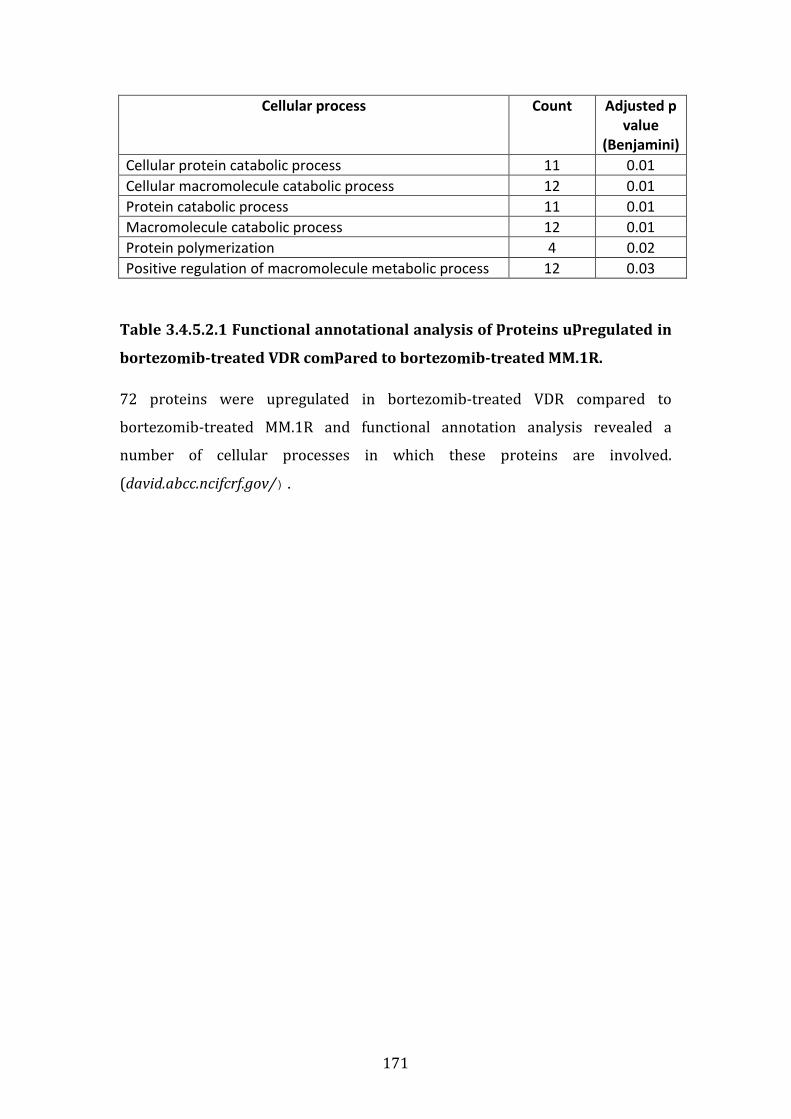
171
Cellular process Count Adjusted p
value
(Benjamini)
Cellular protein catabolic process 11 0.01
Cellular macromolecule catabolic process 12 0.01
Protein catabolic process 11 0.01
Macromolecule catabolic process 12 0.01
Protein polymerization 4 0.02
Positive regulation of macromolecule metabolic process 12 0.03
Table 3.4.5.2.1 Functional annotational analysis of proteins upregulated in
bortezomib-treated VDR compared to bortezomib-treated MM.1R.
72 proteins were upregulated in bortezomib-treated VDR compared to
bortezomib-treated MM.1R and functional annotation analysis revealed a
number of cellular processes in which these proteins are involved.
(david.abcc.ncifcrf.gov/).
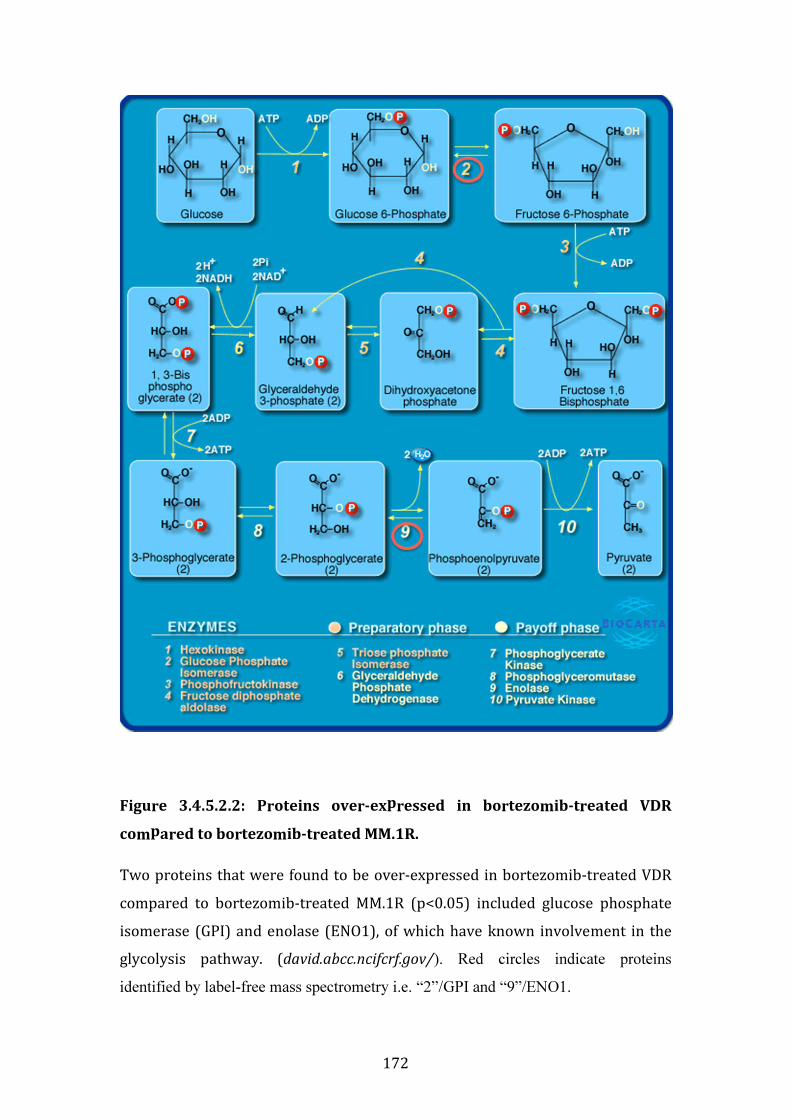
172
Figure 3.4.5.2.2: Proteins over-expressed in bortezomib-treated VDR
compared to bortezomib-treated MM.1R.
Two proteins that were found to be over-expressed in bortezomib-treated VDR
compared to bortezomib-treated MM.1R (p<0.05) included glucose phosphate
isomerase (GPI) and enolase (ENO1), of which have known involvement in the
glycolysis pathway. (david.abcc.ncifcrf.gov/). Red circles indicate proteins
identified by label-free mass spectrometry i.e. “2”/GPI and “9”/ENO1.
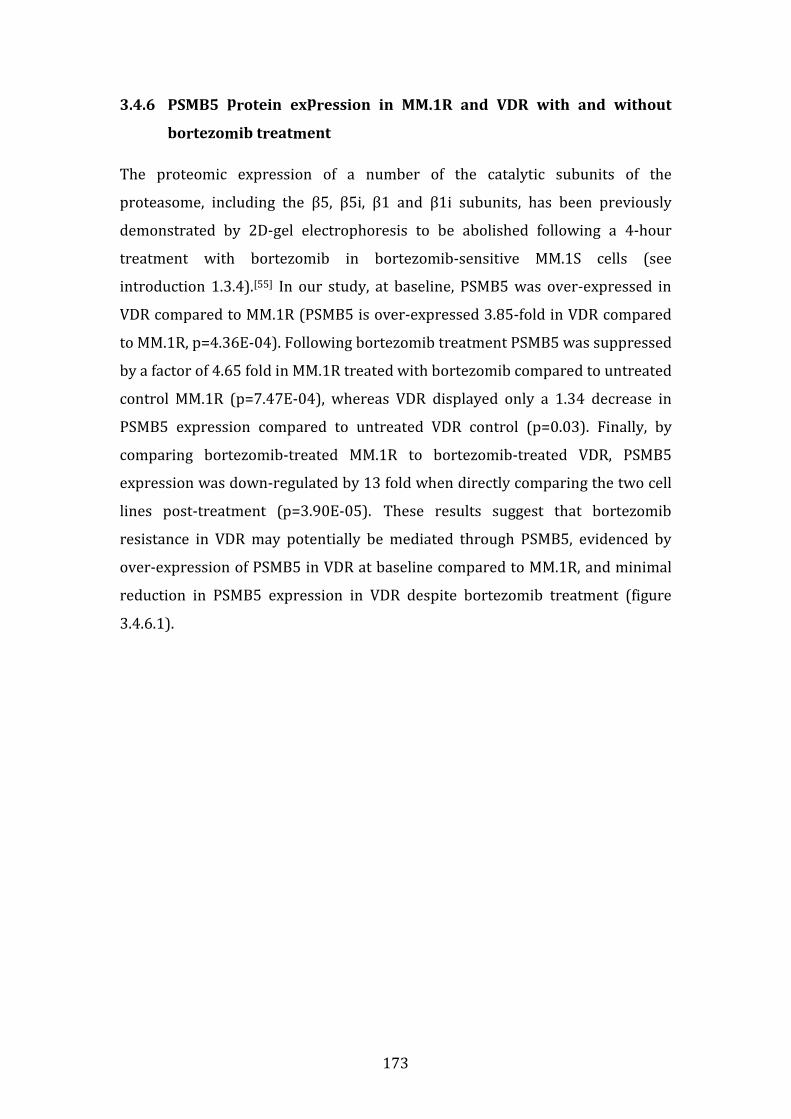
173
3.4.6 PSMB5 protein expression in MM.1R and VDR with and without
bortezomib treatment
The proteomic expression of a number of the catalytic subunits of the
proteasome, including the β5, β5i, β1 and β1i subunits, has been previously
demonstrated by 2D-gel electrophoresis to be abolished following a 4-hour
treatment with bortezomib in bortezomib-sensitive MM.1S cells (see
introduction 1.3.4).[55] In our study, at baseline, PSMB5 was over-expressed in
VDR compared to MM.1R (PSMB5 is over-expressed 3.85-fold in VDR compared
to MM.1R, p=4.36E-04). Following bortezomib treatment PSMB5 was suppressed
by a factor of 4.65 fold in MM.1R treated with bortezomib compared to untreated
control MM.1R (p=7.47E-04), whereas VDR displayed only a 1.34 decrease in
PSMB5 expression compared to untreated VDR control (p=0.03). Finally, by
comparing bortezomib-treated MM.1R to bortezomib-treated VDR, PSMB5
expression was down-regulated by 13 fold when directly comparing the two cell
lines post-treatment (p=3.90E-05). These results suggest that bortezomib
resistance in VDR may potentially be mediated through PSMB5, evidenced by
over-expression of PSMB5 in VDR at baseline compared to MM.1R, and minimal
reduction in PSMB5 expression in VDR despite bortezomib treatment (figure
3.4.6.1).
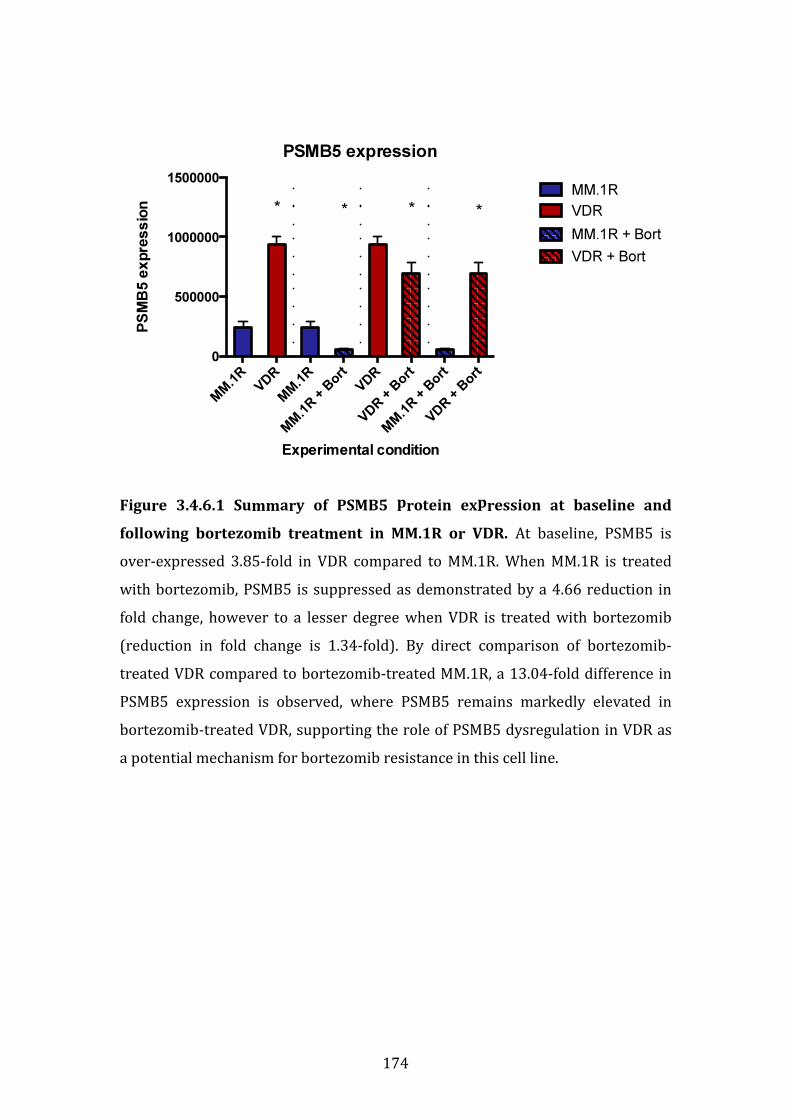
174
Figure 3.4.6.1 Summary of PSMB5 protein expression at baseline and
following bortezomib treatment in MM.1R or VDR. At baseline, PSMB5 is
over-expressed 3.85-fold in VDR compared to MM.1R. When MM.1R is treated
with bortezomib, PSMB5 is suppressed as demonstrated by a 4.66 reduction in
fold change, however to a lesser degree when VDR is treated with bortezomib
(reduction in fold change is 1.34-fold). By direct comparison of bortezomib-
treated VDR compared to bortezomib-treated MM.1R, a 13.04-fold difference in
PSMB5 expression is observed, where PSMB5 remains markedly elevated in
bortezomib-treated VDR, supporting the role of PSMB5 dysregulation in VDR as
a potential mechanism for bortezomib resistance in this cell line.
PSMB5 expression
Experimental condition
PS
MB
5 e
xpre
ss
ion
MM
.1R
VDR
MM
.1R
MM
.1R +
Bort
VDR
VDR +
Bort
MM
.1R +
Bort
VDR +
Bort
0
500000
1000000
1500000
MM.1R
VDR
MM.1R + Bort
VDR + Bort
* * * *
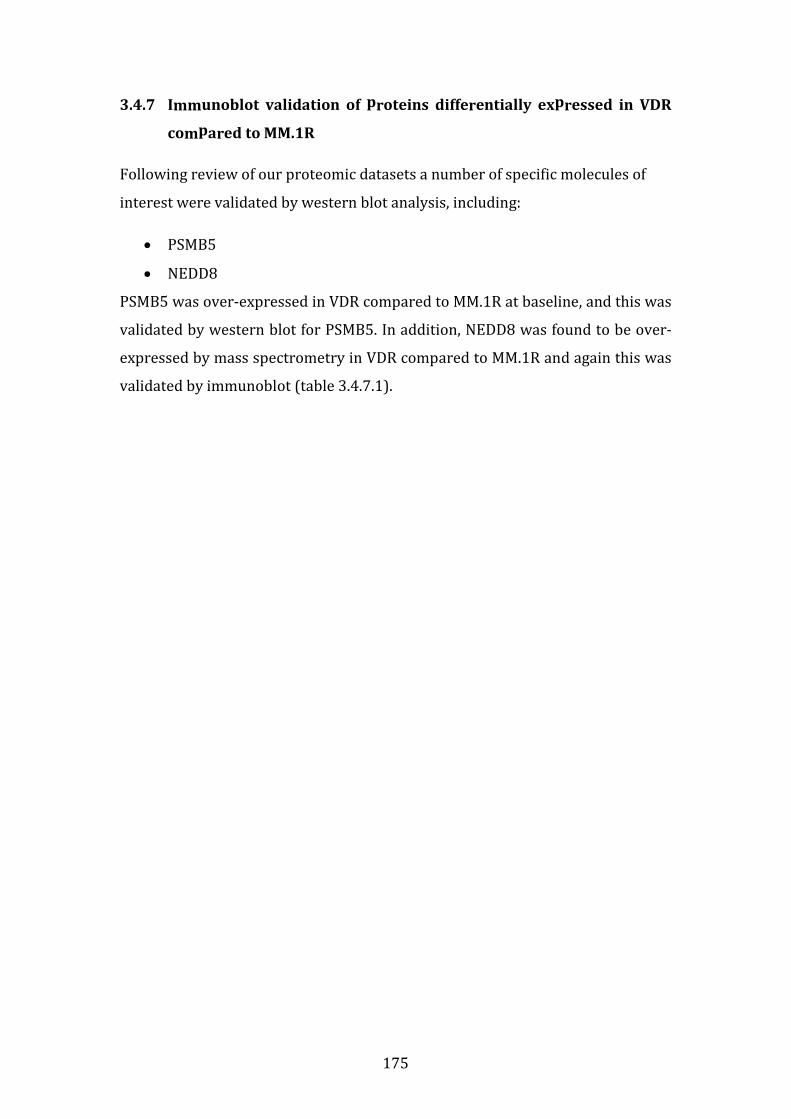
175
3.4.7 Immunoblot validation of proteins differentially expressed in VDR
compared to MM.1R
Following review of our proteomic datasets a number of specific molecules of
interest were validated by western blot analysis, including:
• PSMB5
• NEDD8
PSMB5 was over-expressed in VDR compared to MM.1R at baseline, and this was
validated by western blot for PSMB5. In addition, NEDD8 was found to be over-
expressed by mass spectrometry in VDR compared to MM.1R and again this was
validated by immunoblot (table 3.4.7.1).
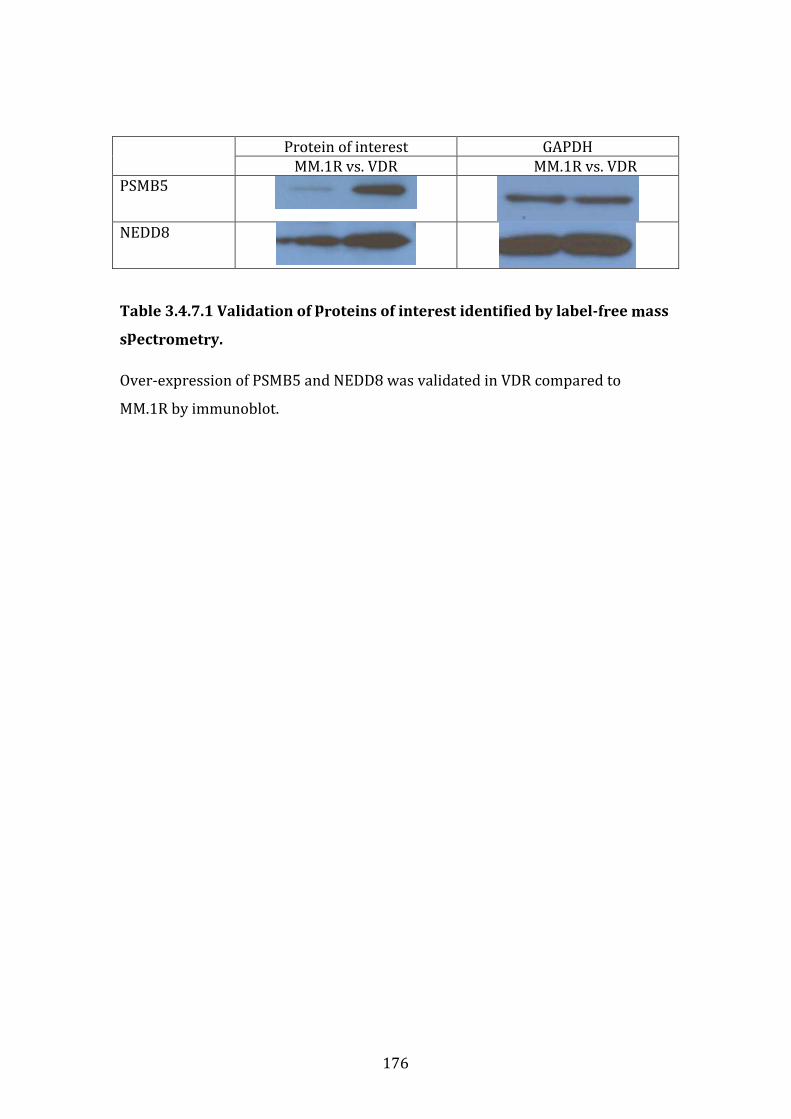
176
Protein of interest GAPDH
MM.1R vs. VDR MM.1R vs. VDR
PSMB5
NEDD8
Table 3.4.7.1 Validation of proteins of interest identified by label-free mass
spectrometry.
Over-expression of PSMB5 and NEDD8 was validated in VDR compared to
MM.1R by immunoblot.
177
3.4.8 Summary of proteomic profiling studies
We examined the proteomic profiles of the isogenic cell lines MM.1R and VDR, in
addition to investigating the proteins differentially expressed following their
treatment with bortezomib.
We identified 238 proteins differentially expressed in the MM.1R vs. VDR
comparison. CCL3 demonstrated a 22-fold higher expression level in VDR
compared to MM.1R. This protein has been previously documented to contribute
to myelomatous bone disease, and an inhibitor of CLL1 through which CCL3
signals is currently in pre-clinical investigation that has shown promising anti-
myelomatous and anti-osteolytic effects in a MM in vivo mouse model. Further
studies could include examining the sensitivity of VDR cells to bortezomib in the
presence of a CCL1 inhibitor. In addition NEDD8 and PSMB5 were also found to
be over-expressed in VDR when compared to MM.1R.
Functional protein association mapping of proteins by String software revealed
the heat shock proteins as a common subgroup of proteins over-expressed in
VDR. DAVID functional annotation tool revealed a number of proteins over-
expressed in VDR that are involved in apoptosis, regulation of cellular metabolic
processes, cellular homeostasis, cell cycle process and proteasomal ubiquitin-
dependent protein catabolic process.
Of the 238 proteins in total differentially expressed in the MM.1R vs. VDR
comparison, 132 were down-regulated in VDR compared to MM.1R. Three
proteins that were found to be down-regulated in VDR compared to MM.1R were
found to be involved in aminoacyl tRNA biosynthesis, and these included IARS,
RARS and LARS.
Following bortezomib treatment, 212 proteins in MM.1R and only 35 proteins in
VDR were down-regulated post-treatment compared to their respective
bortezomib-untreated controls. Furthermore, comparing bortezomib-treated
MM.1R to bortezomib-treated VDR, 109 proteins out of a total 323 were
downregulated in bortezomib-treated-VDR compared to bortezomib-treated-

178
MM.1R, of which 63 demonstrated a fold change ≥1.5 (where p<0.05). DAVID
functional annotation tool again allowed us to review proteins down-regulated
following bortezomib treatment in either cell line. A number of proteins involved
in the proteasome structure were suppressed in both bortezomib-treated MM.1R
and bortezomib-treated VDR compared to their respective untreated controls.
PSMD13, PSMA1, PSMA2, PSMA3, PSMA4, PSMA5, PSMA6, PSMA7, PSMB1,
PSMB2, PSMB5, PSMB6, PSMB8 were all found to be down-regulated in
bortezomib-treated MM.1R compared to untreated MM.1R; PSMB5 however was
not down-regulated in bortezomib-treated VDR compared to untreated VDR
control.
Taking a closer look, we found 5 proteins that were down-regulated in
bortezomib-treated VDR compared to bortezomib-treated MM.1R that are
involved in the MAP-kinase signalling pathway, which when altered, is well
documented for its role in carcinogenesis. These proteins including FLNA,
HSP72/HSPA6, PPP3C, MEF2C and HSP27/HSPB1 that are differentially
expressed in bortezomib-treated VDR compared to bortezomib-treated MM.1R
warrant further investigation to establish if they play a role in bortezomib
refractoriness in VDR.
We found 215 proteins up-regulated in bortezomib-treated VDR compared to
bortezomib-treated MM.1R, of which 78 proteins had a fold change ≥2. These
included PSMB5, PSMB7 (responsible for trypsin-like protein cleavage at the β2-
subunit) and PSMB6 (responsible for chymotrypsin-like proteolytic cleavage at
the β-1 subunit). In addition CCL3 was markedly over-expressed in bortezomib-
treated VDR compared to bortezomib-treated MM.1R. This again poses the
question as to whether or not the addition of a CCL1 inhibitor may have the
potential to overcome bortezomib resistance in VDR. Finally we noted that
GSTP1 was over-expressed in bortezomib-treated VDR compared to bortezomib-
treated MM.1R, a protein whose over-expression has been implicated in both the
progression of multiple myeloma, and has been suggested as a target biomarker
for treatment of both MM and acute myeloid leukaemia.
179
EIF5A (eukaryotic initiation factor 5A) was over-expressed in bortezomib-
treated VDR compared to bortezomib-treated MM.1R. A specific nanoparticle
inhibitor has previously been developed to abrogate EIF5A expression, which
results in concomitant NF-κB inhibition, and also demonstrated a significant
reduction in tumour burden in two mouse models of multiple myeloma.[130] Not
only was this protein up-regulated in bortezomib-treated VDR compared to
bortezomib-treated MM.1R, but also over-expressed in VDR compared to MM.1R
at baseline. This raises the question whether EIF5A could act as an additional
potential regulator for bortezomib refractoriness in the VDR cell line.
Finally, PSMB5 is over-expressed 3.85-fold in VDR compared to MM.1R at
baseline. When MM.1R is treated with bortezomib, PSMB5 is suppressed as
demonstrated by a 4.66 reduction in fold change, however to a lesser degree
(1.34-fold) when VDR is treated with bortezomib. By direct comparison of
bortezomib-treated VDR compared to bortezomib-treated MM.1R, a 13-fold
increase in PSMB5 expression is observed in bortezomib-treated VDR,
supporting the role of PSMB5 dysregulation in VDR as a potential mechanism for
bortezomib resistance in this cell line.
180
3.5 FUNCTIONAL STUDIES AND POTENTIAL ROLE OF THE BONE
MARROW MICROENVIRONMENT IN THE PATHOGENESIS OF
BORTEZOMIB RESISTANCE IN VDR
3.5.1 Introduction
While we have demonstrated the toxicological profile of the VDR cell line to
conventional and novel therapies, and examined its genetic mutations, gene
expression and proteomic profiles in comparison to parental MM.1R, we cannot
consider the cell line model as an entity independent of its microenvironment. As
outlined in the introduction (section 1.6), myeloma cells co-exist with
surrounding accessory cells, many of which appear to stimulate their growth.
The bone marrow microenvironment plays a major role in resistance
mechanisms in MM by either direct or indirect interactions between bone
marrow stromal cells and tumour cells.[73, 133] Bortezomib has been shown to
abrogate protective effects conferred by stromal cells to tumour cells in vitro, in
particular in relation to IL-6 signalling.[134] Therefore we examined the effect of
HS-5 stromal cells in co-culture with our bortezomib-resistant clone, VDR.
We examined the sensitivity of the isogenic cell line model to conventional and
novel therapies in the presence and absence of HS-5 stromal cells. We examined
the baseline proliferation rate of both MM.1R and VDR. We then investigated the
effect of osteoblasts on the proliferation rate of the MM cell lines to ascertain if
the stromal-induced effects were specific to HS-5 cells or merely a cell-to-cell
ratio effect. We furthermore examined the effect of osteoblasts on the drug
sensitivity of VDR cell line to a number of therapies.
Finally, given that there was marked overexpression of PSMB5 at the proteomic
and transcript levels, in addition to the finding of a PSMB5 mutation in the VDR
cell, we hypothesised if bortezomib resistance could potentially be overcome by
up-regulating the PSMB5 immunoproteasome counterpart, PSMB8. By pre-
treating VDR cells with interferon-gamma, we observed an increase in sensitivity
of VDR cells to bortezomib, potentially by up-regulation of PSMB8 as
demonstrated by western blot. While interferon-gamma did not completely
181
resensitise VDR to bortezomib, it appears to have the potential to play a role in
over-coming bortezomib resistance in VDR. To test our hypothesis in the in vivo
setting, we ran immunohistochemistry on bone marrow trephines of patients
with bortezomib-refractory multiple myeloma, which revealed PSMB8 was
present in the bone marrow of this patient group. These data support a role for
the use of PSMB8 inhibitors in the setting of bortezomib resistance in vivo.
3.5.2 Effect of HS-5 stromal cells on sensitivity of MM1R and VDR to
bortezomib and carfilzomib
We first investigated the sensitivity of MM.1R and VDR cells to either bortezomib
or carfilzomib following their co-culture with immortalised bone marrow
stromal cells, i.e. HS-5 cell line. HS-5 cells were plated in a 96 well-plate and
allowed to adhere for 6 hours. Next MM.1R or VDR cells were added and cultured
in the presence or absence of HS-5 cells, and co-cultures were performed for 24,
48 and 72 hours each. Finally each co-culture condition was treated with
bortezomib 0-80nM or carfilzomib 0-20nM for 24hours. Then cell viability was
analysed by CSBLI, (see materials and methods 2.7).
We observed no change in the sensitivity of MM.1R to bortezomib despite its co-
culture with HS-5 stromal cells. VDR retained the same degree of resistance to
bortezomib following HS-5 co-culture, (figure 3.5.2.1). Interestingly MM.1R cells
appeared to display resistance to carfilzomib following their co-culture with HS-
5 cells, and the degree of resistance to carfilzomib increased with duration of
preceding co-culture time. The mechanism for this observation is not clear.
Finally VDR cells retained their sensitivity to carfilzomib despite their co-culture
with HS-5 cells, (figure 3.5.2.2).

182
Figure 3.5.2.1: Co-culture of MM.1R and VDR with HS-5 stromal cells and
subsequent bortezomib treatment.
No change in the sensitivity of MM.1R to bortezomib was observed despite its co-
culture with HS-5 stromal cells. VDR retained the same degree of resistance to
bortezomib following its co-culture with HS-5 cells. (Note: c= monoculture;
cc=co-culture).
MM1R_Bortezomib
Bortezomib (nM) x24hrs
Ce
ll V
iab
ility
(%
)
0 20 40 60 80 100
0
50
100
150 - HS5 (24hr c)
+ HS5 (24hr cc)
- HS5 (48hr c)
+ HS5 (48hr cc)
- HS5 (72hr c)
+ HS5 (72hr cc)
VDR_Bortezomib
Bortezomib (nM) x24hrs
Ce
ll V
iab
ility
(%
)
0 20 40 60 80 100
0
50
100
150 - HS5 (24hr c)
+ HS5 (24hr cc)
- HS5 (48hr c)
+ HS5 (48hr cc)
- HS5 (72hr c)
+ HS5 (72hr cc)
Rela
tive
R
ela
tive

183
Figure 3.5.2.2: Co-culture of MM.1R and VDR with HS-5 stromal cells and
subsequent carfilzomib treatment.
MM.1R cells appeared to display reduced sensitivity to carfilzomib following
their co-culture with HS-5 cells, and reduced sensitivity to carfilzomib was
observed with increased duration of co-culture time. VDR cells retained their
sensitivity to carfilzomib despite their co-culture with HS-5 cells (Note: c=
monoculture; cc=co-culture, CFZ= carfilzomib).
MM1R_CFZ
Carfilzomib (nM) x 24hrs
Ce
ll V
iab
ility
(%
)
0 5 10 15 20 25
0
50
100
150 - HS5 (24hr c)
+ HS5 (24hr cc)
- HS5 (48hr c)
+ HS5 (48hr cc)
- HS5 (72hr c)
+ HS5 (72hr cc)
VDR_CFZ
Carfilzomib (nM) x 24hrs
Ce
ll V
iab
ility
(%
)
0 5 10 15 20 25
0
50
100
150 - HS5 (24hr c)
+ HS5 (24hr cc)
- HS5 (48hr c)
+ HS5 (48hr cc)
- HS5 (72hr c)
+ HS5 (72hr cc)
Rela
tive
R
ela
tive
184
3.5.3 Investigation of the role for combination therapies to overcome
bortezomib resistance in VDR cells in co-culture with HS-5 stromal
cells
We next examined the effect of HS-5 stromal cells on the sensitivity of VDR cells
to novel therapies. We found that the presence of HS-5 stromal cells in co-culture
with VDR caused resistance to both the novel FDA-approved HDAC inhibitor
vorinostat, and resistance to NEDD8-activating enzyme inhibitor MLN4924, (a
reagent in which a phase 1 clinical trials for multiple myeloma and lymphoma
has been completed with results pending), (figure 3.5.3.1). We next tested the
combination of these two agents with bortezomib in our in vitro model in co-
culture with HS-5 stromal cells. The protective effect conferred to the VDR cells
by HS-5 stromal cells was not overcome by combination of either vorinostat or
MLN4924 with bortezomib, (figure 3.5.3.2).
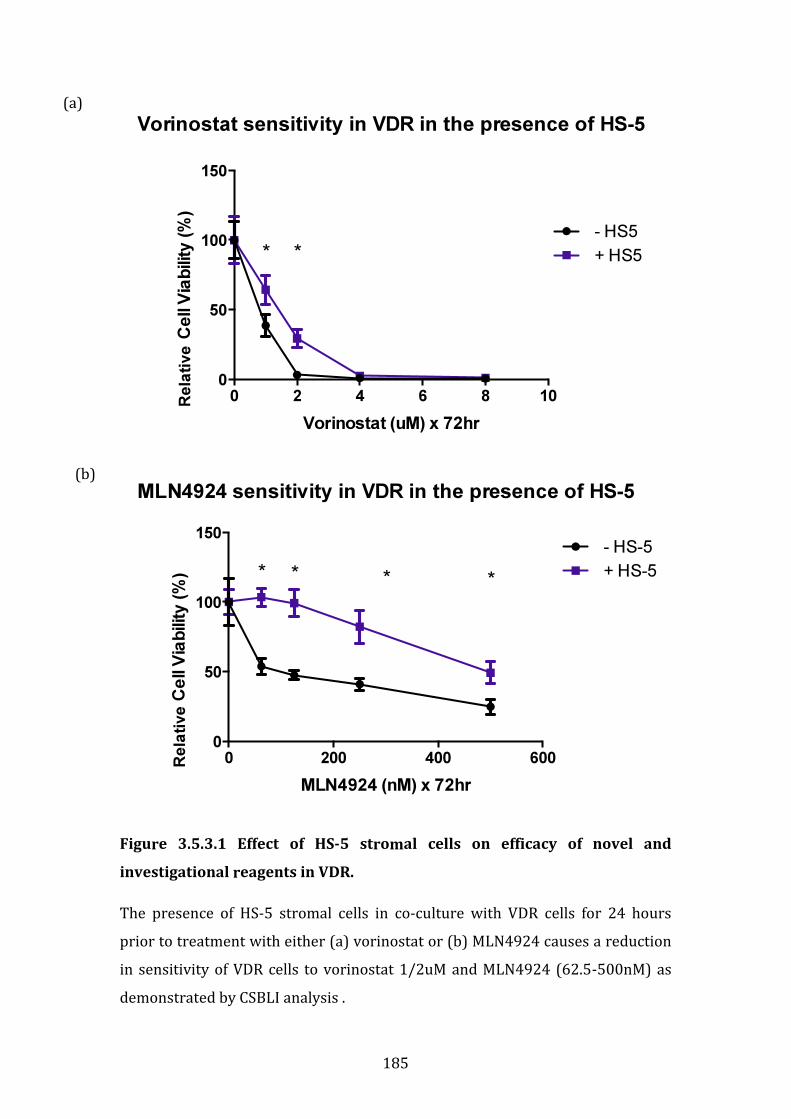
185
Figure 3.5.3.1 Effect of HS-5 stromal cells on efficacy of novel and
investigational reagents in VDR.
The presence of HS-5 stromal cells in co-culture with VDR cells for 24 hours
prior to treatment with either (a) vorinostat or (b) MLN4924 causes a reduction
in sensitivity of VDR cells to vorinostat 1/2uM and MLN4924 (62.5-500nM) as
demonstrated by CSBLI analysis .
Vorinostat sensitivity in VDR in the presence of HS-5
Vorinostat (uM) x 72hr
Ce
ll V
iab
ilit
y (
%)
0 2 4 6 8 10
0
50
100
150
- HS5
+ HS5**
MLN4924 sensitivity in VDR in the presence of HS-5
MLN4924 (nM) x 72hr
Ce
ll V
iab
ilit
y (
%)
0 200 400 600
0
50
100
150 - HS-5
+ HS-5* * * *
(a)
(b)
Rela
tive
R
ela
tive
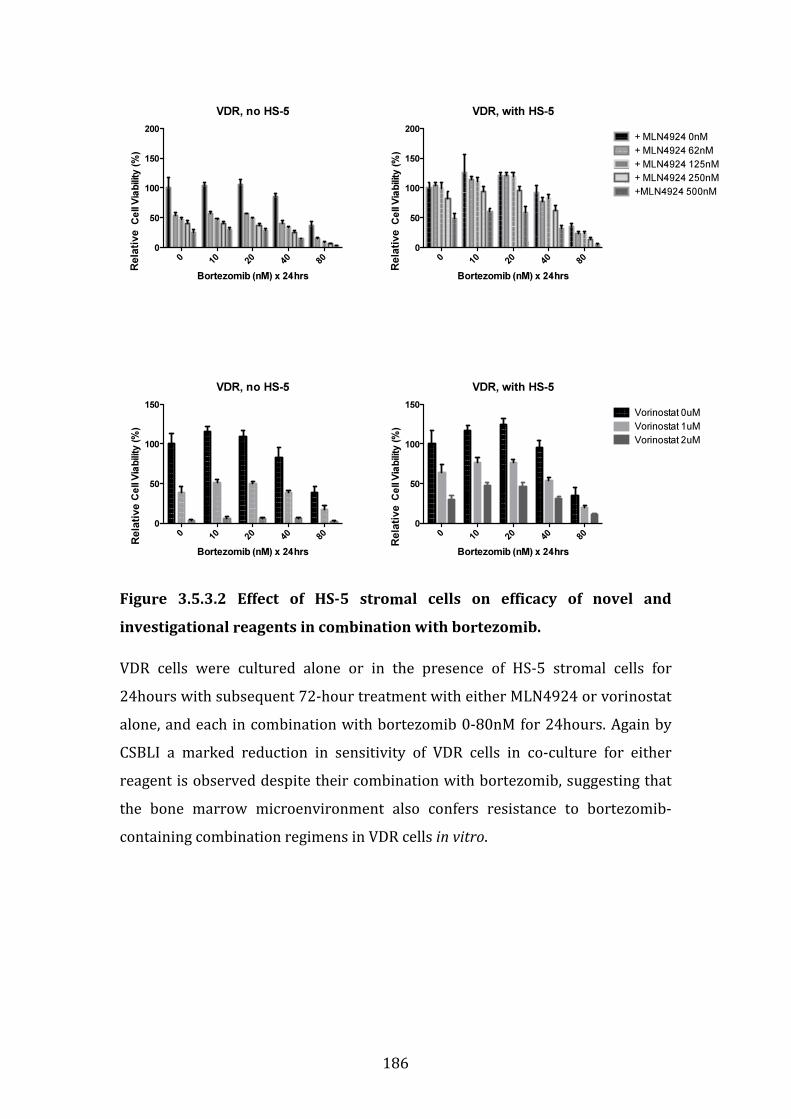
186
Figure 3.5.3.2 Effect of HS-5 stromal cells on efficacy of novel and
investigational reagents in combination with bortezomib.
VDR cells were cultured alone or in the presence of HS-5 stromal cells for
24hours with subsequent 72-hour treatment with either MLN4924 or vorinostat
alone, and each in combination with bortezomib 0-80nM for 24hours. Again by
CSBLI a marked reduction in sensitivity of VDR cells in co-culture for either
reagent is observed despite their combination with bortezomib, suggesting that
the bone marrow microenvironment also confers resistance to bortezomib-
containing combination regimens in VDR cells in vitro.
VDR, no HS-5
Bortezomib (nM) x 24hrs
Ce
ll V
iab
ility
(%
)
010
20
40
80
0
50
100
150
200
VDR, no HS-5
Bortezomib (nM) x 24hrs
Ce
ll V
iab
ility
(%
)
010
20
40
80
0
50
100
150
VDR, with HS-5
Bortezomib (nM) x 24hrs
Ce
ll V
iab
ility
(%
)
010
20
40
80
0
50
100
150
200+ MLN4924 0nM
+ MLN4924 62nM
+ MLN4924 125nM
+ MLN4924 250nM
+MLN4924 500nM
VDR, with HS-5
Bortezomib (nM) x 24hrs
Ce
ll V
iab
ility
(%
)
010
20
40
80
0
50
100
150Vorinostat 0uM
Vorinostat 1uM
Vorinostat 2uM
Rela
tive
Rela
tive
Rela
tive
Rela
tive

187
3.5.4 Effect of osteoblasts on proliferation rate and sensitivity of MM.1S,
MM.1R and VDR to therapies in vitro
In order to examine further bone marrow accessory cells involvement in
bortezomib resistance we next undertook a series of experiments to examine the
potential role that osteoblasts play in the pathogenesis of bortezomib resistance.
We first examined the baseline effect of osteoblast-like cell line hFob
(immortalised human foetal osteoblast-like 1.19 cells) on the proliferation rate
of a number of multiple myeloma cell lines (n=8). On day 1 hFob was plated at a
seeding density of 40,000 cells/mL and allowed to adhere overnight. The
following day MM cell lines were added in triplicate at a seeding density of
20,000 cells/mL and cultured alone or in the presence of hFob cells for 24 and
48-hours. The bortezomib resistant cell line VDR displayed a marked increase in
cell viability when co-cultured in the presence of hFob cell line at both 24 and
48-hour timepoints (figure 3.5.4.1), (see Materials and Methods 2.3 and 2.7 for
further information of co-culture methods).
Next we examined the sensitivity of MM.1S, MM.1R and VDR to novel and
conventional therapies following their co-culture with hFob cells. Again hFob
cells were plated and allowed to adhere for 6 hours, before the addition of
MM.1S, MM.1R or VDR to the plates, and each of the 3 cell lines were cultured
alone or in the presence of hFob cells for 24 hours prior to treatment with either
conventional (dexamethasone, doxorubicin), novel (bortezomib, lenalidomide,
vorinostat) or investigational (JQ1) therapies. For this experiment the cells were
plated in a 1:1 ratio to avoid MM cell overgrowth in the plates. We made a
number of observations from these studies: firstly MM.1S appeared to be the cell
line that was most susceptible to changes in drug sensitivity when co-cultured
with hFob cells, and this was observed in treatments with dexamethasone,
doxorubicin and vorinostat. In addition resistance to doxorubicin was evident in
MM.1R and VDR cells in co-culture with hFob also. No change in sensitivity of
any cell line to lenalidomide, JQ1 or bortezomib was observed when in co-culture
with hFob (figure 3.5.4.2).

188
Figure 3.5.4.1: Relative cell viability of MM cell lines following their co-
culture with immortalised human foetal osteoblast-like cell line hFob. VDR
cell line in co-culture with hFob 1.1.9 revealed a marked increase in relative cell
viability compared to VDR in culture alone after 24 and 48 hours.
24 hour co-culture
MM
1S
MM
1RVDR
OPM
2
OCIm
y5
KM
S34
RPM
I822
6
Dox
400
50
100
150
200
200
220
240
260 No hFob
With hFob
MM cell line
Ce
ll V
iab
ility
(%
)
48 hour co-culture
MM
1S
MM
1RVD
R
OPM
2
OCIm
y5
KM
S34
RPM
I822
6
Dox
400
50
100
150
200
200
250
300
350
400No hFob
With hFob
Cell line
Ce
ll V
iab
ility
(%
)R
ela
tive
Rela
tive
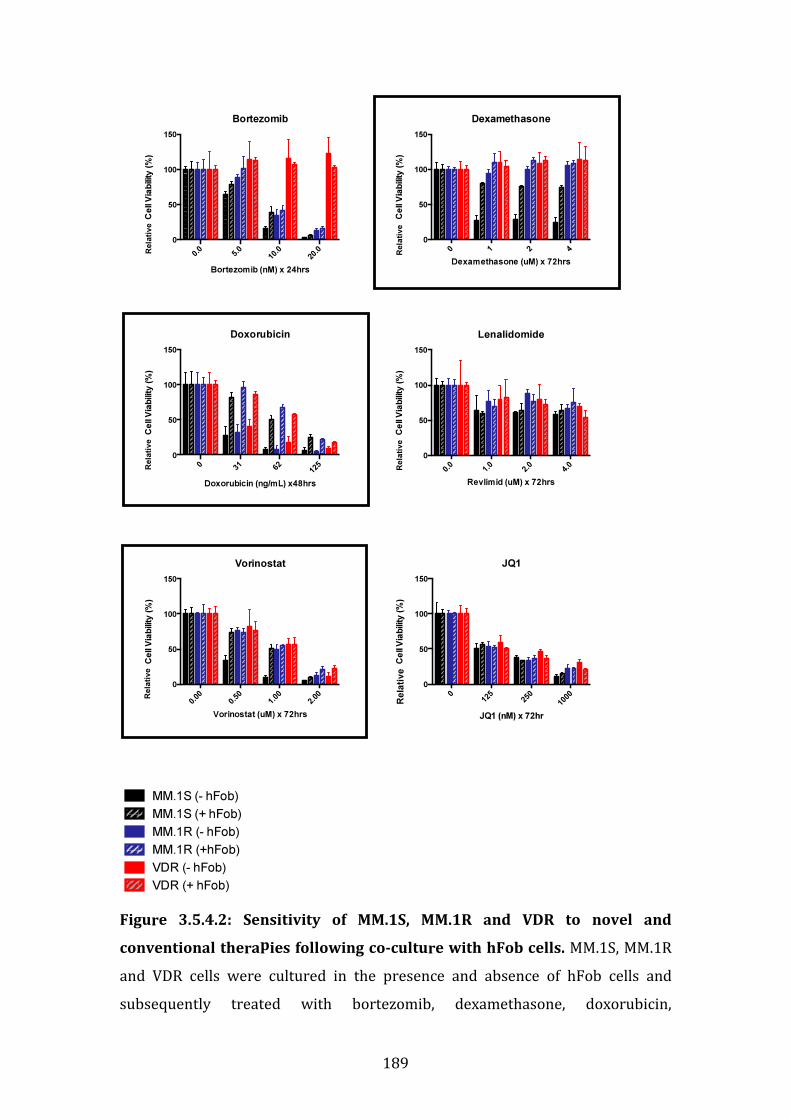
189
Figure 3.5.4.2: Sensitivity of MM.1S, MM.1R and VDR to novel and
conventional therapies following co-culture with hFob cells. MM.1S, MM.1R
and VDR cells were cultured in the presence and absence of hFob cells and
subsequently treated with bortezomib, dexamethasone, doxorubicin,
Bortezomib
0.0
5.0
10.0
20.0
0
50
100
150
Ce
ll V
iab
ility
(%
)
Bortezomib (nM) x 24hrs
Doxorubicin
Doxorubicin (ng/mL) x48hrs
Ce
ll V
iab
ilit
y (
%)
031
62
125
0
50
100
150
Vorinostat
Vorinostat (uM) x 72hrs
Ce
ll V
iab
ility
(%
)
0.00
0.50
1.00
2.00
0
50
100
150
Dexamethasone
Dexamethasone (uM) x 72hrs
Ce
ll V
iab
ility
(%
)
0 1 2 4
0
50
100
150
Lenalidomide
Revlimid (uM) x 72hrs
Ce
ll V
iab
ilit
y (
%)
0.0
1.0
2.0
4.0
0
50
100
150
JQ1
JQ1 (nM) x 72hr
Ce
ll V
iab
ility
(%
)
0125
250
1000
0
50
100
150
MM.1S (- hFob)
MM.1S (+ hFob)
MM.1R (- hFob)
MM.1R (+hFob)
VDR (- hFob)
VDR (+ hFob)
Rela
tive
Rela
tive
Rela
tive
Rela
tive
Rela
tive
Rela
tive

190
lenalidomide, vorinostat or JQ1. (Note 1: Black= MM.1S, Blue= MM.1R, Red= VDR;
Solid=no hFob; Stripes= Plus hFob). (Note 2: black squares indicate observations
of drug resistance in MM.1S cell line in co-culture with hFob).
191
3.5.5 Role of direct cell-to-cell contact in osteoblast-like cell-induced drug
resistance in MM.1S
As we observed a change in the drug sensitivity in MM.1S to a number of
reagents following their co-culture with osteoblast-like cells hFob, we next
determined whether or not direct cell to cell contact was necessary for this
observation to occur.
Transwell plates were used to culture MM.1S cells in the presence and absence of
hFob cells, those in co-culture were not however in direct contact (see Materials
and Methods section 2.16). The cellular compartments were treated with
doxorubicin, vorinostat or lenalidomide as previously described. Once treatment
was complete, the viability of the MM.1S cells was analysed by CSBLI.
We again observed a significant reduction in sensitivity of MM.1S to doxorubicin
when MM.1S was in co-culture with hFob but without direct cell-to-cell contact,
suggesting that direct cell-to-cell contact is not essential for hFob-induced
doxorubicin resistance in MM.1S. No change in sensitivity was observed in
MM.1S cells treated with vorinostat when in co-culture with hFob, suggesting
that direct cell-to-cell contact is necessary in osteoblast-induced resistance to
vorinostat. Finally, as a control, MM.1S cells were co-cultured without direct cell-
to-cell contact also with hFob, and treated with lenalidomide. Our previous
observation, i.e. no change in sensitivity to lenalidomide when the cells are in
direct contact with hFob, was confirmed in the transwell experiment (Figure
3.5.5.1).
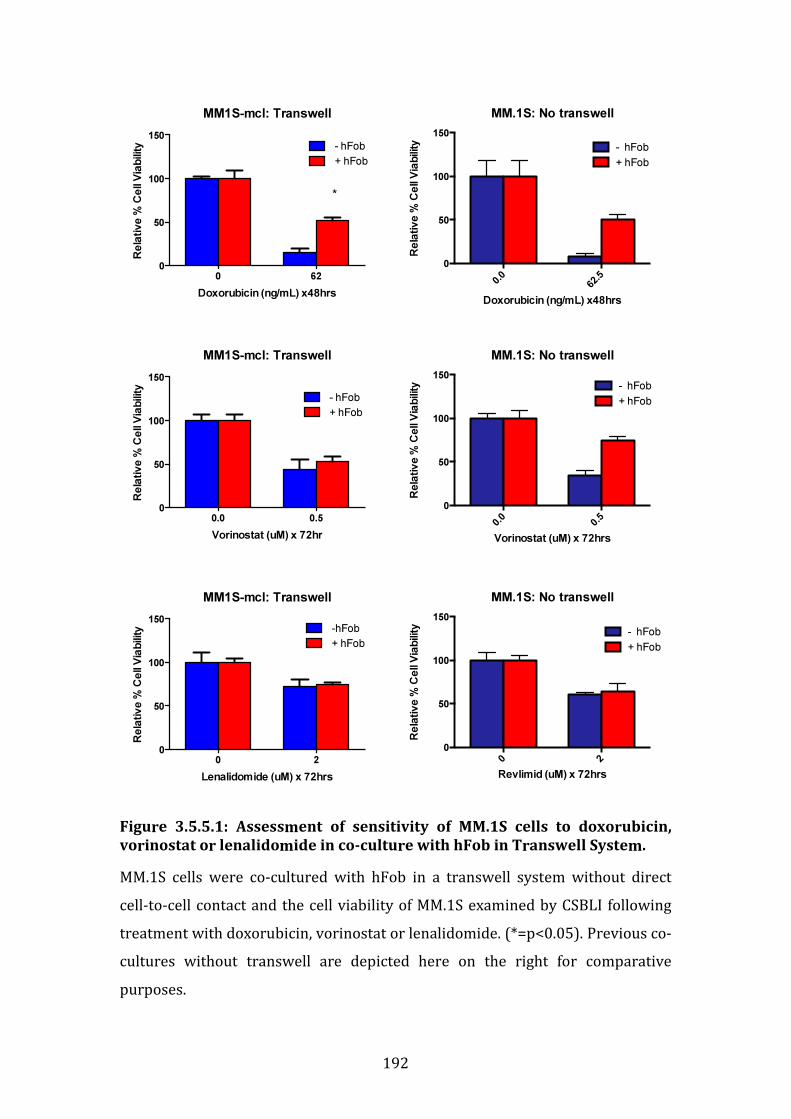
192
Figure 3.5.5.1: Assessment of sensitivity of MM.1S cells to doxorubicin,
vorinostat or lenalidomide in co-culture with hFob in Transwell System.
MM.1S cells were co-cultured with hFob in a transwell system without direct
cell-to-cell contact and the cell viability of MM.1S examined by CSBLI following
treatment with doxorubicin, vorinostat or lenalidomide. (*=p<0.05). Previous co-
cultures without transwell are depicted here on the right for comparative
purposes.
MM1S-mcl: Transwell
0 62
0
50
100
150
- hFob
+ hFob
Doxorubicin (ng/mL) x48hrs
Re
lati
ve
% C
ell
Via
bili
ty
*
MM1S-mcl: Transwell
0.0 0.5
0
50
100
150
- hFob
+ hFob
Vorinostat (uM) x 72hr
Re
lati
ve
% C
ell
Via
bili
ty
MM1S-mcl: Transwell
0 2
0
50
100
150
-hFob
+ hFob
Lenalidomide (uM) x 72hrs
Re
lativ
e %
Ce
ll V
iab
ility
MM.1S: No transwell
Doxorubicin (ng/mL) x48hrs
Re
lati
ve
% C
ell
Via
bili
ty
0.0
62.5
0
50
100
150
- hFob
+ hFob
MM.1S: No transwell
Vorinostat (uM) x 72hrs
Re
lativ
e %
Ce
ll V
iab
ility
0.0
0.5
0
50
100
150
- hFob
+ hFob
MM.1S: No transwell
Revlimid (uM) x 72hrs
Re
lati
ve
% C
ell
Via
bili
ty
0 2
0
50
100
150
- hFob
+ hFob
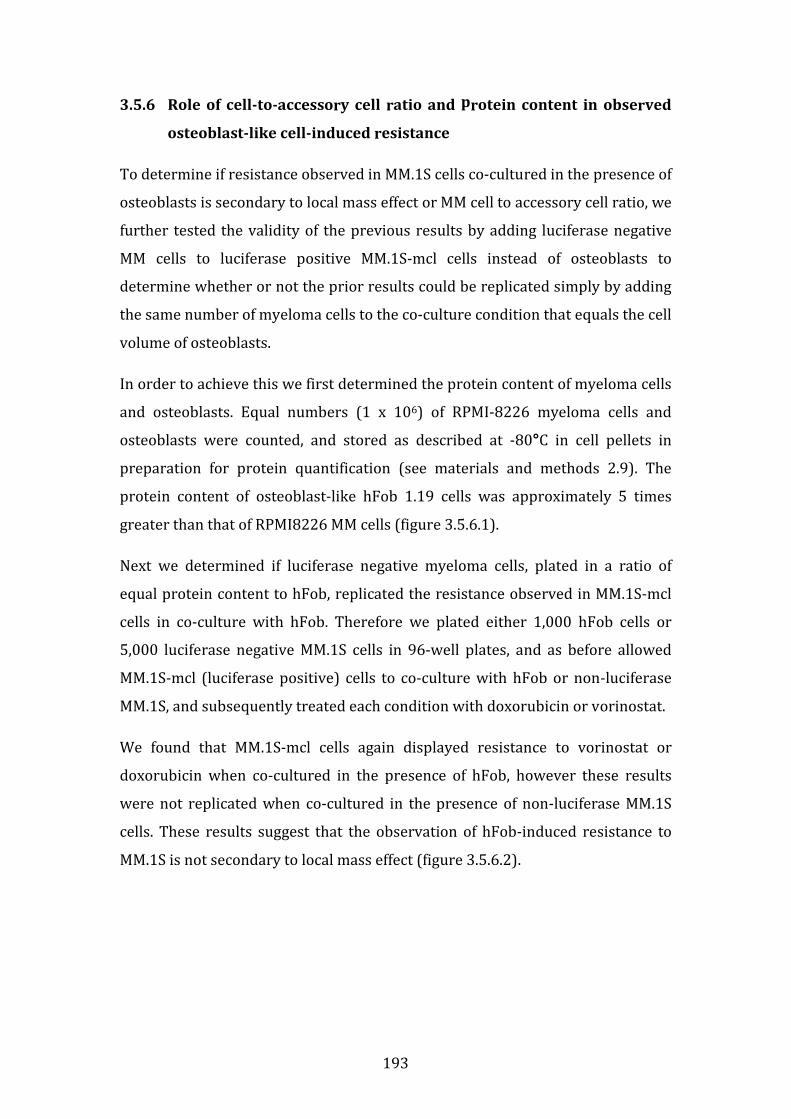
193
3.5.6 Role of cell-to-accessory cell ratio and protein content in observed
osteoblast-like cell-induced resistance
To determine if resistance observed in MM.1S cells co-cultured in the presence of
osteoblasts is secondary to local mass effect or MM cell to accessory cell ratio, we
further tested the validity of the previous results by adding luciferase negative
MM cells to luciferase positive MM.1S-mcl cells instead of osteoblasts to
determine whether or not the prior results could be replicated simply by adding
the same number of myeloma cells to the co-culture condition that equals the cell
volume of osteoblasts.
In order to achieve this we first determined the protein content of myeloma cells
and osteoblasts. Equal numbers (1 x 10⁶) of RPMI-8226 myeloma cells and
osteoblasts were counted, and stored as described at -80°C in cell pellets in
preparation for protein quantification (see materials and methods 2.9). The
protein content of osteoblast-like hFob 1.19 cells was approximately 5 times
greater than that of RPMI8226 MM cells (figure 3.5.6.1).
Next we determined if luciferase negative myeloma cells, plated in a ratio of
equal protein content to hFob, replicated the resistance observed in MM.1S-mcl
cells in co-culture with hFob. Therefore we plated either 1,000 hFob cells or
5,000 luciferase negative MM.1S cells in 96-well plates, and as before allowed
MM.1S-mcl (luciferase positive) cells to co-culture with hFob or non-luciferase
MM.1S, and subsequently treated each condition with doxorubicin or vorinostat.
We found that MM.1S-mcl cells again displayed resistance to vorinostat or
doxorubicin when co-cultured in the presence of hFob, however these results
were not replicated when co-cultured in the presence of non-luciferase MM.1S
cells. These results suggest that the observation of hFob-induced resistance to
MM.1S is not secondary to local mass effect (figure 3.5.6.2).
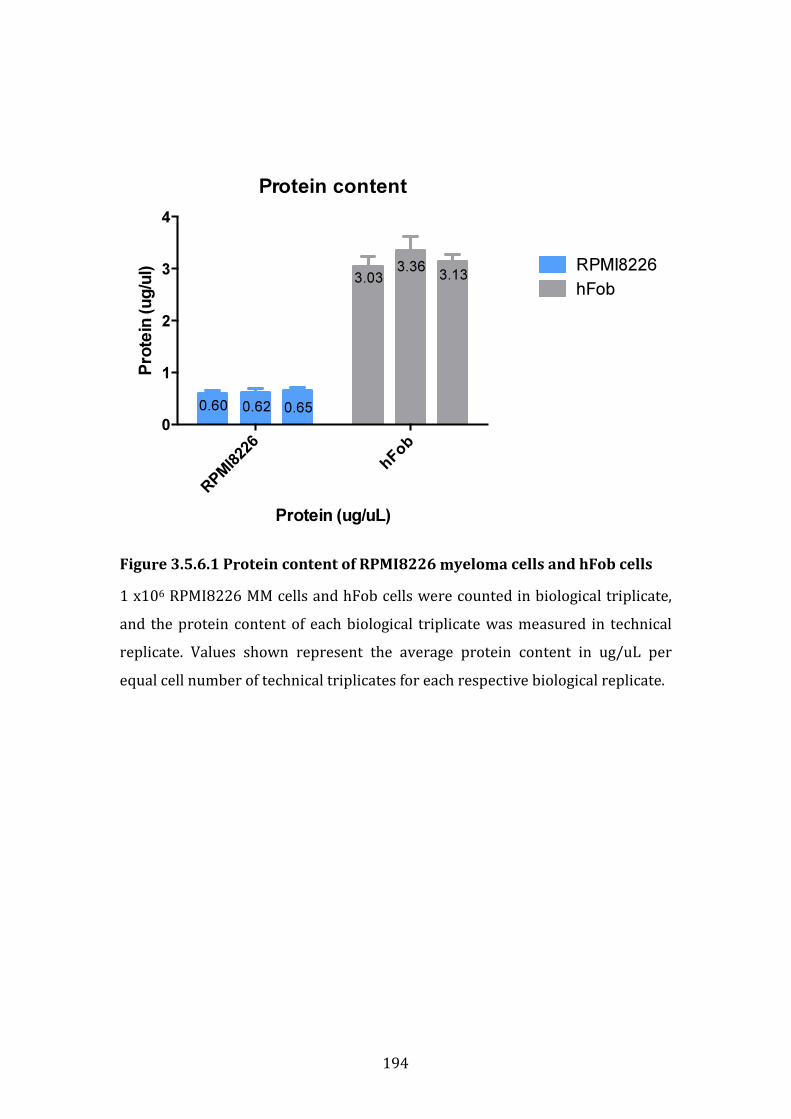
194
Figure 3.5.6.1 Protein content of RPMI8226 myeloma cells and hFob cells
1 x10⁶ RPMI8226 MM cells and hFob cells were counted in biological triplicate,
and the protein content of each biological triplicate was measured in technical
replicate. Values shown represent the average protein content in ug/uL per
equal cell number of technical triplicates for each respective biological replicate.
Protein content
Protein (ug/uL)
Pro
tein
(u
g/u
l)
RPMI8226
hFob
0
1
2
3
4
RPMI8226
hFob
0.60 0.62 0.65
3.033.36
3.13
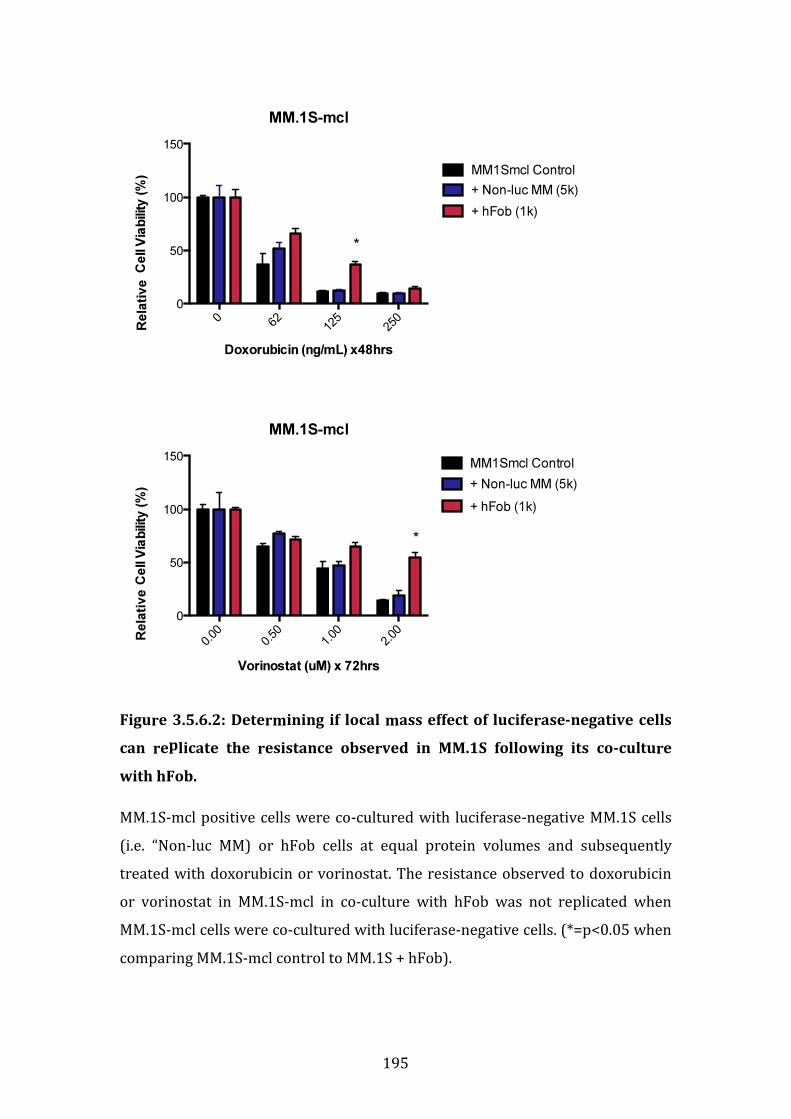
195
Figure 3.5.6.2: Determining if local mass effect of luciferase-negative cells
can replicate the resistance observed in MM.1S following its co-culture
with hFob.
MM.1S-mcl positive cells were co-cultured with luciferase-negative MM.1S cells
(i.e. “Non-luc MM) or hFob cells at equal protein volumes and subsequently
treated with doxorubicin or vorinostat. The resistance observed to doxorubicin
or vorinostat in MM.1S-mcl in co-culture with hFob was not replicated when
MM.1S-mcl cells were co-cultured with luciferase-negative cells. (*=p<0.05 when
comparing MM.1S-mcl control to MM.1S + hFob).
MM.1S-mcl
Doxorubicin (ng/mL) x48hrs
Ce
ll V
iab
ility
(%
)
062
125
250
0
50
100
150
MM1Smcl Control
+ Non-luc MM (5k)
+ hFob (1k)
*
MM.1S-mcl
Vorinostat (uM) x 72hrs
Ce
ll V
iab
ility
(%
)
0.00
0.50
1.00
2.00
0
50
100
150MM1Smcl Control
+ Non-luc MM (5k)
+ hFob (1k)
*
Rela
tiv
e
Rela
tiv
e

196
3.5.7 Upregulation of PSMB8 by interferon-gamma increases the
sensitivity of VDR cell lines to bortezomib
Bortezomib principally inhibits the proteasome by binding the PSMB5 subunit of
the 20S core particle. Given that there is marked over-expression of PSMB5 in
VDR cells, in addition to an inherent mutation of PSMB5, we speculated as to
whether or not upregulation of the immunoproteasome subunit PSMB8 (or
LMP7 or β5i) that is analogous to PSMB5 proteasome subunit could result in
resensitisation of VDR cells to bortezomib.
The immunoproteasome has been well documented for its role in MHC Class-I
antigen presentation. Immunoproteasome subunit generation is induced in cells
by the presence of interferon-gamma. Once generated, immunoproteasome
subunits are introduced into newly generated proteasome 20S cores instead of
constitutive subunits. Even though interferon- gamma results in replacement of
constitutive subunits with immunoproteasome subunits into the proteasome
structure, its presence does not appear to alter the overall content of β5, β1 or β2
mRNA within cells. In fact following interferon-gamma stimulation of cells, cells
are found to contain proteasomes with a mixture of β5, β1 and β2 subunits, or
β5i, β1i and β2i subunits.[54] We investigated whether or not we could overcome
bortezomib resistance in VDR cells by inducing the immunoproteasome subunit
PSMB8 via interferon gamma, and allow proteasome inhibition in the VDR cells
to occur through the β5i subunit, namely PSMB8.
On day 1 MM1R and VDR cells were plated in 96-well plates in the absence or
presence of interferon-gamma (0 or 200U/mL for 48hours). After 48 hours the
cells were treated with bortezomib for 24 hours and the cell viability measured
by CTG.
We found that the addition of interferon gamma to MM.1R cells did not change
its sensitivity to bortezomib. In VDR we noted an increased sensitivity for
bortezomib at dose concentrations of 20, 40 and 80nM when the cells were pre-
treated with interferon-gamma 200IU/mL, (figure 3.5.7.1). Subsequent western
blot of the aforementioned conditions confirmed up-regulation of PSMB8 in VDR
cells pre-treated with interferon gamma, consistent with the possibility that the
197
increased sensitivity of VDR cells to bortezomib that were pre-treated with
interferon gamma may be in part mediated by PSMB8 up-regulation. We also
observed down-regulation of PSMB5 in MM.1R and VDR following interferon-
gamma treatment. We assessed whether or not accumulation of
polyubiquitinated proteins occurred in MM.1R and VDR cell with interferon-
gamma pre-treatment prior to bortezomib treatment. We observed a modest
degree of accumulation of poly-ubiquitinated proteins in VDR cells following
treatment with bortezomib when they were pre-treated with interferon gamma,
suggesting that the proteasome-ubiquitination pathway is at least partially
activated in VDR cells when PSMB8 is up-regulated (figure 3.5.7.2).
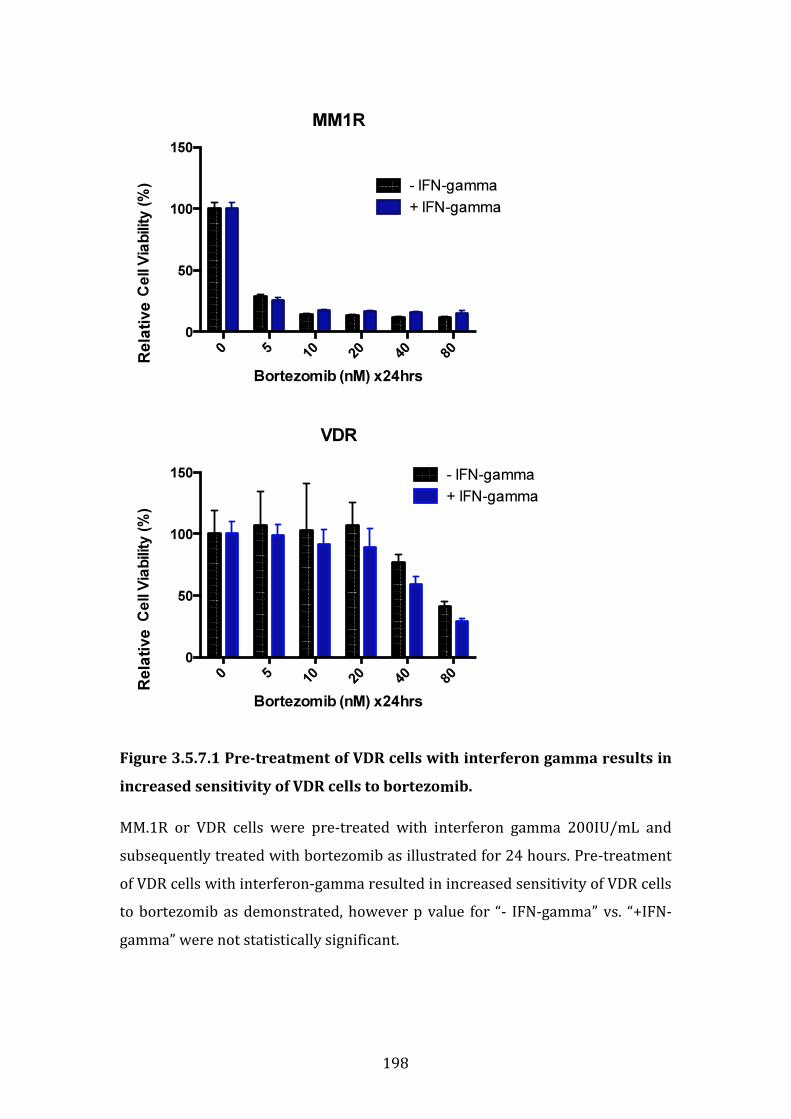
198
Figure 3.5.7.1 Pre-treatment of VDR cells with interferon gamma results in
increased sensitivity of VDR cells to bortezomib.
MM.1R or VDR cells were pre-treated with interferon gamma 200IU/mL and
subsequently treated with bortezomib as illustrated for 24 hours. Pre-treatment
of VDR cells with interferon-gamma resulted in increased sensitivity of VDR cells
to bortezomib as demonstrated, however p value for “- IFN-gamma” vs. “+IFN-
gamma” were not statistically significant.
MM1R
Bortezomib (nM) x24hrs
Ce
ll V
iab
ility
(%
)
0 510
20
40
80
0
50
100
150
- IFN-gamma
+ IFN-gamma
VDR
Bortezomib (nM) x24hrs
Ce
ll V
iab
ility
(%
)
0 510
20
40
80
0
50
100
150 - IFN-gamma
+ IFN-gamma
Rela
tive
Rela
tive
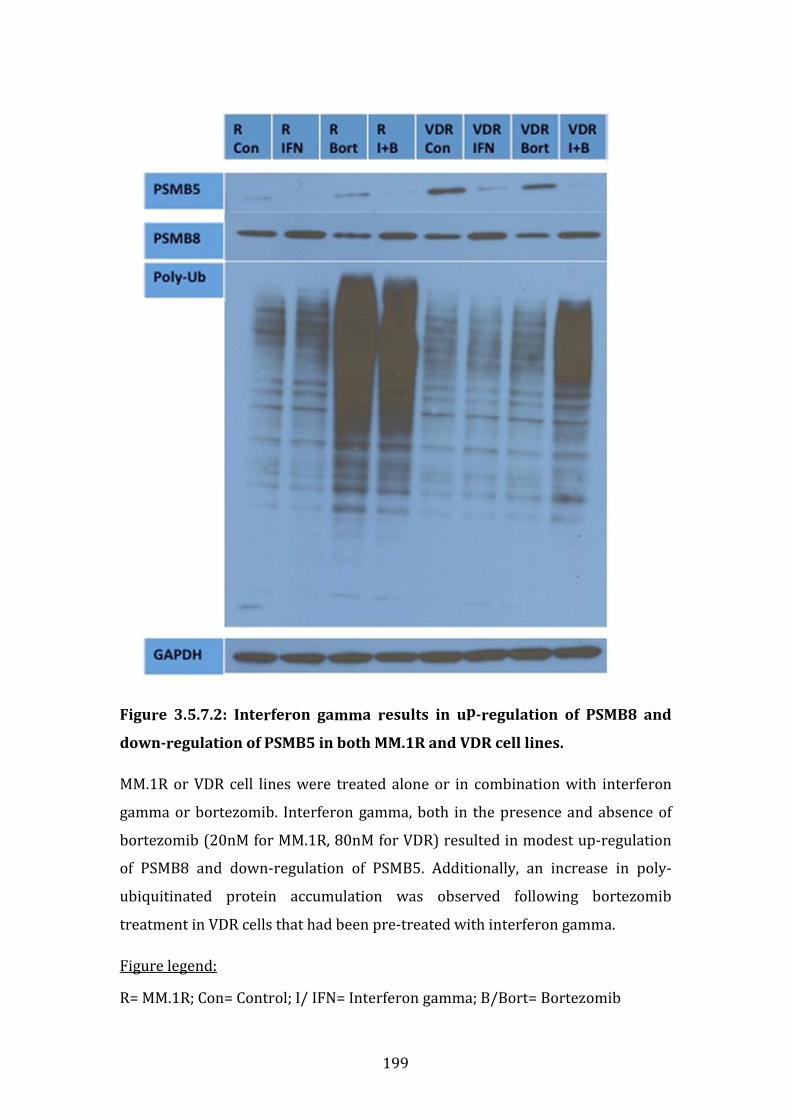
199
Figure 3.5.7.2: Interferon gamma results in up-regulation of PSMB8 and
down-regulation of PSMB5 in both MM.1R and VDR cell lines.
MM.1R or VDR cell lines were treated alone or in combination with interferon
gamma or bortezomib. Interferon gamma, both in the presence and absence of
bortezomib (20nM for MM.1R, 80nM for VDR) resulted in modest up-regulation
of PSMB8 and down-regulation of PSMB5. Additionally, an increase in poly-
ubiquitinated protein accumulation was observed following bortezomib
treatment in VDR cells that had been pre-treated with interferon gamma.
Figure legend:
R= MM.1R; Con= Control; I/ IFN= Interferon gamma; B/Bort= Bortezomib
200
3.5.8 PSMB5 and PSMB8 expression in vivo
Our previous results suggest that PSMB5 is over-expressed and mutated in vitro
in VDR cells. By pre-treating VDR cells with interferon-gamma, which appears to
upregulate the immunoproteasome counterpart PSMB8, we observed partial
resensitisation of VDR cells to bortezomib. In order to investigate the importance
of this observation in the in vivo setting, we performed immunohistochemistry
(IHC) on a number of samples from patients with multiple myeloma for PSMB5
and PSMB8 expression levels.
Clinical data and bone marrow trephine slides from the multiple myeloma
biobank were kindly provided by Dr. Kay Reen Ting and Dr. Colm Cosgrove at
Dublin City University. Patient samples selected were as follows: 7 diagnostic
samples of patients who achieved at least VGRP following a bortezomib-based
regimen; 6 diagnostic samples of patients who received a bortezomib-based
regimen and subsequently relapsed, and finally 7 samples from patients who
relapsed following a bortezomib-based regimen (6 of which correlate to the
latter diagnostic samples), (see materials and methods section 2.1.7). Response
criteria were defined by IMWG response criteria in multiple myeloma.
Immunohistochemistry was performed as per departmental protocol (materials
and methods section 2.18).
A number of interesting observations were made. PSMB5 is expressed in both
diagnostic samples of bortezomib-responders and bortezomib-non-responders.
In this matched comparison, in 3 out of 7 samples tested, PSMB5 expression is
reduced at time of relapse in bortezomib-non-responders compared to the
corresponding diagnostic samples (table 3.5.8.1). PSMB8 was expressed in all
diagnostic samples of bortezomib-responders and in 5 out of 6 diagnostic
samples of bortezomib-non-responders. PSMB8 expression was markedly
reduced in relapsed samples of bortezomib-non-responders compared to their
correlating diagnostic sample. However in 2 out of 7 samples, PSMB8 was still
expressed at time of relapse in bortezomib non-responders. In one of the latter
samples, PSMB8 expression was negative at diagnosis and positive at time of
relapse (table 3.5.8.2).
201
In summary PSMB5 was over-expressed and PSMB8 suppressed in bortezomib
refractory patients at time of relapse. In VDR we demonstrated over-expression
of PSMB5 at the protein level, have outlined its potential role in bortezomib
resistance in vitro, and the potential to overcome this resistance by up-regulation
of PSMB8 using interferon-gamma. Therefore perhaps pre-treatment with
interferon gamma and subsequent bortezomib treatment would increase the
efficacy of bortezomib in bortezomib-refractory myeloma in vivo.
In addition PSMB8 appears to be strongly expressed at diagnosis in both
bortezomib-responders and bortezomib non-responders supporting the role for
a PSMB8-specific inhibitor in vivo. PSMB8 inhibitors are now currently
commercially available and under investigation in the pre-clinical setting, for
example PR-924 has been documented for its efficacy in multiple myeloma in the
in vitro and in vivo setting in a SCID-hu mouse model of plasmacytoma
xenografts.[58] Our in vivo data support the suggestion by Singh et al to assess the
efficacy of PSMB8 inhibitors in the in vivo setting for treatment of newly
diagnosed multiple myeloma, alone or perhaps in combination with bortezomib,
to achieve dual PSMB5 and PSMB8 inhibition. In two of the bortezomib-
refractory samples at time of relapse, PSMB8 was over-expressed, also
supporting a role for PSMB8 inhibitors in relapsed and refractory disease.
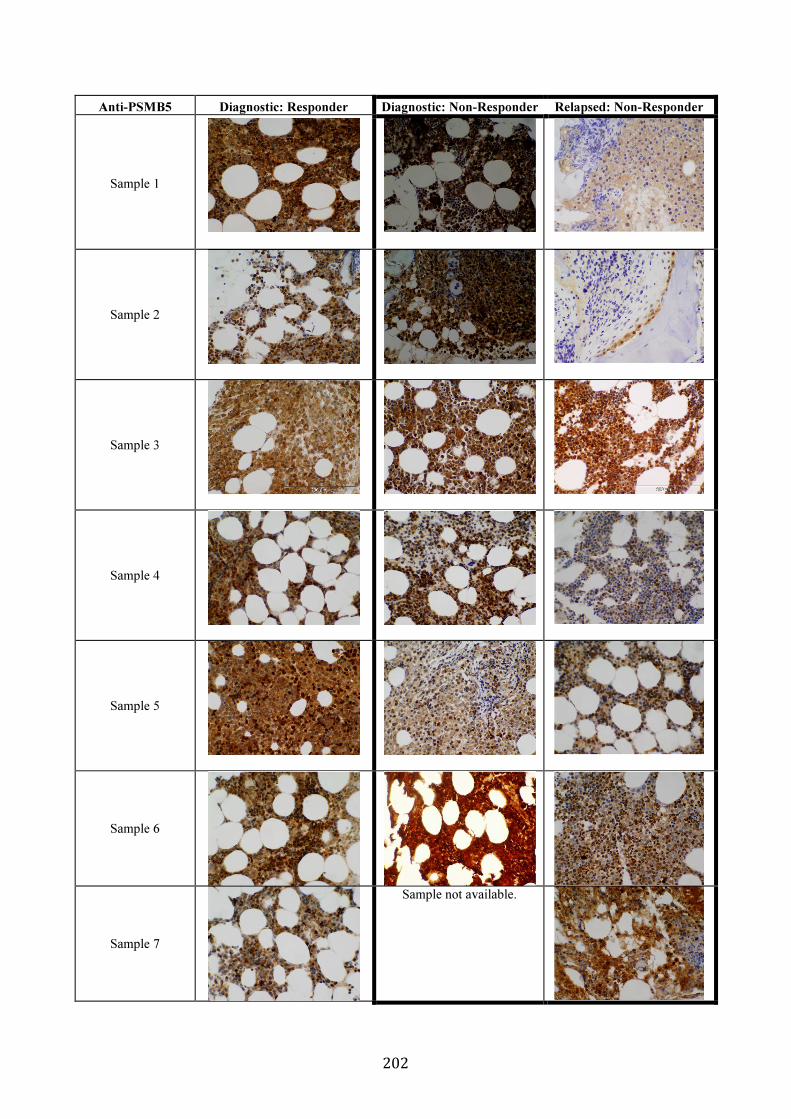
202
Anti-PSMB5 Diagnostic: Responder Diagnostic: Non-Responder Relapsed: Non-Responder
Sample 1
Sample 2
Sample 3
Sample 4
Sample 5
Sample 6
Sample 7
Sample not available.

203
Table 3.5.8.1: Immunohistochemistry of bone marrow trephines of
multiple myeloma patients stained for PSMB5.
PSMB5 expression was examined in known bortezomib responders on
diagnostic bone marrow trephine samples, and also on diagnostic samples of
known bortezomib non-responders with paired samples at time of relapse. A
comparative diagnostic sample was not available for sample 7 non-responder.
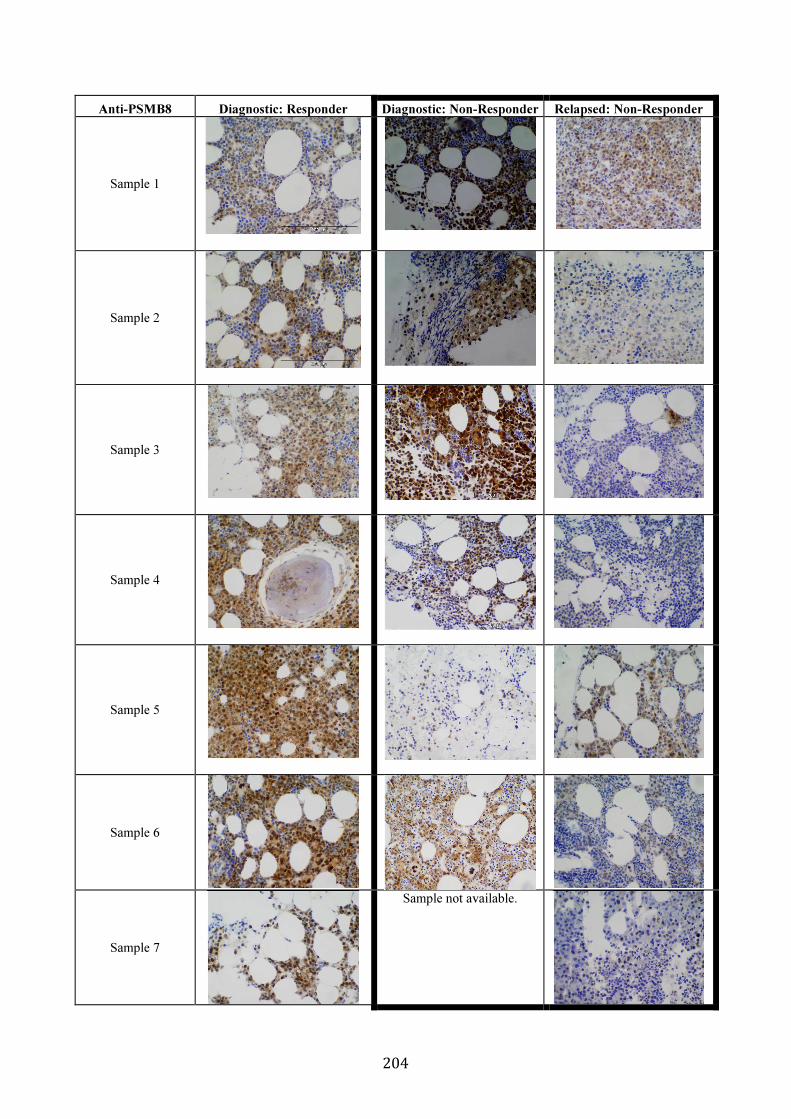
204
Anti-PSMB8 Diagnostic: Responder Diagnostic: Non-Responder Relapsed: Non-Responder
Sample 1
Sample 2
Sample 3
Sample 4
Sample 5
Sample 6
Sample 7
Sample not available.

205
Table 3.5.8.2: Immunohistochemistry of bone marrow trephines of
multiple myeloma patients stained for PSMB8.
PSMB8 expression was examined in known bortezomib responders on
diagnostic bone marrow trephine samples, and also on diagnostic samples of
known bortezomib non-responders with paired samples at time of relapse. A
comparative diagnostic sample was not available for sample 7 non-responder.
206
3.5.9 Summary of functional studies
As previously outlined, the bone marrow microenvironment plays a major role in
resistance mechanisms in MM by either direct or indirect interactions between
bone marrow stromal cells and tumour cells. We thus undertook a number of
functional studies to further explore the mechanism of bortezomib resistance in
VDR.
We examined the sensitivity of the isogenic cell line model to conventional and
novel therapies in the presence and absence of HS5 stromal cells. In relation to
the sensitivity of MM.1R or VDR to proteasome inhibitors, we observed no
change in the sensitivity of MM.1R to bortezomib despite its co-culture with HS-5
stromal cells, VDR retained the same degree of resistance to bortezomib
following its co-culture with HS-5 cells, MM.1R cells appeared to display reduced
sensitivity to carfilzomib following their co-culture with HS-5 cells, (the
mechanism for which remains unclear) however VDR cells retained their
sensitivity to carfilzomib despite their co-culture with HS-5 cells. VDR cells were
found to demonstrate resistance to vorinostat and MLN4924 when co-cultured
in the presence of HS-5 cells, and combination of bortezomib with either agent
was not sufficient to overcome the resistance observed. These data emphasise
the potent effect of the bone marrow microenvironment in drug resistance to
bortezomib when it is used alone or in combination with other novel therapies.
We then investigated the effect of osteoblasts on the proliferation rate of the MM
cells lines to ascertain if the stromal-induced effects were specific to HS5 cells or
merely a cell-to-cell ratio effect. The bortezomib resistant cell line VDR displayed
a marked increase in cell viability when co-cultured in the presence of hFob cell
line compared to all other cell line tested. We furthermore examined the effect of
osteoblasts on the drug sensitivity of MM.1S, MM.1R and VDR cell lines to a
number of therapies. Interestingly MM.1S appeared to be the cell line that was
most susceptible to changes in drug sensitivity when co-cultured with hFob cells,
and this was observed in treatments with dexamethasone, doxorubicin and

207
vorinostat. In addition resistance to doxorubicin was evident in both MM.1R and
VDR cells in co-culture with hFob. Transwell system was subsequently used to
determine whether or not the observed resistance in MM.1S required direct cell-
to-cell contact; we observed direct cell-to-cell contact appeared to be necessary
for osteoblast-induced resistance to vorinostat in MM.1S, but was not necessary
for osteoblast-induced resistance to doxorubicin in MM.1S. The resistance
observed to doxorubicin or vorinostat in MM.1S-mcl in co-culture with hFob was
not replicated when MM.1S-mcl cells were co-cultured with luciferase-negative
cells, suggesting that this phenomenon is not a mass related effect secondary to
the size of the osteoblast-like cells.
Given that there was marked overexpression of PSMB5 at the proteomic and
transcript levels, in addition to the finding of a PSMB5 mutation in the VDR cell,
we hypothesised if bortezomib resistance could potentially be overcome by up-
regulating the PSMB5 immunoproteasome counterpart, PSMB8. By pre-treating
VDR cells with interferon-gamma, we observed an increase in sensitivity of VDR
cells to bortezomib and an increase in poly-ubiquitinated proteins, potentially by
upregulation of PSMB8 as demonstrated by western blot. While interferon-
gamma pre-treatment and subsequent PMSB8 over-expression did not
completely resensitise VDR to bortezomib, it appears to have the potential to
play a role in over-coming bortezomib resistance in VDR.
Finally, we ran immunohistochemistry on bone marrow trephines of patients
with bortezomib-sensitive (diagnostic samples) and bortezomib-refractory
(diagnostic and relapsed samples) multiple myeloma. PSMB5 was over-
expressed and PSMB8 suppressed in bortezomib refractory patients at time of
relapse. Thus perhaps pre-treatment of multiple myeloma patients with
interferon gamma and could resensitise these patients to bortezomib, as
demonstrated by our in vitro model. In addition PSMB8 appears to be strongly
expressed at diagnosis in both bortezomib-responders and bortezomib non-
responders supporting the role for use of PSMB8 inhibitors in vivo.

208
Chapter 4
Discussion
209
CHAPTER 4. DISCUSSION
4.1 CHARACTERISATION OF AN ISOGENIC CELL LINE MODEL OF
BORTEZOMIB RESISTANCE IN VITRO AND IN VIVO.
4.1.1 Introduction
Multiple myeloma is an incurable malignancy characterised by uncontrolled
proliferation of terminally differentiated B-lymphocytes, or plasma cells. The
spectrum of abnormal plasma cell differentiation ranges from monoclonal
gammopathy of uncertain significance, to smouldering myeloma, to fully active
myeloma requiring treatment with chemotherapy. Major advances have been
made in the past 10 years in particular in relation to the FDA approval of a
number of novel therapies for the treatment of myeloma. Bortezomib now forms
the cornerstone of combination therapies for the management of newly
diagnosed and relapsed and refractory myeloma. However once patients develop
resistance to bortezomib-containing regimens, the overall survival is dismal.
Therefore for the purpose of this thesis we undertook a study of a cell line model
of bortezomib resistance in order to further decipher potential intrinsic and
extrinsic mechanistic pathways implicated in bortezomib resistance. We
examined the toxicological profile of bortezomib-resistant VDR at baseline. We
examined the sensitivity of VDR to bortezomib in vivo. We undertook whole
exome sequencing, gene expression profiling and label-free mass spectrometry
to identify mutations, genes or proteins respectively that may contribute to
bortezomib resistance intrinsically. We examined extrinsic factors that may
contribute to bortezomib resistance by examining the effect of bone marrow
accessory cells on drug sensitivity in VDR cell line. Finally we examined bone
marrow trephine samples of specific proteasome-associated subunits for their
expression levels in patients with bortezomib-refractory myeloma. Overall,
bortezomib resistance appears to be multifactorial, and intrinsic resistance
mechanisms are further compounded by extrinsic factors in the local bone
marrow microenvironment. Efforts to overcome these mechanisms of drug
resistance will likely require the use of target-specific combination regimes to
overcome specific resistance pathways that are altered.
210
4.1.2 The use of cell line models to examine bortezomib resistance in vitro
and in vivo
As outlined in the introduction, patients with myeloma who relapse following
treatment with novel therapies, have a very poor overall survival. This was
outlined very explicitly by Kumar et al in their informative study of the prognosis
of multiple myeloma patients when they no longer respond to novel therapies
such as lenalidomide or bortezomib, whereby the overall survival in this group is
approximately 9 months.[4] It is essential that we continue in our efforts to
provide our patients with better treatment options once they reach the
inevitable drug-refractory stage of their illness, and given bortezomib forms the
cornerstone of myeloma combination regimens, we chose to study resistance to
bortezomib. Preclinical investigation of a bortezomib-resistant cell line, VDR,
which had been generated in the laboratory of Dr Mitsiades therefore formed the
cornerstone of this thesis.
We and others have used in vitro cell line models to study bortezomib resistance
in multiple myeloma, and many groups have used cell line models to investigate
drug resistance to other therapies for use in myeloma, such as lenalidomide and
vorinostat.[65, 135-137] Indeed a cell line model of carfilzomib resistance has also
been developed from human lung and colonic adenocarcinoma cell lines to
examine carfilzomib-resistance mechanisms in solid tumours.[138] While these
cell line models provide us with vast information pertaining to resistance
mechanisms in the in vitro setting, one must take into account the pertinent role
of the bone marrow microenvironment in multiple myeloma pathogenesis and
drug resistance, in addition to factors in the bone marrow that attempt to deter
myeloma cell growth.[139-145] All in all, clonal myeloma cells and their bone
marrow microenvironment should for all intents and purposes, be considered a
collective entity in our efforts to study resistance mechanisms, as previously
outlined by Schuler et al.[146] Perhaps a more efficacious mode of investigating
drug resistance in myeloma should involve the co-culture of myeloma cell lines
on HS-5 stromal cells, or alternatively co-culturing myeloma cell lines on bone
marrow stromal cells isolated from patients with multiple myeloma, and then
exposing these cells to successive rounds of incremental doses of bortezomib.
211
Alternatively one could extract CD138-positive cells from bone marrow aspirates
of multiple myeloma patients rather than using a cell line model, and
successively expose these cells to bortezomib. However the latter may prove
technically challenging, as CD138-positive plasma cells from patients do not
proliferate readily in the in vitro setting, likely because they lack the supportive
network of the bone marrow microenvironment.
Perhaps an in vivo model would be more efficacious in order to more truly reflect
the bone marrow microenvironmental changes. A number of models may be
suitable, such as the SCID-hu model that reflects bone disease similar to patients,
or xenogeneic models in humanized mice that appropriately mirror the human
bone marrow microenvironment. However these models do not come without
their own limitations, such as restricted availability of human bone chips and
huge laboratory expense for these preclinical models respectively.[146]
Despite recent advances in preclinical models of multiple myeloma, cell line
monoculture models remain the gold standard for preclinical studies of multiple
myeloma pathogenesis and drug resistance mechanisms, and while they have
their own set of limitations, their use in myeloma research has lead to the
identification of a number of novel therapies for use in multiple myeloma
patients.[147]
4.1.3 Variations in the sensitivity of bortezomib-resistant cells to other
therapies in vitro
As outlined in results section 1, VDR displays a 12-fold increase in IC50 for
bortezomib compared to parental MM.1R, and retains its resistance to
dexamethasone similar to MM.1R (figures 3.1.2.1 and 3.1.3.1). Given that both
cell lines are resistant to dexamethasone one could argue that biomarkers
identified in both cell lines as potential targets of bortezomib resistance may in
fact represent dexamethasone resistance biomarkers, and this is one limitation
of our study. Therefore in all biomarker studies, we compared the differences in
VDR compared to MM.1R cell line. Biomarkers that were present in both cell
lines were not selected for further studies as these were assumed to be
dexamethasone-resistance-associated targets.
212
On examining the cell line model for differences in sensitivity to other novel and
conventional therapies, we made a number of interesting observations (figure
3.1.3.2). All three cell lines (MM.1S, MM.1R and VDR) displayed similar efficacy in
the in vitro setting to the immunomodulators lenalidomide and pomalidomide,
conventional therapies such as doxorubicin and vincristine, and the novel BET2-
bromodomain inhibitor JQ1. In contrast, both MM.1R and VDR were less
sensitive to the HDAC inhibitor vorinostat compared to MM.1S. By inhibition of
HDAC1 and HDAC2, cellular apoptosis results.[148] However in MM.1R and VDR it
is unclear if responsiveness to HDAC inhibitors is due more so to HDAC1, HDAC2
or both equally.
4.1.4 Potential FDA-approved compounds that overcome bortezomib
resistance in VDR
In order to examine a broader range of compounds for their toxicity to VDR cells,
we chose to run a larger scale toxicity assay involving the use of FDA-approved
data sets (figure 3.1.3.3). The purpose again here was to identify compounds that
were more efficacious in VDR compared to the MM.1R cell line. 101 compounds
in total were examined. While the majority of compounds demonstrated
comparable toxicity in both cell lines, two specific groups emerged as
demonstrating a higher relative percentage cell death in the VDR cell line
compared to MM.1R. These included the taxanes and the topoisomerase
inhibitors and each will be discussed in more detail.
Taxanes exert their anti-cancer effects principally by interrupting normal
microtubule structure. A number of taxanes have been FDA-approved for their
use in cancer treatment and those tested in this assay included cabazitaxel,
docetaxel and paclitaxel. Paclitaxel and docetaxel are widely used in cancer of
the ovary, stomach, lung, breast and prostate. Resistance to the taxanes is
thought to be principally mediated by p-glycoprotein.[149] Paclitaxel inhibits the
G2/M stage of normal cell cycle and thus cells cannot form a normal apparatus of
mitosis.[150] Docetaxel works by similar means to paclitaxel by promoting the
stabilisation of microtubules and ultimately also causing G2/M cell cycle arrest.
However docetaxel is much more potent than paclitaxel, i.e. smaller doses of
213
docetaxel cause a greater degree of cell death that an equivalent dose of
paclitaxel. This is reflected in our FDA-dataset results: 1nM of docetaxel results
in >90% cell death of both VDR and MM.1R cells, whereas paclitaxel 1nM causes
<50% cell death of either VDR or MM.1R cells. The reason why the taxanes were
identified as a specific group with higher toxicity in VDR than MM.1R: 1nM of
paclitaxel caused a much greater reduction in relative percentage viability in
VDR (58.1%; SD9.65) compared to MM.1R (98.8%; SD 1.99). However 10nM
paclitaxel caused >90% cell death in both cell lines, thus the taxanes are in fact
efficacious to both bortezomib-sensitive MM.1R and bortezomib-resistant VDR
(table 3.1.3.3).
Cabazitaxel, a novel taxane that functions similarly to docetaxel, is a poor p-
glycoprotein substrate and thus is less susceptible to p-glycoprotein mediated
drug resistance. Cabazitaxel has recently been documented for its efficacy in
phase 1 clinical trials in castration-resistant prostate cancer.[151, 152] In our cell
line model, MM.1R and VDR were both highly sensitive to the novel taxane
cabazitaxel, at both 1nM and 10nM concentrations.
In summary, while VDR appears to be more sensitive to paclitaxel 1nM than
MM.1R, paclitaxel 10nM, cabazitaxel 1nM and 10nM, and docetaxel 1nM and
10nM all appear to be highly potent to both MM.1R and VDR cell lines. While we
cannot conclude that the taxanes may overcome bortezomib resistance (i.e. they
appear to be overall equally toxic to both MM.1R and VDR), we have
demonstrated that the taxanes exert a high degree of relative reduction in cell
viability in both myeloma cell lines, and support the use of taxanes in multiple
myeloma treatment. Paclitaxel in combination with gemcitabine for example has
been investigated in phase 2 clinical trials in patients with relapsed multiple
myeloma. This was a small study involving 12 patients only; interestingly one
patient achieved a complete remission with 98% reduction in serum M protein
and percentage plasma cells in the bone marrow, and furthermore achieved a 6
month complete remission. While this study was quite limited in terms of
numbers, the overall result concluded that this combination regimen was
tolerated well by patients and is an active regimen in relapsed and refractory
myeloma.[153]
214
The topoisomerase inhibitors also appeared to exert a greater reduction in
relative cell viability in VDR compared to MM.1R cell line, therefore this finding
was also examined in greater detail. Topoisomerase 1 (TOP1) causes relaxation
of DNA coils in replicating cells, and when TOP1 is inhibited, excess torsional
strain within the DNA template results in arrest of the movement of the
replication fork, DNA double-strand breaks and sequential cell death.[154]
Topoisomerase 2 (TOP2) is an enzyme that untangles DNA which involves a
transient DNA break in order to achieve successful DNA unknotting. Inhibition of
TOP2 occurs whilst TOP2 attempts to untangle knotted DNA at the point of
transient DNA breakage, with subsequent generation of permanent DNA double-
strand breaks in the genome, next resulting in the formation of further
insertions, deletions and genomic aberrations, and finally initiation of apoptotic
events which cause cell death.[155] In our set of drugs analysed for their toxicity
in MM.1R and VDR, TOP1 inhibitors included irinotecan and topotecan. TOP2
inhibitors included etoposide, teniposide, doxorubicin, daunorubicin and
mitoxantrone.
No differences in toxicity between MM.1R and VDR were observed in treatment
with irinotecan, etoposide, doxorubicin or mitoxantrone at either 1nm or 10nM
concentrations tested. Topotecan, teniposide and daunorubicin at a 10nM
concentration exerted a much greater reduction in relative cell viability in VDR
compared to MM.1R, (74.9% +/-6.2 versus 50.4% +/-17.8 for topotecan; 101.8%
+/-03.4 versus 65.3% +/-4.6 for teniposide; and 83.8% +/-1.1 vs. 48.8% +/-1.3 for
daunorubicin), (table 3.1.3.2). Therefore topoisomerase inhibitors as a group
appeared to display greater toxicity in VDR compared to MM.1R at 10nM
concentrations. However, it is important to note that mitoxantrone was highly
toxic to both MM.1R (5.2% cell viability post treatment), and VDR (5.5% cell
viability post treatment). Mitoxantrone was created in the 1980s as a
doxorubicin analogue with reduced cardiac side effects compared to
doxorubicin. It has a prolonged half-life ranging from almost 9 hours to 9 days. It
intercalates DNA, similar to doxorubicin, but also exhibits additional modes of
action such as altering the immune response by suppressing cytokine
secretion.[156] This may in part explain its toxicity in myeloma cell lines MM.1R
215
and VDR. In conclusion, topotecan, teniposide and daunorubicin were identified
by our screen as drugs that appear to exhibit greater reduction in relative cell
viability in VDR compared to MM.1R, however topoisomerase inhibitors as a
whole do not appear to be more efficacious in their toxicity in VDR over MM.1R.
Mitoxantrone appears to be the most potent TOP inhibitor of all drugs tested,
suggesting a role for its use preferentially to other TOP inhibitors in multiple
myeloma.
4.1.5 The efficacy of novel proteasome inhibitors in the setting of
bortezomib resistance in vitro
VDR cell line demonstrated marked resistance to bortezomib in the in vitro
setting. Therefore we examined 2 further proteasome inhibitors available in the
laboratory for their toxicity to VDR cells, carfilzomib and ixazomib (MLN2238),
(figure 3.1.4.1). Carfilzomib is an irreversible panproteasome inhibitor and has
been FDA-approved for use in multiple myeloma therapy. Ixazomib is a novel
orally bioavailable proteasome inhibitor which reversibly inhibits the beta-5
subunit specifically, similar to bortezomib, and is currently in phase 3 clinical
trials for treatment of multiple myeloma.[51] Carfilzomib displayed marked
toxicity to VDR cell line, as well as parental MM.1R. Interestingly, VDR displayed
significant resistance to ixazomib (MLN2238). Stessman et al reported on a
bortezomib resistant cell line in 2013, which displayed cross-resistance to both
carfilzomib and MLN2238. Their cell line, termed BzR, displayed increased levels
of PSMB5 compared to parental bortezomib-sensitive cell line, similar to VDR,
however no mutations of the PSMB5 gene were detected.[101] Therefore perhaps
resistance to bortezomib and MLN2238 in VDR is mediated by mutPSMB5 gene
in VDR, however this remains to be fully elucidated.
4.1.6 P-glycoprotein does not mediate bortezomib resistance in VDR
P-glycoprotein (P-gp) acts as an efflux pump to shunt drugs out of the cell as a
mechanism of drug resistance. Recently our group published on the role of P-gp
in bortezomib resistance in myeloma, and demonstrated that bortezomib is
subject to pharmacokinetic resistance mediated by P-gp. This work suggested a
role for the combination of a P-gp inhibitor with bortezomib in P-gp positive
216
myeloma.[104] Therefore we wanted to ascertain whether or not a P-gp inhibitor
in combination with bortezomib would resensitise the VDR cells to bortezomib.
We therefore compared the sensitivity of VDR (unknown P-gp expression) and
Dox40 (known to over-express P-gp) myeloma cell lines to combinations of
bortezomib or carfilzomib or MLN2238, with the P-gp inhibitor elacridar (figure
3.1.5.1 and figure 3.1.5.2). In Dox40 cell line, sensitisation to bortezomib and
carfilzomib were observed when either agent was used in combination with
elacridar. Concomitant P-gp inhibition with MLN2238 did not cause any relative
reduction in cell viability in Dox40, suggesting MLN2238 is not a P-gp substrate,
or perhaps Dox40 is also resistant to MLN2238 and the mechanism of resistance
is not P-gp mediated. In the VDR cell line, we observed no change in sensitivity of
VDR to bortezomib or MLN2238 when combined with elacridar, suggesting
resistance to either agent is not P-gp mediated. Finally carfilzomib resulted in
marked reduction in relative cell viability again in VDR, however no synergistic
effect was observed in combination with elacridar. These results suggest that the
drug efflux pump P-glycoprotein does not mediate bortezomib resistance in VDR.
4.1.7 The in vivo efficacy of bortezomib and carfilzomib in bortezomib-
resistant VDR cell line
As previously outlined in this section, while cell line models are the gold
standard for investigating drug resistance mechanisms in the present day, we
further explored to sensitivity of VDR to bortezomib in the in vivo setting, in
order to establish how these cells respond to bortezomib when bone marrow
microenvironmental changes are taken into account. SCID-beige mice were
injected with MM.1R or VDR cells, allowing them to home their natural
environment, the bone marrow, and this was confirmed by whole body
bioluminescence imaging prior to commencement of treatment with bortezomib
or carfilzomib(section 3.1.7).
Bortezomib displayed the greatest reduction in tumour burden compared to
vehicle or carfilzomib in MM.1R mice, however unusually the degree of reduction
in tumour burden with MM.1R was not found to be statistically significant.
Carfilzomib appeared to cause a greater reduction in tumour burden than vehicle
217
in MM.1R mice however again this reduction was not statistically significant.
Interestingly, the overall survival for bortezomib-treated MM.1R mice
significantly exceeded overall survival in MM.1R mice treated with either vehicle
or carfilzomib, (bortezomib vs. vehicle: p=0.0048; bortezomib vs. carfilzomib
1.5mg/kg: p=0.0006; bortezomib vs. carfilzomib 3mg/kg: p=0.0048). This is
quite interesting in light of the fact that we also observed HS-5 stromal cell-
induced resistance to carfilzomib in MM.1R cell line (Results section 3.5.2, figure
3.5.5.2), whereby 24hour co-culture of MM.1R with HS-5 cells reduced the
sensitivity of MM.1R to carfilzomib, and prolonged co-culture with HS-5 by up to
48 and 72 hours prior to treatment with carfilzomib resulted in even greater
reduction in the sensitivity of MM.1R to carfilzomib. The efficacy of carfilzomib in
the in vitro setting, in preclinical mouse models and in clinical trials have been
well documented and lead to the rapid FDA approval of this drug for the
treatment of multiple myeloma.[20, 47, 48, 157-160] It is unclear why in our study
MM.1R cell line did not show comparable toxicity to carfilzomib compared to
bortezomib in the setting of HS-5 stromal cell co-culture or in the in vivo mouse
model. It may be worthwhile exploring the possible reason for this finding in
future studies. One possible explanation may be that the MM.1R cell line, over
time, developed a clone resistant to carfilzomib, that is only apparent when the
cells are in a co-culture system with HS-5 stromal cells or grown in the bone
marrow of mice in vivo. Clonal heterogeneity is becoming a more and more
apparent factor in myeloma disease progression, and perhaps our findings
represent this phenomenon. Further studies may help to explain these findings.
In VDR, while both carfilzomib and bortezomib appeared to induce a greater
reduction in tumour burden in VDR compared to control, again the p value for
degree of reduction in tumour burden with either treatment was not significant.
This data suggests that VDR is likely somewhat resistant to bortezomib in the in
vivo setting, and possibly also resistant to carfilzomib. However in contrast, both
carfilzomib and bortezomib treatment in VDR mice resulted in a statistically
significant increase in overall survival in VDR mice (vehicle vs. bortezomib:
p=0.0004; vehicle vs. carfilzomib 1.5mg/kg: p=0.0086; vehicle vs. carfilzomib
3mg/kg: p=0.0063). No significant difference in overall survival was observed

218
between bortezomib-treated and carfilzomib-treated VDR mice (for both
1mg/kg and 3mg/kg dosing regimens). Overall, the resistance of VDR to
bortezomib was not as pronounced in the in vivo setting. These data suggest that
perhaps elements of the bone marrow microenvironment that are present in the
in vivo setting can overcome, to a certain degree, resistance mechanisms that are
at play in the in vitro setting.
219
4.2 MUTATIONAL ALTERATIONS IN MM.1R AND VDR AS
IDENTIFIED BY WHOLE EXOME SEQUENCING
4.2.1 Introduction to whole exome sequencing
Whole exome sequencing has been used both in the in vitro and in vivo setting in
the investigation of multiple myeloma pathogenesis as outlined in the
introduction. Quite interestingly, yet not surprisingly, the evidence for clonal
heterogeneity in myeloma has recently been documented by a number of groups.
The clonal evolution in myeloma in any given patient helps explain why patients
relapse in myeloma; the majority of the malignant plasma cells initially respond
to treatment, with a small number of resistant cells remaining indolent in the
bone marrow, until such time when this residual clone proliferates and the
patient relapses and is refractory to drugs to which they initially responded. In
fact Melchor et al demonstrated that at diagnosis, between 2 and 6 clones are
present in myeloma patients, and clonal heterogeneity can occur either by a
branching (subclone) or linear (new clone) patterns.[107] This new finding helps
explain how resistant clones are generated. It is not clear however in our model
of bortezomib resistance, whether repetitive exposure of MM.1R to bortezomib
resulted in the generation of a new (linear) clone, i.e. VDR, or whether the VDR
clone was present at baseline in MM.1R and following recurrent bortezomib
treatment, a VDR clone that was present but not apparent at baseline
subsequently emerged.
Whole exome sequencing is used to capture the coding regions of a particular
genome, called the exome. It is anticipated that genetic mutations resulting in
disease for the most part are associated with mutations of the exome, i.e.
variants in protein-coding regions of the genome. A large group of sequence
reads consisting of varying lengths and arrangements are produced by whole
exome sequencing runs. The sequence reads are aligned to known sequence
references and abnormal alleles are recognised and recorded. Filters are applied
that characterise the variant alleles identified and these include qualitative
scores (based on coverage depth), and criteria that imply significance (such as
frequency of alleles, anticipated consequences on protein structure). Given the
vast quantity of information provided by whole exome sequencing many new
220
technologies are currently being developed to interpret the results. The first
occasion in which next generation sequencing was used to correlate a gene
mutation with a disease process was in 2010, when mutation of DHODH gene
was found to cause postaxial acrofacial dysostosis syndrome, a rare familial
disorder characterised by abnormalities of the face, limbs and eyes. Whole
exome sequencing was used in the next 12 months to identify the genetic causes
of 12 further disorders of Mendelian inheritance.[161]
Whole exome sequencing has also been used to seek out genetic mutations in
multiple myeloma patients that contribute to disease pathogenesis. Chapman et
al revealed a number of important findings in their study in 2011. Eleven distinct
mutations of genes involved in the NF-κB pathway were found to play a role
initiation of this pathway in patients with multiple myeloma. Mutations of BRAF
kinase were also identified in 4% of patients, suggesting a novel role for BRAF
inhibitors in multiple myeloma.[67]
We therefore undertook whole exome sequencing of our cell line model of
bortezomib resistance, which was completed at the Centre for Cancer Genome
Discovery Core Facility at Dana-Faber Cancer Institute in order to identify which
gene mutations were present in bortezomib-resistant VDR cell line but absent in
MM.1R.
4.2.2 Single nucleotide variants identified in bortezomib-resistant VDR
but not MM.1R
As outlined in results section 3.2.2, 28 non-synonymous single nucleotide
variants were identified in bortezomib resistant VDR that were not identified in
MM.1R. A non-synonymous variation involves a nucleotide mutation that
changes the amino acid sequence of a protein. Single nucleotide variants (SNVs)
differ to single nucleotide polymorphisms (SNPs), in that SNPs are
polymorphisms that by definition are variable sites within or between
populations, whereas SNVs make no assumption about degree of polymorphism.
Of the 28 SNVs identified in VDR but not MM.1R, 26 of these mutations were
identified as novel mutations by COSMIC (Catalogue of Somatic Mutations in
Cancer) database. Two mutations were identified by dbSNP (Single Nucleotide
221
Polymorphism Database) database (hosted by the National Centre for
Biotechnology Information (NCBI) in collaboration with the National Human
Genome Research Institute (NHGRI)), and these included two distinct mutations
of H2AFVgene (dbSNP IDs: rs114398265 and rs1802437). SIFT and polyphen
predictions were obtained for all SNVs identified as outlined in table 3.2.2.1.
Seven SNVs were found to be “damaging” by both SIFT and PolyPhen predictions
and these genes will now be discussed in detail. Note all seven of these genes
were classified as novel mutations based on search criteria in dbSNP and
COSMIC databases. Each gene was researched in PubMed under the terms
“”gene, cancer”, “gene, myeloma”, “gene, mutation”.
SPARCL1 (secreted protein, acidic and rich in cysteine-like 1) gene was found to
bear a mutation in VDR that was not present in MM.1R. This missense mutation
involved an asparagine to tyrosine substitution in the gene and has not been
previously identified. SPARCL1 wild type has been shown to reduce cellular
adhesion and prevent migration of fibroblasts. The way in which SPARCL1
controls migration and adhesion has not been fully elucidated. We do know that
SPARCL1 binds to type 1 collagen, a constituent of extracellular matrix that
promotes migration of tumour cells and tumour cell invasion.[162-164] SPARCL1
gene has been recently cited in relation to a number of cancers. In colorectal
cancer, Yu et al in 2011 suggested that the combination of high p53 levels and
low SPARCL1 levels collectively could provide a valuable tool as a prognostic
indicator as an adjunct to TNM (tumour-metastasis-node) staging in colorectal
cancer.[165] Zhang et al in 2011 demonstrated that SPARCL1 is poorly expressed
in normal colorectal tissue, strongly positive in primary colorectal tumour sites
and again at very low levels in distant lymph node positive for metastatic
disease, suggesting that SPARCL1 upregulation in colorectal cancer is an early
event in the development of this type of cancer, and possibly has oncogenic
characteristics that contribute to disease progression.[166] It has previously been
documented also that SPARCL1 is markedly suppressed in a number of cancer
cell lines including colon cancer (SW480), lymphoblastic leukaemia (Molt 4),
chronic myeloid leukaemia (K-562), lung cancer (A549) and melanoma (6361)
compared to normal tissues, and that SPARCL1 negatively regulates cellular
222
proliferation.[167] More recently however, SPARCL1 expression in human gliomas
has been shown to correlate with tumour grade, whereby no more than 25% of
normal brain, grade 1 or grade 2 astrocytomas express SPARCL1, whereas >75%
of grade 3 astrocytomas or glioblastomas (aggressive brain tumour with very
poor prognosis) were positive for SPARCL1 expression.[168] Again in contrast to
this latter study, low levels of SPARCL1 were found to correlate with
development of lymph node metastases and poor tumour grade in breast cancer,
this data was published more recently in 2013.[169] More interestingly, in
prostate cancer, SPARCL1, which is known to be suppressed in prostate cancer,
in the in vivo setting over-expression of SPARCL1 resulted in suppression of
prostate cancer metastasis in an in vivo mouse model.[170] In conclusion, low
levels of SPARCL1 appear to occur in a number of cancer cell lines, in colon
cancer levels are high in the primary tumour and low in lymph node metastases,
and in prostate cancer SPARCL1 over-expression in an in vivo model appears to
suppress prostate cancer migration and metastases in vivo. The role of the
SPARCL1 mutation in VDR is not yet known. However one should consider the
role of SPARCL1 in multiple myeloma pathogenesis. One could hypothesise that
if SPARCL1 mutation in VDR is present in patients with multiple myeloma,
perhaps the mutated form of SPARCL1 no longer functions normally to bind
collagen type 1 in the bone marrow microenvironment, potentially promoting
myeloma cell invasion in vivo. This hypothesis could be further explored in
future work.
ZER1 (Zyg-11 Related, Cell Cycle Regulator) gene was also found to have a novel
mutation in VDR cell line, another missense mutation involving a serine to
tyrosine substitution. ZER1 is thought to be involved in encoding a subunit of the
E3 ubiquitin complex. ZER1 has been documented to be up-regulated at early
stage of bladder cancer and down-regulated at later stage bladder cancer.[171]
The role of the ZER1 mutation in VDR is not clear.
TPH2 (tryptophan hydrozylase) gene is mutated in VDR cell line involving a
serine to tyrosine substitution (similar to ZER1 mutation). THP2 gene encodes a
protein that catalyses the rate limiting step in the biosynthesis of serotonin, an
223
endogenous neurotransmitter. Little to no information is available in relation to
the role of this gene in cancer pathogenesis or multiple myeloma.
MFGE8 (Milk Fat Globule-EGF Factor 8 Protein, or lactadherin) gene was also
mutated in VDR cell line. This mutation involved a cysteine to alanine
substitution. Following PubMed literature review, MFGE3 appears to play a role
in promotion of dietary triglyceride absorption and obesity.[172] Tibaldi et all
recently showed by immunohistochemistry that MFGE8 is over-expressed in
45% of ovarian cancer samples tested in their study, and also over-expressed in
triple negative breast cancer. Furthermore this group identified antibodies to
MFGE8 that inhibited survival, migration and adhesion of cell line models of
ovarian cancer and triple-negative breast cancer, suggesting a role for MFGE8
antibodies in solid tumour cancer of the ovary and breast.[173] MFGE8 has also
recently been found to promote osteoclastogenesis.[174] Osteoclasts are well
documented for their role in myeloma cell promotion in the bone marrow
microenvironment. The potential role of mutated MFGE8 in myeloma should be
further examined.
CCDC113 (Coiled-Coil Domain-Containing Protein) gene also harboured a
missense mutation in VDR cell line involving an alanine to threonine
substitution. CCDC113 appears to play a role in cilia formation and does not
appear to play a role in cancer pathogenesis or in multiple myeloma.
FAM59A (GRB2 associated, regulator of Erk/MAPK1, or GAREM) gene was found
to have a mutation in VDR that involved a cysteine to glycine substitution.
FAM59A gene encodes a protein that functions in the epidermal growth factor
receptor (EGFR) pathway. The EGFR pathway is known to regulate normal cell
proliferation but also has been implicated in the development of many types of
malignancies. The protein product of FAM59A promotes signalling of the
MAPK/ERK (mitogen-activated protein kinases/extracellular signal related
kinases) pathway.[175] The MAPK/ERK pathway allows signalling from the cell
surface via a cell surface receptor that is transmitted to the DNA of the cell
nucleus. Essentially a molecule binds a receptor on the cell surface and triggers a
message to be sent to the DNA that results in the expression of a protein, causing
224
an alteration in the cell, such as cell division. If one of the proteins in
this pathway contains a mutation then the message being transferred to the DNA
can become fixed in an “on” or alternatively “off” state, and this step is
sometimes an initiation step in cancer development. Interestingly, in our
proteomic analysis of MM.1R plus bortezomib vs. VDR plus bortezomib
treatment, we found a number of proteins that were suppressed in bortezomib-
treated VDR compared to bortezomib-treated MM.1R (figure 3.4.2.1) suggesting
that the MAP-kinase signalling pathway is perturbed between the two cell lines
after they have been treated with bortezomib. Further studies are required to
determine whether or not the mutation of FAM59A/ GAREM gene contributes to
bortezomib resistance in VDR, hypothetically by altering the EGFR and/or MAP-
kinase signally pathway in VDR cells.
ATP5J (ATP Synthase, H+ Transporting, Mitochondrial Fo Complex, Subunit F6)
gene also harboured a mutation in VDR cell line that was not present in MM.1R.
This involved a point mutation, with the substitution of a guanine for an alanine
at position g.27102074 in chromosome 21. The amino acid substitution involved
a serine to phenylalanine exchange. ATP5J gene is known to function as a subunit
of a complex structure (the mitochondrial ATP synthase Fo complex) that is
responsible for synthesis of ATP. A recent study of the STAT (Signal Transducer
and Activator of Transcription) pathway, which is known for its role in the
pathogenesis of many haematopoietic malignancies, revealed ATP5J is one of a
number of STAT-p53 target genes with altered platelet expression in patients
with myeloproliferative disorders compared to platelets from healthy
donors.[176] This study concluded that these target genes, including ATP5J, via
recruitment of p53, could represent a novel molecular means of abnormal
transcription in haematological cancers. Again, it is unclear if the ATP5J mutation
in VDR cell line could also alter STAT-p53 signalling, however this could be
considered in future studies.
4.2.3 Deletion in ABCA7 gene identified in VDR cell line
While no insertions were identified in VDR compared to MM.1R, a deletion in
ABCA7 gene was identified in VDR cell line that was not present in MM.1R (table
225
3.2.3.1). The ABCA7 gene belongs to a superfamily of ABC (ATP-binding cassette)
transporters. The protein products of ABC genes as outlined in the results
section 3.2.3 are responsible for transporting numerous substances across cell
membranes (both intra- and extra-cellularly).
There are 7 ABC subfamilies, of which ABCA7 belongs to the ABC1 subfamily.
The ABCA7 protein is expressed at highest levels in peripheral leucocytes,
thymus gland, bone marrow and splenic tissue. Kaminski et al first described
ABCA7 in 2000 when its role in lipid transport across macrophage membranes
was elucidated.[112]
In 2012 Meurs et al investigated the effect of macrophage ABCA7 knockdown in
mice to determine its role in atherosclerosis, given its known involvement in
lipid transport. While they did not find a correlation between ABCA7 knockdown
and atherosclerosis in the mice, they revealed that concomitant knockdown of
ABCA7 and ABCA1 (the promoter of initiating step in cholesterol transport)
resulted in massive splenomegaly due to cellular fat accumulation, down-
regulation of number of CD3+ T cells, and promoted erythropoietic regulators.
Their data suggested that ABCA7 might be involved in splenic proliferation of T
cells and erythrocytes.[113]
In relation to its potential role in cancer pathogenesis, in a cohort of 51 patients
with colorectal cancer, a correlation between reduced transcript levels of ABCA7
gene and a reduction in disease free interval following treatment has been
established (p=0.033, log rank test).[114] However neither ABCA7 gene down-
regulation nor deletion in this gene have been implicated in haematological
malignancy in the in vivo setting to date.
In conclusion, it may be worthwhile examining CD138-positive cells in multiple
myeloma patients for deletions in ABCA7 gene and suppressed transcript levels
as, in the in vitro setting in VDR, deletion in ABCA7 is associated with bortezomib
resistance, and one could hypothesise that low transcript levels may also
associated with a shorter disease-free interval in myeloma, similar to what has
been observed in colorectal cancer.
226
4.2.4 In vitro and in vivo significance of mutPSMB5 identified in VDR
Of the 28 SNVs identified in VDR cell line by whole exome sequencing, a gene
mutation was noted in the PSMB5 gene involving a threonine to alanine
substitution at position 80 on exon 2 (figure 3.2.4.1). Initially, this gene mutation
was reported by COSMIC database as a “novel” mutation, however it
subsequently transpired that this mutation has been previously described in a
bortezomib-resistant leukaemic cell line model.[64] The reason for this false call
as a “novel” mutation was that when this mutation was published in the
literature, the cleaved version of PSMB5 was documented, rather than the
complete gene, therefore mutPSMB5 in VDR was called as “novel” by COSMIC
rather than known. All SNVs detected by whole exome sequencing were
reviewed in collaboration with CCGD core facility to ensure all other mutations
documented as “novel” were truly novel. No further SNVs reported in the list
generated by WES required revision of terminology in terms of their novelty or
lack thereof. 3D in silico modelling of the PSMB5 mutation identified by Franke et
al in their leukaemic cell line model was shown to alter the bortezomib-PSMB5
binding pocket.[64]
We thus next undertook lentiviral infection of mutPSMB5 into bortezomib-
sensitive cell lines. We initially attempted to over-express mutPSMB5 in MM.1S
and MM.1R cell lines, given these are the parental and grand-parental cell lines
respectively of VDR. However these cells were remarkably sensitive to
blasticidin, which was used to select the clone infected with muPSMB5 lentivirus.
Also, given the semi-adherent nature of these cells, difficulty with lentiviral
infection was also thought to play a role in poor infection rates in these cell lines
given the poor cell-to-lentivirus contact of the non-adherent cells.
Instead KMS11 was infected with mutPSMB5 to ascertain if over-expression of
mutPSMB5 in KMS11 rendered these cells resistant to bortezomib. We observed
a degree of reduction in sensitivity of KMS11 cells infected with wtPSMB5 to
bortezomib. However an even greater degree of reduction in sensitivity to
bortezomib was observed when KMS11 was infected with mutPSMB5 (figure
3.2.5.1). The latter finding suggests that mutPSMB5 may play a role in
227
bortezomib resistance and may partially explain the resistance of VDR to
bortezomib in the in vitro setting.
4.3 TRANSCRIPTIONAL PROFILE OF ISOGENIC CELL LINE MODEL
OF BORTEZOMIB RESISTANCE
4.3.1 Introduction to gene expression profiling
Gene expression profiling as outlined in the introduction section has lead major
advances in deciphering the pathogenesis of cancer, allowing specific pathways
to be targeted so that novel therapies can be developed for the treatment of a
multitude of cancers, in addition to identifying which genes when their
expression is altered correlate with a worse or better prognosis. We therefore
undertook gene expression profiling of MM.1R and VDR cell lines to determine
which genes were differentially expressed between the bortezomib-sensitive
and bortezomib-resistant clone (section 3.3). Affymetrix oligonucleotide arrays
were undertaken at Beth Israel Deaconess Medical Centre Core Genomics facility.
20,724 genes were differentially expressed between MM1R and VDR cell lines.
Genes whereby fold change between the two conditions was >1.2 and
demonstrated a p value ≤ 0.01 were included for further studies. In total 437
transcripts fulfilled these criteria. Of these, 353 were over-expressed in VDR
compared to MM.1R (table 3.3.2.1). In comparison only 84 genes were down-
regulated in VDR compared to MM.1R (table 3.3.3.1). The reasoning for the
discrepancy between number of genes up-regulated versus down-regulated is
unclear. Genes that were over-expressed or down-regulated were analysed by
DAVID functional annotation tool to determine which pathways were implicated
in groups of transcripts that were differentially expressed.
4.3.2 Pathways associated with genes over-expressed in VDR compared to
MM.1R
Pathway analysis via DAVID functional annotation tool revealed “cellular
apoptosis” as a specific pathway in which 4 transcripts up-regulated in VDR play
a role. These genes include CFLAR, CASP8, CASP10, and NFKBIA (figure 3.3.2.1).
NF-kappaB proteins are involved in immune responses, cell proliferation and
cellular apoptosis in normal cells. NF-kappaB itself is well documented for its
228
role in multiple myeloma pathogenesis in particular by protecting malignant
plasma cells from apoptosis and promoting myeloma cell proliferation. One
suggested mechanisms of action of the proteasome inhibitor bortezomib is
through the NF-κB/IκB complex by hindering degradation of IκBα and thus
augmenting myeloma cell apoptosis.[177] I-kappa-B-alpha, the gene product of
NFKBIA, is known to bind NF-kappaB, which prevents activation of NF-kappaB
and suppresses apoptosis in B-cell neoplasms. It is not clear why caspase 8
(CASP8) and caspase 10 (CASP10) are also concomitantly upregulated in VDR, as
this suggests a greater degree of apoptosis in VDR compared to MM.1R. CFLAR
(CASP8 And FADD-Like Apoptosis Regulator, or c-FLIP) gene is also upregulated
in VDR compared to MM.1R and also involved in the apoptosis pathway. CFLAR
(also known as c-FLIP) was recently found to play a pertinent role in acute
promyelocytic leukaemia, whereby PML–retinoic acid receptor α (PMLRARα)
joins with Fas and inhibits Fas-associated apoptosis by generating an inhibitory
complex of apoptosis with c-FLIP (i.e. CFLAR).[178] C-FLIP (CFLAR) has been
shown to inhibit caspase-8 and promote cell survival,[179] but has also been
shown to activate caspase-8 to induce cellular apoptosis.[180] In VDR, one could
hypothesise that c-FLIP plays a role in stabilising caspase-8 and promoting VDR
survival. Further studies are warranted to determine the role of these genes in
multiple myeloma, and whether or not they contribute to drug resistance to
bortezomib in vivo.
4.3.3 Pathways associated with genes down-regulated in VDR compared
to MM.1R
Transcripts that were down-regulated in VDR compared to MM.1R were noted to
participate in a number of cellular processes mainly concerned with the immune
system for example antigen processing and presentation, immune response, T
cell differentiation and T cell selection. In particular 2 genes, CD74 and HLA-DRA,
were identified by DAVID functional annotation tool to be involved in “antigen
processing and presentation”, (p=5.61E-04), (table 3.3.3.3).
The protein product of CD74 (CD74 Molecule, Major Histocompatibility Complex,
Class II Invariant Chain) gene is known to play a pivotal role in MCH class II

229
antigen presentation, acting as a chaperone that helps regulate the immune
response. The protein product also acts as a receptor on the cell surface for the
MIF (macrophage migration inhibitory factor) cytokine that promotes cell
survival and proliferation.[181] Interestingly, PubMed search of “CD74” and
“myeloma” revealed that a CD74 monoclonal antibody, milatuzumab, has been
developed and has recently completed phase 1 clinical trials for use in relapsed
and refractory multiple myeloma. The novel agent was well tolerated, and while
no tangible responses (measured by criteria of European Group for Blood and
Marrow Transplantation) were observed, disease stabilisation was observed in
26% of patients, suggesting its role for use in refractory myeloma, in particular
in combination with other therapies.[182] In VDR cell line, CD74 was down-
regulated suggesting that perhaps CD74 expression is lost later on in the disease
process by the time resistant clones have evolved. Perhaps this is why no
quantifiable response was detected in the aforementioned phase 1 clinical trial,
as perhaps malignant plasma cells later in the disease potentially loose CD74
expression. It is not clear why it would be beneficial to malignant clones to loose
a cell surface marker that promotes cell survival and proliferation, presumably
later in the disease alternative means of survival are at play. While CD74 does
not appear to be associated with bortezomib resistance, it appears to be over-
expressed in MM.1R clone compared to VDR, suggesting perhaps that
milatuzumab should preferentially be utilised in newly diagnosed myeloma.
4.3.4 shRNA knockdown studies of genes up-regulated in VDR
A number of specific genes were selected for a shRNA knockdown screen, to
determine which genes, following their shRNA knockdown, might resensitise
VDR to bortezomib. This included the following: (i) transcripts over-expressed in
VDR with concordant up-regulation at the protein level in VDR (as identified by
label-free mass spectrometry), (ii) transcripts with > 2-fold over-expression in
VDR vs. MM.1R, (iii) transcripts whereby chemical inhibitors are currently
commercially available for the molecular product of these transcripts, and (iv) a
number of transcripts for which shRNAs were available in the laboratory (table

230
3.3.4.1). All genes chosen were selected from the complete list of genes up-
regulated in VDR vs. MM.1R where fold change >1.2 and p value ≤ 0.01. Of 27
genes investigated in the shRNA screen, 11 genes were found, following shRNA
knockdown and subsequent treatment with bortezomib (IC20), to result in >40%
cell death of VDR cells compared to control hairpins. These included PSMB5,
ALDH1L2, FN1, PIK3CG, PSME1, BCL2L1, SKAP1, TINF2, ALOX5AP, CEP128 and
CX3CR1 (figure 3.3.5.1). A number of these targets will be discussed in more
detail including PIK3CG, BCL2L1 and PSMB5.
4.3.4.1 Effect of shRNA knockdown of PIK3CG on VDR cells
Following shRNA knockdown of PIK3CG, in 3 of 5 hairpins used, we observed
resensitisation of VDR to bortezomib. Phosphatidylinositide 3-kinase (PI3K)
signalling in recent years has been well documented for its role in multiple
myeloma pathogenesis by promoting cell growth, survival and migration, and
thus multiple PI3K inhibitors to various PI3K isoforms have been developed.
CAY10505 has been developed as a specific inhibitor of PIK3CG. However a
recent study revealed PIK3CA as the most successful PI3K target for inhibition in
order to induce maximum cell death in myeloma cell lines, for which an inhibitor
is also available.[183] However bortezomib-refractory cell lines were not used in
this study, therefore perhaps the PIK3CG isoform holds greater importance later
in the disease process. Our data suggest a role for PIK3CG inhibitor CAY10505 in
combination with bortezomib in bortezomib-refractory myeloma, however
further studies are warranted to validate this hypothesis.
4.3.4.2 shRNA knockdown of BCL2L1 resensitises VDR to bortezomib
BCL2L1 (Bcl2-Like 1) gene, following its shRNA knockdown, also resensitised
VDR to bortezomib. The protein generated by BCL2L1 forms part of the Bcl2
family of proteins. BCL2L1 in known to be a potent inhibitor of cell death by
inhibiting caspase activation. A very recent study examining the gene expression
profile of various stages of myeloma development (i.e. MGUS to SMM to MM)
revealed BCL2L1 as a target gene upregulated on progression from MGUS to
either smouldering myeloma or multiple myeloma.[184] Two small molecule
inhibitors of BCL2L1, that also inhibit Bcl2, have been documented for their
relative potencies in preclinical models of myeloma in vitro and in vivo. These
231
include ABT-737 documented for its efficacy in cell line models in vitro,[185] and
gossypol acetate, a naturally occurring compound extracted from the cotton
plant, documented for its potency both in vitro and in vivo in the pre-clinical
setting. [186]
4.3.4.3 shRNA knockdown of PSMB5 resensitises VDR to bortezomib
Given that PSMB5 was found in our studies to be over-expressed at the
transcript level (table 3.3.2.1), protein level (table 3.4.2.1), and harbours a
genetic mutation (table 3.2.2.1), we chose to further validate PSMB5 knockdown
and subsequent resensitisation of VDR cells to bortezomib. First we
demonstrated successful shRNA knockdown of PSMB5 in MM.1R and VDR by
immunoblot (figure 3.3.6.1). Secondly, we demonstrated that shRNA knockdown
of PSMB5 and subsequent treatment of VDR cells (used at even lower
concentrations of bortezomib compared to initial screen: 50nM vs. 20-40nM),
resulted in significant resensitisation of VDR to bortezomib (figure 3.3.6.2b).
shRNA knockdown of PSMB5 in MM.1R did not alter the sensitivity of MM.1R
cells to bortezomib (figure 3.3.6.2a).
Our validation studies were somewhat limited by the technical challenge of
shRNA knockdown of semi-adherent cell lines, which when not adherent to the
surface of the tissue culture flask, prove to be much more difficult to successfully
infect with lentivirus, and subsequent selection with blasticidin initially resulted
in cell death of almost all cells. We overcame this difficulty by centrifuging the
tissue culture plates following infection with lentivirus for 30 minutes post-
infection, to allow both virus and cells to adhere to the base of the plates.
Our data clearly indicate the potent role of PSMB5 in bortezomib resistance in
the in vitro setting. Perhaps an alternative inhibitor of the proteasome such as a
PSMB8 inhibitor may be useful in the setting of over-expression and mutation of
PMSB5 gene.
232
4.4 PROTEOMIC PROFILING OF ISOGENIC CELL LINE MODEL OF
BORTEZOMIB RESISTANCE
4.4.1 Introduction to proteomic profiling in MM.1R and VDR
We examined the proteomic profiles of the isogenic cell lines MM.1R and VDR, in
addition to investigating the proteins differentially expressed following
treatment of each cell line with bortezomib. Label-free mass spectrometry has
been developed to determine the proteins differentially expressed in cell lines,
tissue culture supernatant, solid tumours, cell lines of haematological
malignancies and tissues derived from human samples including serum, to allow
us to gain a greater understanding of cancer pathogenesis at the molecular level.
Our group in particular have recently published on the use of label-free mass
spectrometry in identifying biomarkers predicting response to thalidomide-
based therapy in multiple myeloma patients.[117] We identified 106 proteins
over-expressed (table 3.4.2.1) and 132 proteins down-regulated (table 3.4.3.1) in
VDR compared to MM.1R.
4.4.2 Protein expression in VDR compared to MM.1R
4.4.2.1 CCL3 is over-expressed in VDR vs. MM.1R at the protein level
One protein of particular interest, CCL3, demonstrated a 22-fold higher
expression level in VDR compared to MM.1R. CCL3/MIP1-α (C-C motif ligand 3/
macrophage inflammatory protein 1-alpha) was over-expressed in VDR
compared to MM.1R with a 22-fold change (p=0.013). CCL3 has been well
documented previously in its role as a stimulator of osteoclastogenesis,
inhibition of osteoblastogenesis, and thus contribution to myelomatous bone
disease.[85, 120] This protein is highly expressed in myeloma cell lines and an
inhibitor of CLL1 through which CCL3 signals is currently in pre-clinical
investigation and has shown promising anti-myelomatous and anti-osteolytic
effects in a MM in vivo mouse model.[121] CCL3 is markedly over-expressed in
bortezomib-resistant VDR, suggesting a role for this inhibitor in relapsed and
refractory myeloma, if CLL3 is found to be over-expressed in malignant clones of
multiple myeloma patients. Further studies could include examining the
sensitivity of VDR cells to bortezomib in the presence of a CCL1 inhibitor.
233
4.4.2.2 The heat shock proteins are over-expressed in VDR vs. MM.1R
A group of proteins identified by String software revealed the heat shock
proteins as a particular group that are over-expressed in VDR compared to
MM.1R (figure 3.4.2.2.1). The heat shock proteins are known to be expressed in
response to external stimuli such as drugs and have been well documented for
their role in multiple myeloma pathogenesis. Indeed a specific heat shock protein
inhibitor of HSP90AA1 has undergone phase 1 clinical trials and shows
promising results for its use in relapsed and refractory myeloma. [122-125] While
HSP90AA1 was not over-expressed at a statistically significant level in VDR
compared to MM.1R, over-expression of HSPE1, HSPD1 and HSPD5, all of which
interact with HSP90AA1, are over-expressed in VDR compared to MM.1R,
suggesting a potential role for HSP90 inhibitors in bortezomib-refractory
multiple myeloma.
4.4.2.3 Aminoacyl-tRNA biosynthesis-associated molecules are down-
regulated in VDR compared to MM.1R.
Aminoacyl-tRNA is an amino acid bound to transfer RNA that is delivered to the
ribosome for integration of the amino acid into a polypeptide during protein
synthesis. Three proteins that were found to be down-regulated in VDR
compared to MM.1R were found to be involved in aminoacyl-tRNA biosynthesis,
and these included IARS, RARS and LARS (figure 3.4.3.1). PubMed search of
“IARS”/ “RARS”/ “LARS” in combination with the term “myeloma” did not reveal
any associations of these proteins with myeloma pathogenesis. However a large
study involving 1064 cases of patients with breast cancer and 1073 cancer-free
controls revealed that functional polymorphisms of LARS and RARS were
associated with a risk of developing breast cancer. In particular for RARS, the
finding was statistically significant (OR = 1.17, 95% CI = 1.02-1.35).[187] The role
of these proteins in the pathogenesis of myeloma and/or resistance to
proteasome inhibitors remains to be elucidated.
234
4.4.3 Protein expression in bortezomib-treated VDR and bortezomib-
treated MM.1R
4.4.3.1 Proteasome-associated subunits are suppressed following
bortezomib treatment in MM.1R and VDR
Following bortezomib treatment, 212 proteins were down-regulated in MM.1R
compared to untreated control (table 3.4.4.1.2), and in VDR 35 proteins were
down-regulated compared to untreated controls (table 3.4.4.1.3). By comparing
bortezomib-treated MM.1R to bortezomib-treated VDR, 109 proteins out of a
total 323 were downregulated in bortezomib-treated-VDR compared to
bortezomib-treated-MM.1R, of which 63 demonstrated a fold change ≥1.5
(where p<0.05), (table 3.4.4.1.4).
DAVID functional annotation tool revealed a number of proteins involved in the
proteasome structure were suppressed in both bortezomib-treated MM.1R and
bortezomib-treated VDR compared to their respective untreated controls.
PSMD13, PSMA1, PSMA2, PSMA3, PSMA4, PSMA5, PSMA6, PSMA7, PSMB1,
PSMB2, PSMB5, PSMB6, PSMB8 were all found to be down-regulated in
bortezomib-treated MM.1R compared to untreated MM.1R (table 3.4.4.1.1).
PSMA3, PSMA4, PSMA6, PSMA5, PSMB1 and PSMA7 were down-regulated in
bortezomib-treated VDR compared to untreated VDR (table 3.4.4.1.3). However
PSMB5, through which bortezomib principally acts, was not down-regulated in
bortezomib-treated VDR compared to untreated VDR control, suggesting that
PSMB5 dysregulation is also evident at the protein level in VDR cell line.
4.4.3.2 Proteins of the MAP-kinase signalling pathway are down-
regulated in bortezomib-treated VDR vs. bortezomib-treated
MM.1R
We identified 5 proteins that were down-regulated in bortezomib-treated VDR
compared to bortezomib-treated MM.1R that are involved in the MAPK
(mitogen-activated protein kinases) signalling pathway (figure 3.4.4.2.1). The
MAPK pathway is well documented for its role in carcinogenesis. At baseline, the
MAPK pathway allows transduction of a message from outside the cell to be
transmitted into the cell nucleus by a cell surface receptor that results in a
change in the DNA in the nucleus, such as signalling a command to cause cell
235
division. This is of particular importance in cancer pathogenesis, whereby an
alteration in the MAPK signalling pathway causes uncontrolled cell turnover. A
large number of compounds have been developed to inhibit the MAPK pathway
to overcome cancer, the first of which was sorafenib which was developed for
use in numerous cancers including hepatocellular cancer[188] and renal cell
carcinoma.[189]
The proteins down-regulated in bortezomib-treated VDR compared to
bortezomib-treated MM.1R that have known involvement in the MAPK signalling
pathway include FLNA, HSP72/HSPA6, PPP3C, MEF2C and HSP27/HSPB1. The
most important of these targets appears to be MEF2C (Myocyte Enhancer Factor
2C). MEF2C has been shown to regulate differentiation of monocytes preferably
to granulocytes, and the oncogene c-Jun is a pivotal downstream modulator of
MEF2C.[190] Furthermore, another player in the MAPK pathway, ERK5, has been
shown to direct haematopoiesis toward the malignant monocytic clone in acute
myeloid leukaemia (AML), of which MEF2C is the direct downstream target, and
this group have suggested further investigation of MEF2C as a target molecule
for treatment in AML.[191] MEF2C is downregulated in bortezomib-treated VDR
compared to bortezomib-treated MM.1R (2.60 fold change, p=4.03E-04). MEF2C
was not identified as differentially expressed in VDR compared to MM.1R at
baseline. It is unclear why MEF2C is down-regulated in bortezomib-treated VDR
compared to bortezomib-treated MM.1R, a, if it is thought to act as an oncogene,
then one would expect it to be upregulated. Further work may help outline the
role of MEF2C in the pathogenesis of haematological malignancies.
4.4.3.3 CCL3 is up-regulated in bortezomib-treated VDR compared to
bortezomib-treated MM.1R
We found 215 proteins up-regulated in bortezomib-treated VDR compared to
bortezomib-treated MM.1R, of which 78 proteins had a fold change ≥2.
Again CCL3 was significantly over-expressed in bortezomib-treated VDR
compared to bortezomib-treated MM.1R (fold change 3.51, p=0.039), (we
previously observed CCL3 at baseline is over-expressed in VDR compared to
MM.1R, section 4.4.2.1). As bortezomib treatment does not appear to suppress
CCL3 protein levels, this again poses the question as to whether or not the
236
addition of a CCL1 inhibitor (through which CCL3 signals) may have the potential
to overcome bortezomib resistance in VDR.
4.4.3.4 EIF5A is up-regulated in bortezomib-treated VDR compared to
bortezomib-treated MM.1R
EIF5A (eukaryotic initiation factor 5A) was over-expressed in bortezomib-
treated VDR compared to bortezomib-treated MM.1R (24.9 fold change, p=0.008,
table 3.4.5.1.1). EIF5A is known to be subject to post-translational modification
to hypusine from a conserved lysine. Hypusinated EIF5A has been documented
to be involved in cancer cell proliferation, promotion of oncogenes and
neoplastic change in cells of the haematopoietic system. A specific nanoparticle
inhibitor, SNSO1, has previously been developed to abrogate hypusinated EIF5A
expression, which results in concomitant NF-κB inhibition, and also
demonstrated a significant reduction in tumour burden in two mouse models of
multiple myeloma.[130] Not only was this protein up-regulated in bortezomib-
treated VDR compared to bortezomib-treated MM.1R, but also over-expressed in
VDR compared to MM.1R at baseline (2.21 fold change, p=0.008, table 3.4.2.1).
Given the over-expression of EIF5A in VDR at baseline, and its persistent over-
expression despite bortezomib treatment, in comparison to these conditions in
MM.1R respectively, one could hypothesis that in myeloma, EIF5A plays a role in
bortezomib refractoriness. It may be worthwhile examining the potency of
SNSO1 nanoparticle in VDR cell line for its relative toxicity to VDR cells, in
addition to examining the expression level of EIF5A in bone marrow biopsies of
patients with bortezomib-refractory multiple myeloma, in order to clarify its
potential role on the treatment of bortezomib refractory myeloma in vivo.
4.4.4 Potential significance of PSMB5 in bortezomib resistance
Given that bortezomib specifically inhibits the proteasome through PSMB5 we
summarise here the PSMB5 protein expression levels from all mass
spectrometry results available in this study. PSMB5 is over-expressed 3.85-fold
in VDR compared to MM.1R at baseline (p=4.36E-04), table 3.4.2.1). When
MM.1R is treated with bortezomib, PSMB5 is suppressed as demonstrated by a
4.66 reduction in fold change (p=7.47E-04), (table 3.4.4.1.2). However PSMB5 is
suppressed to a much lesser degree in VDR following its treatment with

237
bortezomib (1.34-fold, p value is not significant). By direct comparison of
bortezomib-treated VDR compared to bortezomib-treated MM.1R, a 13-fold
increase in PSMB5 protein expression is observed in bortezomib-treated VDR
compared to bortezomib-treated MM.1R (p=3.9E-05), (table 3.4.5.1.1).
Furthermore, we previously noted PSMB5 is over-expressed also at the
transcript level in VDR compared to MM.1R, (fold change 1.89, p=4.14E-04),
(table 3.3.2.1); and shRNA knockdown of PSMB5 partially resensitised VDR to
bortezomib (figure 3.3.6.2). PSMB5 gene in VDR cell line harbours a genetic
mutation that has been previously documented for its potential role in altering
the bortezomib-binding pocket in PSMB5 (section 3.2.4), and introduction of this
mutant PSMB5 into bortezomib-sensitive KMS11 cells reduces the sensitivity of
KMS11 to bortezomib (figure 3.2.5.1).
In conclusion, PSMB5 appears to be over-expressed in VDR compared to MM.1R
at baseline at the transcript and protein level. Bortezomib treatment does not
appear to suppress PSMB5 protein in VDR compared to MM.1R. One could
hypothesise that these findings are due to the mutation present in VDR that is
absent in MM.1R. Interestingly, in our in vivo study the degree of refractoriness
to bortezomib observed in VDR did not mirror the in vitro level of refractoriness,
(i.e. no significant reduction in tumour burden was identified in VDR-mice
between vehicle, carfilzomib and bortezomib treatments (figure 3.1.7.1), and
overall survival in VDR mice treated with both bortezomib and carfilzomib was
significantly greater than vehicle-treated VDR-mice (figure 3.1.7.3)).
The in vivo study suggests that mechanisms of bortezomib-refractoriness
observed in vitro can potentially be overcome in the in vivo setting, and perhaps
this is why PSMB5 mutations have not been found to be significant in patients
with multiple myeloma. One possible mechanism to explain this is the fact that
immunoproteasome subunit PSMB8 is expressed in the in vivo setting in patients
with multiple myeloma, therefore even if PSMB5 is over-expressed and mutated,
then perhaps bortezomib can inhibit the proteasome through PSMB8. This
hypothesis requires clarification by further studies examining specific

238
proteasome subunit expression levels in VDR cells following bortezomib
treatment.
239
4.5 THE ROLE OF THE BONE MARROW MICROENVIRONMENT
AND ITS FURTHER CONTRIBUTION TO DRUG RESISTANCE
4.5.1 Introduction
As previously outlined, the bone marrow microenvironment plays a major role in
multiple myeloma pathogenesis by either direct or indirect interactions between
bone marrow stromal cells and malignant plasma cells. One major blockade to
advances in the study of multiple myeloma pathogenesis and drug resistance
mechanisms is the difficulty of laboratory-based culturing of malignant plasma
cells that have been extracted from the bone marrow of patients with multiple
myeloma. Outside their natural bone marrow microenvironment they quickly
cease to exist. Therefore in our cell line model we chose to mimic the effects of
the local bone marrow microenvironment by examining the sensitivity of VDR
cells to a number of therapies following their co-culture with HS-5 stromal cells.
We furthermore explored the role of osteoblasts in multiple myeloma
pathogenesis and drug resistance. Finally we examined the effect of interferon-
gamma, a cytokine secreted by the bone marrow microenvironment, on the
sensitivity of VDR to bortezomib. We found that PSMB8 was upregulated by
interferon-gamma in VDR cell line, with reciprocal depression of PSMB5.
Furthermore we established that PSMB8 is expressed in the CD138-positive cells
in bone marrow biopsies of multiple myeloma patients, supporting the role for
the use of PSMB8 inhibitors in the treatment of newly diagnosed and potentially
bortezomib-refractory multiple myeloma.
4.5.2 VDR is subject to HS-5 stromal cell–induced drug resistance.
We examined the sensitivity of MM.1R and VDR to conventional and novel
therapies in the presence versus absence of HS-5 stromal cells. We tested the
sensitivity of each cell line to the proteasome inhibitors bortezomib and
carfilzomib, the FDA-approved HDAC inhibitor vorinostat and the preclinical
BET2-bromodomain inhibitor JQ1, in the presence and absence of HS-5
accessory cells.
240
We observed no change in the sensitivity of MM.1R to bortezomib when in co-
culture with HS-5 stromal cells. VDR again retained the same degree of
resistance to bortezomib following its co-culture with HS-5 cells (figure 3.5.2.1).
Unusually MM.1R cells appeared to display reduced sensitivity to carfilzomib
following their co-culture with HS-5 cells and the reason for this remains
unclear. However VDR cells remained sensitive to carfilzomib despite their co-
culture with HS-5 cells (figure 3.5.2.2).
VDR cells were found to be resistant to vorinostat and MLN4924 when co-
cultured in the presence of HS-5 cells, (figure 3.5.3.1). In the in vivo setting
vorinostat has proven activity in combination with bortezomib in phase 1 clinical
trials of patients with relapsed and refractory myeloma.[15] Therefore we
combined vorinostat and bortezomib to determine if the duo could overcome
HS-5 induced resistance in VDR. Combination of bortezomib with vorinostat was
not sufficient to overcome the resistance induced by HS-5 cells. Similarly
combination of MLN4924 with bortezomib did not overcome stromal cell-
induced resistance (figure 3.5.3.2). These data emphasise the potent role of the
bone marrow microenvironment in multiple myeloma pathogenesis, by adding
an additional means of protection to an already drug resistant clone in
supporting their survival.
4.5.3 Osteoblasts promote myeloma cell proliferation and contribute to
drug resistance
We next investigated the effect of osteoblasts on the MM cell lines MM.1S, MM.1R
and VDR to ascertain if the stromal-induced effects were specific to HS-5 cells
alone. Historically osteoblasts have been thought play a protective role in the
patient with multiple myeloma because osteoclasts, which act in direct
opposition to osteoblasts, are highly supportive of myeloma cell growth and
proliferation and survival, in addition to contributing to myelomatous bone
disease. Osteoclasts result in bone breakdown and lytic lesions in myelomatous
bone in comparison to osteoblasts which cause bone remodelling. Indeed an
241
inhibitor of activin A, a molecule which is secreted by myeloma cells to cause
inhibition of osteoblasts, has been documented for its benefit in a preclinical
model of myeloma by restoring osteoblast proliferation, improving bony disease
and preventing myeloma cell growth in an in vitro model.[84] However very
recently the role of osteoblasts in contributing to myeloma cell growth and
proliferation has emerged. Orlowski et al recently outlined how malignant
plasma cells appear to reside in osteoblastic-rich niches in the bone marrow
microenvironment. Furthermore they found that in these osteoblast alcoves the
malignant plasma cells gain the ability to form stem-like cells and are
exceptionally tumorigenic and display resistance to a number of therapies.[192]
We further studied the role of osteoblasts in myeloma cell lines by examining
their effect on myeloma cell proliferation and alterations in drug sensitivity
when these cell lines were in co-culture with an immortalized osteoblast-like cell
line hFob.1.19.
We tested 8 myeloma cell lines for their proliferation rate when in co-culture
with hFob cells including MM.1S, MM.1R, VDR, OPM2, KMS34, RPMI8226,
OCImy5 and Dox40. Interestingly the bortezomib resistant cell line VDR
displayed a marked increase in cell viability when co-cultured in the presence of
hFob cell line compared to all other cell lines tested (figure 3.5.4.1). We
examined the effect of osteoblasts on the drug sensitivity of MM.1S, MM.1R and
VDR cell lines to a number of therapies. Interestingly MM.1S appeared to be the
cell line that was most susceptible to changes in drug sensitivity when co-
cultured with hFob cells, and this was observed in treatments with
dexamethasone, doxorubicin and vorinostat. In addition resistance to
doxorubicin was evident in MM.1R and VDR cells in co-culture with hFob (figure
3.5.4.2).
Since MM.1S appeared to be subject to hFob-induced drug resistance to a
number of therapies, we further examined the potential mechanisms involved
using MM.1S cell line. Transwell system was used to determine whether or not
the observed resistance in MM.1S required direct cell-to-cell contact. We
observed that direct cell-to-cell contact appeared to be necessary for osteoblast-
242
induced resistance to vorinostat in MM.1S, but was not necessary for osteoblast-
induced resistance to doxorubicin in MM.1S, as resistance to doxorubicin was
observed even when the cells were not in direct contact (figure 3.5.5.1). The
reasoning for this difference has not been clarified but presumably is due to the
fact that the osteoblast-induced resistance to doxorubicin is solely cytokine
mediated, whereas osteoblast-induced resistance to vorinostat is likely by
adhesion molecules between the two entities signalling resistance mechanisms.
Finally we hypothesized that perhaps the resistance observed that was induced
by osteoblasts was due to a cell volume effect. The osteoblasts, which are much
larger cells with a 5 times higher protein content we hypothesized might account
for the resistance observed (figure 3.5.6.1). Therefore we co-cultured MM.1S cell
with luciferase-negative MM cells or hFob cell in a 5:1 ratio respectively to
determine whether or not the resistance observed was merely due to a mass
effect. The resistance observed to doxorubicin or vorinostat in MM.1S-mcl in co-
culture with hFob was not replicated when MM.1S-mcl cells were co-cultured
with luciferase-negative cells, suggesting that this phenomenon is not a mass
related effect secondary to the size of the hFob cells (figure 3.5.6.2).
It is however interesting to note that in MM.1S, MM.1R and VDR, no resistance to
the novel therapies bortezomib, lenalidomide or preclinical agent JQ1 was
observed. With regards to lenalidomide, this IMiD has recently been documented
for its ability to down-regulate osteoblast activity in the in vitro setting, by
inducing osteoblast inhibitors and suppressing promoters of osteoblast
differentiation. This may explain why osteoblast-induced resistance is not
observed with lenalidomide treatment.[193] In contrast to this, bortezomib is
known for its bone anabolic effects. Kaiser et al have shown that bortezomib
stimulates differentiation of osteoblasts by inhibiting the breakdown of the
vitamin D receptor and thus upregulating differentiation of osteoblasts.[194]
Therefore it is not clear why in our bortezomib treatments osteoblast-induced
resistance is not observed. JQ1 has not yet been documented for its effects on
osteoblasts.
243
These novel findings present somewhat of a clinical conundrum for future
treatment of multiple myeloma. Lytic bone lesions contribute greatly to
morbidity and mortality in patients with multiple myeloma by causing severe
bone pain, pathological fractures, even paralysis when vertebral fractures occur.
Recent efforts have heavily focused on upregulation of osteoblastogenesis in
multiple myeloma in order to promote bone strength and prevent such bone
lesions and reduce morbidity and mortality in multiple myeloma patients. The
evidence to date for osteoblasts protective effect on malignant plasma cells
reflects our findings in the in vitro setting only and further studies are needed to
confirm our findings. However if osteoblastogenesis is be found to contribute to
myeloma cell survival and/or drug resistance in the in vivo setting the role for
inducers of osteoblastogenesis in multiple myeloma may need to be re-
examined.
4.5.4 Role of the immunoproteasome and interferon-gamma in
bortezomib resistance in vitro
For reasons outlined in results section 3.5.7 above, MM.1R and VDR cells were
pre-treated with interferon-gamma for 48 hours and subsequently treated with
bortezomib for 24 hours (0-80nM), and compared to a non-pre-treated control.
No change in sensitivity of MM.1R to bortezomib was observed with interferon-
gamma pre-treatment. However in VDR pre-treatment with interferon-gamma
resulted in increased sensitivity to bortezomib at concentrations of 40nM (mean
difference=18.24% relative cell viability vs. no interferon-gamma pre-treatment
control; p=0.03) and 80nM (mean difference=12.19% relative cell viability vs. no
interferon-gamma pre-treatment control; p=0.01), (figure 3.5.7.1). As we had
hypothesized that interferon-gamma pre-treatment would up-regulate PSMB8
and down-regulate PSMB5 we next tested our hypothesis by examining to
protein expression level of both proteasome subunits by western blot. Lysates
from MM1R or VDR for the following conditions were examined for their
expression levels of PSMB5, PSMB8 and poly-ubiquitinated proteins:

244
1. Control
2. Interferon-gamma alone
3. Bortezomib alone
4. Interferon-gamma pre-treatment and subsequent bortezomib treatment.
In both MM.1R and VDR, interferon-gamma-treated conditions (2/4 above)
resulted in down-regulation of PSMB5 and up-regulation of PSMB8, as
anticipated. In MM.1R, both bortezomib treatment alone (3) and interferon-
gamma pre-treatment with subsequent bortezomib treatment resulted in
marked accumulation of polyubiquitinated proteins. In VDR, interferon-gamma
alone (2) or bortezomib alone (3) did not result in accumulation of
polyubiquitinated proteins. However pre-treatment of VDR with interferon-
gamma and subsequent bortezomib treatment (4) did result in an accumulation
of polyubiquitinated proteins in VDR (figure 3.5.7.2). In summary, this data
demonstrated that pre-treatment of VDR with interferon-gamma resulted in
down-regulation of PSMB5, up-regulation of PSMB8, with resultant proteasome
inhibition as suggested by accumulation of polyubiquitinated proteins.
Further review of the literature revealed 2 important studies relating to this
research. Firstly, in 2005, Altun et al demonstrated that myeloma cell lines
contain both constitutive and immunoproteasome subunits. At baseline, MM cell
lines contain more constitutive than immunoproteasome subunits, however the
latter is up-regulated by interferon-gamma. By 2-dimensional gel
electrophoresis the active catalytic subunits for β5, β1 and β2 subunits, or β5i,
β1i and β2i were examined following their treatment with bortezomib with and
without interferon-gamma pre-treatment. They found that pre-treatment with
interferon gamma up-regulated the β5i subunit (i.e. PSMB8), and that
bortezomib had the ability to inhibit its catalytic activity. Therefore in VDR cell
line, PSMB8 up-regulation by interferon-gamma may allow bortezomib to inhibit
the proteasome via β5i inhibition and this may explain why we see accumulation
of polyubiquitinated proteins in bortezomib-treated VDR when pre-treated with
interferon-gamma.[55]
245
Secondly, in 2008, another group have previously suggested a role for use of
interferon-gamma to ameliorate the effects of bortezomib in preclinical models
of B cell neoplasms including Burkitt’s lymphoma, mantle cell lymphoma and
myeloma. They found that pre-treatment of the B cell lymphoma cell line
KARPAS422 and 5 out of 6 bortezomib-sensitive B cell lines tested (including
RPMI8226 myeloma cell line) markedly increased the sensitivity of these cell
lines to bortezomib. The plasmacytoma cell line U266 demonstrated the greatest
increase in sensitivity to bortezomib when pre-treated with interferon-gamma.
These findings may be mediated at least in part by increased
immunoproteasome assembly as demonstrated by RT-PCR subunit expression
levels following interferon-gamma pre-treatment.[56] Interferon-gamma however
is also known to alter transcription of a large number of genes including caspase-
8 that promotes apoptosis,[57] and Mitsiades et al have also demonstrated
caspase-8 up-regulation by bortezomib.[40] Therefore we cannot assume that the
effects of interferon-gamma are solely mediated by immunoproteasome subunit
up-regulation. However our data and the data of others both support a role for
interferon-gamma treatment with bortezomib to augment it potency, and in
particular our study supports a role for interferon-gamma pre-treatment in the
setting of bortezomib-refractory myeloma.
4.5.5 Role of the immunoproteasome in the in vivo setting in bortezomib-
refractory myeloma
We showed that PSMB5 was over-expressed in bortezomib-resistant VDR and by
up-regulation of PSMB8 by interferon-gamma, we could increase the degree of
accumulation of polyubiquitinated proteins in VDR and, to a certain degree,
increase the sensitivity of VDR to bortezomib. However clinical samples of
multiple myeloma patients have not been previously examined for their
proteasome subunit expression levels, therefore we undertook
immunohistochemistry on bone marrow trephines of patients with bortezomib-
sensitive (diagnostic samples) and bortezomib-refractory (diagnostic and
246
relapsed samples) multiple myeloma to determine which proteasome subunits
are expressed at diagnosis and at time of relapse.
The following samples were analysed by immunohistochemistry for their
expression of PSMB5 and PSMB8:
1. Diagnostic bone marrow biopsies of 7 patients who achieved at least a very
good partial response (VGPR) to a bortezomib-containing regimen (termed
“diagnostic: responder”).
2. Diagnostic bone marrow biopsies of 6 patients who subsequently were found
to relapse following a bortezomib-based regimen (termed “diagnostic: non-
responder”).
3. Bone marrow biopsies of 7 patients at time of relapse to a bortezomib-
containing regimen (of which 6 correlate to diagnostic samples in no. 2 above),
(termed “relapsed: non-responder”).
We found that PSMB5 was strongly expressed in both bortezomib-responders
and bortezomib non-responders at time of diagnosis in all samples tested. At
time of relapse PSMB5 expression was positive in 5 out of 7 relapsed samples
tested (table 3.5.8.1). PSMB8 was expressed in all 7 bortezomib-responders at
time of diagnosis, although the expression appeared reduced compared to
PSMB5 expression. This may be secondary to differences in the two antibodies
used, however would fit with current knowledge that PSMB5 is highly expressed
in myeloma cell lines, and PSMB8 is also expressed but to a lesser degree
compared to PSMB5. Similarly PSMB8 was expressed in 5 out of 6 bortezomib-
non-responders at time of diagnosis. Interestingly, at time of relapse, PSMB8 was
expressed in only 2 out of 7 bortezomib-non-responders (table 3.5.8.2).
Unusually, in “sample 5 non-responder”, PSMB8 was negative at time of
diagnosis and positive at time of relapse following a bortezomib-containing
regimen (table 3.5.8.2).
In summary, in bortezomib-responders, PSMB5 and PSMB8 were expressed in
100% of samples for both subunits. In bortezomib non-responders, PSMB5 and
PSMB8 were expressed in 100% and 83% of samples respectively at time of
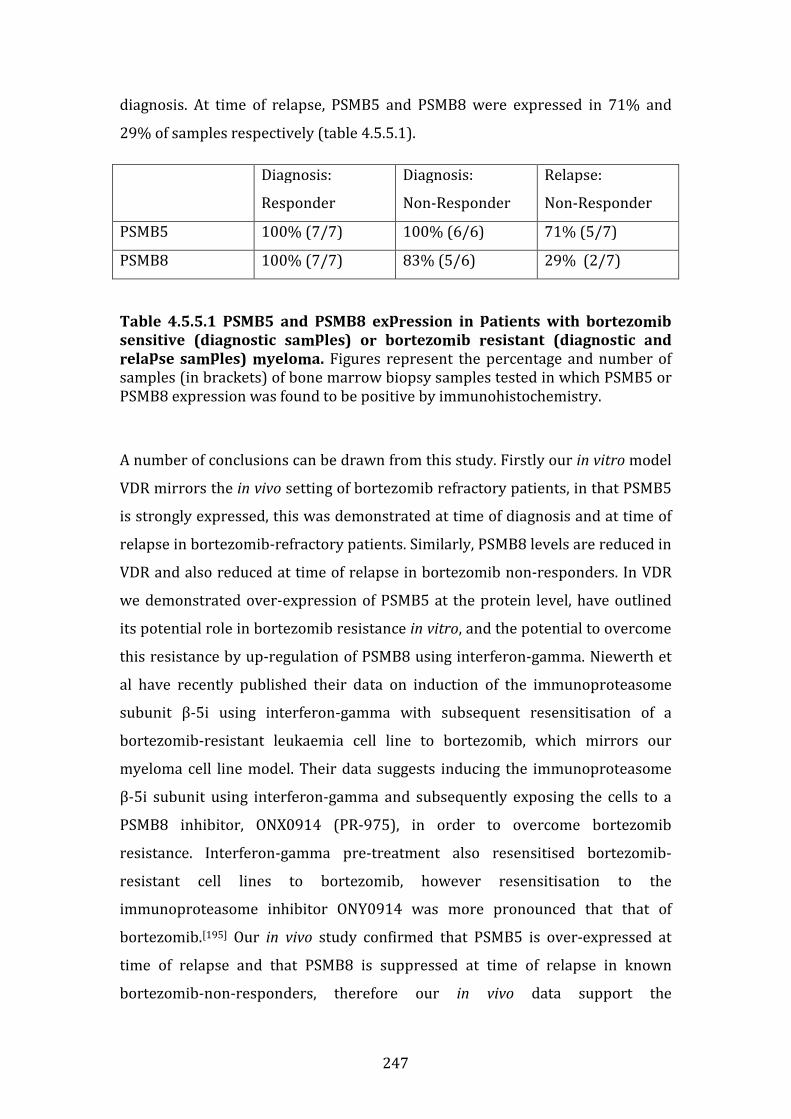
247
diagnosis. At time of relapse, PSMB5 and PSMB8 were expressed in 71% and
29% of samples respectively (table 4.5.5.1).
Diagnosis:
Responder
Diagnosis:
Non-Responder
Relapse:
Non-Responder
PSMB5 100% (7/7) 100% (6/6) 71% (5/7)
PSMB8 100% (7/7) 83% (5/6) 29% (2/7)
Table 4.5.5.1 PSMB5 and PSMB8 expression in patients with bortezomib
sensitive (diagnostic samples) or bortezomib resistant (diagnostic and
relapse samples) myeloma. Figures represent the percentage and number of
samples (in brackets) of bone marrow biopsy samples tested in which PSMB5 or
PSMB8 expression was found to be positive by immunohistochemistry.
A number of conclusions can be drawn from this study. Firstly our in vitro model
VDR mirrors the in vivo setting of bortezomib refractory patients, in that PSMB5
is strongly expressed, this was demonstrated at time of diagnosis and at time of
relapse in bortezomib-refractory patients. Similarly, PSMB8 levels are reduced in
VDR and also reduced at time of relapse in bortezomib non-responders. In VDR
we demonstrated over-expression of PSMB5 at the protein level, have outlined
its potential role in bortezomib resistance in vitro, and the potential to overcome
this resistance by up-regulation of PSMB8 using interferon-gamma. Niewerth et
al have recently published their data on induction of the immunoproteasome
subunit β-5i using interferon-gamma with subsequent resensitisation of a
bortezomib-resistant leukaemia cell line to bortezomib, which mirrors our
myeloma cell line model. Their data suggests inducing the immunoproteasome
β-5i subunit using interferon-gamma and subsequently exposing the cells to a
PSMB8 inhibitor, ONX0914 (PR-975), in order to overcome bortezomib
resistance. Interferon-gamma pre-treatment also resensitised bortezomib-
resistant cell lines to bortezomib, however resensitisation to the
immunoproteasome inhibitor ONY0914 was more pronounced that that of
bortezomib.[195] Our in vivo study confirmed that PSMB5 is over-expressed at
time of relapse and that PSMB8 is suppressed at time of relapse in known
bortezomib-non-responders, therefore our in vivo data support the

248
aforementioned in vitro study, and further emphasises the need for examining
the use of interferon-gamma in conjunction with bortezomib or ONX0914 in
patients with relapsed and refractory multiple myeloma.
Finally, PSMB8 appears to be strongly expressed at diagnosis in both
bortezomib-responders and bortezomib non-responders supporting the role for
a PSMB8-specific inhibitor in vivo. Another PSMB8 inhibitor, PR-924, is now
under investigation in the pre-clinical setting for use in multiple myeloma. PR-
924 has been documented for its efficacy in multiple myeloma in the in vitro and
in vivo setting in a SCID-hu mouse model of plasmacytoma xenografts.[58] Our in
vivo data support the suggestion by Singh et al to assess the efficacy of PSMB8
inhibitors in the in vivo setting for treatment of newly diagnosed multiple
myeloma. Finally in two of the seven bortezomib-refractory samples examined at
time of relapse, PSMB8 was positively expressed, also supporting a role for
PSMB8 inhibitors in relapsed and refractory disease if patients are found to
express PSMB8.

249
Chapter 5
Summary, Conclusion
and Future Work
250
CHAPTER 5. SUMMARY, CONCLUSION AND FUTURE
WORK
5.1 SUMMARY AND CONCLUSION
5.1.1 Characterisation of an isogenic cell line model of bortezomib
resistance in vitro and in vivo.
• VDR demonstrated marked resistance to bortezomib in the in vitro setting
compared to MM.1R, and VDR retains its resistance to dexamethasone
similar to its parent cell line.
• Conventional compounds such as doxorubicin and vincristine have
comparable toxicity in VDR and parental MM1R.
• Recently FDA-approved novel therapies such as vorinostat, lenalidomide,
and pomalidomide are highly toxic to both MM.1R and VDR.
• The investigational reagent JQ1 displays marked anti-tumour activity in
VDR as well as MM.1R.
• VDR cells are also resistant to MLN2238, a novel orally bioavailable
compound that specifically targets the proteasome beta-5 subunit, which
is the same active site targeted by bortezomib.
• While VDR cells are resistant to bortezomib and MLN2238, they are
highly sensitive to the second generation, irreversible proteasome
inhibitor carfilzomib.
• High-throughput screen of a database of compounds with FDA-approval
for use in oncology demonstrated that VDR has marked sensitivity to the
taxanes and topoisomerase-1 and -2 inhibitors.
• Bortezomib resistance in VDR does not appear to be PGP-mediated.
• An in vivo study examining the effect of bortezomib or carfilzomib in MM
did not reveal a statistically significant reduction in tumour burden in
VDR compared to vehicle mice.
• VDR-mice displayed a statistically significant improvement in overall
survival in both bortezomib-treated and carfilzomib-treated mice
compared to vehicle-mice.
251
5.1.2 Whole exome sequencing of MM.1R and VDR
• We performed whole exome sequencing analysis of the cell lines MM.1R
and VDR to determine SNVs, insertions or deletions that were present in
bortezomib resistant VDR but not bortezomib-sensitive MM.1R cell line.
• 28 non-synonymous single nucleotide variants (SNV) were detected in VDR
that were not present in MM.1R
• SIFT and Polyphen predictions found 7 SNVs to be “damaging” by both
algorithms and 6 SNVs were found to be “damaging” by either SIFT or
Polyphen algorithms.
• A deletion in ABCA7 gene was found in VDR but not MM.1R.
• Reduced transcript levels of ABCA7 gene has been correlated with
reduction of disease free interval in patients post-therapy for colorectal
cancer.
• However neither ABCA7 gene down-regulation nor deletion have been
implicated in haematological malignancy in the in vivo setting to date.
• No insertions were identified between the MM.1R and VDR comparisons.
• A missense mutation involving a single amino acid substitution in the
PSMB5 gene was identified in VDR at chromosomal position g.23502844
involving a threonine to alanine substitution at position 80 of exon 2 in the
uncleaved (propeptide) version of PSMB5 gene, with 100% allelic
frequency of mutPSMB5 in VDR, and 100% wtPSMB5 frequency in MM.1R.
• Introduction of mutPSMB5 via lentiviral construct into bortezomib
sensitive cell line KMS11 rendered these cells initially bortezomib-sensitive
cells now resistant to bortezomib.
• Additionally, over-expression of wtPSMB5 reduced the sensitivity of KMS11
cells to bortezomib, however to a lesser degree than mutPSMB5.
252
5.1.3 Gene expression profiles of MM.1R and VDR
• 353 genes were over-expressed in VDR compared to MM.1R. In
comparison only 84 genes were down-regulated in VDR compared to
MM.1R. (whereby fold change >1.2, p<0.01).
• Pathway analysis revealed “cellular apoptosis” as a specific pathway in
which 4 transcripts up-regulated in VDR play a role. These genes include
CFLAR, CASP8, CASP10, and NFKBIA
• Transcripts that were down-regulated in VDR compared to MM.1R were
noted to participate in a number of cellular processes mainly concerned
with the immune system.
• An shRNA screen of 27 selected target genes was undertaken to
determine if shRNA knockdown and subsequent bortezomib treatment
resensitised VDR cell cells to bortezomib. 11 genes were found to cause
>40% cell death of VDR cells compared to control hairpins following
shRNA knockdown and subsequent treatment with bortezomib 50nM.
• PSMB5 shRNA knockdown resulted in resensitisation of VDR to
bortezomib 50nM. We validated successful shRNA knockdown of PSMB5
in MM.1R and VDR by immunoblot. We furthermore demonstrated that
shRNA knockdown of PSMB5 and subsequent treatment of VDR cells
(used at even lower concentrations of bortezomib compared to initial
screen: 50nM vs. 20-40nM), resulted in significant resensitisation of VDR
to bortezomib.
253
5.1.4 Proteomic profiling of MM.1R and VDR by label-free mass
spectrometry
• 238 proteins were differentially expressed in the MM.1R vs. VDR
comparison, of which 106 were over-expressed and 132 down-regulated
in VDR vs. MM.1R.
• CCL3 has known pathogenesis in myeloma and demonstrated a 22-fold
higher expression level in VDR compared to MM.1R.
• DAVID functional annotation tool revealed a number of proteins over-
expressed in VDR that are involved in apoptosis, regulation of cellular
metabolic processes, cellular homeostasis, cell cycle process and
proteasomal ubiquitin-dependent protein catabolic process.
• Three proteins that were found to be down-regulated in VDR compared to
MM.1R were found to be involved in aminoacyl tRNA biosynthesis.
• We also analysed proteins differentially expressed in MM.1R and VDR
following bortezomib treatment, of which the majority of proteins were
down-regulated in bortezomib-treated MM.1R.
• By comparing bortezomib-treated MM.1R to bortezomib-treated VDR,
109 proteins out of a total 323 were downregulated in bortezomib-
treated-VDR compared to bortezomib-treated-MM.1R.
• 5 proteins that were down-regulated in bortezomib-treated VDR
compared to bortezomib-treated MM.1R are involved in the MAP-kinase
signalling pathway, which when altered, is well documented for its role in
carcinogenesis. These proteins include FLNA, HSP72/HSPA6, PPP3C,
MEF2C and HSP27/HSPB1.
• 215 proteins were up-regulated in bortezomib-treated VDR compared to
bortezomib-treated MM.1R. Two target proteins of interest included CCL3
and EIF5A.
• PSMB5 is over-expressed 3.85-fold in VDR compared to MM.1R at
baseline. A 13-fold increase in PSMB5 expression is observed in
bortezomib-treated VDR compared to bortezomib-treated MM.1R,
supporting the role of PSMB5 dysregulation in VDR as a potential
mechanism for bortezomib resistance in this cell line.
254
5.1.5 Functional studies and potential role of the bone marrow
microenvironment in the pathogenesis of bortezomib resistance in
VDR
• No change in the sensitivity of MM.1R or VDR to bortezomib was
observed following their short term co-culture with HS-5 stromal cells
• MM.1R cells appeared to display reduced sensitivity to carfilzomib
following their co-culture with HS-5 cells, however VDR cells retained
their sensitivity to carfilzomib despite their co-culture with HS-5 cells.
• VDR cells displayed resistance to vorinostat and MLN4924 when co-
cultured in the presence of HS-5 cells, and combination of bortezomib
with either agent was not sufficient to overcome the resistance observed.
• VDR displayed a marked increase in cell viability when co-cultured in the
presence of hFob cell line.
• MM.1S appeared to be the cell line that was most susceptible to changes
in drug sensitivity when co-cultured with hFob cells. Resistance to
doxorubicin was evident in MM.1R and VDR cells in co-culture with hFob.
• Direct cell-to-cell contact appeared to be necessary for osteoblast-induced
resistance to vorinostat in MM.1S, but was not necessary for osteoblast-
induced resistance to doxorubicin in MM.1S.
• By pre-treating VDR cells with interferon-gamma before bortezomib
treatment, we observed an increase in sensitivity of VDR cells to
bortezomib, and an increase in poly-ubiquitinated proteins and increased
expression of PSMB8 as demonstrated by western blot.
• Immunohistochemistry on 7 bone marrow trephines of patients with
bortezomib-sensitive and bortezomib-refractory multiple myeloma
revealed the following:
1. PSMB5 was expressed at diagnosis in all bortezomib responders and
bortezomib non-responders tested.
2. At time of relapse, PSMB5 was expressed in 5 out of 7 samples tested.
3. PSMB8 was expressed at diagnosis in all bortezomib responders and in 5 out
of 6 bortezomib non-responders.
4. At time of relapse, PSMB8 was expressed in 2 out of 7 samples tested.
255
5.1.6 CONCLUSION
The main aim of this thesis was to examine the intrinsic and extrinsic
mechanisms of bortezomib resistance in multiple myeloma based on our study of
an isogenic cell line model of bortezomib resistance. VDR displayed stable
resistance to bortezomib compared to parental bortezomib-sensitive cell line
MM.1R. in a number of toxicological-based assays. VDR retained its resistance to
dexamethasone similar to MM.1R. The toxicity profile of this cell line to other
conventional, novel and investigational therapies was also comparable with
MM.1R. Interestingly, VDR was also resistant to the orally bioactive alternative
form of bortezomib, MLN2238, but was highly sensitive to the irreversible
proteasome inhibitor carfilzomib. The resistance to bortezomib did not appear
to be mediated by p-glycoprotein, and was secondary to a difference in
proliferation rate between the two cell lines. An in vivo study examining the
effect of bortezomib or carfilzomib in VDR did not reveal a statistically
significant reduction in tumour burden in either cell lines compared to vehicle
mice. In MM.1R-mice, a statistically significant improvement in overall survival
was observed in bortezomib treated mice, compared to controls and compared
to carfilzomib treated mice. VDR-mice displayed a statistically significant
improvement in overall survival in both bortezomib-treated and carfilzomib-
treated mice compared to vehicle-mice. The in vivo study emphasises the
pertinent role of the bone marrow microenvironment in multiple myeloma
pathogenesis, and the reasons for the findings of this in vivo study should be
clarified.
Whole exome sequencing of MM.1R and VDR identified 28 non-synonymous
single nucleotide variants found in VDR that were not present in MM.1R. A single
amino acid substitution in the PSMB5 gene was identified in VDR involving a
threonine to alanine substitution with 100% allelic frequency in VDR, and 100%
wtPSMB5 frequency in MM.1R. This PSMB5 mutation was previously
documented and has been shown by 3D in silico modelling to induce a
conformational change in the bortezomib binding pocket. Introduction of
mutPSMB5 via lentiviral construct into the bortezomib sensitive cell line KMS11
rendered these cells resistant to bortezomib. Over-expression of wtPSMB5
256
reduced the sensitivity of KMS11 cells to bortezomib, but to a lesser degree than
mutPSMB5. In addition a deletion in ABCA7 gene was found in VDR but not
MM.1R. Reduced transcript levels of ABCA7 gene has been correlated with
reduction of disease free interval in patients post-therapy for colorectal cancer.
However neither ABCA7 gene down-regulation nor deletion have been
implicated in haematological malignancy in the in vivo setting to date.
Gene expression profiling revealed a number of genes differentially expressed in
VDR compared to MM.1R. Pathway analysis revealed “cellular apoptosis” as a
specific pathway in which 4 transcripts that are up-regulated in VDR play a role.
These genes include CFLAR, CASP8, CASP10, and NFKBIA. Transcripts that were
down-regulated in VDR compared to MM.1R were noted to participate in a
number of cellular processes mainly concerned with the immune system. An
shRNA screen of 27 selected target genes was undertaken to determine if shRNA
knockdown and subsequent bortezomib treatment resensitised VDR cell cells to
bortezomib. Here, 11 of 27 genes analysed were found to cause >40% cell death
of VDR cells compared to control hairpins following shRNA knockdown and
subsequent treatment with bortezomib 50nM. In particular, PSMB5 shRNA
knockdown resulted in resensitisation of VDR to bortezomib 50nM. We validated
successful shRNA knockdown of PSMB5 in MM.1R and VDR by immunoblot. We
furthermore demonstrated that shRNA knockdown of PSMB5 and subsequent
treatment of VDR cells (used at even lower concentrations of bortezomib
compared to initial screen: 50nM vs. 20-40nM), resulted in significant
resensitisation of VDR to bortezomib, suggesting PSMB5 as a major factor in
bortezomib-induced resistance in VDR.
By label-free mass spectrometry 238 proteins were differentially expressed in
the MM.1R vs. VDR comparison, including a number of interesting targets such as
CCL3 which has known pathogenesis in myeloma. Three proteins that were
found to be down-regulated in VDR compared to MM.1R are involved in
aminoacyl tRNA biosynthesis. By comparing bortezomib-treated MM.1R to
bortezomib-treated VDR, we demonstrated 5 proteins that were down-regulated
in bortezomib-treated VDR compared to bortezomib-treated MM.1R that are
involved in the MAP-kinase signalling pathway, known for its role in
257
carcinogenesis. Proteins up-regulated in bortezomib-treated VDR compared to
bortezomib-treated MM.1R included PSMB7, PSMB6, CCL3, GSTP1 and EIF5A. In
addition PSMB5 is over-expressed also at the protein level 3.85-fold in VDR
compared to MM.1R at baseline. A 13-fold increase in PSMB5 expression is
observed in bortezomib-treated VDR compared to bortezomib-treated MM.1R,
supporting the role of PSMB5 dysregulation in VDR as a potential mechanism for
bortezomib resistance in this cell line.
We examined a number of extrinsic factors that play a further role in bortezomib
resistance in VDR. No change in the sensitivity of MM.1R or VDR to bortezomib
was observed following their co-culture with HS-5 stromal cells. MM.1R cells
appeared to display reduced sensitivity to carfilzomib following their co-culture
with HS-5 cells and the mechanism for this observation remains unclear.
However VDR cells retained their sensitivity to carfilzomib despite their co-
culture with HS-5 cells. Examining other novel therapies, VDR cells displayed
resistance to vorinostat and MLN4924 when co-cultured in the presence of HS-5
cells, and combination of bortezomib with either agent was not sufficient to
overcome the resistance observed. We furthermore investigated the effect of
osteoblasts on the isogenic cell line model. VDR displayed a marked increase in
cell viability when co-cultured in the presence of hFob cell line. Again the
mechanism for this finding needs to be clarified. MM.1S (rather than MM.1R or
VDR) appeared to be the cell line that was most susceptible to changes in drug
sensitivity when co-cultured with hFob cells, and was evident for
dexamethasone, doxorubicin and vorinostat treatments. Resistance to
doxorubicin only was evident in MM.1R and VDR cells in co-culture with hFob.
Direct cell-to-cell contact appeared to be necessary for osteoblast-induced
resistance to vorinostat in MM.1S, but was not necessary for osteoblast-induced
resistance to doxorubicin in MM.1S. Finally by pre-treating VDR cells with
interferon-gamma before bortezomib treatment, an increase in sensitivity of
VDR cells to bortezomib, and an increase in poly-ubiquitinated proteins and
increased expression of PSMB8 as demonstrated by western blot was observed.
Immunohistochemistry on 7 bone marrow trephines of patients with
bortezomib-refractory multiple myeloma revealed varied expression levels of
258
PSMB5 (100%) and PSMB8 (83%) in the bone marrow biopsies of these patients
at diagnosis, whereas at time of relapse, 71% of samples were positive for
PSMB5 but only 29% positive for PSMB8.
These final studies of extrinsic mechanisms of drug resistance have provided a
number of interesting conclusions. Panproteasome inhibition through
carfilzomib could be considered a more effective means of myeloma cell death in
the setting of bortezomib resistance and its efficacy does not appear to be
abrogated by the presence of accessory HS-5 stromal cells. Osteoblast-like cells
hFob appear to support the growth of VDR cells, and in grand-parent cell line
MM.1S, appears to induce resistance to a number of novel and conventional
therapies, and the mechanisms for these latter findings should be further
investigated. Finally PSMB8 over-expression by interferon-gamma stimulation
appears to induce a degree of resensitisation of VDR to bortezomib. PSMB8
expression is lost in a number of bortezomib-refractory patients. Bortezomib
resistance in vivo could potentially be overcome by upregulation of PSMB8 by
pre-treatment of patients with interferon-gamma and subsequent treatment
with bortezomib or a PSMB8 inhibitor. In addition, PSMB8 is expressed at
diagnosis in bortezomib responders and non-responders supporting the
proposal for clinical trials for use of PSMB8 inhibitors in patients with newly
diagnosed multiple myeloma. If patients are found to over-express PSMB8 in
bone marrow trephine samples at time of relapse, as was observed in a small
number of our patients, a PSMB8 inhibitor may also be beneficial in patients with
bortezomib-refractory disease.
259
5.2 FUTURE WORK
5.2.1 Characterisation of an isogenic cell line model of bortezomib
resistance in vitro and in vivo.
• Generation of further models of resistance to novel therapies such as
carfilzomib.
• Longer follow-up of in vivo study to determine if VDR displays greater
resistance to bortezomib in the in vivo setting that mirrors the in vitro
setting.
• Investigate reasoning for greater reduction in tumour burden in MM.1R-
mice treated with bortezomib compared to carfilzomib.
• Generation of models of drug resistance in myeloma in the setting of the
bone marrow microenvironment.
5.2.2 Whole exome sequencing of MM.1R and VDR
• Evaluate CD138-positive cells of bortezomib-refractory multiple myeloma
patients for deletion in ABCA7 gene to determine if this finding in the in
vitro models correlates in the in vivo setting
• Evaluate a greater number of bortezomib-refractory patients for
mutPSMB5 identified in VDR by our group and others, later in their
disease stage, following multiple lines of bortezomib-based regimens.
5.2.3 Gene expression profiles of MM.1R and VDR
• Validation of further targets identified by shRNA knockdown screen as
markers that when eliminated, increase the sensitivity of VDR to
bortezomib.
5.2.4 Proteomic profiling of MM.1R and VDR by label-free mass
spectrometry
• In vitro assay to examine the efficacy of a specific CCL3 inhibitor in
bortezomib-resistant cell line VDR
260
• Validation of further biomarkers upregulated in VDR as identified by
label-free mass spectrometry in particular those of the MAP-kinase
pathway, and clarify their role bortezomib resistance.
5.2.5 Role of the bone marrow microenvironment in the pathogenesis of
bortezomib resistance in VDR
• Investigate the mechanism for the observed stromal induced carfilzomib-
resistance in MM1.R by HS-5 cells that was not apparent in VDR.
• Although not directly implicated in bortezomib resistance, one should
investigate the mechanisms of osteoblast-induced increase in
proliferation rate in VDR, and osteoblast-induced drug-resistance in
MM.1S.
• Analyse a greater number of bone marrow biopsies of patients with
bortezomib-refractory myeloma at time of diagnosis and relapse to
confirm the expression levels of PSMB5 and PSMB8 observed in our study
• An in vivo mouse model of bortezomib-refractory myeloma examining the
tolerability of interferon-gamma with subsequent bortezomib or PSMB8
inhibitor in the in vivo setting, with a view to progressing to phase 1
clinical trials in patients with bortezomib-refractory myeloma.

261
6. SCIENTIFIC WORK PUBLISHED OR PRESENTED
Journal Publications:
New proteasome inhibitors in myeloma.
Lawasut P, Chauhan D, Laubach J, Hayes C, Fabre C, Maglio M, Mitsiades C,
Hideshima T, Anderson KC, Richardson PG.
Curr Hematol Malig Rep. 2012 Dec;7(4):258-66.
Presentations to Learned Societies
Poster Presentations:
1. Human Proteome Organization (HUPO). Geneva, Switzerland,
September 2011. Hayes CA, O’ Gorman P, Ooi MG, Jakubikova J, Jacobs
H, Delmore J, McMillin DW, Klippel S, Anderson KC, Richardson PG, Clynes
M, Mitsiades CS, Dowling P. Osteoclasts in multiple myeloma: molecular
characterization of the synergistic pathways involved.
2. Haematology Association of Ireland Congress, Ireland, October 2011.
Hayes CA, Jakubikova J, Ooi MG, Jacobs H, Delmore J, McMillin DW,
Anderson KC, Richardson PG, Clynes M, O’ Gorman P, Mitsiades CS,
Dowling P. Proteomic profile of the multiple myeloma cell line NCI-H929
following osteoclast co-culture.
3. American Society of Haematology Annual Congress, San Diego, CA.
December 2011. Hayes CA, Dowling P, Negri J, Henry M, Buon L,
Jakubikova J, Delmore J, McMillin DW, Klippel S, Jacobs HM, van de Donk
N, Dhimolea E, Lawasut P, Richardson PG, Anderson KC, Clynes M, O’
Gorman P, Mitsiades CS. Proteomic characterization of an isogenic
multiple myeloma cell line model of bortezomib resistance.
4. American Society of Haematology Annual Congress, Atlanta, Georgia,
December 2012. Catriona A. Hayes, Paul Dowling, Richard W.J. Groen,
Douglas W. McMillin, Jake E. Delmore, Hannah M. Jacobs, Niels W.C.J. van
de Donk, Eugen Dhimolea, Paul G. Richardson, Kenneth C. Anderson,
Martin Clynes, Peter O'Gorman, Constantine S. Mitsiades. Cells of the
Osteoblast Lineage Confer Myeloma Cell Resistance to Established and
Investigational Therapeutic Agents.
5. European School of Haematology International Conference on
Multiple Myeloma, Dublin, October 2013. C Hayes, P Dowling, M
Henry, S Madden, J Meiller, E Dhimolea, MBariteau, J Negri, B. Aftab, A.
Schinzel, N Kohl, M Clynes, C Mitsiades, P O’Gorman. Characterisation Of
262
An Isogenic Cell Line Model Of Bortezomib Resistance In Multiple
Myeloma.
Oral Presentations:
6. Haematology Association of Ireland Congress, Ireland, October 2011.
CA Hayes, D McMillin, HM Jacobs, J Delmore, P Lawasut, E Dhimolea, M
Clynes, P Dowling, PG Richardson, KC Anderson, P O’ Gorman, CS
Mitsiades. Pre-clinical investigation of an alternative pathophysiologic
role for osteoblasts in multiple myeloma.
7. Haematology Association of Ireland Congress, Ireland, October 2013.
C Hayes, P Dowling, M Henry, S Madden, J Meiller, E Dhimolea, MBariteau,
J Negri, B. Aftab, A. Schinzel, N Kohl, M Clynes, C Mitsiades, P O’Gorman.
Characterisation Of An Isogenic Cell Line Model Of Bortezomib Resistance
In Multiple Myeloma.
263
REFERENCES
1. Sant, M., et al., Survival for haematological malignancies in Europe between
1997 and 2008 by region and age: results of EUROCARE-5, a population-
based study. Lancet Oncol, 2014. 15(9): p. 931-42.
2. Richardson, P.G., et al., Extended follow-up of a phase 3 trial in relapsed
multiple myeloma: final time-to-event results of the APEX trial. Blood, 2007.
110(10): p. 3557-60.
3. Moreau, P., et al., Proteasome inhibitors in multiple myeloma: 10 years
later. Blood, 2012. 120(5): p. 947-59.
4. Kumar, S.K., et al., Risk of progression and survival in multiple myeloma
relapsing after therapy with IMiDs and bortezomib: a multicenter
international myeloma working group study. Leukemia, 2012. 26(1): p.
149-57.
5. Kyle, R.A., et al., Prevalence of monoclonal gammopathy of undetermined
significance. N Engl J Med, 2006. 354(13): p. 1362-9.
6. Kyle, R.A. and S.V. Rajkumar, Criteria for diagnosis, staging, risk
stratification and response assessment of multiple myeloma. Leukemia,
2009. 23(1): p. 3-9.
7. Durie, B.G. and S.E. Salmon, A clinical staging system for multiple myeloma.
Correlation of measured myeloma cell mass with presenting clinical
features, response to treatment, and survival. Cancer, 1975. 36(3): p. 842-
54.
8. Greipp, P.R., et al., International staging system for multiple myeloma. J Clin
Oncol, 2005. 23(15): p. 3412-20.
9. Kleber, M., et al., Validation of the Freiburg Comorbidity Index in 466
Multiple Myeloma Patients and Combination With the International Staging
System Are Highly Predictive for Outcome. Clin Lymphoma Myeloma Leuk,
2013.
10. Engelhardt, M., et al., European Myeloma Network recommendations on the
evaluation and treatment of newly diagnosed patients with multiple
myeloma. Haematologica, 2014. 99(2): p. 232-42.
11. Richardson, P.G., et al., Lenalidomide, bortezomib, and dexamethasone
combination therapy in patients with newly diagnosed multiple myeloma.
Blood, 2010. 116(5): p. 679-86.
12. Morgan, G.J., et al., First-line treatment with zoledronic acid as compared
with clodronic acid in multiple myeloma (MRC Myeloma IX): a randomised
controlled trial. Lancet, 2010. 376(9757): p. 1989-99.
13. McCarthy, P.L., et al., Lenalidomide after stem-cell transplantation for
multiple myeloma. N Engl J Med, 2012. 366(19): p. 1770-81.
14. Richardson, P., et al., Phase I trial of oral vorinostat (suberoylanilide
hydroxamic acid, SAHA) in patients with advanced multiple myeloma. Leuk
Lymphoma, 2008. 49(3): p. 502-7.
264
15. Weber, D.M., et al., Phase I Trial of Vorinostat Combined With Bortezomib
for the Treatment of Relapsing and/or Refractory Multiple Myeloma. Clin
Lymphoma Myeloma Leuk, 2012. 12(5): p. 319-24.
16. Hideshima, T., P.G. Richardson, and K.C. Anderson, Mechanism of action of
proteasome inhibitors and deacetylase inhibitors and the biological basis of
synergy in multiple myeloma. Mol Cancer Ther, 2011. 10(11): p. 2034-42.
17. DeAngelo, D.J., et al., Phase Ia/II, two-arm, open-label, dose-escalation study
of oral panobinostat administered via two dosing schedules in patients with
advanced hematologic malignancies. Leukemia, 2013. 27(8): p. 1628-36.
18. Richardson, P.G., et al., PANORAMA 2: panobinostat in combination with
bortezomib and dexamethasone in patients with relapsed and bortezomib-
refractory myeloma. Blood, 2013. 122(14): p. 2331-7.
19. San-Miguel, J.F., et al., Phase Ib study of panobinostat and bortezomib in
relapsed or relapsed and refractory multiple myeloma. J Clin Oncol, 2013.
31(29): p. 3696-703.
20. Siegel, D.S., et al., A phase 2 study of single-agent carfilzomib (PX-171-003-
A1) in patients with relapsed and refractory multiple myeloma. Blood,
2012. 120(14): p. 2817-25.
21. Bringhen, S., et al., Carfilzomib, cyclophosphamide, and dexamethasone in
patients with newly diagnosed multiple myeloma: a multicenter, phase 2
study. Blood, 2014. 124(1): p. 63-9.
22. Jagannath, S., et al., An Open-Label Single-Arm Pilot Phase II Study (PX-171-
003-A0) of Low-Dose, Single-Agent Carfilzomib in Patients With Relapsed
and Refractory Multiple Myeloma. Clin Lymphoma Myeloma Leuk, 2012.
12(5): p. 310-8.
23. Lendvai, N., et al., A phase 2 single-center study of carfilzomib 56 mg/m2
with or without low-dose dexamethasone in relapsed multiple myeloma.
Blood, 2014. 124(6): p. 899-906.
24. Siegel, D., et al., Integrated safety profile of single-agent carfilzomib:
experience from 526 patients enrolled in 4 phase II clinical studies.
Haematologica, 2013. 98(11): p. 1753-61.
25. Chauhan, D., et al., A novel orally active proteasome inhibitor induces
apoptosis in multiple myeloma cells with mechanisms distinct from
Bortezomib. Cancer Cell, 2005. 8(5): p. 407-19.
26. Richardson, P.G., et al., Phase 1 study of twice-weekly ixazomib, an oral
proteasome inhibitor, in relapsed/refractory multiple myeloma patients.
Blood, 2014. 124(7): p. 1038-46.
27. Larocca, A., et al., Pomalidomide, cyclophosphamide, and prednisone for
relapsed/refractory multiple myeloma: a multicenter phase 1/2 open-label
study. Blood, 2013. 122(16): p. 2799-806.
28. Leleu, X., et al., Pomalidomide plus low-dose dexamethasone is active and
well tolerated in bortezomib and lenalidomide-refractory multiple
myeloma: Intergroupe Francophone du Myelome 2009-02. Blood, 2013.
121(11): p. 1968-75.
29. Richardson, P.G., et al., Phase 1 study of pomalidomide MTD, safety, and
efficacy in patients with refractory multiple myeloma who have received
lenalidomide and bortezomib. Blood, 2013. 121(11): p. 1961-7.
265
30. Richardson, P.G., et al., Pomalidomide alone or in combination with low-
dose dexamethasone in relapsed and refractory multiple myeloma: a
randomized phase 2 study. Blood, 2014. 123(12): p. 1826-32.
31. San Miguel, J., et al., Pomalidomide plus low-dose dexamethasone versus
high-dose dexamethasone alone for patients with relapsed and refractory
multiple myeloma (MM-003): a randomised, open-label, phase 3 trial.
Lancet Oncol, 2013. 14(11): p. 1055-66.
32. Richardson, P.G., et al., Perifosine , an oral, anti-cancer agent and inhibitor
of the Akt pathway: mechanistic actions, pharmacodynamics,
pharmacokinetics, and clinical activity. Expert Opin Drug Metab Toxicol,
2012. 8(5): p. 623-33.
33. Jakubowiak, A.J., et al., Perifosine plus lenalidomide and dexamethasone in
relapsed and relapsed/refractory multiple myeloma: a Phase I Multiple
Myeloma Research Consortium study. Br J Haematol, 2012. 158(4): p. 472-
80.
34. McMillin, D.W., et al., Molecular and cellular effects of NEDD8-activating
enzyme inhibition in myeloma. Mol Cancer Ther, 2012. 11(4): p. 942-51.
35. McMillin, D.W., et al., Antimyeloma activity of the orally bioavailable dual
phosphatidylinositol 3-kinase/mammalian target of rapamycin inhibitor
NVP-BEZ235. Cancer Res, 2009. 69(14): p. 5835-42.
36. Lonial, S., C.S. Mitsiades, and P.G. Richardson, Treatment options for
relapsed and refractory multiple myeloma. Clin Cancer Res, 2011. 17(6): p.
1264-77.
37. Jakubowiak, A.J., et al., Phase I trial of anti-CS1 monoclonal antibody
elotuzumab in combination with bortezomib in the treatment of
relapsed/refractory multiple myeloma. J Clin Oncol, 2012. 30(16): p. 1960-
5.
38. Groll, M., et al., Structure of 20S proteasome from yeast at 2.4 A resolution.
Nature, 1997. 386(6624): p. 463-71.
39. Groll, M., et al., Crystal structure of the boronic acid-based proteasome
inhibitor bortezomib in complex with the yeast 20S proteasome. Structure,
2006. 14(3): p. 451-6.
40. Mitsiades, N., et al., Molecular sequelae of proteasome inhibition in human
multiple myeloma cells. Proc Natl Acad Sci U S A, 2002. 99(22): p. 14374-9.
41. Hideshima, T., et al., NF-kappa B as a therapeutic target in multiple
myeloma. J Biol Chem, 2002. 277(19): p. 16639-47.
42. Mitsiades, N., et al., The proteasome inhibitor PS-341 potentiates sensitivity
of multiple myeloma cells to conventional chemotherapeutic agents:
therapeutic applications. Blood, 2003. 101(6): p. 2377-80.
43. Ooi, M.G., et al., Interactions of the Hdm2/p53 and proteasome pathways
may enhance the antitumor activity of bortezomib. Clin Cancer Res, 2009.
15(23): p. 7153-60.
44. Uyama, M., et al., Regulation of osteoblastic differentiation by the
proteasome inhibitor bortezomib. Genes Cells, 2012. 17(7): p. 548-58.
45. Pennisi, A., et al., The proteasome inhibitor, bortezomib suppresses primary
myeloma and stimulates bone formation in myelomatous and
nonmyelomatous bones in vivo. Am J Hematol, 2009. 84(1): p. 6-14.
46. Zangari, M., et al., A prospective evaluation of the biochemical, metabolic,
hormonal and structural bone changes associated with bortezomib
266
response in multiple myeloma patients. Haematologica, 2011. 96(2): p.
333-6.
47. Parlati, F., et al., Carfilzomib can induce tumor cell death through selective
inhibition of the chymotrypsin-like activity of the proteasome. Blood, 2009.
114(16): p. 3439-47.
48. Kuhn, D.J., et al., Potent activity of carfilzomib, a novel, irreversible inhibitor
of the ubiquitin-proteasome pathway, against preclinical models of multiple
myeloma. Blood, 2007. 110(9): p. 3281-90.
49. Martin, T.G., Peripheral Neuropathy Experience in Patients With Relapsed
and/or Refractory Multiple Myeloma Treated With Carfilzomib. Oncology
(Williston Park), 2013. 27(12 Suppl 3).
50. Arastu-Kapur, S., et al., Nonproteasomal targets of the proteasome
inhibitors bortezomib and carfilzomib: a link to clinical adverse events. Clin
Cancer Res, 2011. 17(9): p. 2734-43.
51. Lawasut, P., et al., New Proteasome Inhibitors in Myeloma. Curr Hematol
Malig Rep, 2012.
52. Millward, M., et al., Phase 1 clinical trial of the novel proteasome inhibitor
marizomib with the histone deacetylase inhibitor vorinostat in patients
with melanoma, pancreatic and lung cancer based on in vitro assessments
of the combination. Invest New Drugs, 2012. 30(6): p. 2303-17.
53. Ferrington, D.A. and D.S. Gregerson, Immunoproteasomes: structure,
function, and antigen presentation. Prog Mol Biol Transl Sci, 2012. 109: p.
75-112.
54. Rock, K.L. and A.L. Goldberg, Degradation of cell proteins and the
generation of MHC class I-presented peptides. Annu Rev Immunol, 1999.
17: p. 739-79.
55. Altun, M., et al., Effects of PS-341 on the activity and composition of
proteasomes in multiple myeloma cells. Cancer Res, 2005. 65(17): p. 7896-
901.
56. Busse, A., et al., Sensitivity of tumor cells to proteasome inhibitors is
associated with expression levels and composition of proteasome subunits.
Cancer, 2008. 112(3): p. 659-70.
57. Varela, N., et al., Interferon-gamma sensitizes human myeloid leukemia cells
to death receptor-mediated apoptosis by a pleiotropic mechanism. J Biol
Chem, 2001. 276(21): p. 17779-87.
58. Singh, A.V., et al., PR-924, a selective inhibitor of the immunoproteasome
subunit LMP-7, blocks multiple myeloma cell growth both in vitro and in
vivo. Br J Haematol, 2011. 152(2): p. 155-63.
59. Oerlemans, R., et al., Molecular basis of bortezomib resistance: proteasome
subunit beta5 (PSMB5) gene mutation and overexpression of PSMB5
protein. Blood, 2008. 112(6): p. 2489-99.
60. Lu, S., et al., Point mutation of the proteasome beta5 subunit gene is an
important mechanism of bortezomib resistance in bortezomib-selected
variants of Jurkat T cell lymphoblastic lymphoma/leukemia line. J
Pharmacol Exp Ther, 2008. 326(2): p. 423-31.
61. Ri, M., et al., Bortezomib-resistant myeloma cell lines: a role for mutated
PSMB5 in preventing the accumulation of unfolded proteins and fatal ER
stress. Leukemia, 2010. 24(8): p. 1506-12.
267
62. Perez-Galan, P., et al., Bortezomib resistance in mantle cell lymphoma is
associated with plasmacytic differentiation. Blood, 2011. 117(2): p. 542-
52.
63. Suzuki, E., et al., Molecular mechanisms of bortezomib resistant
adenocarcinoma cells. PLoS One, 2011. 6(12): p. e27996.
64. Franke, N.E., et al., Impaired bortezomib binding to mutant beta5 subunit of
the proteasome is the underlying basis for bortezomib resistance in
leukemia cells. Leukemia, 2012. 26(4): p. 757-68.
65. Kuhn, D.J., et al., Targeting the insulin-like growth factor-1 receptor to
overcome bortezomib resistance in preclinical models of multiple myeloma.
Blood, 2012. 120(16): p. 3260-70.
66. Sawyer, J.R., The prognostic significance of cytogenetics and molecular
profiling in multiple myeloma. Cancer Genet, 2011. 204(1): p. 3-12.
67. Chapman, M.A., et al., Initial genome sequencing and analysis of multiple
myeloma. Nature, 2011. 471(7339): p. 467-72.
68. Bollag, G., et al., Vemurafenib: the first drug approved for BRAF-mutant
cancer. Nat Rev Drug Discov, 2012.
69. Lichter, D.I., et al., Sequence analysis of beta-subunit genes of the 20S
proteasome in patients with relapsed multiple myeloma treated with
bortezomib or dexamethasone. Blood, 2012. 120(23): p. 4513-6.
70. Paget, S., The distribution of secondary growths in cancer of the breast.
1889. Cancer Metastasis Rev, 1989. 8(2): p. 98-101.
71. Hideshima, T., et al., Understanding multiple myeloma pathogenesis in the
bone marrow to identify new therapeutic targets. Nat Rev Cancer, 2007.
7(8): p. 585-98.
72. Mitsiades, C.S., et al., The role of the bone marrow microenvironment in the
pathophysiology of myeloma and its significance in the development of
more effective therapies. Hematol Oncol Clin North Am, 2007. 21(6): p.
1007-34, vii-viii.
73. Mitsiades, C.S., et al., The role of the bone microenvironment in the
pathophysiology and therapeutic management of multiple myeloma:
interplay of growth factors, their receptors and stromal interactions. Eur J
Cancer, 2006. 42(11): p. 1564-73.
74. Zhou, J., et al., The role of the tumor microenvironment in hematological
malignancies and implication for therapy. Front Biosci, 2005. 10: p. 1581-
96.
75. Michigami, T., et al., Cell-cell contact between marrow stromal cells and
myeloma cells via VCAM-1 and alpha(4)beta(1)-integrin enhances
production of osteoclast-stimulating activity. Blood, 2000. 96(5): p. 1953-
60.
76. Pearse, R.N., et al., Multiple myeloma disrupts the TRANCE/
osteoprotegerin cytokine axis to trigger bone destruction and promote
tumor progression. Proc Natl Acad Sci U S A, 2001. 98(20): p. 11581-6.
77. Yaccoby, S., et al., Cancer and the microenvironment: myeloma-osteoclast
interactions as a model. Cancer Res, 2004. 64(6): p. 2016-23.
78. Komori, T., Regulation of bone development and maintenance by Runx2.
Front Biosci, 2008. 13: p. 898-903.
268
79. Giuliani, N., et al., Myeloma cells block RUNX2/CBFA1 activity in human
bone marrow osteoblast progenitors and inhibit osteoblast formation and
differentiation. Blood, 2005. 106(7): p. 2472-83.
80. Heider, U., et al., Novel aspects of osteoclast activation and osteoblast
inhibition in myeloma bone disease. Biochem Biophys Res Commun, 2005.
338(2): p. 687-93.
81. Tian, E., et al., The role of the Wnt-signaling antagonist DKK1 in the
development of osteolytic lesions in multiple myeloma. N Engl J Med, 2003.
349(26): p. 2483-94.
82. He, J., et al., p38 MAPK in myeloma cells regulates osteoclast and osteoblast
activity and induces bone destruction. Cancer Res, 2012.
83. D'Souza, S., et al., Gfi1 expressed in bone marrow stromal cells is a novel
osteoblast suppressor in patients with multiple myeloma bone disease.
Blood, 2011. 118(26): p. 6871-80.
84. Vallet, S., et al., Activin A promotes multiple myeloma-induced osteolysis
and is a promising target for myeloma bone disease. Proc Natl Acad Sci U S
A, 2010. 107(11): p. 5124-9.
85. Vallet, S., et al., A novel role for CCL3 (MIP-1alpha) in myeloma-induced
bone disease via osteocalcin downregulation and inhibition of osteoblast
function. Leukemia, 2011. 25(7): p. 1174-81.
86. Karadag, A., et al., Human myeloma cells promote the production of
interleukin 6 by primary human osteoblasts. Br J Haematol, 2000. 108(2):
p. 383-90.
87. Fu, J., et al., Myeloma cells inhibit osteogenic differentiation of mesenchymal
stem cells and kill osteoblasts via TRAIL-induced apoptosis. Arch Med Sci,
2010. 6(4): p. 496-504.
88. Abdi, J., G. Chen, and H. Chang, Drug resistance in multiple myeloma: latest
findings and new concepts on molecular mechanisms. Oncotarget, 2013.
4(12): p. 2186-207.
89. Voorhees, P.M., et al., Inhibition of interleukin-6 signaling with CNTO 328
enhances the activity of bortezomib in preclinical models of multiple
myeloma. Clin Cancer Res, 2007. 13(21): p. 6469-78.
90. Markovina, S., et al., Bone marrow stromal cells from multiple myeloma
patients uniquely induce bortezomib resistant NF-kappaB activity in
myeloma cells. Mol Cancer, 2010. 9: p. 176.
91. Noborio-Hatano, K., et al., Bortezomib overcomes cell-adhesion-mediated
drug resistance through downregulation of VLA-4 expression in multiple
myeloma. Oncogene, 2009. 28(2): p. 231-42.
92. McMillin, D.W., et al., Compartment-Specific Bioluminescence Imaging
platform for the high-throughput evaluation of antitumor immune function.
Blood, 2012. 119(15): p. e131-8.
93. McMillin, D.W., et al., Tumor cell-specific bioluminescence platform to
identify stroma-induced changes to anticancer drug activity. Nat Med,
2010. 16(4): p. 483-9.
94. Dowling, P., et al., Recent advances in clinical proteomics using mass
spectrometry. Bioanalysis, 2010. 2(9): p. 1609-15.
95. Dowling, P., et al., Proteomic analysis of conditioned media from glucose
responsive and glucose non-responsive phenotypes reveals a panel of
269
secreted proteins associated with beta cell dysfunction. Electrophoresis,
2008. 29(20): p. 4141-9.
96. Holland, A., et al., Proteomic profiling of cardiomyopathic tissue from the
aged mdx model of Duchenne muscular dystrophy reveals a drastic decrease
in laminin, nidogen and annexin. Proteomics, 2013. 13(15): p. 2312-23.
97. Holland, A., et al., Intricate effects of primary motor neuronopathy on
contractile proteins and metabolic muscle enzymes as revealed by label-free
mass spectrometry. Biosci Rep, 2014. 34(4).
98. O'Sullivan, D., et al., 7B7: a novel antibody directed against the Ku70/Ku80
heterodimer blocks invasion in pancreatic and lung cancer cells. Tumour
Biol, 2014. 35(7): p. 6983-97.
99. Buzzeo, R., et al., Characterization of a R115777-resistant human multiple
myeloma cell line with cross-resistance to PS-341. Clin Cancer Res, 2005.
11(16): p. 6057-64.
100. Lu, S., et al., Different mutants of PSMB5 confer varying bortezomib
resistance in T lymphoblastic lymphoma/leukemia cells derived from the
Jurkat cell line. Exp Hematol, 2009. 37(7): p. 831-7.
101. Stessman, H.A., et al., Profiling bortezomib resistance identifies secondary
therapies in a mouse myeloma model. Mol Cancer Ther, 2013. 12(6): p.
1140-50.
102. Balsas, P., et al., Bortezomib resistance in a myeloma cell line is associated
to PSMbeta5 overexpression and polyploidy. Leuk Res, 2012. 36(2): p. 212-
8.
103. Politou, M., et al., No evidence of mutations of the PSMB5 (beta-5 subunit of
proteasome) in a case of myeloma with clinical resistance to Bortezomib.
Leuk Res, 2006. 30(2): p. 240-1.
104. O'Connor, R., et al., The interaction of bortezomib with multidrug
transporters: implications for therapeutic applications in advanced multiple
myeloma and other neoplasias. Cancer Chemother Pharmacol, 2013.
71(5): p. 1357-68.
105. Leich, E., et al., Multiple myeloma is affected by multiple and heterogeneous
somatic mutations in adhesion- and receptor tyrosine kinase signaling
molecules. Blood Cancer J, 2013. 3: p. e102.
106. Lopez-Corral, L., et al., Heterogeneity of genomic evolution and mutational
profiles in multiple myeloma. Leukemia, 2014. 5: p. 2997.
107. Melchor, L., et al., Single-cell genetic analysis reveals the composition of
initiating clones and phylogenetic patterns of branching and parallel
evolution in myeloma. Leukemia, 2014.
108. Walker, B.A., et al., Intraclonal heterogeneity is a critical early event in the
development of myeloma and precedes the development of clinical
symptoms. 2014. 28(2): p. 384-90.
109. Lohr, J.G., et al., Widespread genetic heterogeneity in multiple myeloma:
implications for targeted therapy. Cancer Cell, 2014. 25(1): p. 91-101.
110. Sim, N.L., et al., SIFT web server: predicting effects of amino acid
substitutions on proteins. Nucleic Acids Res, 2012. 40(Web Server issue):
p. W452-7.
111. Adzhubei, I.A., et al., A method and server for predicting damaging missense
mutations. Nat Methods, 2010. 7(4): p. 248-9.
270
112. Kaminski, W.E., et al., Identification of a novel human sterol-sensitive ATP-
binding cassette transporter (ABCA7). Biochem Biophys Res Commun,
2000. 273(2): p. 532-8.
113. Meurs, I., et al., Effects of deletion of macrophage ABCA7 on lipid
metabolism and the development of atherosclerosis in the presence and
absence of ABCA1. PLoS One, 2012. 7(3): p. e30984.
114. Hlavata, I., et al., The role of ABC transporters in progression and clinical
outcome of colorectal cancer. Mutagenesis, 2012. 27(2): p. 187-96.
115. Agnelli, L., P. Tassone, and A. Neri, Molecular profiling of multiple
myeloma: from gene expression analysis to next-generation sequencing.
Expert Opin Biol Ther, 2013.
116. Terragna, C., et al., Correlation between eight-gene expression profiling and
response to therapy of newly diagnosed multiple myeloma patients treated
with thalidomide-dexamethasone incorporated into double autologous
transplantation. Ann Hematol, 2013.
117. Rajpal, R., et al., A novel panel of protein biomarkers for predicting response
to thalidomide-based therapy in newly diagnosed multiple myeloma
patients. Proteomics, 2011. 11(8): p. 1391-402.
118. Pulvino, M., et al., Inhibition of proliferation and survival of diffuse large B-
cell lymphoma cells by a small-molecule inhibitor of the ubiquitin-
conjugating enzyme Ubc13-Uev1A. Blood, 2012. 120(8): p. 1668-77.
119. Berleth, E.S., et al., Expression, tissue distribution, and cellular localization
of the antiapoptotic TIP-B1 protein. J Leukoc Biol, 2001. 69(6): p. 995-
1005.
120. Tsubaki, M., et al., Macrophage inflammatory protein-1alpha induces
osteoclast formation by activation of the MEK/ERK/c-Fos pathway and
inhibition of the p38MAPK/IRF-3/IFN-beta pathway. J Cell Biochem, 2010.
111(6): p. 1661-72.
121. Dairaghi, D.J., et al., CCR1 blockade reduces tumor burden and osteolysis in
vivo in a mouse model of myeloma bone disease. Blood, 2012. 120(7): p.
1449-57.
122. Dimopoulos, M.A., et al., Tanespimycin as antitumor therapy. Clin
Lymphoma Myeloma Leuk, 2011. 11(1): p. 17-22.
123. Khong, T. and A. Spencer, Targeting HSP 90 induces apoptosis and inhibits
critical survival and proliferation pathways in multiple myeloma. Mol
Cancer Ther, 2011. 10(10): p. 1909-17.
124. Reddy, N., et al., Phase I Trial of the HSP90 Inhibitor PF-04929113
(SNX5422) in Adult Patients With Recurrent, Refractory Hematologic
Malignancies. Clin Lymphoma Myeloma Leuk, 2013. 13(4): p. 385-91.
125. Richardson, P.G., et al., Tanespimycin monotherapy in relapsed multiple
myeloma: results of a phase 1 dose-escalation study. Br J Haematol, 2010.
150(4): p. 438-45.
126. Harries, L.W., et al., Identification of genetic polymorphisms at the
glutathione S-transferase Pi locus and association with susceptibility to
bladder, testicular and prostate cancer. Carcinogenesis, 1997. 18(4): p.
641-4.
127. Wang, T., et al., Glutathione S-transferase P1-1 (GSTP1-1) inhibits c-Jun N-
terminal kinase (JNK1) signaling through interaction with the C terminus. J
Biol Chem, 2001. 276(24): p. 20999-1003.
271
128. Advani, A.S., et al., A Phase II trial of gemcitabine and mitoxantrone for
patients with acute myeloid leukemia in first relapse. Clin Lymphoma
Myeloma Leuk, 2010. 10(6): p. 473-6.
129. Stella, F., et al., Glutathione S-transferase P1 mRNA expression in plasma
cell disorders and its correlation with polymorphic variants and clinical
outcome. Cancer Epidemiol, 2013. 37(5): p. 671-4.
130. Taylor, C.A., et al., Modulation of eIF5A expression using SNS01
nanoparticles inhibits NF-kappaB activity and tumor growth in murine
models of multiple myeloma. Mol Ther, 2012. 20(7): p. 1305-14.
131. Artero-Castro, A., et al., Expression of the ribosomal proteins Rplp0, Rplp1,
and Rplp2 in gynecologic tumors. Hum Pathol, 2011. 42(2): p. 194-203.
132. Artero-Castro, A., et al., Rplp1 bypasses replicative senescence and
contributes to transformation. Exp Cell Res, 2009. 315(8): p. 1372-83.
133. Mitsiades, C.S., et al., Multiple myeloma: a prototypic disease model for the
characterization and therapeutic targeting of interactions between tumor
cells and their local microenvironment. J Cell Biochem, 2007. 101(4): p.
950-68.
134. Hideshima, T., et al., Proteasome inhibitor PS-341 abrogates IL-6 triggered
signaling cascades via caspase-dependent downregulation of gp130 in
multiple myeloma. Oncogene, 2003. 22(52): p. 8386-93.
135. Bjorklund, C.C., et al., Evidence of a role for CD44 and cell adhesion in
mediating resistance to lenalidomide in multiple myeloma: therapeutic
implications. Leukemia, 2014. 28(2): p. 373-83.
136. Mithraprabhu, S., T. Khong, and A. Spencer, Overcoming inherent
resistance to histone deacetylase inhibitors in multiple myeloma cells by
targeting pathways integral to the actin cytoskeleton. Cell Death Dis, 2014.
5: p. e1134.
137. Zhu, Y.X., et al., Identification of cereblon-binding proteins and relationship
with response and survival after IMiDs in multiple myeloma. Blood, 2014.
124(4): p. 536-45.
138. Ao, L., et al., Development of peptide-based reversing agents for p-
glycoprotein-mediated resistance to carfilzomib. Mol Pharm, 2012. 9(8): p.
2197-205.
139. Kovacic, N., P.I. Croucher, and M.M. McDonald, Signaling between tumor
cells and the host bone marrow microenvironment. Calcif Tissue Int, 2014.
94(1): p. 125-39.
140. Olsen, O.E., et al., Bone morphogenetic protein-9 suppresses growth of
myeloma cells by signaling through ALK2 but is inhibited by endoglin. Blood
Cancer J, 2014. 4: p. e196.
141. Romano, A., C. Conticello, and M. Cavalli, Immunological Dysregulation in
Multiple Myeloma Microenvironment. 2014. 2014: p. 198539.
142. Vacca, A., et al., Angiogenesis in multiple myeloma. Chem Immunol Allergy,
2014. 99: p. 180-96.
143. Yuan, L., et al., RANKL expression in myeloma cells is regulated by a
network involving RANKL promoter methylation, DNMT1, microRNA and
TNFalpha in the microenvironment. Biochim Biophys Acta, 2014. 1843(9):
p. 1834-8.
272
144. Zhang, X., et al., Up-regulation of connexin-43 expression in bone marrow
mesenchymal stem cells plays a crucial role in adhesion and migration of
multiple myeloma cells. Leuk Lymphoma, 2014: p. 1-8.
145. Zi, F.M., et al., Fibroblast activation protein protects bortezomib-induced
apoptosis in multiple myeloma cells through beta-catenin signaling
pathway. Cancer Biol Ther, 2014. 15(10).
146. Schuler, J., et al., Preclinical models of multiple myeloma: a critical
appraisal. Expert Opin Biol Ther, 2013. 13 Suppl 1: p. S111-23.
147. Sharma, S.V., D.A. Haber, and J. Settleman, Cell line-based platforms to
evaluate the therapeutic efficacy of candidate anticancer agents. Nat Rev
Cancer, 2010. 10(4): p. 241-53.
148. Witt, O., et al., HDAC family: What are the cancer relevant targets? Cancer
Lett, 2009. 277(1): p. 8-21.
149. Jibodh, R.A., et al., Taxanes: old drugs, new oral formulations. Eur J
Pharmacol, 2013. 717(1-3): p. 40-6.
150. Horwitz, S.B., Taxol (paclitaxel): mechanisms of action. Ann Oncol, 1994. 5
Suppl 6: p. S3-6.
151. Abidi, A., Cabazitaxel: A novel taxane for metastatic castration-resistant
prostate cancer-current implications and future prospects. J Pharmacol
Pharmacother, 2013. 4(4): p. 230-7.
152. Mukai, H., et al., Phase I dose-escalation and pharmacokinetic study (TED
11576) of cabazitaxel in Japanese patients with castration-resistant
prostate cancer. Cancer Chemother Pharmacol, 2014. 73(4): p. 703-10.
153. Gazitt, Y., P. Shaughnessy, and M.L. Rothenberg, A phase II trial with
gemcitabine and paclitaxel for the treatment of refractory and relapsed
multiple myeloma patients. Oncol Rep, 2006. 16(4): p. 877-84.
154. Pommier, Y., et al., Mechanism of action of eukaryotic DNA topoisomerase I
and drugs targeted to the enzyme. Biochim Biophys Acta, 1998. 1400(1-
3): p. 83-105.
155. Burden, D.A. and N. Osheroff, Mechanism of action of eukaryotic
topoisomerase II and drugs targeted to the enzyme. Biochim Biophys Acta,
1998. 1400(1-3): p. 139-54.
156. Fox, E.J., Mechanism of action of mitoxantrone. Neurology, 2004. 63(12
Suppl 6): p. S15-8.
157. Hajek, R., et al., Design and rationale of FOCUS (PX-171-011): a randomized,
open-label, phase 3 study of carfilzomib versus best supportive care regimen
in patients with relapsed and refractory multiple myeloma (R/R MM). BMC
Cancer, 2012. 12: p. 415.
158. Jakubowiak, A.J., et al., A phase 1/2 study of carfilzomib in combination
with lenalidomide and low-dose dexamethasone as a frontline treatment for
multiple myeloma. Blood, 2012. 120(9): p. 1801-9.
159. O'Connor, O.A., et al., A phase 1 dose escalation study of the safety and
pharmacokinetics of the novel proteasome inhibitor carfilzomib (PR-171) in
patients with hematologic malignancies. Clin Cancer Res, 2009. 15(22): p.
7085-91.
160. Vij, R., et al., An open-label, single-arm, phase 2 (PX-171-004) study of
single-agent carfilzomib in bortezomib-naive patients with relapsed and/or
refractory multiple myeloma. Blood, 2012. 119(24): p. 5661-70.
273
161. Ombrello, M.J., K.A. Sikora, and D.L. Kastner, Genetics, genomics, and their
relevance to pathology and therapy. Best Pract Res Clin Rheumatol, 2014.
28(2): p. 175-189.
162. Armstrong, T., et al., Type I collagen promotes the malignant phenotype of
pancreatic ductal adenocarcinoma. Clin Cancer Res, 2004. 10(21): p.
7427-37.
163. Hall, C.L., et al., Type I collagen receptor (alpha2beta1) signaling promotes
prostate cancer invasion through RhoC GTPase. Neoplasia, 2008. 10(8): p.
797-803.
164. Hambrock, H.O., et al., SC1/hevin. An extracellular calcium-modulated
protein that binds collagen I. J Biol Chem, 2003. 278(13): p. 11351-8.
165. Yu, S.J., et al., SPARCL1, Shp2, MSH2, E-cadherin, p53, ADCY-2 and MAPK are
prognosis-related in colorectal cancer. World J Gastroenterol, 2011.
17(15): p. 2028-36.
166. Zhang, H., et al., SPARCL1: a potential molecule associated with tumor
diagnosis, progression and prognosis of colorectal cancer. Tumour Biol,
2011. 32(6): p. 1225-31.
167. Claeskens, A., et al., Hevin is down-regulated in many cancers and is a
negative regulator of cell growth and proliferation. Br J Cancer, 2000.
82(6): p. 1123-30.
168. Turtoi, A., et al., Sparc-like protein 1 is a new marker of human glioma
progression. J Proteome Res, 2012. 11(10): p. 5011-21.
169. Cao, F., et al., Clinicopathological significance of reduced SPARCL1
expression in human breast cancer. Asian Pac J Cancer Prev, 2013. 14(1):
p. 195-200.
170. Xiang, Y., et al., SPARCL1 suppresses metastasis in prostate cancer. Mol
Oncol, 2013. 7(6): p. 1019-30.
171. Fang, Z.Q., et al., Gene expression profile and enrichment pathways in
different stages of bladder cancer. Genet Mol Res, 2013. 12(2): p. 1479-89.
172. Khalifeh-Soltani, A., et al., Mfge8 promotes obesity by mediating the uptake
of dietary fats and serum fatty acids. Nat Med, 2014. 20(2): p. 175-83.
173. Tibaldi, L., et al., New blocking antibodies impede adhesion, migration and
survival of ovarian cancer cells, highlighting MFGE8 as a potential
therapeutic target of human ovarian carcinoma. PLoS One, 2013. 8(8): p.
e72708.
174. Abe, T., et al., Regulation of Osteoclast Homeostasis and Inflammatory Bone
Loss by MFG-E8. J Immunol, 2014. 193(3): p. 1383-91.
175. Tashiro, K., et al., GAREM, a novel adaptor protein for growth factor
receptor-bound protein 2, contributes to cellular transformation through
the activation of extracellular signal-regulated kinase signaling. J Biol
Chem, 2009. 284(30): p. 20206-14.
176. Girardot, M., et al., Persistent STAT5 activation in myeloid neoplasms
recruits p53 into gene regulation. Oncogene, 2014. 0.
177. Hideshima, T., et al., The proteasome inhibitor PS-341 inhibits growth,
induces apoptosis, and overcomes drug resistance in human multiple
myeloma cells. Cancer Res, 2001. 61(7): p. 3071-6.
178. Tao, R.H., et al., PMLRARalpha binds to Fas and suppresses Fas-mediated
apoptosis through recruiting c-FLIP in vivo. Blood, 2011. 118(11): p. 3107-
18.
274
179. Irmler, M., et al., Inhibition of death receptor signals by cellular FLIP.
Nature, 1997. 388(6638): p. 190-5.
180. Micheau, O., et al., The long form of FLIP is an activator of caspase-8 at the
Fas death-inducing signaling complex. J Biol Chem, 2002. 277(47): p.
45162-71.
181. Stein, R., et al., CD74: a new candidate target for the immunotherapy of B-
cell neoplasms. Clin Cancer Res, 2007. 13(18 Pt 2): p. 5556s-5563s.
182. Kaufman, J.L., et al., Phase I, multicentre, dose-escalation trial of
monotherapy with milatuzumab (humanized anti-CD74 monoclonal
antibody) in relapsed or refractory multiple myeloma. Br J Haematol, 2013.
163(4): p. 478-86.
183. Hofmann, C., et al., PI3K-dependent multiple myeloma cell survival is
mediated by the PIK3CA isoform. Br J Haematol, 2014. 166(4): p. 529-39.
184. Lopez-Corral, L., et al., Transcriptome analysis reveals molecular profiles
associated with evolving steps of monoclonal gammopathies.
Haematologica, 2014. 99(8): p. 1365-72.
185. Bodet, L., et al., ABT-737 is highly effective against molecular subgroups of
multiple myeloma. Blood, 2011. 118(14): p. 3901-10.
186. Lin, J., et al., Induction of apoptosis and antitumor effects of a small
molecule inhibitor of Bcl-2 and Bcl-xl, gossypol acetate, in multiple myeloma
in vitro and in vivo. Oncol Rep, 2013. 30(2): p. 731-8.
187. He, Y., et al., Potentially functional polymorphisms in aminoacyl-tRNA
synthetases genes are associated with breast cancer risk in a Chinese
population. Mol Carcinog, 2014.
188. Simpson, D. and G.M. Keating, Sorafenib: in hepatocellular carcinoma.
Drugs, 2008. 68(2): p. 251-8.
189. Escudier, B., et al., Sorafenib in advanced clear-cell renal-cell carcinoma. N
Engl J Med, 2007. 356(2): p. 125-34.
190. Schuler, A., et al., The MADS transcription factor Mef2c is a pivotal
modulator of myeloid cell fate. Blood, 2008. 111(9): p. 4532-41.
191. Wang, X., et al., ERK5 pathway regulates transcription factors important for
monocytic differentiation of human myeloid leukemia cells. J Cell Physiol,
2014. 229(7): p. 856-67.
192. Chen, Z., et al., Osteoblastic niche supports the growth of quiescent multiple
myeloma cells. Blood, 2014. 123(14): p. 2204-8.
193. Bolomsky, A., et al., Immunomodulatory drugs thalidomide and
lenalidomide affect osteoblast differentiation of human bone marrow
stromal cells in vitro. Exp Hematol, 2014. 42(7): p. 516-25.
194. Kaiser, M.F., et al., The proteasome inhibitor bortezomib stimulates
osteoblastic differentiation of human osteoblast precursors via
upregulation of vitamin D receptor signalling. Eur J Haematol, 2013. 90(4):
p. 263-72.
195. Niewerth, D., et al., Interferon-gamma-induced upregulation of
immunoproteasome subunit assembly overcomes bortezomib resistance in
human hematological cell lines. J Hematol Oncol, 2014. 7(1): p. 7.