
Intrinsic and extrinsic effects on image memorabilityweb.mit.edu/zoya/www/docs/figrimProof.pdf ·...
14
Intrinsic and extrinsic effects on image memorability Zoya Bylinskii a,b,⇑ , Phillip Isola b,c , Constance Bainbridge b , Antonio Torralba a,b , Aude Oliva b a Department of Electrical Engineering and Computer Science, MIT, Cambridge 02141, USA b Computer Science and Artificial Intelligence Laboratory, MIT, Cambridge 02141, USA c Department of Brain and Cognitive Sciences, MIT, Cambridge 02141, USA article info Article history: Received 4 August 2014 Received in revised form 3 March 2015 Available online xxxx Keywords: Image memorability Eye movements Scene dataset Fine-grained categories Visual distinctiveness Context abstract Previous studies have identified that images carry the attribute of memorability, a predictive value of whether a novel image will be later remembered or forgotten. Here we investigate the interplay between intrinsic and extrinsic factors that affect image memorability. First, we find that intrinsic differences in memorability exist at a finer-grained scale than previously documented. Second, we test two extrinsic factors: image context and observer behavior. Building on prior findings that images that are distinct with respect to their context are better remembered, we propose an information-theoretic model of image distinctiveness. Our model can automatically predict how changes in context change the mem- orability of natural images. In addition to context, we study a second extrinsic factor: where an observer looks while memorizing an image. It turns out that eye movements provide additional information that can predict whether or not an image will be remembered, on a trial-by-trial basis. Together, by con- sidering both intrinsic and extrinsic effects on memorability, we arrive at a more complete and fine- grained model of image memorability than previously available. Ó 2015 Elsevier Ltd. All rights reserved. 1. Introduction Recent work on image memorability has shown that indepen- dent of observer, certain images are consistently remembered and others forgotten (Bainbridge, Isola, & Oliva, 2013; Borkin et al., 2013; Isola, Parikh, et al., 2011; Isola, Xiao, et al., 2011; Isola et al., 2014), indicating that memorability is an intrinsic property of images that can be estimated with computer vision features (Isola, Parikh, et al., 2011; Isola, Xiao, et al., 2011; Isola et al., 2014; Khosla, Xiao, Torralba, et al., 2012, Khosla et al., 2013). These previous image memorability studies raise a number of questions, including: does the consistency of human memory generalize? How might extrinsic effects such as context and observer differences affect image memorability? In this paper, we report that: (1) human consistency at remem- bering and forgetting images holds at a within-category level, and (2) extrinsic effects predictably affect whether an image will be later remembered or forgotten. Here we consider the effects of the context in which images are seen, as well as the observer’s eye movement patterns on a trial-by-trial basis. Previous work on image memorability has not computationally addressed either image context or trial-by-trial observer behavior. Moreover, although many decades of prior research on memory have considered context and the effects of item/image distinctive- ness of memorability (Hunt & Worthen, 2006; Konkle et al., 2010; Nairne, 2006; Standing, 1973), these effects have not been rigor- ously quantified on large datasets of natural scenes. Prior work has relied on subjective human judgments of distinctiveness (Bainbridge et al., 2013; Konkle et al., 2010). In contrast, we provide an objective, automatic measure: we model distinctive- ness as an information-theoretic property computable from raw visual data. For our studies, we collected the FIne-GRained Image Memorability (FIGRIM) dataset 1 composed of over 9K images, which we used to test human memory performance on 21 different scene categories, each containing hundreds of images. We used this data- set to collect memorability scores for 1754 target images, whereby we systematically varied the image context. In this paper we refer to the set of images from which the experimental sequence is sam- pled as image context. We present an information-theoretic frame- work to quantify context differences and image distinctiveness using state-of-the-art computer vision features, and we show correlations http://dx.doi.org/10.1016/j.visres.2015.03.005 0042-6989/Ó 2015 Elsevier Ltd. All rights reserved. ⇑ Corresponding author at: 32-D542, 32 Vassar St., Cambridge, MA 02141, USA. E-mail address: [email protected] (Z. Bylinskii). 1 We are publicly releasing the full FIGRIM dataset with popular image features precomputed for all 9K images of the dataset, as well as memorability scores for each of the 1754 target images. For the target images, we provide separate memorability scores for the image presented in the context of its own scene category and different scene categories. Available at: <http://figrim.mit.edu/>. Vision Research xxx (2015) xxx–xxx Contents lists available at ScienceDirect Vision Research journal homepage: www.elsevier.com/locate/visres Please cite this article in press as: Bylinskii, Z., et al. Intrinsic and extrinsic effects on image memorability. Vision Research (2015), http://dx.doi.org/10.1016/ j.visres.2015.03.005
Transcript of Intrinsic and extrinsic effects on image memorabilityweb.mit.edu/zoya/www/docs/figrimProof.pdf ·...
Vision Research xxx (2015) xxx–xxx
Contents lists available at ScienceDirect
Vision Research
journal homepage: www.elsevier .com/locate /v isres
Intrinsic and extrinsic effects on image memorability
http://dx.doi.org/10.1016/j.visres.2015.03.0050042-6989/� 2015 Elsevier Ltd. All rights reserved.
⇑ Corresponding author at: 32-D542, 32 Vassar St., Cambridge, MA 02141, USA.E-mail address: [email protected] (Z. Bylinskii).
1 We are publicly releasing the full FIGRIM dataset with popular imageprecomputed for all 9K images of the dataset, as well as memorability scoresof the 1754 target images. For the target images, we provide separate memscores for the image presented in the context of its own scene category andscene categories. Available at: <http://figrim.mit.edu/>.
Please cite this article in press as: Bylinskii, Z., et al. Intrinsic and extrinsic effects on image memorability. Vision Research (2015), http://dx.doi.org/1j.visres.2015.03.005
Zoya Bylinskii a,b,⇑, Phillip Isola b,c, Constance Bainbridge b, Antonio Torralba a,b, Aude Oliva b
a Department of Electrical Engineering and Computer Science, MIT, Cambridge 02141, USAb Computer Science and Artificial Intelligence Laboratory, MIT, Cambridge 02141, USAc Department of Brain and Cognitive Sciences, MIT, Cambridge 02141, USA
a r t i c l e i n f o a b s t r a c t
Article history:Received 4 August 2014Received in revised form 3 March 2015Available online xxxx
Keywords:Image memorabilityEye movementsScene datasetFine-grained categoriesVisual distinctivenessContext
Previous studies have identified that images carry the attribute of memorability, a predictive value ofwhether a novel image will be later remembered or forgotten. Here we investigate the interplay betweenintrinsic and extrinsic factors that affect image memorability. First, we find that intrinsic differences inmemorability exist at a finer-grained scale than previously documented. Second, we test two extrinsicfactors: image context and observer behavior. Building on prior findings that images that are distinctwith respect to their context are better remembered, we propose an information-theoretic model ofimage distinctiveness. Our model can automatically predict how changes in context change the mem-orability of natural images. In addition to context, we study a second extrinsic factor: where an observerlooks while memorizing an image. It turns out that eye movements provide additional information thatcan predict whether or not an image will be remembered, on a trial-by-trial basis. Together, by con-sidering both intrinsic and extrinsic effects on memorability, we arrive at a more complete and fine-grained model of image memorability than previously available.
� 2015 Elsevier Ltd. All rights reserved.
1. Introduction
Recent work on image memorability has shown that indepen-dent of observer, certain images are consistently rememberedand others forgotten (Bainbridge, Isola, & Oliva, 2013; Borkinet al., 2013; Isola, Parikh, et al., 2011; Isola, Xiao, et al., 2011;Isola et al., 2014), indicating that memorability is an intrinsicproperty of images that can be estimated with computer visionfeatures (Isola, Parikh, et al., 2011; Isola, Xiao, et al., 2011;Isola et al., 2014; Khosla, Xiao, Torralba, et al., 2012, Khosla et al.,2013). These previous image memorability studies raise a numberof questions, including: does the consistency of human memorygeneralize? How might extrinsic effects such as context andobserver differences affect image memorability?
In this paper, we report that: (1) human consistency at remem-bering and forgetting images holds at a within-category level, and(2) extrinsic effects predictably affect whether an image will belater remembered or forgotten. Here we consider the effects ofthe context in which images are seen, as well as the observer’seye movement patterns on a trial-by-trial basis.
Previous work on image memorability has not computationallyaddressed either image context or trial-by-trial observer behavior.
Moreover, although many decades of prior research on memoryhave considered context and the effects of item/image distinctive-ness of memorability (Hunt & Worthen, 2006; Konkle et al., 2010;Nairne, 2006; Standing, 1973), these effects have not been rigor-ously quantified on large datasets of natural scenes. Prior workhas relied on subjective human judgments of distinctiveness(Bainbridge et al., 2013; Konkle et al., 2010). In contrast, weprovide an objective, automatic measure: we model distinctive-ness as an information-theoretic property computable from rawvisual data.
For our studies, we collected the FIne-GRained ImageMemorability (FIGRIM) dataset1 composed of over 9K images, whichwe used to test human memory performance on 21 different scenecategories, each containing hundreds of images. We used this data-set to collect memorability scores for 1754 target images, wherebywe systematically varied the image context. In this paper we referto the set of images from which the experimental sequence is sam-pled as image context. We present an information-theoretic frame-work to quantify context differences and image distinctiveness usingstate-of-the-art computer vision features, and we show correlations
featuresfor eachorabilitydifferent
0.1016/

2 Z. Bylinskii et al. / Vision Research xxx (2015) xxx–xxx
with image memorability scores. We discuss which images are mostaffected by context to gain a better understanding of the interplaybetween intrinsic and extrinsic factors on image memorability.
To account for additional extrinsic effects caused by thevariation in observer behavior from trial to trial, we collectedeyetracking data for over 2.7 K of the FIGRIM images. For 630target images and using eye movements alone we can predict, ona trial-to-trial basis, which images will be remembered and whichforgotten with 66% accuracy. Thus, we demonstrate how eyemovements have predictive power on a trial-by-trial basis forimage memorability.
2. Background
2.1. Image memorability
Recent work in image memorability (Bainbridge et al., 2013;Borkin et al., 2013; Isola, Parikh, et al., 2011; Isola, Xiao, et al.,2011; Isola et al., 2014) has reported high consistency rates amongparticipants in terms of which images are remembered and whichforgotten, indicating that memorability is a property that is intrin-sic to the image, despite individual differences between observers.The high consistency was first demonstrated for a database ofimages from hundreds of scene categories (Isola, Xiao, et al.,2011), and later extended to narrower classes of images – faces(Bainbridge et al., 2013) and visualizations (Borkin et al., 2013).In this paper, we show that this consistency is not a special prop-erty of the stimuli considered, and that it can not be explainedaway by a simple distinction between images (e.g. indoor scenestend to be memorable, outdoor scenes forgettable). We demon-strate that the high consistencies hold within 21 different indoorand outdoor scene categories, each consisting of hundreds ofinstances. This is the first image memorability study to considerfine-grained scene categories. Previous studies have shown thatimage memorability can be computationally predicted from imagefeatures (Isola, Xiao, et al., 2011) which opens up applications suchas automatically generating memorability maps for images(Khosla, Xiao, Torralba, et al., 2012), modifying image memorabil-ity (Khosla et al., 2013; Khosla, Xiao, Isola, 2012), and designingbetter data visualizations (Borkin et al., 2013). In this paper, weadditionally model extrinsic effects on memorability, which havenot yet been explored in the image memorability literature, andcan open up new application areas.
2.2. Distinctiveness in visual long-term memory
Previous studies have suggested that items that stand out from(and thus do not compete with) their context are better remem-bered (Attneave, 1959; Eysenck, 1979; Hunt & Worthen, 2006;Konkle et al., 2010; Rawsona & Overscheldeb, 2008; Schmidt,1985; Standing, 1973; Wiseman & Neisser, 1974; Vogt &Magnussen, 2007; von Restorff, 1933). For instance, Standingobserved a large long-term memory capacity for images that depictoddities (Standing, 1973). Konkle et al. demonstrated that objectcategories with conceptually distinctive exemplars showed lessinterference in memory as the number of exemplars increased(Konkle et al., 2010). Additionally, for the specific categories of faceimages, studies have reported that a distinctive or atypical face(i.e., a face distant from the average) is more likely to be remem-bered (Bartlett, Hurry, & Thorley, 1984; Bruce, Burton, & Dench,1994; Valentine, 1991). In the domain of data visualizations,Borkin et al. noticed that unique visualization types had signifi-cantly higher memorability scores than common graphs and thatnovel and unexpected visualizations were better remembered(Borkin et al., 2013). In this paper, we quantify the intuitions thatdistinctive images are more memorable using an information
Please cite this article in press as: Bylinskii, Z., et al. Intrinsic and extrinsic effectj.visres.2015.03.005
theoretic framework, and we compute the distinctiveness ofimages with reference to their image context (the set of imagesfrom which the experimental sequence is sampled). We steer awayfrom subjective human ratings, and instead compute statistics overautomatically-extracted image features. By systematically varyingthe image context across experiments, we are able to computation-ally model the change in context at the feature level, and predictcorresponding changes in image memorability.
2.3. Memorability and visual attention
Little work has considered the intersection between imagememorability and visual attention (Bulling & Roggen, 2011;Foulsham & Underwood, 2008; Mancas & Le Meur, 2013; Noton& Stark, 1971). Mancas and Le Meur (2013) used saliency featuresto show a slight improvement over the automatic imagememorability predictions in Isola, Xiao, et al. (2011). We refer toimage memorability as a population predictor because it ignorestrial-by-trial variability, effectively averaging over a population ofparticipants or experiments. Thus, Mancas et al. used saliency toimprove a population predictor. We, instead, use eye-movementsto improve the trial-by-trial predictions of memory for specificindividuals (an individual trial predictor). Bulling and Roggen(2011) used eye movement features to predict image familiarity,classifying whether images have been seen before or not. Theyassumed that all images seen again are remembered, particularlydue to the long exposure times (10 s) used per image, and by test-ing on a small dataset of 20 faces. They also used eye movementanalysis as a population predictor to decide whether an imagewas previously seen, while we use eye movement analysis as anindividual trial predictor, taking into account individual differencesin making predictions of whether an image will be laterremembered.
2.4. Decoding task using eye movements
Our work is also related to recent studies on the use of eyemovements for decoding an observer’s task (Borji & Itti, 2014;Greene, Liu, & Wolfe, 2012). These studies considered featuresextracted from the eye movements of individual participants todetermine the task they are performing (e.g., what question theyare answering about an image), modeled on the original Yarbusexperiment (Yarbus, 1967). These studies utilized a very smallset of images (ranging from 15 to 64) with a very constrainedtheme (grayscale photographs taken between 1930 and 1979 withat least two people (Greene et al., 2012); paintings depicting ‘‘anunexpected visitor’’ (Borji & Itti, 2014)). In our study, we measuredthe eye movements of participants on 630 target images sampledfrom 21 different indoor and outdoor scene categories. Weextracted features from eye movements to determine whether ornot an image is correctly encoded (measured by whether it iscorrectly recognized on a successive exposure). We were able tosolve our decoding task using only 2 s of viewing time per image,whereas the previous studies worked with durations of 10 s(Bulling & Roggen, 2011; Greene et al., 2012), 30 s (Borji & Itti,2014), 50 s (Tatler et al., 2010), and 60 s (Borji & Itti, 2014). For thispurpose, we learned image-specific classifiers to distinguishfixations on one image versus fixations on other images.
3. Memorability experiments
3.1. FIGRIM dataset
We created a novel dataset by sampling high-resolution (atleast 700� 700 px) images from 21 different indoor and outdoor
s on image memorability. Vision Research (2015), http://dx.doi.org/10.1016/

1.0 s
... ...
1.4 stime
false alarmcorrect rejection hitrepeat
+ +
Fig. 1. An example AMT experimental sequence. During image presentation, the participant presses a key if the image has already appeared in the sequence, and receivesfeedback at the end of the image presentation. A false alarm occurs when on first presentation, the participant indicates that the image has repeated. No key press during firstpresentation is a correct rejection. A hit occurs when a repeated image is correctly remembered, and otherwise, the response is recorded as a miss.
Z. Bylinskii et al. / Vision Research xxx (2015) xxx–xxx 3
scene categories2 from the SUN Database (Xiao et al., 2010). Imageduplicates and near-duplicates were manually removed.3 Theimages were downsampled and cropped to 700� 700 px.4 Fromeach scene category, 25% of the images were randomly chosen tobe targets and the rest of the images became fillers (Table 1 in theappendix lists the number of targets and fillers per scene category).The targets are the images for which we obtained memorabilityscores.
3.2. AMT 1: within-category experiment
We ran Amazon Mechanical Turk (AMT) studies following theprotocol of Isola, Xiao, et al. (2011) to collect memorability scores(i.e. performance on a recognition memory task) for each of thescene categories, separately. We set up memory games on AMT5
where sequences of 120 images (a mix of target and filler imagessampled from a single scene category) were presented for 1 s each,with a distance of 91–109 images between an image and its repeat,and consecutive images separated by a fixation cross lasting 1.4 s.6
Some filler images repeated at much shorter intervals of 1–7 imagesand were used as vigilance tests to recognize when a participant wasnot paying attention to the game. Participants were instructed topress a key when they detected an image repeat, at which point theyreceived feedback (a red or green cross). No image repeated morethan once. Participants could complete multiple memory games,since we ensured that a different set of images was presented eachtime. Fig. 1 depicts an example experimental sequence.
On average, 80 participants saw each target image and itsrepeat, providing us with enough data points per image to collectreliable statistics about the memorability of each image.7 Wedefine a hit to be a correct response to an image presented for thesecond time. A miss is when an image was repeated, but not recog-nized. False alarms and correct rejections are incorrect and correctresponses (respectively) to target images shown for the first time.We define hit rate (HR) and false alarm rate (FAR):
HRðIÞ ¼ hitsðIÞhitsðIÞ þmissesðIÞ � 100% ð1Þ
FARðIÞ ¼ false alarmsðIÞfalse alarmsðIÞ þ correct rejectionsðIÞ � 100% ð2Þ
2 We chose all SUN scene categories with at least 300 images of the requireddimensions.
3 We calculated the Gist descriptor (Oliva & Torralba, 2001) of each image,displayed its 5 nearest neighbors, and removed identical copies and near-duplicates.Some remaining duplicates were removed after post-processing the experimentaldata.
4 Images were later resized to 512� 512 px for the online AMT experiments (to fitcomfortably in browser windows), and to 1000� 1000 px for the eyetrackingexperiments.
5 Compliance with the Declaration of Helsinki is acknowledged in Section 8.6 Images and repeats occurred on average 4.5 min apart, thus allowing us to
capture memory processes well beyond short-term and working memory.7 AMT participant demographics are discussed in Ross et al. (2010).
Please cite this article in press as: Bylinskii, Z., et al. Intrinsic and extrinsic effectj.visres.2015.03.005
We also define HR and FAR to be category averages – computedover all images belonging to a single category. The HR scores varyfrom 49.5% to 64.2% (M ¼ 56:0%; SD ¼ 4:2%).8 FAR scores varybetween 10.2% and 18.9% (M ¼ 14:6%; SD ¼ 2:0%), following a par-tial mirror effect (Glanzer & Adams, 2010; Vokey & Read, 1992),where high HR are often accompanied by low FAR. The Spearmanrank correlation between the HR and FAR scores is �0.66(p < 0:01). Note that this is to be expected by signal detection theoryas sensitivity increases: targets and distractors become more dis-criminable, leading simultaneously to high HR and low FAR.Memorability scores for all the categories can be found in Table 1,and for comparison, memorability scores from other experimentsare included in Table 3 (in the appendix). For instance, a previousexperiment that combined images from hundreds of scene cate-gories (Isola, Xiao, et al., 2011) reported average HR and FAR scoresof 67.5% and 10.7%, respectively.
Fig. 2 includes a sample of some of the most memorable andforgettable images from a few FIGRIM categories. The most memo-rable categories are amusement parks and playgrounds, scenes con-sisting of a large variety of objects in different configurations, andoften containing people. Interestingly, 8/9 of the indoor categoriesare in the top 13 most memorable scene categories (the last indoorcategory, cockpits is the least memorable category overall).Qualitatively, the most memorable instances across categoriestend to contain people, animals, text, and objects like cars andflags. Overall, memorable images tend to be distinct from the otherimages in their category – they may have unusual objects, layouts,or perspectives. This latter point will be quantified in Section 5.
3.3. AMT 2: across-category experiment
We ran another AMT study on the combined target and fillerimages across all the scene categories, and collected a new set ofmemorability scores, following the same protocol as before (seedataset statistics in Table 2, appendix). The average memorabilityscores for this experiment are: HR: M ¼ 66:0%; SD ¼ 13:9%, FAR:M ¼ 11:1%; SD ¼ 9:5%.
3.4. In-lab control experiment
We replicated the AMT experiments in the lab using a subset of630 target images. In a single experimental session, the targetsconsisted of 30 images taken from each of 7 randomly-selectedscene categories, making up a total of 210 targets. The filler imageswere chosen in equal proportions from the same set of scene cate-gories as the targets. The exact experimental set-up can be found inthe appendix. The memorability scores for the in-lab experimentare HR: M ¼ 64:9%; SD ¼ 21:3%, FAR: M ¼ 6:0%; SD ¼ 8:9%.
Note that by changing the number of scene categories in anexperiment (from 1 in AMT 1, to 7 in this in-lab experiment, to
8 Throughout the rest of the paper, M will refer to ‘mean’ and SD to ‘standarddeviation’.
s on image memorability. Vision Research (2015), http://dx.doi.org/10.1016/

Fig. 2. A sample of the most memorable and forgettable images from 9 of the 21 categories in the FIGRIM dataset, sorted from most to least memorable category, with the HRper category reported. Inset are the HR scores of the individual images.
4 Z. Bylinskii et al. / Vision Research xxx (2015) xxx–xxx
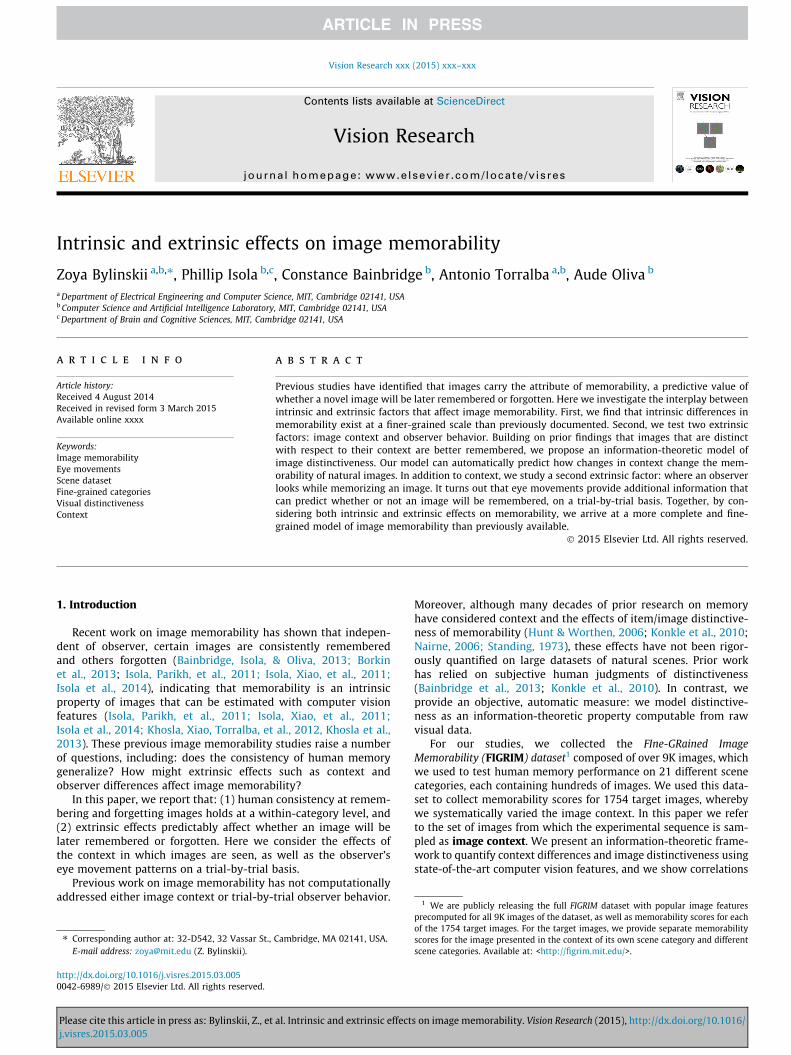
21 in AMT 2), we increase the variability of the experimental imagecontext. To demonstrate the effect of number of scene categorieson memorability, we sorted the HR scores of the overlappingtargets in all 3 experiments by the scores of AMT 2 and binnedthem into high, middle, and low memorability. In Fig. 3, as thenumber of scene categories increases, the overall memorabilityscores of all the images in the experiment also increase (even forthe least memorable images). At the same time, the differencebetween the (high, middle, low) memorability bins remainsstatistically significant, indicating that some images are intrinsi-cally more memorable and others forgettable.
Please cite this article in press as: Bylinskii, Z., et al. Intrinsic and extrinsic effectj.visres.2015.03.005
4. Intrinsic effects on memorability
4.1. Some images are intrinsically more memorable, even at thecategory level
Previous studies have demonstrated that memorability is con-sistent across participant populations for a general set of sceneimages (HR: q ¼ 0:75, FAR: q ¼ 0:66) (Isola, Xiao, et al., 2011)and for the specific classes of faces (HR: q ¼ 0:68, FAR: q ¼ 0:69)(Bainbridge et al., 2013) and data visualizations (HR: q ¼ 0:83,FAR: q ¼ 0:78) (Borkin et al., 2013). Here these results are
s on image memorability. Vision Research (2015), http://dx.doi.org/10.1016/
high middle low30
40
50
60
70
80
90
Memorability Category
Ave
rage
HR
(%
)
AMT 1in−labAMT 2
Fig. 3. Memorability scores for images in the context of 21 scenes (AMT 2) arehigher than in the context of 7 scenes (in-lab), and higher still than in the context of1 scene (AMT 1). At the same time, the most memorable images remained the mostmemorable, and the most forgettable remained the most forgettable. Standard errorbars have been plotted.
Z. Bylinskii et al. / Vision Research xxx (2015) xxx–xxx 5
extended to the fine-grained category level for a variety of scenecategories.
The consistencies of the image memorability scores were mea-sured separately for each of the scene categories (see Table 1 in theappendix for all the values). This was done by splitting the partici-pants of AMT 1 into two independent groups, computing thememorability scores of images based on the participants in eachgroup separately, ranking the images according to the memorabil-ity scores, and computing the Spearman rank correlation betweenthe two possible rankings. Results were averaged over 25 suchhalf-splits of the participant data. For all of the scene categories,consistency of HR scores ranged from 0.69 to 0.86 and from 0.79to 0.90 for FAR scores. These high correlations demonstrate thatmemorability is a consistent measure across participant pop-ulations, indicating real differences in memorability across images.
4.2. Some scene categories are intrinsically more memorable
How consistent is the relative ranking (the ordering in Table 1)of the scene categories? For instance, if we selected a different sub-set of images, would the average memorability of the amusementpark images still be at the top? We took half the images from eachcategory, and computed the HR scores for all the categories. Wealso computed the HR scores for the other half of the images inall the categories. Over 25 such half-splits of images, the rankcorrelation between these 2 sets of HR scores was 0.68 (with sig-nificant p-values). Thus, the relative memorability of the scenecategories is stable, and some scene categories are intrinsicallymore memorable than others.
9 Bandwidth selection was performed just once on all the images across all thescene categories, and this same bandwidth was used for estimating the distributionsfor each category.
10 Some visualizations of these features can be found in Zhou et al. (2014, 2015).11 In information theory, this is alternatively termed self-information and surprisal.
4.3. Image memorability is consistent across experiments
Per-image memorability scores measured in AMT 2 also corre-lated strongly with those measured in the within-category experi-ment AMT 1 (Spearman q ¼ 0:60 for HR and q ¼ 0:75 for FAR),demonstrating that the intrinsic memorability of images holdsacross different image contexts.
The rank correlation of the HR scores for the 630 target imagesused in the in-lab experiment with the scores for the same imagesin AMT 1 is 0.75, and with AMT 2 is 0.77. Thus, across all 3 of theexperiments (two online, one in-lab), the relative ranking of thesetarget images are highly consistent, providing further evidencethat image memorability is to a large extent an intrinsic propertyof images that holds across different populations of human partici-pants, different image contexts, and different experimentalsettings.
Please cite this article in press as: Bylinskii, Z., et al. Intrinsic and extrinsic effectj.visres.2015.03.005
5. Context effects on memorability
A large body of literature suggests that items that stand outfrom their context are better remembered (Attneave, 1959;Eysenck, 1979; Hunt & Worthen, 2006; Konkle et al., 2010;Rawsona & Overscheldeb, 2008; Schmidt, 1985; Standing, 1973;Vogt & Magnussen, 2007; von Restorff, 1933; Wiseman &Neisser, 1974). However, recent work on predicting image mem-orability (Isola, Xiao, et al., 2011; Isola, Parikh, et al., 2011;Khosla, Xiao, Torralba, et al., 2012) has largely ignored the effectsof image context on memory performance.
By systematically varying the context for our target imagesbetween AMT 1 and AMT 2, we directly measure context effectson image memorability. We use state-of-the-art computer visionfeatures within an information-theoretic framework to quantifycontext differences and image distinctiveness. We are able to rigor-ously quantify, using our large-scale natural scene database, theobservation that images that are unique or distinct with respectto their image context are better remembered.
5.1. Contextually distinct images are more memorable
We call images contextually distinct if they are distinct withrespect to their image context (the set of images from which theexperimental sequence is sampled). To model context effects, wefirst estimated the probability distribution over the images in animage’s context (in some feature space). The distinctiveness of animage is its negative log likelihood under this distribution. Weconsidered two different contexts: (a) within-category contextcomposed of images from a single category (AMT 1), and (b)across-category context composed of images from all categories(AMT 2). To estimate the probability distribution of a given con-text, we used kernel density estimation (Ihler & Mandel, 2014).
For each image I, we computed a feature vector f i ¼ FðIÞ, whereF can be any feature mapping. We modeled the probability offeatures f i appearing in image context C as:
Pcðf iÞ ¼1kCk
X
j2C
Kðf i � f jÞ ð3Þ
where K can be any kernel function, and kCk indicates the size of thecontext, measured in number of images. We used an Epanechnikovkernel and leave-one-out-cross-validation to select the kernelbandwidth.9 The features come from a convolutional neural network(CNN), a popular feature space recently shown to outperform otherfeatures in computer vision (Krizhevsky, Sutskever, & Hinton,2012; Razavian et al., 2014). Specifically, we used the Places-CNNfrom Zhou et al. (2014) trained to classify scene categories. We usedthe 4096-dimensional features from the response of the Fully-Connected Layer 7 (fc7) of the CNN, which is the final fully-connected layer before producing class predictions. We reduced thisfeature vector to 10 dimensions using PCA to prevent overfitting andincrease efficiency in estimating the kernel densities.
Our results are not restricted to this feature space, and holdmore generally. In particular, we obtained similar (though weaker)trends when using the simpler Gist descriptor (Oliva & Torralba,2001), for which we provide results in the SupplementalMaterial. In contrast to simple visual descriptors like Gist, the deepfeatures are trained to predict image semantics.10 This is supportedby research showing that conceptual (semantic) similarity is more
s on image memorability. Vision Research (2015), http://dx.doi.org/10.1016/
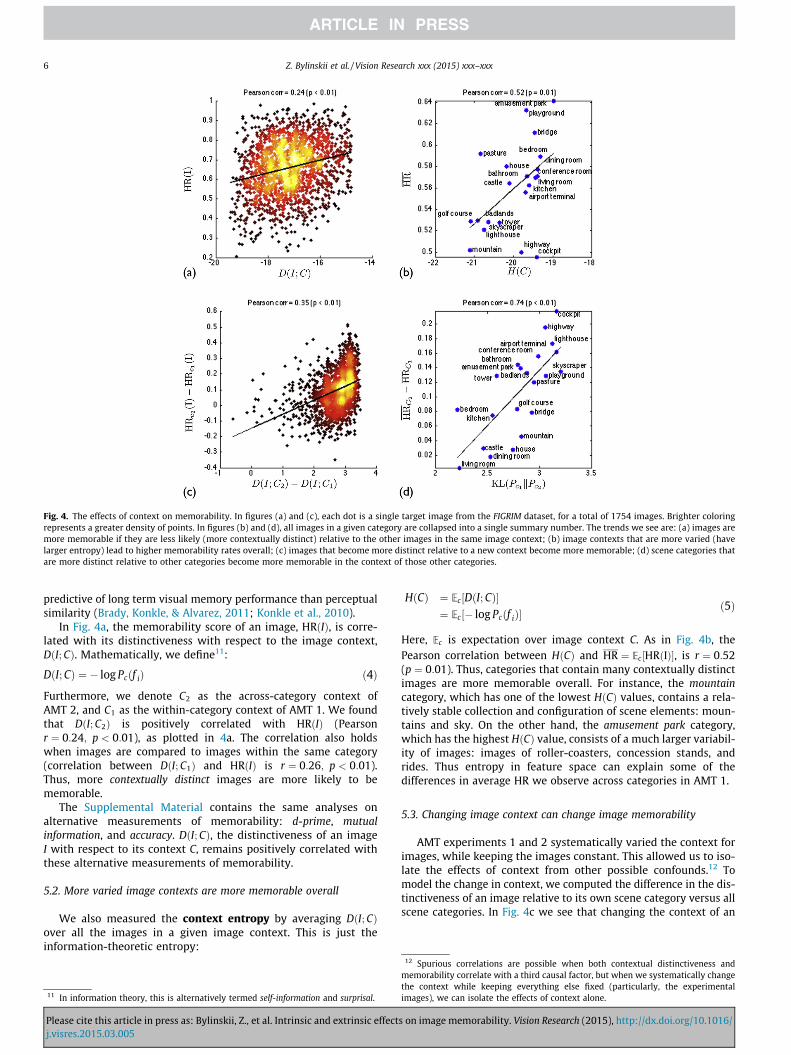
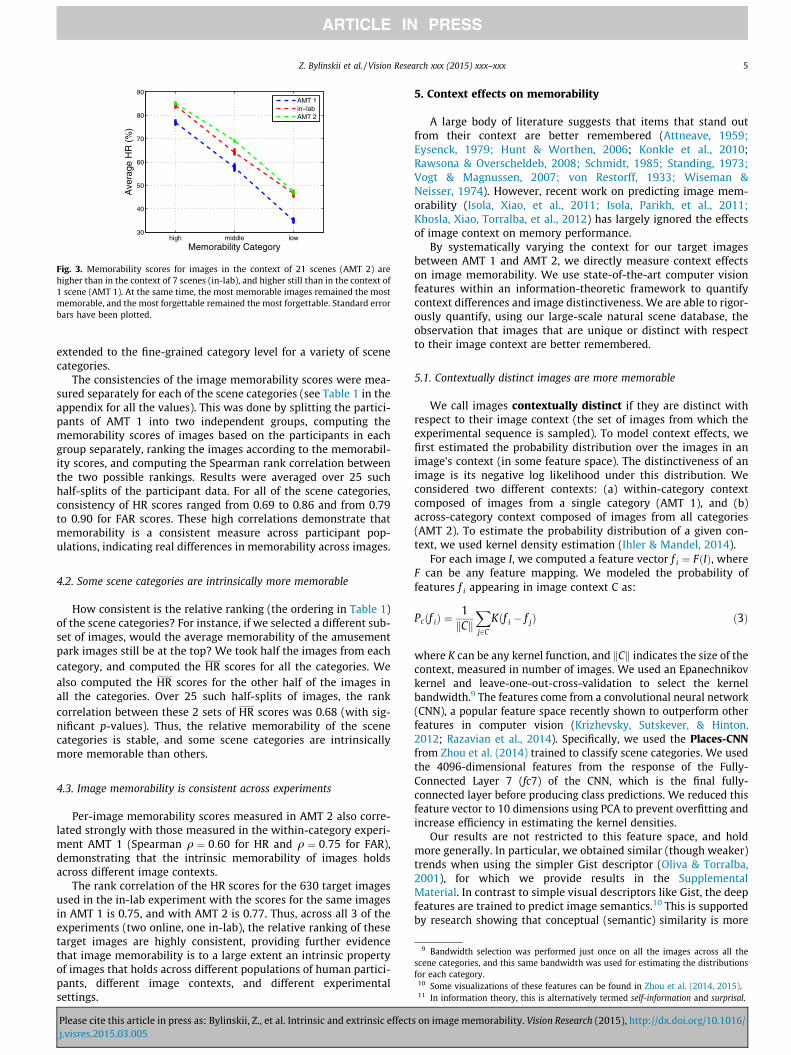
Fig. 4. The effects of context on memorability. In figures (a) and (c), each dot is a single target image from the FIGRIM dataset, for a total of 1754 images. Brighter coloringrepresents a greater density of points. In figures (b) and (d), all images in a given category are collapsed into a single summary number. The trends we see are: (a) images aremore memorable if they are less likely (more contextually distinct) relative to the other images in the same image context; (b) image contexts that are more varied (havelarger entropy) lead to higher memorability rates overall; (c) images that become more distinct relative to a new context become more memorable; (d) scene categories thatare more distinct relative to other categories become more memorable in the context of those other categories.
12
6 Z. Bylinskii et al. / Vision Research xxx (2015) xxx–xxx
predictive of long term visual memory performance than perceptualsimilarity (Brady, Konkle, & Alvarez, 2011; Konkle et al., 2010).
In Fig. 4a, the memorability score of an image, HRðIÞ, is corre-lated with its distinctiveness with respect to the image context,DðI; CÞ. Mathematically, we define11:
DðI; CÞ ¼ � log Pcðf iÞ ð4Þ
Furthermore, we denote C2 as the across-category context ofAMT 2, and C1 as the within-category context of AMT 1. We foundthat DðI; C2Þ is positively correlated with HRðIÞ (Pearsonr ¼ 0:24; p < 0:01), as plotted in 4a. The correlation also holdswhen images are compared to images within the same category(correlation between DðI; C1Þ and HRðIÞ is r ¼ 0:26; p < 0:01).Thus, more contextually distinct images are more likely to bememorable.
The Supplemental Material contains the same analyses onalternative measurements of memorability: d-prime, mutualinformation, and accuracy. DðI; CÞ, the distinctiveness of an imageI with respect to its context C, remains positively correlated withthese alternative measurements of memorability.
5.2. More varied image contexts are more memorable overall
We also measured the context entropy by averaging DðI; CÞover all the images in a given image context. This is just theinformation-theoretic entropy:
11 In information theory, this is alternatively termed self-information and surprisal.
Please cite this article in press as: Bylinskii, Z., et al. Intrinsic and extrinsic effectj.visres.2015.03.005
HðCÞ ¼ Ec½DðI; CÞ�¼ Ec½� log Pcðf iÞ�
ð5Þ
Here, Ec is expectation over image context C. As in Fig. 4b, thePearson correlation between HðCÞ and HR ¼ Ec½HRðIÞ�, is r ¼ 0:52(p ¼ 0:01). Thus, categories that contain many contextually distinctimages are more memorable overall. For instance, the mountaincategory, which has one of the lowest HðCÞ values, contains a rela-tively stable collection and configuration of scene elements: moun-tains and sky. On the other hand, the amusement park category,which has the highest HðCÞ value, consists of a much larger variabil-ity of images: images of roller-coasters, concession stands, andrides. Thus entropy in feature space can explain some of thedifferences in average HR we observe across categories in AMT 1.
5.3. Changing image context can change image memorability
AMT experiments 1 and 2 systematically varied the context forimages, while keeping the images constant. This allowed us to iso-late the effects of context from other possible confounds.12 Tomodel the change in context, we computed the difference in the dis-tinctiveness of an image relative to its own scene category versus allscene categories. In Fig. 4c we see that changing the context of an
Spurious correlations are possible when both contextual distinctiveness andmemorability correlate with a third causal factor, but when we systematically changethe context while keeping everything else fixed (particularly, the experimentalimages), we can isolate the effects of context alone.
s on image memorability. Vision Research (2015), http://dx.doi.org/10.1016/
0.45
0.5
0.55
0.6
0.65
0.7
0.75
0.8
Scene Categories (sorted by difference in scores)
Ave
rage
HR
(%
)
living
room
dining
room
hous
e
castl
e
mou
ntain
kitch
en
bridg
e
bedr
oom
golf c
ours
e
pastu
reto
wer
playg
roun
d
badla
nds
skys
crap
er
amus
emen
t par
k
bath
room
conf
eren
ce ro
om
airpo
rt te
rmina
l
light
hous
e
highw
ay
cock
pit
AMT1AMT2
Fig. 5. The average memorability of the images in each scene category went up when images were presented in the context of images from other scene categories (AMT 2)compared to when they were presented only in the context of images from the same category (AMT 1).
Z. Bylinskii et al. / Vision Research xxx (2015) xxx–xxx 7
image to make it more distinct relative to the context increases itsmemorability. The Pearson correlation between DðI; C2Þ � DðI; C1Þand HRC2 ðIÞ �HRC1 ðIÞ is 0.35 (p < 0:01).
We also considered differences in memorability at the categorylevel. In Fig. 5 we see that across all categories, HR for each cate-gory goes up in the context of images from other categories.However, how much change there is in image memorability whenwe switch contexts depends on the scene category.
How does a scene category’s memorability change when thecategory is combined with other categories? We measured thischange in context as the Kullback–Leibler divergence between thedensity functions computed over contexts C1 and C2 as:
KLðPc1 jjPc2 Þ ¼ Ec1 ½� log Pc2 ðf Þ� � Ec1 ½� log Pc1 ðf Þ� ð6Þ
The first term is the probability of the images in a category underthe context of AMT 2, and the second term is the probability ofthe images under its own category in AMT 1. Intuitively, this mea-sures how much more (or less) likely a category’s images are underthe context of AMT 2 compared to AMT 1. In Fig. 4d, the Pearsoncorrelation between the change in context entropy and change inmemorability is r ¼ 0:74 (p < 0:01). Consider the cockpit category,with the greatest KLðPc1kPc2 Þ value: many of the cockpit images lookalike. However, when mixed with images from other scenes, theybecome very distinct: there is no other scene category with similarimages. Compare this with dining rooms, with one of the lowestKLðPc1kPc2 Þ values, that often look like living rooms and kitchens,and thus are not as visually distinct when combined with imagesfrom these other scene categories.
5.4. Atypical category exemplars are most affected by context
Another way of looking at the distinctiveness story is through adiscriminative lens (as an alternative to the generative informationtheoretic framework presented in the previous sections). Considerthe images that were memorable with respect to their own cat-egory, but became more forgettable when combined with other
Please cite this article in press as: Bylinskii, Z., et al. Intrinsic and extrinsic effectj.visres.2015.03.005
categories. In Fig. 6, we can see that these images tend to look morelike other categories than their own category.
To quantify this intuition, we mapped the Places-CNN deepfeatures to category labels by training a linear multi-class SVMon the filler images of the FIGRIM dataset with labels of 21 scenecategories. We then evaluated our classifier on the target imagesof the FIGRIM dataset to automatically predict the most likelyscene category for each image (the overall scene classificationaccuracy was 91.56%). These predicted category labels areincluded with each image in Fig. 6. Notice that for the images thatdecreased in memorability when combined with other categories,the predicted labels are more likely to be incorrect. Compare thisto the images that increased in memorability when combinedwith other categories – they are more likely to be correctlyclassified.
We also consider the probability, under the scene classifier, ofthe correct category label. These probabilities are included witheach image in Fig. 6. Images with a higher probability value aremore typical examples of their scene category. Across all 1754target images, the Pearson correlation between the probability ofthe correct category label and the change in memorability due tocontext (from AMT 1 to AMT 2) is r ¼ 0:30 (p < 0:01). In otherwords, the images least likely to belong to their own categoryexperience the greatest drop in memorability when they arecombined with images of other categories.
Which images have memorability scores that are least affectedby context? Images that are distinct with respect to many contexts– in this case, those that are distinct from their own category, butdo not look like images from other categories either. For example,the images in the top right quadrant in Fig. 7 are memorable acrosscontexts. Take for example the bridge in front of the red sky. It isclearly an image of a bridge, but it also looks like no other bridge(the red sky is unique). Compare this to the bridge in the bottomright, which looks more like a pasture. Among bridges, it is memo-rable, but among pastures it is not. Thus, for applications whereone intends an image to be robustly memorable, one must considerthe different contexts in which this image is likely to occur andensure the image will stand out from all these contexts.
s on image memorability. Vision Research (2015), http://dx.doi.org/10.1016/
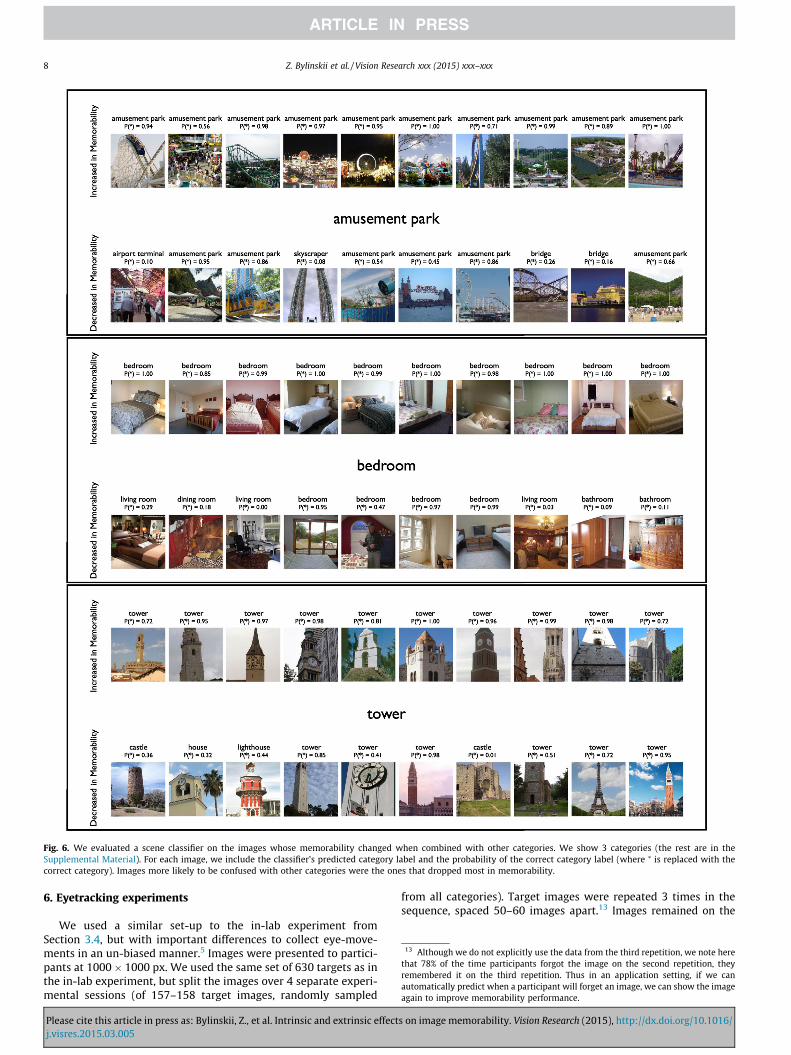
Fig. 6. We evaluated a scene classifier on the images whose memorability changed when combined with other categories. We show 3 categories (the rest are in theSupplemental Material). For each image, we include the classifier’s predicted category label and the probability of the correct category label (where ⁄ is replaced with thecorrect category). Images more likely to be confused with other categories were the ones that dropped most in memorability.
13 Although we do not explicitly use the data from the third repetition, we note herethat 78% of the time participants forgot the image on the second repetition, theyremembered it on the third repetition. Thus in an application setting, if we canautomatically predict when a participant will forget an image, we can show the imageagain to improve memorability performance.
8 Z. Bylinskii et al. / Vision Research xxx (2015) xxx–xxx
6. Eyetracking experiments
We used a similar set-up to the in-lab experiment fromSection 3.4, but with important differences to collect eye-move-ments in an un-biased manner.5 Images were presented to partici-pants at 1000� 1000 px. We used the same set of 630 targets as inthe in-lab experiment, but split the images over 4 separate experi-mental sessions (of 157–158 target images, randomly sampled
Please cite this article in press as: Bylinskii, Z., et al. Intrinsic and extrinsic effectj.visres.2015.03.005
from all categories). Target images were repeated 3 times in thesequence, spaced 50–60 images apart.13 Images remained on the
s on image memorability. Vision Research (2015), http://dx.doi.org/10.1016/

Fig. 7. Memorability scores of images in the top right quadrant of each plot are least affected by context whereas the scores of images in the bottom right quadrant are mostaffected by context. Images in the top right are distinct with respect to both contexts, while images in the bottom right are distinct only with respect to their own category.
14 We processed the raw eye movement data using standard settings of the EyeLinkData Viewer to obtain discrete fixation locations, removed all fixations shorter than100 ms or longer than 1500 ms, and kept all others that occurred within the 2000 msrecording segment (from image onset to image offset).
Z. Bylinskii et al. / Vision Research xxx (2015) xxx–xxx 9
screen for 2 s, and participants gave a forced-choice response at theend of each image presentation to indicate whether the imageappeared previously or not. After a keypress response and verbalfeedback, a fixation cross came on the screen for 0.4 s, followed bythe next image. See Fig. 8 for an example experimental sequence.
Eyetracking was performed on an SR Research EyeLink1000desktop system at a sampling rate of 500Hz, on a 19 inch CRTmonitor with a resolution of 1280� 1024 pixels, 22 inches fromthe chinrest mount. The image stimuli subtended 30 degrees ofvisual angle. The experiments started with a randomized 9-pointcalibration and validation procedure, and at regular intervalsthroughout the experiment drift checks were performed, and ifnecessary, recalibration. Each experiment lasted 75–90 min, andparticipants could take regular breaks throughout. All participanteye-fixations and keypresses were recorded. We recruited a totalof 40 participants for our study (M ¼ 14:1; SD ¼ 1:2 participantsper image), 24 of which were female, with overall mean age 21.2years (SD ¼ 3:3). The memorability scores for this experimentwere: HR: M ¼ 75:8%; SD ¼ 14:4%, FAR: M ¼ 5:2%; SD ¼ 7:4%.
7. Observer effects on memorability
Can the experience, behavior, or other characteristics of a speci-fic individual on a specific trial be used to make more accurate pre-dictions about memory performance than by using populationestimates? Here our goal is to make predictions on a trial-by-trial
Please cite this article in press as: Bylinskii, Z., et al. Intrinsic and extrinsic effectj.visres.2015.03.005
basis, using an individual’s eye-movements to determine if animage will be later remembered.
7.1. Model
Given a set of fixations on an image, we want to know: will theviewer remember this image at a later point in time? The key ideais that if a viewer’s fixations differ from the fixations expected onan image, the viewer may not have encoded the image correctly.Thus, when evaluating a novel set of fixations, we want the proba-bility that these fixations came from this image – as opposed tosome other image. If the probability is high, we label the fixationsas successful encoding fixations, since we believe they will lead toa correct recognition of the image later. Otherwise, we assume theimage was not properly encoded, and will be forgotten. To providesome further intuition, a few examples are provided in Fig. 9. Weconstructed a computational model by training a separate classifierfor each image, differentiating fixations that belong to this imagefrom fixations on all other images.
After preprocessing,14 we converted an observer’s fixations on animage into a fixation map by binning the fixations into a
s on image memorability. Vision Research (2015), http://dx.doi.org/10.1016/

? correct + ? incorrect ? correct
2.0 s until keypress 0.3 s
... ...
0.2 s 0.4 stime
false alarmcorrect rejection hit
repeat
Fig. 8. An example eyetracking experimental sequence. Differences from the AMT experiment in Fig. 1 include the slightly longer image presentation times, the collection ofkey presses after image presentation at the prompt, and the forced-choice response.
Fig. 9. Examples of individual viewers’ fixation maps (at encoding) overlaid on top of the images viewed. For each of these 5 example images, we include the 3 highest-confidence and 3 lowest-confidence instances under the image’s classifier (trained to differentiate fixations on this image from fixations on other images). Fixations that laterled to a correct recognition of the image are outlined in green, and those where the image was unsuccessfully remembered are in red. This depicts some of the successes andfailure modes of our model. (For interpretation of the references to colour in this figure legend, the reader is referred to the web version of this article.)
10 Z. Bylinskii et al. / Vision Research xxx (2015) xxx–xxx
20� 20 grid, normalizing the binned map, and smoothing it byconvolution with a Gaussian with r ¼ 2 grid cells. Coarse samplingand smoothing was necessary to regularize the data.
For each image, we trained an ensemble classifier Gi ¼ gðIÞ todifferentiate fixation maps on this image (positive examples) fromfixation maps on all other images (negative examples). For train-ing, we only considered successful encoding fixations – the fixa-tions made on an image the first time it appeared in the imagesequence, and led to a correct recognition later in the sequence.
We used a RUSBoost classifier (Seiffert et al., 2010), whichhandles the class imbalance problem,15 and balanced accuracy asa metric of performance because it avoids inflated performanceestimates on datasets with unequal numbers of positives andnegatives (Brodersen et al., 2010). It is calculated as:
balanced accuracy ¼ 0:5� true positivestrue positivesþ false negatives
þ 0:5� true negativestrue negativesþ false positives
ð7Þ
15 N being the total number of images, we have order N � 1 negatives, since thosecome from all other images while the positives come from a single image.
Please cite this article in press as: Bylinskii, Z., et al. Intrinsic and extrinsic effectj.visres.2015.03.005
Over 5 train-test splits, the balanced accuracy of our classifier ondetermining whether a set of fixations comes from a specific imagevs some other image is 79:7% (SD: 13.9%), where chance is at 50%.This high performance indicates that we are able to successfullylearn diagnostic fixation patterns for an image to distinguish it fromall other images. However, not all images produce diagnosticfixation patterns, and thus predictive power varies by image (seeSection 7.4).
7.2. Eye movements are predictive of whether an image will beremembered
As demonstrated in the AMT memorability studies, people arehighly consistent in which images they remember and forget.Thus as a baseline we use an image’s memorability score (i.e. HRfrom AMT 2) to make trial-by-trial predictions for whether a par-ticular individual will remember a particular image. We refer tothis as a population predictor because these memorability scoresare obtained by averaging over participants. This predictorachieves an accuracy of 60.09% (SD: 1.55%) at making trial-by-trialpredictions, significantly above chance (50%). However, this pre-dictor will not be robust across all images (see Section 7.3), and
s on image memorability. Vision Research (2015), http://dx.doi.org/10.1016/
0 5 10 15 20 25 30 35 40 45 50 55 60 65 70 75 80 85 90 9545
50
55
60
65
70
75
Percent of images removed at memorability extremes
Bal
ance
d A
ccur
acy
(%)
Eye movement predictorMemorability predictor
5 10 15 20 25 30 35 40 45 50 55 60 65 70 75 80 85 90 95 10065
66
67
68
69
70
71
Bal
ance
d A
ccur
acy
(%)
Percent images used, sorted by expected classifier confidence
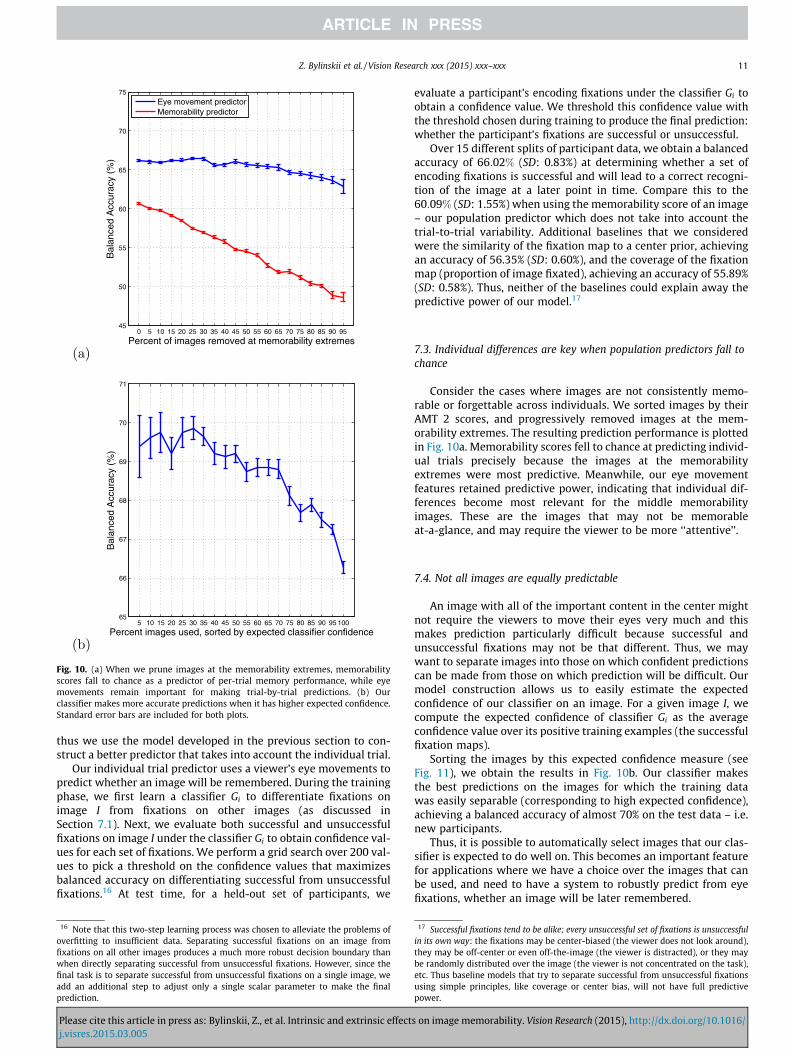
Fig. 10. (a) When we prune images at the memorability extremes, memorabilityscores fall to chance as a predictor of per-trial memory performance, while eyemovements remain important for making trial-by-trial predictions. (b) Ourclassifier makes more accurate predictions when it has higher expected confidence.Standard error bars are included for both plots.
Z. Bylinskii et al. / Vision Research xxx (2015) xxx–xxx 11
thus we use the model developed in the previous section to con-struct a better predictor that takes into account the individual trial.
Our individual trial predictor uses a viewer’s eye movements topredict whether an image will be remembered. During the trainingphase, we first learn a classifier Gi to differentiate fixations onimage I from fixations on other images (as discussed inSection 7.1). Next, we evaluate both successful and unsuccessfulfixations on image I under the classifier Gi to obtain confidence val-ues for each set of fixations. We perform a grid search over 200 val-ues to pick a threshold on the confidence values that maximizesbalanced accuracy on differentiating successful from unsuccessfulfixations.16 At test time, for a held-out set of participants, we
16 Note that this two-step learning process was chosen to alleviate the problems ofoverfitting to insufficient data. Separating successful fixations on an image fromfixations on all other images produces a much more robust decision boundary thanwhen directly separating successful from unsuccessful fixations. However, since thefinal task is to separate successful from unsuccessful fixations on a single image, weadd an additional step to adjust only a single scalar parameter to make the finalprediction.
Please cite this article in press as: Bylinskii, Z., et al. Intrinsic and extrinsic effectj.visres.2015.03.005
evaluate a participant’s encoding fixations under the classifier Gi toobtain a confidence value. We threshold this confidence value withthe threshold chosen during training to produce the final prediction:whether the participant’s fixations are successful or unsuccessful.
Over 15 different splits of participant data, we obtain a balancedaccuracy of 66:02% (SD: 0.83%) at determining whether a set ofencoding fixations is successful and will lead to a correct recogni-tion of the image at a later point in time. Compare this to the60:09% (SD: 1.55%) when using the memorability score of an image– our population predictor which does not take into account thetrial-to-trial variability. Additional baselines that we consideredwere the similarity of the fixation map to a center prior, achievingan accuracy of 56.35% (SD: 0.60%), and the coverage of the fixationmap (proportion of image fixated), achieving an accuracy of 55.89%(SD: 0.58%). Thus, neither of the baselines could explain away thepredictive power of our model.17
7.3. Individual differences are key when population predictors fall tochance
Consider the cases where images are not consistently memo-rable or forgettable across individuals. We sorted images by theirAMT 2 scores, and progressively removed images at the mem-orability extremes. The resulting prediction performance is plottedin Fig. 10a. Memorability scores fell to chance at predicting individ-ual trials precisely because the images at the memorabilityextremes were most predictive. Meanwhile, our eye movementfeatures retained predictive power, indicating that individual dif-ferences become most relevant for the middle memorabilityimages. These are the images that may not be memorableat-a-glance, and may require the viewer to be more ‘‘attentive’’.
7.4. Not all images are equally predictable
An image with all of the important content in the center mightnot require the viewers to move their eyes very much and thismakes prediction particularly difficult because successful andunsuccessful fixations may not be that different. Thus, we maywant to separate images into those on which confident predictionscan be made from those on which prediction will be difficult. Ourmodel construction allows us to easily estimate the expectedconfidence of our classifier on an image. For a given image I, wecompute the expected confidence of classifier Gi as the averageconfidence value over its positive training examples (the successfulfixation maps).
Sorting the images by this expected confidence measure (seeFig. 11), we obtain the results in Fig. 10b. Our classifier makesthe best predictions on the images for which the training datawas easily separable (corresponding to high expected confidence),achieving a balanced accuracy of almost 70% on the test data – i.e.new participants.
Thus, it is possible to automatically select images that our clas-sifier is expected to do well on. This becomes an important featurefor applications where we have a choice over the images that canbe used, and need to have a system to robustly predict from eyefixations, whether an image will be later remembered.
17 Successful fixations tend to be alike; every unsuccessful set of fixations is unsuccessfulin its own way: the fixations may be center-biased (the viewer does not look around),they may be off-center or even off-the-image (the viewer is distracted), or they maybe randomly distributed over the image (the viewer is not concentrated on the task),etc. Thus baseline models that try to separate successful from unsuccessful fixationsusing simple principles, like coverage or center bias, will not have full predictivepower.
s on image memorability. Vision Research (2015), http://dx.doi.org/10.1016/

images sorted by expected classifier confidence
...
Fig. 11. Images sorted by expected classifier confidence (from least to most). A classifier with high confidence on its positive training examples will do better atdifferentiating successful from unsuccessful fixations on an image. Overlaid on top of each image is the average fixation map computed over all successful encodings of theimage.
0 5 10 15 2054
56
58
60
62
64
66
68
# scene categories
Ave
rage
HR
(%
)
Fig. 12. Average memorability scores for scene contexts composed of differentnumbers of scene categories: 1 (AMT 1), 7 (in-lab), 21 (AMT 2). It is interesting tonote as an additional data point that in the memorability experiment by Isola, Xiaoet al. (2011) with hundreds of scene categories, the average HR is 67.5%. Thus, as thevariability of images in a given image context increases, the memorability scores goup (more images can be remembered). However, memory performance is not likelyto increase indefinitely, eventually reaching a plateau.
12 Z. Bylinskii et al. / Vision Research xxx (2015) xxx–xxx
7.5. Future applications
The types of investigations presented in this paper have poten-tial applications for education as they provide us with (1) tools tounderstand the settings in which images can be best remembered(and how memory can change across contexts), and (2) tools topredict an individual’s memory for images, thus opening upavenues for customization and intervention. Memorabilityexperiments on information visualizations (Borkin et al., 2013)demonstrate generalization of findings to non-scene stimuli –specifically, data presentation. Imagine an automatic system thatmonitors the eye movements of a student on a set of lecture slidesor data presentations and uses this information to determinewhether or not the student is ‘‘paying attention’’. If not, the systemmay either alert the student to increase attentiveness at this pointin time, or else the system may continue to re-present the materialagain until it has acquired some confidence that the student hasproperly encoded the content.
8. Conclusion
In this paper we have replicated and extended previous findingsthat memorability scores are highly consistent across participants,which suggests there is a component of image memory intrinsic tothe images themselves. We have shown that this consistency holdsat the within-category level, for a total of 21 different indoor andoutdoor scene categories. Additionally, high consistency existsacross experiments, with varying contexts, experimental set-ups,and participant populations (online and in-lab).
Nevertheless, we have also demonstrated how (and in whichcases) extrinsic effects can alter the memorability of images. Wehave presented an information-theoretic framework for predictingthe effect of context on memorability. Images that are mostdistinct from their image context are the most memorable, andimage contexts with the highest entropy have the highest overallmemorability scores. Thus as one increases the variety or distinc-tiveness of the images in a collection, one can increase the numberof images that can be remembered. Does this mean that perfor-mance on image recognition tasks can increase indefinitely as longas the images being presented together (in the same context)are sufficiently different? This is probably not the case due to apossible saturation effect – see Fig. 12.
We have also considered cases where memorability scores maynot be sufficient for predicting trial-by-trial memory performance.Specifically for images that are not at the memorability extremes,we can provide better predictions by taking into account theextrinsic effects of the observer. We introduced a model for usingthe eye movements of a viewer when first presented with an imageto predict whether the image will be later remembered. Thus weoffer an application of memorability decoding from eye move-ments. Apart from the extrinsic effects we have discussed in thispaper, other ones can affect the memorability of individual images,including the observer’s expertise (Curby, Glazek, & Gauthier,2009; Herzmann & Curran, 2011; Vicente & Wang, 1998), temporaleffects (Isola et al., 2014; McGaugh, 1966), attentional and task
Please cite this article in press as: Bylinskii, Z., et al. Intrinsic and extrinsic effectj.visres.2015.03.005
biases (Chun & Turk-Browne, 2007; Tuckey & Brewer, 2003;Walker, Vogl, & Thompson, 1997), etc. How memorable somethingis may additionally depend on its familiarity and utility. Note thatfamiliarity, which involves multiple repetitions of an item, hasnot been considered in our studies but is an important factor innatural environments. The effect of familiarity on memory has along history in psychology (Bartlett et al., 1984; Busey, 2001;Jacoby, 1991; Mandler, 2008; Vokey & Read, 1992). Utility wouldcorrespond to how important a given item is to the observer, andis related to expertise. For instance, faces have high utility, andimages with faces have been found to be more memorable (Isola,Xiao, et al., 2011; Isola et al., 2014). It remains to be understoodhow exactly all these factors combine to make an image more orless memorable.
We can thus consider intrinsic image memorability as a startingpoint (base level), and all the extrinsic effects as modifiers thatfinally determine whether or not a particular image will beremembered on a particular trial. Considered from anotherperspective, intrinsic image memorability is an average acrosscontexts, observers, and settings, where these extrinsic effectsare effectively marginalized out.
Understanding and modeling all the effects on memory arenecessary to build computational models that will more accuratelypredict image memorability for specific settings or users. Withhigh prediction accuracies, many interesting applications becomepossible, including customizable user interfaces and educationaltools.
Compliance with the declaration of Helsinki
All studies have been conducted in accordance with the Code ofEthics of the World Medical Association (Declaration of Helsinki).MIT IRB was attained. Participants read about the experimentbefore giving written consent to participate, and could opt out atany time. They were compensated for their time. AMT anonymizedall participant data, including names.
s on image memorability. Vision Research (2015), http://dx.doi.org/10.1016/

Table 1FIGRIM dataset statistics for AMT 1 (within-category), with a total of 1754 target and 7674 filler images. The HR and FAR scores are computed over the targets, for which we havean average of 85 experimental datapoints per image. The average HR across all the scene categories is 56:0% (SD: 4.2%), and the average FAR is 14:6% (SD: 2.0%).
Category Targets Fillers HR (%) FAR (%) HR cons. (q) FAR cons. (q) Datapoints/Target
Amusement park 68 296 64.2 (SD: 15.5) 10.2 (SD: 9.7) 0.85 (SD: 0.3) 0.80 (SD: 0.3) 84.8 (SD: 3.2)Playground 74 330 63.3 (SD: 14.4) 14.7 (SD: 12.7) 0.78 (SD: 0.4) 0.84 (SD: 0.3) 86.4 (SD: 2.7)Bridge 60 260 61.2 (SD: 13.2) 13.2 (SD: 12.0) 0.77 (SD: 0.4) 0.84 (SD: 0.2) 90.2 (SD: 4.4)Pasture 60 264 59.2 (SD: 17.5) 11.5 (SD: 9.5) 0.86 (SD: 0.3) 0.83 (SD: 0.4) 86.2 (SD: 3.7)Bedroom 157 652 58.9 (SD: 14.7) 13.5 (SD: 10.9) 0.77 (SD: 0.2) 0.81 (SD: 0.2) 84.5 (SD: 3.9)House 101 426 58.0 (SD: 13.3) 14.4 (SD: 10.3) 0.73 (SD: 0.3) 0.80 (SD: 0.3) 82.7 (SD: 3.7)Dining room 97 410 57.8 (SD: 13.6) 14.1 (SD: 10.8) 0.77 (SD: 0.4) 0.79 (SD: 0.3) 83.8 (SD: 2.8)Conference room 68 348 57.1 (SD: 13.7) 12.5 (SD: 8.8) 0.77 (SD: 0.4) 0.80 (SD: 0.3) 85.2 (SD: 3.3)Bathroom 94 398 57.1 (SD: 12.8) 16.3 (SD: 13.9) 0.73 (SD: 0.4) 0.82 (SD: 0.3) 86.6 (SD: 3.4)Living room 138 573 56.9 (SD: 14.1) 14.4 (SD: 9.6) 0.77 (SD: 0.3) 0.73 (SD: 0.3) 81.2 (SD: 2.7)Castle 83 389 56.4 (SD: 17.2) 12.8 (SD: 8.9) 0.87 (SD: 0.2) 0.77 (SD: 0.4) 91.5 (SD: 3.3)Kitchen 120 509 56.2 (SD: 14.0) 16.8 (SD: 10.7) 0.74 (SD: 0.3) 0.80 (SD: 0.2) 80.5 (SD: 3.5)Airport terminal 75 323 55.6 (SD: 13.6) 14.9 (SD: 10.8) 0.76 (SD: 0.3) 0.86 (SD: 0.2) 95.9 (SD: 3.7)Badlands 59 257 52.9 (SD: 20.3) 15.6 (SD: 15.1) 0.82 (SD: 0.3) 0.90 (SD: 0.2) 80.1 (SD: 7.0)Golf course 88 375 52.9 (SD: 17.6) 15.2 (SD: 9.9) 0.84 (SD: 0.3) 0.77 (SD: 0.2) 80.2 (SD: 3.9)Skyscraper 62 271 52.8 (SD: 17.0) 13.5 (SD: 10.6) 0.85 (SD: 0.3) 0.76 (SD: 0.3) 84.4 (SD: 4.3)Tower 86 376 52.7 (SD: 14.3) 18.9 (SD: 13.0) 0.75 (SD: 0.4) 0.83 (SD: 0.3) 82.2 (SD: 3.0)Lighthouse 56 247 52.1 (SD: 15.2) 15.2 (SD: 12.4) 0.78 (SD: 0.4) 0.88 (SD: 0.2) 90.3 (SD: 4.3)Mountain 69 302 50.2 (SD: 21.7) 14.9 (SD: 11.7) 0.87 (SD: 0.2) 0.83 (SD: 0.2) 79.3 (SD: 2.9)Highway 71 348 50.0 (SD: 12.9) 15.0 (SD: 10.4) 0.69 (SD: 0.5) 0.85 (SD: 0.3) 85.9 (SD: 4.6)Cockpit 68 320 49.5 (SD: 17.2) 18.2 (SD: 14.7) 0.70 (SD: 0.5) 0.88 (SD: 0.2) 80.6 (SD: 3.5)
Table 2FIGRIM dataset statistics for AMT 2 (across-category). The targets are the same for AMT 1 and AMT 2. The difference in the number of fillers between AMT 1 and AMT 2 isaccounted for by demo images that were presented to participants at the beginning of each experiment, and are included with the fillers. Each category in AMT 1 had 20 demoimages, while AMT 2 had a total of 42 demo images, sampled from all the categories.
Category Targets Fillers Datapoints/target HR (%) FAR (%) HR cons. (q) FAR cons. (q)
21 scenes 1754 7296 74.3 (SD: 7.5) 66.0 (SD: 13.9) 11.1 (SD: 9.5) 0.74 (SD: 0.2) 0.72 (SD: 0.1)
Table 3A comparison of the memorability scores across different datasets, showing consistency in results and stability of memory performance. Additionally note that for the FIGRIMdataset, when each category was separately tested, the average memorability scores over 21 categories were: 55.9% (SD: 4.2%) for HR and 14.6% (SD: 2.0%) for FAR, showingconsistency with the instance-based databases of faces (Bainbridge et al., 2013) and visualizations (Borkin et al., 2013).
Dataset Targets Fillers Datapoints/target Mean HR (%) Mean FAR (%) HR cons. (q) FAR cons. (q)
FIGRIM 1754 7296 74 66.0 (SD: 13.9) 11.1 (SD: 9.5) 0.74 0.72Isola (Isola, Xiao, et al., 2011) 2222 8220 78 67.5 (SD: 13.6) 10.7 (SD: 7.6) 0.75 0.66Faces (Bainbridge et al., 2013) 2222 6468 82 51.6 (SD: 12.6) 14.4 (SD: 8.7) 0.68 0.69Visualizations (Borkin et al., 2013) 410 1660 87 55.4 (SD: 16.5) 13.2 (SD: 10.7) 0.83 0.78
Z. Bylinskii et al. / Vision Research xxx (2015) xxx–xxx 13
Acknowledgments
We thank Bolei Zhou for his help generating Places-CNN fea-tures, Wilma Bainbridge for helpful discussion, and anonymousreviewers for many helpful suggestions. This work is supportedby the National Science Foundation under Grant No. 1016862 toA.O, as well as Google, Xerox, and MIT Big Data Initiative atCSAIL awards to A.O and A.T. Z.B. is supported by a PostgraduateDoctoral Scholarship from the Natural Sciences and EngineeringResearch Council of Canada. P.I. was supported by a NationalScience Foundation Graduate Research Fellowship.
Appendix
Procedure for in-lab experiment
From each scene category from AMT 1 we obtained the 15 tar-get images with the highest and 15 with the lowest memorabilityscores. This was done to capture the range of memorabilities ofimages in each of the scene categories. These 630 images becamethe targets for our in-lab experiments.5 We recruited a total of
Please cite this article in press as: Bylinskii, Z., et al. Intrinsic and extrinsic effectj.visres.2015.03.005
29 participants for our study (M ¼ 14:8; SD ¼ 2:4 participantsper image), 16 of which were female, with overall mean age 24.9years (SD ¼ 3:8). In a single session, a participant would see asequence of about 1000 images, of which 210 were targets thatrepeated exactly once in the sequence, spaced apart by 91–109images. Images in the test sequence were presented for 2 s each,separated by a fixation cross lasting 0.5 s. Participants wereinstructed to respond (by pressing the spacebar) anytime theynoticed an image repeat in the sequence, at which point theywould receive feedback. In a single experimental session, the tar-gets consisted of 30 images taken from each of 7 randomly selectedscene categories, making up a total of 210 targets. The filler imageswere chosen in equal proportions from the same set of scene cate-gories as the targets. Images were presented on a 19 inch CRTmonitor with a resolution of 1280� 1024 pixels, 22 inches fromthe chinrest mount. Images subtended 30� of visual angle.
Appendix A. Supplementary data
Supplementary data associated with this article can be found, inthe online version, at http://dx.doi.org/10.1016/j.visres.2015.03.005.
s on image memorability. Vision Research (2015), http://dx.doi.org/10.1016/

14 Z. Bylinskii et al. / Vision Research xxx (2015) xxx–xxx
References
Attneave, F. (1959). Applications of information theory to psychology: A summary ofbasic concepts, methods, and results (1st ed.). Rinehart & Winston.
Bainbridge, W. A., Isola, P., & Oliva, A. (2013). The intrinsic memorability of faceimages. Journal of Experimental Psychology: General, 142(4), 1323–1334.
Bartlett, J. C., Hurry, S., & Thorley, W. (1984). Typicality and familiarity of faces.Memory & Cognition, 12(3), 219–228.
Borji, A., & Itti, L. (2014). Defending Yarbus: Eye movements reveal observers’ task.Journal of Vision, 14(3), 1–22.
Borkin, M., Vo, A., Bylinskii, Z., Isola, P., Sunkavalli, S., Oliva, A. et al. (2013). WhatMakes a Visualization Memorable? In: IEEE Transactions on Visualization andComputer Graphics (Infovis).
Brady, T. F., Konkle, T., & Alvarez, G. A. (2011). A review of visual memory capacity:Beyond individual items and toward structured representations. Journal ofVision, 11(5), 1–34.
K. Brodersen, C. Ong, K. Stephan, J. Buhmann, The balanced accuracy and itsposterior distribution, in: International Conference on Pattern Recognition(ICPR), 2010.
Bruce, V., Burton, A., & Dench, N. (1994). What’s distinctive about a distinctive face?The Quarterly Journal of Experimental Psychology, 47(1), 119–141.
Bulling, A., & Roggen, D. (2011). Recognition of visual memory recall processesusing eye movement analysis. In International joint conference on pervasive andubiquitous computing (UbiComp).
Busey, T. (2001). Formal models of familiarity and memorability in face recognition.In M. W. J. Townsend (Ed.), Computation, geometric and process perspectives onfacial cognition: Contexts and challenges. Lawrence Erlbaum Associates Inc.
Chun, M. C., & Turk-Browne, N. B. (2007). Interactions between attention andmemory. Current Opinion in Neurobiology, 17, 177–184.
Curby, K. M., Glazek, K., & Gauthier, I. (2009). A visual short-term memoryadvantage for objects of expertise. Journal of Experimental Psychology: HumanPerception and Performance, 35(1), 94–107.
Eysenck, M. W. (1979). Depth, elaboration, and distinctiveness. In Levels ofprocessing in human memory. Hillsdale, NJ: Lawrence Erlbaum Associates.
Foulsham, T., & Underwood, G. (2008). What can saliency models predict about eyemovements? Fixations during encoding and recognition. Journal of Vision, 8(2),1–17.
Glanzer, M., & Adams, J. (2010). The mirror effect in recognition memory: Data andtheory. Journal of Experimental Psychology: Learning, Memory, and Cognition, 16,5–16.
Greene, M., Liu, T., & Wolfe, J. (2012). Reconsidering Yarbus: A failure to predictobservers’ task from eye movement patterns. Vision Research, 62, 1–8.
Herzmann, G., & Curran, T. (2011). Experts memory: An ERP study of perceptualexpertise effects on encoding and recognition. Memory & Cognition, 39(3),412–432.
Hunt, R. R., & Worthen, J. B. (2006). Distinctiveness and memory. New York: OxfordUniversity Press.
Ihler, A., & Mandel, M. (2014). Kernel density estimation toolbox for MATLAB (R13).<http://www.ics.uci.edu/ihler/code/kde.html> (accessed: 2014-07-21).
Isola, P., Xiao, J., Torralba, A., & Oliva, A. (2011). What makes an image memorable?In IEEE Conference on Computer Vision and Pattern Recognition (CVPR).
Isola, P., Parikh, D., Torralba, A., & Oliva, A. (2011). Understanding the IntrinsicMemorability of Images. In Conference on Neural Information Processing Systems(NIPS).
Isola, P., Xiao, J., Parikh, D., Torralba, A., & Oliva, A. (2014). What makes aphotograph memorable? IEEE Transactions on Pattern Analysis and MachineIntelligence (PAMI), 36(7), 1469–1482.
Jacoby, L. L. (1991). A process dissociation framework: Separating automatic fromintentional uses of memory. Journal of Memory and Language, 30(5), 513–541.
Khosla, A., Xiao, J., Isola, P., Torralba, A., & Oliva, A. (2012). Image memorability andvisual inception. In SIGGRAPH Asia Technical Briefs.
Khosla, A., Xiao, J., Torralba, A., & Oliva, A. (2012) Memorability of image regions. InConference on Neural Information Processing Systems (NIPS).
A. Khosla, A., Bainbridge, W. A., Torralba, A. & Oliva, A. (2013). Modifying thememorability of face photographs. In International Conference on ComputerVision (ICCV).
Please cite this article in press as: Bylinskii, Z., et al. Intrinsic and extrinsic effectj.visres.2015.03.005
Konkle, T., Brady, T. F., Alvarez, G. A., & Oliva, A. (2010). Conceptual distinctivenesssupports detailed visual long-term memory for real-world objects. Journal ofExperimental Psychology: General, 139, 558–578.
Krizhevsky, A., Sutskever, I., & Hinton, G. E. (2012). ImageNet classification withdeep convolutional neural networks. In Conference on neural informationprocessing systems (NIPS).
Mancas, M., & Le Meur, O. (2013). Memorability of natural scene: The role ofattention. In IEEE international conference on image processing (ICIP).
Mandler, G. (2008). Familiarity breeds attempts: A critical review of dual-processtheories of recognition. Perspectives on Psychological Science, 3(5), 390–399.
McGaugh, J. L. (1966). Time-dependent processes in memory storage. Science,153(3742), 1351–1358.
Nairne, J. S. (2006). Modeling distinctiveness: Implications for general memorytheory. In R. R. Hunt & J. B. Worthen (Eds.), Distinctiveness and memory. OxfordUniversity Press.
Noton, D., & Stark, L. (1971). Scanpaths in saccadic eye movements while viewingand recognizing patterns. Vision Research, 11(9), 929–942.
Oliva, A., & Torralba, A. (2001). Modeling the shape of the scene: A holisticrepresentation of the spatial envelope. International Journal of Computer Vision(IJCV), 42(3), 145–175.
Rawsona, K. A., & Overscheldeb, J. P. V. (2008). How does knowledge promotememory? Skilled memory. Journal of Memory and Language, 58(3), 646–668.
Razavian, A. S., Azizpour, H., Sullivan, J. & Carlsson, S. (2014). CNN features off-the-shelf: An astounding baseline for recognition. In IEEE conference on computervision and pattern recognition (CVPR) workshops.
Ross, J., Irani, L., Silberman, M. S., Zaldivar, A., & Tomlinson, B. (2010). Who are thecrowdworkers?: Shifting demographics in mechanical turk. CHI EA ’10. ACM, pp.2863–2872.
Schmidt, S. (1985). Encoding and retrieval processes in the memory forconceptually distinctive events. Journal of Experimental Psychology: Learning,Memory, Cognition, 11(3), 565–578.
Seiffert, C., Khoshgoftaar, T. M., Hulse, J. V., & Napolitano, A. (2010). RUSBoost: Ahybrid approach to alleviating class imbalance. IEEE Transactions on Systems,Man, and Cybernetics, 40(1), 185–197.
Standing, L. (1973). Learning 10,000 pictures. The Quarterly Journal of ExperimentalPsychology, 25(2), 207–222.
Tatler, B. W., Wade, N. J., Kwan, H., Findlay, J. M., & Velichkovsky, B. M. (2010).Yarbus, eye movements, and vision. i-Perception, 1(1), 7–27.
Tuckey, M. R., & Brewer, N. (2003). The influence of schemas, stimulus ambiguity,and interview schedule on eyewitness memory over time. Journal ofExperimental Psychology: Applied, 9(2), 101–118.
Valentine, T. (1991). A unified account of the effects of distinctiveness, inversion,and race in face recognition. The Quarterly Journal of Experimental Psychology,43(2), 161–204.
Vicente, K. J., & Wang, J. H. (1998). An ecological theory of expertise effects inmemory recall. Psychological Review, 105(1), 33–57.
Vogt, S., & Magnussen, S. (2007). Long-term memory for 400 pictures on a commontheme. Experimental Psychology, 54(4), 298–303.
Vokey, J., & Read, J. (1992). Familiarity, memorability, and the effect of typicality onthe recognition of faces. Memory Cognition, 20(3), 291–302.
von Restorff, H. (1933). Bereichsbildungen im Spurenfeld (The effects of fieldformation in the trace field). Psychologische Forschung, 18, 299–342.
Walker, W. R., Vogl, R. J., & Thompson, C. P. (1997). Autobiographical memory:Unpleasantness fades faster than pleasantness over time. Applied CognitivePsychology, 11(5), 399–413.
Wiseman, S., & Neisser, U. (1974). Perceptual organization as a determinant ofvisual recognition memory. The American Journal of Psychology, 87(4), 675–681.
Xiao, J., Hayes, J., Ehinger, K., Oliva, A., & Torralba, A. (2010). SUN database: Large-scale scene recognition from Abbey to Zoo. In IEEE conference on computer visionand pattern recognition (CVPR).
Yarbus, A. (1967). Eye movements and vision. New York: Plenum Press.Zhou, B., Lapedriza, A. Xiao, J., Torralba, A.& Oliva, A. (2014). Learning deep features
for scene recognition using places database. In Conference on Neural InformationProcessing Systems (NIPS).
Zhou, B., Khosla, A., Lapedriza, A., Oliva, A., & Torralba, A. (2015). Object detectorsemerge in deep scene CNNs. arXiv:1412.6856.
s on image memorability. Vision Research (2015), http://dx.doi.org/10.1016/