
Intraspecific variation in M enamel development in modern ... · a crucial role in organizing and...
17
Intraspecific variation in M 1 enamel development in modern humans: implications for human evolution Patrick Mahoney Department of Archaeology, University of Sheffield, Sheffield S1 4ET, England, UK Received 25 April 2007; accepted 4 February 2008 Abstract The timing and sequence of enamel development, as well as enamel thickness, was documented for individual cusps (protoconid, hypoconid, metaconid, entoconid) in 15 unworn permanent lower first molars (M 1 s) from a sample of modern human juveniles. These data were compared with previously published data for modern and fossil species reported in the literature. Crown formation in all teeth was initiated in the protoconid and completed in the hypoconid. These cusps had significantly longer formation times (2.91 and 2.96 yrs, respectively) than the metaconid and entoconid (2.52 and 2.38 yrs, respectively), as well as thicker enamel, and each represented between 92e95% of the total crown formation time. Rates of enamel secretion in all cusps increased significantly from 2.97 mm in the inner enamel to 4.47 mm in the outer enamel. Two cusps of one individual were studied in more detail and did not follow this typical trajectory. Rather, there was a sharp decrease in the middle of enamel formation and then a slow recovery of secretion rates from the mid- to outer enamel. This anomalous trajectory of enamel formation is discussed in the context of other nondental tissue responses to illness. Neither secretion rates nor periodicity differed significantly when compared between the cusps of each molar. Differences in cusp formation times, initiation, and completion suggest a relationship between the rates of enamel formation and enamel thickness. This fits with expectations about the mechanics of the chewing cycle and general lower molar morphology. A comparison with similar data for some nonhuman primates and fossil hominoids suggests this relationship may hold true across several primate taxa. Other aspects of enamel growth differed between this human sample and certain fossil species. The lower molars formed slowly over a longer period of time, which may reflect the extended growth period of modern humans. The methodological approach adopted in this study is discussed in the context of that used in other studies. Ó 2008 Elsevier Ltd. All rights reserved. Keywords: Dental development; Daily enamel secretion rates; Periodicity; Histology Introduction Understanding dental development in extant species is fun- damental to understanding dental development in an evolution- ary context. Yet, there is much to learn about intraspecific variation in modern human molar development from studies of enamel histology. These internal microscopic structures within teeth retain a record of growth in the form of incremen- tal markings. Counts and measures of these markings can provide detailed chronological information about the way a tooth formed, such as the sequence and timing of enamel development (Boyde, 1963, 1990; Bromage, 1991; Dean et al., 1993, Dean, 1998; Reid et al., 1998a,b). Because of this, histological methods are sometimes used to examine den- tal development in fossil species. Data of this kind needs to be interpreted by comparisons with extant species, through which insights can be gained into the evolution of different growth patterns (e.g., Bromage and Dean, 1985; Dean, 1987; Ramirez Rozzi, 1993; Macho et al., 1996; Beynon et al., 1998; Dean et al., 2001; Kelley et al., 2001; Dean and Schrenk, 2003; Schwartz et al., 2003, 2007; Smith et al., 2003, 2004; Mahoney et al., 2007). Yet, while there are some good data about intra- specific variation in the sequence and timing of molar cusp formation in modern humans, mostly obtained using these methods, there is still much more to be learned (Reid et al., E-mail address: p.mahoney@sheffield.ac.uk 0047-2484/$ - see front matter Ó 2008 Elsevier Ltd. All rights reserved. doi:10.1016/j.jhevol.2008.02.004 Available online at www.sciencedirect.com Journal of Human Evolution 55 (2008) 131e147
Transcript of Intraspecific variation in M enamel development in modern ... · a crucial role in organizing and...
Available online at www.sciencedirect.com
Journal of Human Evolution 55 (2008) 131e147
Intraspecific variation in M1 enamel development in modern humans:implications for human evolution
Patrick Mahoney
Department of Archaeology, University of Sheffield, Sheffield S1 4ET, England, UK
Received 25 April 2007; accepted 4 February 2008
Abstract
The timing and sequence of enamel development, as well as enamel thickness, was documented for individual cusps (protoconid, hypoconid,metaconid, entoconid) in 15 unworn permanent lower first molars (M1s) from a sample of modern human juveniles. These data were comparedwith previously published data for modern and fossil species reported in the literature.
Crown formation in all teeth was initiated in the protoconid and completed in the hypoconid. These cusps had significantly longer formationtimes (2.91 and 2.96 yrs, respectively) than the metaconid and entoconid (2.52 and 2.38 yrs, respectively), as well as thicker enamel, and eachrepresented between 92e95% of the total crown formation time. Rates of enamel secretion in all cusps increased significantly from 2.97 mm inthe inner enamel to 4.47 mm in the outer enamel. Two cusps of one individual were studied in more detail and did not follow this typicaltrajectory. Rather, there was a sharp decrease in the middle of enamel formation and then a slow recovery of secretion rates from the mid-to outer enamel. This anomalous trajectory of enamel formation is discussed in the context of other nondental tissue responses to illness. Neithersecretion rates nor periodicity differed significantly when compared between the cusps of each molar.
Differences in cusp formation times, initiation, and completion suggest a relationship between the rates of enamel formation and enamelthickness. This fits with expectations about the mechanics of the chewing cycle and general lower molar morphology. A comparison with similardata for some nonhuman primates and fossil hominoids suggests this relationship may hold true across several primate taxa. Other aspects ofenamel growth differed between this human sample and certain fossil species. The lower molars formed slowly over a longer period of time,which may reflect the extended growth period of modern humans. The methodological approach adopted in this study is discussed in the contextof that used in other studies.� 2008 Elsevier Ltd. All rights reserved.
Keywords: Dental development; Daily enamel secretion rates; Periodicity; Histology
Introduction
Understanding dental development in extant species is fun-damental to understanding dental development in an evolution-ary context. Yet, there is much to learn about intraspecificvariation in modern human molar development from studiesof enamel histology. These internal microscopic structureswithin teeth retain a record of growth in the form of incremen-tal markings. Counts and measures of these markings canprovide detailed chronological information about the waya tooth formed, such as the sequence and timing of enamel
E-mail address: [email protected]
0047-2484/$ - see front matter � 2008 Elsevier Ltd. All rights reserved.
doi:10.1016/j.jhevol.2008.02.004
development (Boyde, 1963, 1990; Bromage, 1991; Deanet al., 1993, Dean, 1998; Reid et al., 1998a,b). Because ofthis, histological methods are sometimes used to examine den-tal development in fossil species. Data of this kind needs to beinterpreted by comparisons with extant species, through whichinsights can be gained into the evolution of different growthpatterns (e.g., Bromage and Dean, 1985; Dean, 1987; RamirezRozzi, 1993; Macho et al., 1996; Beynon et al., 1998; Deanet al., 2001; Kelley et al., 2001; Dean and Schrenk, 2003;Schwartz et al., 2003, 2007; Smith et al., 2003, 2004; Mahoneyet al., 2007). Yet, while there are some good data about intra-specific variation in the sequence and timing of molar cuspformation in modern humans, mostly obtained using thesemethods, there is still much more to be learned (Reid et al.,
132 P. Mahoney / Journal of Human Evolution 55 (2008) 131e147
1998a; Reid and Dean, 2006). Variations in cusp initiation andformation times are still poorly documented aspects of enamelgrowth and presently reduce the scope for comparativeinterpretations.
The aim of the present study was to document developmen-tal variation in 15 unworn permanent, erupted, lower first molarcrowns (M1s) from modern human juveniles. Pre- and postnatalcusp formation times, daily rates of enamel secretion, Retziusline periodicity, the sequence of cusp initiation and completion,as well as enamel thickness at the cusp tip, were comparedwithin and between the cusps of each molar tooth type. Totalcrown formation time (CFT) was also calculated. Comparisonswere made within and between the cusps, and with data fromextant and fossil species drawn from the published literature.
Background
Amelogenesis and growth lines
Amelogenesis, enamel formation, occurs through a continu-ous presecretory, secretory, and maturation process. During thepresecretory part of the process, cells of the inner dental epi-thelium differentiate into enamel forming cells, ameloblasts,initially at the tip of the cusp, and then subsequently towardsthe cervix along the enamel-dentine junction (Nanci, 2003).The secretory part of the process commences as fully differen-tiated ameloblasts secrete enamel matrix proteins containing90e95% amelogenins, a heterogeneous group of low-molecu-lar-weight proteins, and 5e10% nonamelogenins, a less wellknown group including ameloblastin and tuftelin (Boyde,1989; Eisenmann, 1998; Nanci, 2003). Enamel proteins playa crucial role in organizing and controlling the orientation ofcalcium phosphate crystals (hydroxyapatite) within the crys-tallites that make up the enamel prisms (Berkovitz et al.,2002). Enamel grows in thickness as secretory ameloblasts de-posit incremental layers of enamel as they move away fromthe enamel-dentine junction (EDJ) toward the future outerenamel surface. At the same time, ameloblasts continue to dif-ferentiate, or extend, along the EDJ towards the enamel cervix.The path of the ameloblasts determines the path of prisms inthe fully formed tissue. A prism, therefore, is a bundle of hy-droxyapatite crystallites oriented with respect to the long axisof the prism path (Boyde, 1989). Abrupt differences in the ori-entation of crystallites within adjacent prisms define theboundaries between prisms (Eisenmann, 1998). The secretoryprocess ends as the full thickness of enamel is attained, atwhich stage the newly formed enamel is only partially miner-alized (65% water, 20% organic material, 15% hydroxyapatiteby weight; Berkovitz et al., 2002).
Maturational ameloblasts undergo a morphological changeat the end of the secretory phase but continue to secrete calciumand phosphate ions that are continuously incorporated into thematuring enamel and account for the increasing dimensions ofthe crystallites and increasing hardness of the enamel. Matura-tional ameloblasts also remove degraded proteins (primarilyamelogenins) and water to make space for these ions (Berko-vitz et al., 2002; Nanci, 2003). Fully mature enamel is almost
entirely a calcified tissue (95e96% by weight correspondingto 88e90% by volume).
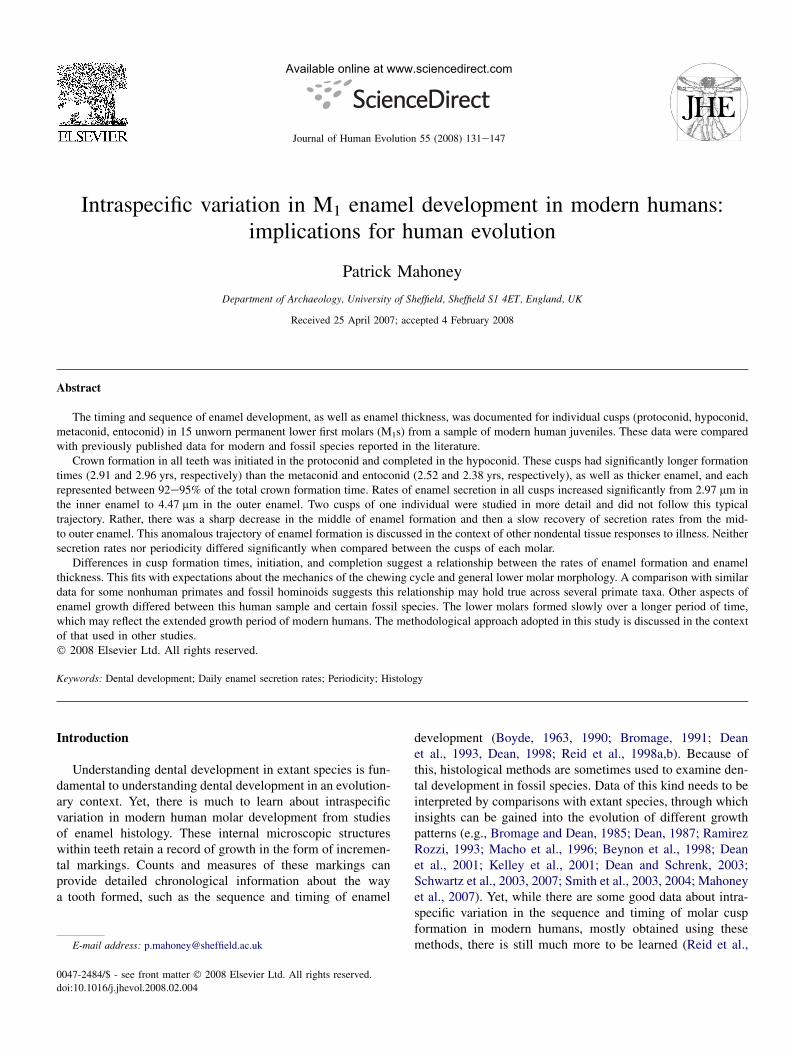
The forming enamel front is subject to periodic changes andregular variations in ameloblast activity. These variations pro-duce short- and long-period incremental (growth) lines in theenamel (Fig. 1). Short-period growth lines, or cross-striations,represent a daily circadian rhythm in secretory ameloblast ac-tivity (see Dean, 1995 and FitzGerald, 1998 for reviews), andalthough their etiology is not entirely clear, some suspect(Darling, 1958; Driessens et al. 1984; Boyde, 1989) that theymay reflect regular variations in mineral composition [or shiftsin hydrogen ion concentration (i.e., pH)]. Under transmittedlight, these variations along the prism alter the refractive indexof enamel, making them visible as cross striations. Long-periodgrowth lines, or Retzius lines, mark the layers of enamelproduced by the secretory ameloblasts, which occur every6e12 days in modern humans (Schwartz et al., 2001; Reidand Ferrell, 2006). These layers are visible under transmittedlight within the enamel cusp, also referred to as appositionalenamel, but emerge as perikymata on the outer surface of im-bricational enamel (Dean, 1987; Risnes, 1990; Shellis, 1998).Short- and/or long-period growth lines have both been usedto calculate rates of enamel secretion, Retzius line periodicity,and cusp formation times. These are discussed in detail in themethodology.
Episodes of systemic stress occur during enamel formationand produce accentuated growth lines. Internally, some ofthese lines are known as Wilson bands, and on the crown sur-face they appear as a type of hypoplasia (Gustafson, 1959;Hillson and Bond, 1997; also see Fig. 1, where a Wilsonband is followed by a surface hypoplasia). Given that prenatalenamel does not normally contain markedly accentuatedlines, the first line is thought to mark a brief period of disrup-tion to enamel secretion during birth. This line is known asthe neonatal line (Rushton, 1933; Schour, 1936; Christensand Kraus, 1965; Kraus and Jordan, 1965; Beynon et al.,1991a; Berkovitz et al., 2002; Schwartz et al., 2005). In stud-ies of dental development the location of the neonatal line isan important indicator for calculating prenatal and postnatalenamel formation times. Accentuated growth lines havealso been used to determine the growth sequence betweenthe teeth or cusps of the same individual (e.g., Tagiguchi,1966; Reid et al., 1998a,b; Antoine, 2001).
The sequence and timing of molar cusp development inmodern humans
Few studies of permanent M1 enamel histology have deter-mined the growth sequence (initiation and completion) betweenthe mesial (protoconid, metaconid) and distal (hypoconid, ento-conid) cusps, or differences in formation times between thesecusps. A study of five M1s showed that the protoconid wasthe first cusp to initiate formation, and this was followed by ei-ther the hypoconid or metaconid (Antoine, 2001). A study ofone M1 also recorded prenatal cusp initiation in the protoconid,and documented postnatal cusp completion in the hypoconid(Reid et al., 1998a). As part of their study, Reid and Dean
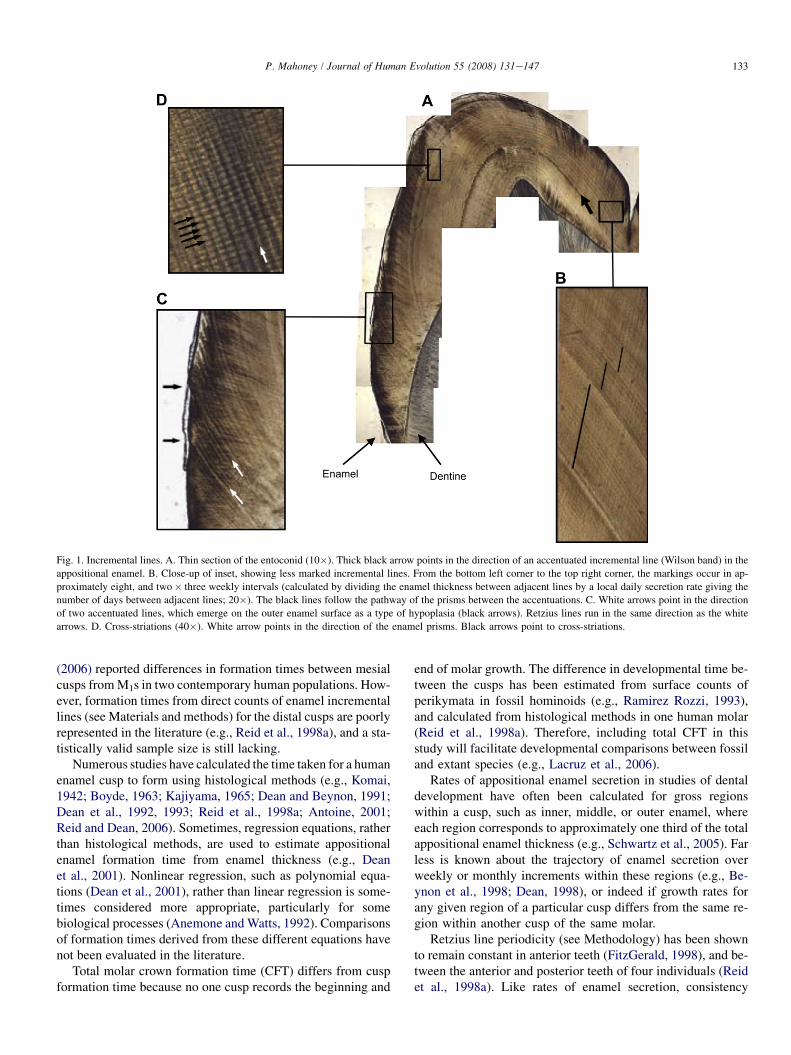
Fig. 1. Incremental lines. A. Thin section of the entoconid (10�). Thick black arrow points in the direction of an accentuated incremental line (Wilson band) in the
appositional enamel. B. Close-up of inset, showing less marked incremental lines. From the bottom left corner to the top right corner, the markings occur in ap-
proximately eight, and two� three weekly intervals (calculated by dividing the enamel thickness between adjacent lines by a local daily secretion rate giving the
number of days between adjacent lines; 20�). The black lines follow the pathway of the prisms between the accentuations. C. White arrows point in the direction
of two accentuated lines, which emerge on the outer enamel surface as a type of hypoplasia (black arrows). Retzius lines run in the same direction as the white
arrows. D. Cross-striations (40�). White arrow points in the direction of the enamel prisms. Black arrows point to cross-striations.
133P. Mahoney / Journal of Human Evolution 55 (2008) 131e147
(2006) reported differences in formation times between mesialcusps from M1s in two contemporary human populations. How-ever, formation times from direct counts of enamel incrementallines (see Materials and methods) for the distal cusps are poorlyrepresented in the literature (e.g., Reid et al., 1998a), and a sta-tistically valid sample size is still lacking.
Numerous studies have calculated the time taken for a humanenamel cusp to form using histological methods (e.g., Komai,1942; Boyde, 1963; Kajiyama, 1965; Dean and Beynon, 1991;Dean et al., 1992, 1993; Reid et al., 1998a; Antoine, 2001;Reid and Dean, 2006). Sometimes, regression equations, ratherthan histological methods, are used to estimate appositionalenamel formation time from enamel thickness (e.g., Deanet al., 2001). Nonlinear regression, such as polynomial equa-tions (Dean et al., 2001), rather than linear regression is some-times considered more appropriate, particularly for somebiological processes (Anemone and Watts, 1992). Comparisonsof formation times derived from these different equations havenot been evaluated in the literature.
Total molar crown formation time (CFT) differs from cuspformation time because no one cusp records the beginning and
end of molar growth. The difference in developmental time be-tween the cusps has been estimated from surface counts ofperikymata in fossil hominoids (e.g., Ramirez Rozzi, 1993),and calculated from histological methods in one human molar(Reid et al., 1998a). Therefore, including total CFT in thisstudy will facilitate developmental comparisons between fossiland extant species (e.g., Lacruz et al., 2006).
Rates of appositional enamel secretion in studies of dentaldevelopment have often been calculated for gross regionswithin a cusp, such as inner, middle, or outer enamel, whereeach region corresponds to approximately one third of the totalappositional enamel thickness (e.g., Schwartz et al., 2005). Farless is known about the trajectory of enamel secretion overweekly or monthly increments within these regions (e.g., Be-ynon et al., 1998; Dean, 1998), or indeed if growth rates forany given region of a particular cusp differs from the same re-gion within another cusp of the same molar.
Retzius line periodicity (see Methodology) has been shownto remain constant in anterior teeth (FitzGerald, 1998), and be-tween the anterior and posterior teeth of four individuals (Reidet al., 1998a). Like rates of enamel secretion, consistency
Table 1
The skeletal sample (n¼ 15)
134 P. Mahoney / Journal of Human Evolution 55 (2008) 131e147
between cusps is now usually assumed but not often indepen-dently documented.
Archaeological site Skeleton number
Scotland
West Fenton, East Lothiana 11b
Modern human first molar enamel thickness at thecusp tip
Ardachy, Bunessan, Mull 14
Home Mains Farm, Invernessc 31
Harveston Cottage, Catterlined 36
Nunraw Mains, East Lothiana 48
England
Porton, Wiltshiree 57
Aldro, Yorkshiref 59
Garton Slack, Yorkshiref 60
Painsthorpe Wold, Yorkshiref 75
Aldro, Yorkshiref 80
Aldro, Yorkshiref 82
Garton Slack, Yorkshiref 87
Garton Slack, Yorkshiref 100
Garton Slack, Yorkshiref 105
Aldro, Yorkshiref 116
a Childe et al. (1944).b Mitchell (1897).c Brown (2003).d Small et al. (1988).e Unpublished.f Mortimer (1905).
Linear enamel thickness measured from thin sections candiffer between modern human M1 mesial cusps. In general,and depending on the plane sectioned, enamel is thicker onthe protoconid than the metaconid (Shillingburg and Grace,1973; Khera et al., 1990; Schwartz, 2000a; Reid and Dean,2006; Smith et al., 2006), though this can vary at the cusptip (Kono et al., 2002; Grine, 2005; Suwa and Kono, 2005).Differences in enamel thickness between molar cusps havebeen related to functional differences during chewing. For in-stance, the buccal cusps (protoconid, hypoconid) of mandibu-lar molars, the so-called functional cusps, are mainly involvedin crushing and grinding food during chewing, whereas the so-called nonfunctional lingual cusps (metaconid, entoconid)largely shear food (Kay and Hiiemae, 1974; Kay, 1977).Thicker enamel in the functional cusps of both mandibularand maxillary molars may provide increased resistance towear, to greater mechanical loads, and resistance to fracture(Shillingburg and Grace, 1973; Gantt, 1977; Molnar andGantt, 1977; Grine and Martin, 1988; Khera et al., 1990;Macho and Thackeray, 1992; Macho and Berner, 1993,1994; Spears and Macho, 1995; Schwartz, 2000a,b; Ganttet al., 2001; Grine, 2005).
Several studies have reported linear measurements takenfrom thin sections of the distal cusps of human M1s (Shilling-burg and Grace, 1973; Grine and Martin, 1988; Shellis et al.,1998; Smith et al., 2006). Of these, the study undertaken onthe largest sample size (n¼ 16e20) was by Shillingburg andGrace (1973), who showed that enamel thickness did not in-crease from the mesial to the distal cusp tips. In contrast, a re-cent three dimensional micro-CT based study reported thickerenamel over the hypoconid cusp tip compared to the protoconid(Kono et al., 2002).
Materials and methods
The dental sample
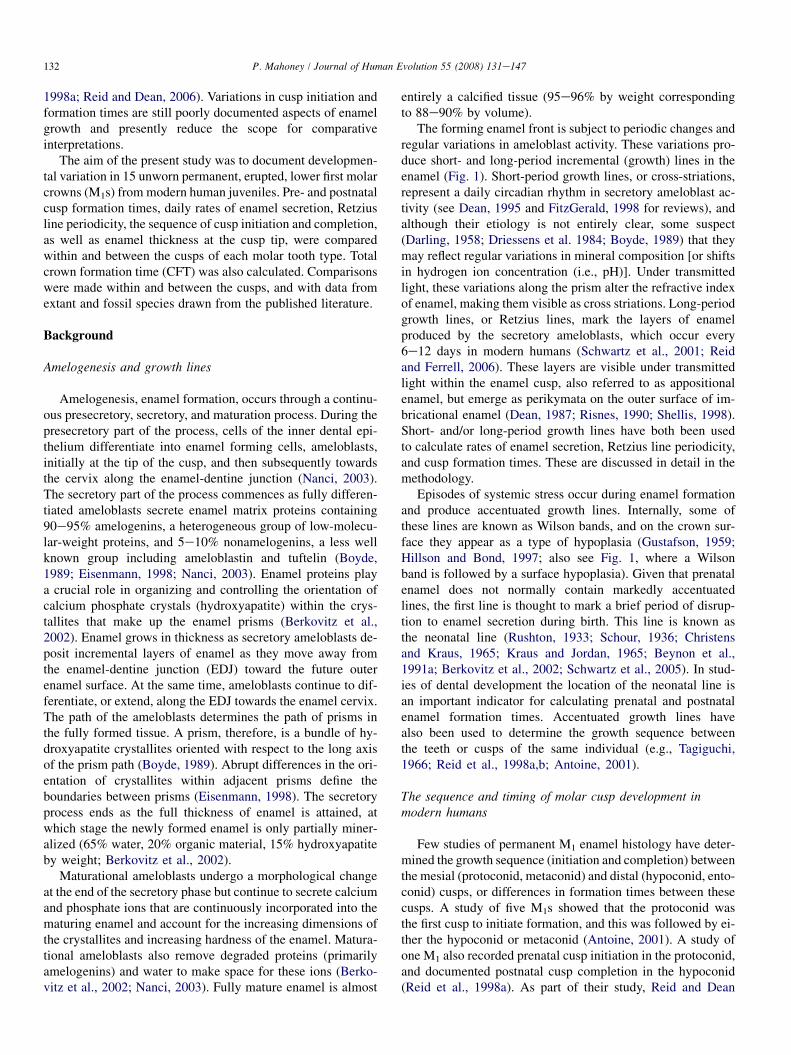
Fifteen erupted but unworn permanent M1s were selectedfrom human juvenile skeletons recovered from nine archaeo-logical sites dating to the British Bronze Age (2,300e700BC; Table 1; Fig. 2). Unworn molars from juveniles werechosen so that appositional formation times did not need toinclude an estimate for worn enamel.
Sample preparation
Each molar was replicated prior to removal for sectioning,and an epoxy cast was prepared (e.g., Mahoney, 2007). Con-taminants were removed from the enamel surface of each molarusing ethanol and cotton wool. An impression of the enamelsurface was taken using a rubber-based, addition-curing
silicone (Coltene President Jet, lightbody). The outer surfaceof the impression was surrounded with Coltene President Puttyfor stability. A cast of the inside of the impression was pro-duced using an epoxy resin (Araldite MY 753, hardener HY956, Ciba-Geigy).
Standard histological procedures were followed (e.g.,Schwartz et al., 2005). The molars were embedded in polyes-ter resin to reduce the risk of splintering while sectioning. Us-ing a diamond-wafering blade saw (Buehler� Isomet lowspeed), longitudinal sections between 180e200 mm weretaken through the mesial cusp tips and dentine horns of eachmolar. A second section was made through the distal cusptips. Each section was mounted on a microscope slide, lappedto 100e120 mm using a graded series of grinding pads (Bueh-ler�), polished with a 0.3 mm aluminium oxide powder, placedin an ultrasonic bath to remove surface debris, dehydratedthrough a series of alcohol baths, cleared (using Histoclear�)and mounted with a cover slip using a xylene-based mountingmedium (DPX�). Each section was examined using polarizedlight microscopy (Zeiss Axioskop 40), and an image was taken(Q-Imaging Micropublisher 5.0 RTU, 1999e2008). Aspects ofenamel microstructure and thickness were recorded using im-age analysis software (Image-Pro Express, 1993e2005).
Daily rates of enamel secretion
Two methods were used to calculate daily secretion rates(DSR) in the appositional enamel. The first method was ap-plied to the entire sample. Daily secretion rates were calcu-lated by dividing the appositional enamel into three regionsof equal thickness (inner, middle, and outer; see Fig. 3). Dailyenamel secretion rates were measured along the long axis of
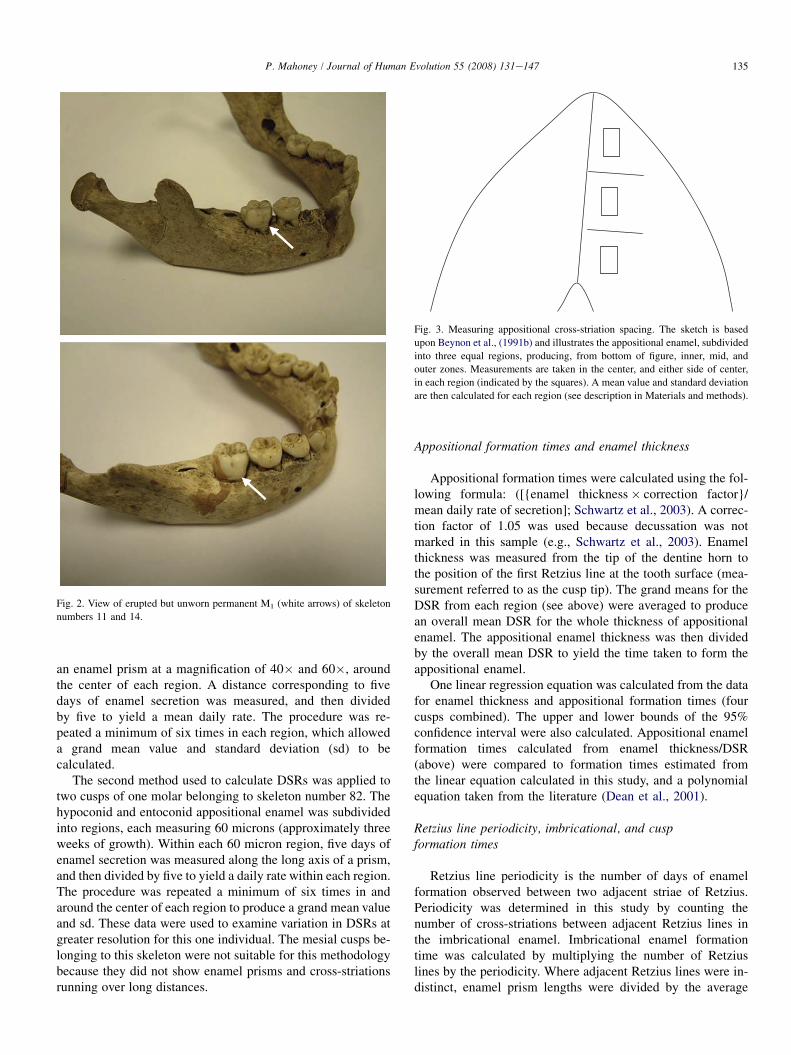
Fig. 3. Measuring appositional cross-striation spacing. The sketch is based
upon Beynon et al., (1991b) and illustrates the appositional enamel, subdivided
into three equal regions, producing, from bottom of figure, inner, mid, and
outer zones. Measurements are taken in the center, and either side of center,
in each region (indicated by the squares). A mean value and standard deviation
are then calculated for each region (see description in Materials and methods).
Fig. 2. View of erupted but unworn permanent M1 (white arrows) of skeleton
numbers 11 and 14.
135P. Mahoney / Journal of Human Evolution 55 (2008) 131e147
an enamel prism at a magnification of 40� and 60�, aroundthe center of each region. A distance corresponding to fivedays of enamel secretion was measured, and then dividedby five to yield a mean daily rate. The procedure was re-peated a minimum of six times in each region, which alloweda grand mean value and standard deviation (sd) to becalculated.
The second method used to calculate DSRs was applied totwo cusps of one molar belonging to skeleton number 82. Thehypoconid and entoconid appositional enamel was subdividedinto regions, each measuring 60 microns (approximately threeweeks of growth). Within each 60 micron region, five days ofenamel secretion was measured along the long axis of a prism,and then divided by five to yield a daily rate within each region.The procedure was repeated a minimum of six times in andaround the center of each region to produce a grand mean valueand sd. These data were used to examine variation in DSRs atgreater resolution for this one individual. The mesial cusps be-longing to this skeleton were not suitable for this methodologybecause they did not show enamel prisms and cross-striationsrunning over long distances.
Appositional formation times and enamel thickness
Appositional formation times were calculated using the fol-lowing formula: ([{enamel thickness� correction factor}/mean daily rate of secretion]; Schwartz et al., 2003). A correc-tion factor of 1.05 was used because decussation was notmarked in this sample (e.g., Schwartz et al., 2003). Enamelthickness was measured from the tip of the dentine horn tothe position of the first Retzius line at the tooth surface (mea-surement referred to as the cusp tip). The grand means for theDSR from each region (see above) were averaged to producean overall mean DSR for the whole thickness of appositionalenamel. The appositional enamel thickness was then dividedby the overall mean DSR to yield the time taken to form theappositional enamel.
One linear regression equation was calculated from the datafor enamel thickness and appositional formation times (fourcusps combined). The upper and lower bounds of the 95%confidence interval were also calculated. Appositional enamelformation times calculated from enamel thickness/DSR(above) were compared to formation times estimated fromthe linear equation calculated in this study, and a polynomialequation taken from the literature (Dean et al., 2001).
Retzius line periodicity, imbricational, and cuspformation times
Retzius line periodicity is the number of days of enamelformation observed between two adjacent striae of Retzius.Periodicity was determined in this study by counting thenumber of cross-striations between adjacent Retzius lines inthe imbricational enamel. Imbricational enamel formationtime was calculated by multiplying the number of Retziuslines by the periodicity. Where adjacent Retzius lines were in-distinct, enamel prism lengths were divided by the average

Table 2a
Mean molar cusp daily enamel secretion rates (in mm per day)
Inner Mid Outer
Mean 2.97 4.15 4.55
Min 2.38 3.36 3.64
Max 3.59 4.96 5.45
�1SD 0.51 0.56 0.61
136 P. Mahoney / Journal of Human Evolution 55 (2008) 131e147
secretion rates in the region to estimate imbricational enamelformation times (for a description see Mahoney et al., 2007).The total enamel formation time in each cusp was calculatedby summing the time taken to form the appositional and imbri-cational enamel. Appositional and imbricational formationtimes, as well as enamel thickness measurements for eachcusp, are included in the tables so that others may reuse thedata and construct their own analyses.
Prenatal enamel formation times
Prenatal enamel formation time was calculated by locatingthe position of the neonatal line. The enamel thickness betweenthis line and the dentine horn was measured and divided bya local DSR, taken around the center of the prenatal enamel.The neonatal line is the first markedly accentuated line in thecusp enamel, though it is not always present.
Sequence of cusp growth
The sequence of cusp growth (initiation and completion)was determined by locating the position of the neonatalline in the protoconid, and the position of subsequent accen-tuated growth lines. The time elapsed between the neonatalline and each accentuated growth line was calculated bydividing the enamel thickness by local DSRs, thus determin-ing a chronology of growth disturbances. The chronology ofdisturbances was then sought in and matched between the re-maining cusps.
Total crown formation times
Table 2b
Mean molar cusp daily enamel secretion rates by cusp (in mm per day)
Once the growth sequence was established (above) the totalCFT was calculated as the protoconid formation time summedwith the period of additional and final growth that is recordedin the hypoconid (but which is missing from the protoconid).
Cusp Min Max Mean �1SD
Statistical procedures PrdaInner (13) 2.43 3.64 3.08 0.55
Mid (15) 3.44 4.97 4.14 0.52
Outer (15) 3.91 5.90 4.60 0.69
Medb
Inner (13) 2.33 3.78 3.01 0.48
Mid (13) 3.23 5.16 4.26 0.54
Outer (13) 3.56 5.58 4.61 0.64
Hydc
Inner (15) 2.24 3.67 2.86 0.51
Mid (15) 3.37 4.89 4.13 0.62
Outer (14) 3.47 5.12 4.41 0.50
Endd
Inner (12) 2.55 3.29 2.93 0.47
Mid (14) 3.40 4.83 4.09 0.54
Paired-samples t-tests were used to localize significant dif-ferences in DSRs between the inner, mid, and outer enamelwithin and between each cusp. This test was also used to iden-tify differences in appositional enamel thickness, and apposi-tional and imbricational formation times between cusps.This test assumes that the differences calculated for eachpair have a normal distribution (Norusis, 1993), and this waschecked with a one-sample Kolmogorov-Smirnov test. Pear-son’s correlation coefficient was used to measure the strengthof the association between enamel thickness and appositionalformation time.
Results
Outer (14) 3.63 5.23 4.59 0.67Pre-natal DSR ¼ 2.04 mm � 0.33 (11).a
Daily enamel secretion ratesProtoconidb Metaconidc Hypoconidd Entoconid
Average DSRs increased significantly from the inner to theouter enamel in each cusp (Tables 2ae2c). No significant
differences occurred between the inner, mid, and outer enamel,when compared between cusps. Recalculating average DSRssubdivided by successive 60-mm regions for the hypoconidappositional enamel from skeleton number 82 shows a gradualincrease from 2.51 mm to 3.80 mm over a period of 216 days(Table 3a; Fig. 4). Following this, the DSR dropped to2.91 mm over 39 days. The DSR then gradually returned to3.81 mm over 105 days. Recalculating average DSRs subdi-vided by 60 mm regions for the entoconid from skeleton num-ber 82 shows an increase in DSR from 2.55 mm to 3.73 mmover 168 days (Table 3b). The DSR then dropped to2.84 mm over 39 days. The DSR then gradually returned to3.79 mm over 108 days.
Enamel thickness and appositional formation times
Buccal cusp tip enamel thickness was significantly greaterthan that of the lingual cusps (Tables 4a and 4b). The longerappositional formation times for the buccal cusps differed sig-nificantly from the shorter formation times for both the lingualcusps (Tables 5a and 5b). Correlations indicate a significantand strong positive association between appositional enamelthickness and formation time when the data for the four cusps

Table 2c
Comparing daily enamel secretion rates within cusps
Cuspa Inner vs. Middle Inner vs. Outer Middle vs. Outer
t df p t df p t df p
Prd �7.518 12 0.000* �7.307 12 0.000* �4.249 14 0.001*
Med �5.523 12 0.000* �6.482 12 0.000* �3.830 12 0.003*
Hyd �6.691 14 0.000* �7.279 13 0.000* �1.421 13 0.179
End �5.474 11 0.002* �3.850 11 0.012* �3.573 13 0.007*
*¼ Significant difference; p values of 0.000 are rounded and indicate at least p < 0.0001.a Abbreviations the same as in Table 2b.
137P. Mahoney / Journal of Human Evolution 55 (2008) 131e147
is combined (Pearson’s r¼ 0.820; p¼ 0.0001). When subdi-vided by cusps the association is still strong for the protoconid(Pearson’s r¼ 0.793; p¼ 0.001), and entoconid (Pearson’sr¼ 0.829; p� 0.0001), and weaker but still significant forthe metaconid (Pearson’s r¼ 0.746; p¼ 0.003) and hypoconid(Pearson’s r¼ 0.699; p¼ 0.004).
One linear regression equation was calculated from the datafor the four cusps, where y is the number of days of enamelformation, and x is enamel thickness in mm:
y¼ 58:292þ ð0:226xÞ:
The upper and lower bounds of the 95% confidence intervalare:
lower bound : y¼ 2:160þ ð0:183xÞ
upper bound : y¼ 114:424þ ð0:269xÞ
Retzius line periodicity, imbricational, and cuspformation times.
Periodicity was recorded in more than one cusp for ten in-dividuals. No variation occurred between the cusps of these in-dividuals (Table 6). Peridocity varied between individuals,ranging between 6 to 9 days, with a mode of 7. The longer
Table 3a
Enamel secretion rates in the hypoconid cuspal enamel of skeleton no. 82a
Inner enamel Mid
EDb (mm) DSRc DPRd ED D
60 2.51� 0.03 24 480 3.60�120 2.73� 0.13 22 540 3.71�180 3.10� 0.11 19 600 3.79�240 3.33� 0.16 18 660 3.75�300 3.37� 0.19 18 720 3.80�360 3.49� 0.22 17 780 3.41�420 3.53� 0.13 17 840 2.91�
3.15� 0.14e 135f 3.56�a The data in Table 3 was derived from prism lengths and DSRs, for successive 6
Recalculating the data in Table 3 using the formula [(enamel thickness� correction
in the methodology] gives a similar estimate of 388 days.b Enamel depth.c Mean daily rate of enamel secretion for each 60 mm region of enamel� 1SD.d Days per region¼ number of days taken to form each 60 mm region of enamee Mean daily secretion rate for the inner enamel� 1SD.f Number of days taken to form the inner enamel.
imbricational formation times for the buccal cusps differedsignificantly from the shorter formation times for the lingualcusps (Tables 5a and 5b). A significant difference also oc-curred between the imbricational formation times of the meta-conid and entoconid. Summing the appositional andimbricational formation times gave a mean cusp formationtime of 1,062 days (2.91 yrs) for the protoconid, 1,082 days(2.96 yrs) for the hypoconid, 919 days (2.52 yrs) for the meta-conid, and 868 days (2.38 yrs) for the entoconid (Table 5a).
Prenatal growth, sequence of cusp growth, total CFT
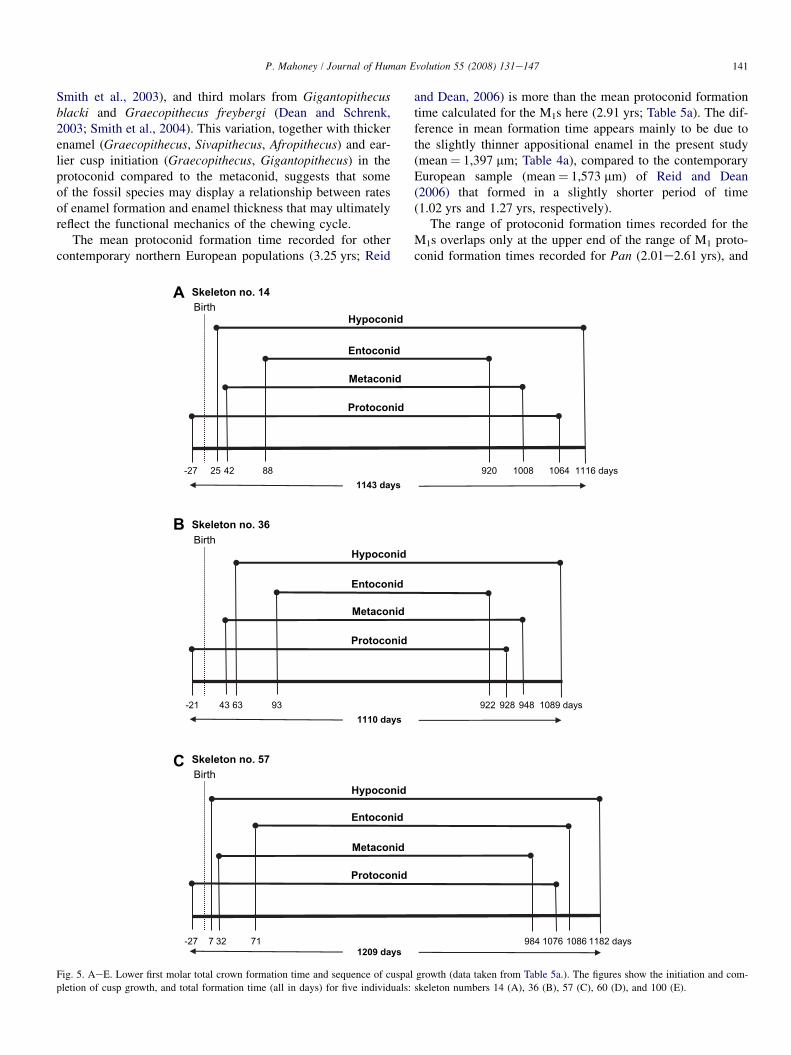
Prenatal enamel growth was initiated in the protoconid be-tween 10 to 48 days before birth in eleven individuals(Table 5a). The sequence of cusp initiation and completionwas recorded for five of these individuals (Fig. 5AeE). Forthese five individuals, no evidence was found for prenatal enamelformation in any other cusp. Following the protoconid, growthinitiated after birth in either the hypoconid (min¼ 7 days;max¼ 63 days) or the metaconid (min¼ 27 days; max¼ 43days). The entoconid was consistently the last cusp to initiate(min¼ 58 days; max¼ 93 days). The hypoconid was consis-tently the last cusp to complete formation in each individualcrown (min¼ 950 days; max¼ 1,182 days). The sequence ofcusp completion varied between the entoconid (min¼ 874days; max¼ 1,086 days), the metaconid (min¼ 813 days;
enamel Outer enamel
SR DPR ED DSR DPR
0.13 17 900 3.01� 0.26 20
0.14 16 960 3.31� 0.20 18
0.08 16 1020 3.49� 0.11 17
0.24 16 1080 3.61� 0.37 17
0.23 16 1140 3.63� 0.33 17
0.20 18 1200 3.81� 0.21 16
0.21 21 1260 3.80� 0.43 16
0.18 120 3.52� 0.28 121
0 mm regions, to give an estimate of 376 days for appositional formation time.
factor)/mean daily rate of secretion]; Schwartz et al., 2003; also see description
l (enamel depth/DSR).
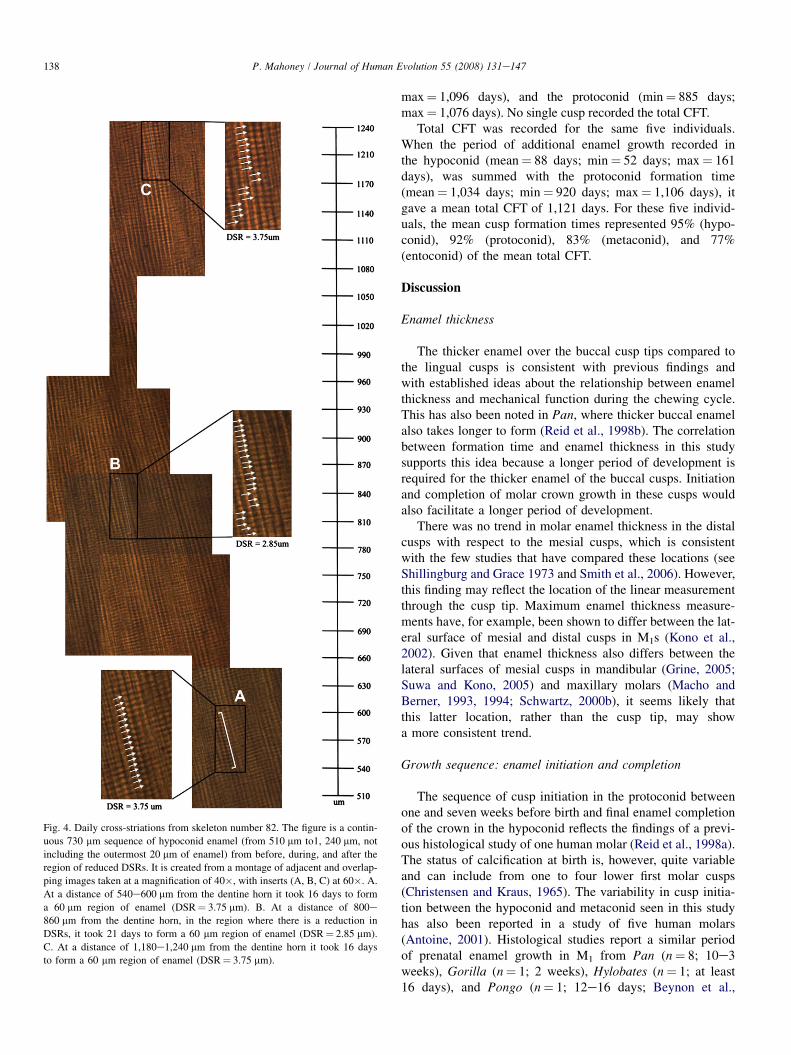
Fig. 4. Daily cross-striations from skeleton number 82. The figure is a contin-
uous 730 mm sequence of hypoconid enamel (from 510 mm to1, 240 mm, not
including the outermost 20 mm of enamel) from before, during, and after the
region of reduced DSRs. It is created from a montage of adjacent and overlap-
ping images taken at a magnification of 40�, with inserts (A, B, C) at 60�. A.
At a distance of 540e600 mm from the dentine horn it took 16 days to form
a 60 mm region of enamel (DSR¼ 3.75 mm). B. At a distance of 800e860 mm from the dentine horn, in the region where there is a reduction in
DSRs, it took 21 days to form a 60 mm region of enamel (DSR¼ 2.85 mm).
C. At a distance of 1,180e1,240 mm from the dentine horn it took 16 days
to form a 60 mm region of enamel (DSR¼ 3.75 mm).
138 P. Mahoney / Journal of Human Evolution 55 (2008) 131e147
max¼ 1,096 days), and the protoconid (min¼ 885 days;max¼ 1,076 days). No single cusp recorded the total CFT.
Total CFT was recorded for the same five individuals.When the period of additional enamel growth recorded inthe hypoconid (mean¼ 88 days; min¼ 52 days; max¼ 161days), was summed with the protoconid formation time(mean¼ 1,034 days; min¼ 920 days; max¼ 1,106 days), itgave a mean total CFT of 1,121 days. For these five individ-uals, the mean cusp formation times represented 95% (hypo-conid), 92% (protoconid), 83% (metaconid), and 77%(entoconid) of the mean total CFT.
Discussion
Enamel thickness
The thicker enamel over the buccal cusp tips compared tothe lingual cusps is consistent with previous findings andwith established ideas about the relationship between enamelthickness and mechanical function during the chewing cycle.This has also been noted in Pan, where thicker buccal enamelalso takes longer to form (Reid et al., 1998b). The correlationbetween formation time and enamel thickness in this studysupports this idea because a longer period of development isrequired for the thicker enamel of the buccal cusps. Initiationand completion of molar crown growth in these cusps wouldalso facilitate a longer period of development.
There was no trend in molar enamel thickness in the distalcusps with respect to the mesial cusps, which is consistentwith the few studies that have compared these locations (seeShillingburg and Grace 1973 and Smith et al., 2006). However,this finding may reflect the location of the linear measurementthrough the cusp tip. Maximum enamel thickness measure-ments have, for example, been shown to differ between the lat-eral surface of mesial and distal cusps in M1s (Kono et al.,2002). Given that enamel thickness also differs between thelateral surfaces of mesial cusps in mandibular (Grine, 2005;Suwa and Kono, 2005) and maxillary molars (Macho andBerner, 1993, 1994; Schwartz, 2000b), it seems likely thatthis latter location, rather than the cusp tip, may showa more consistent trend.
Growth sequence: enamel initiation and completion
The sequence of cusp initiation in the protoconid betweenone and seven weeks before birth and final enamel completionof the crown in the hypoconid reflects the findings of a previ-ous histological study of one human molar (Reid et al., 1998a).The status of calcification at birth is, however, quite variableand can include from one to four lower first molar cusps(Christensen and Kraus, 1965). The variability in cusp initia-tion between the hypoconid and metaconid seen in this studyhas also been reported in a study of five human molars(Antoine, 2001). Histological studies report a similar periodof prenatal enamel growth in M1 from Pan (n¼ 8; 10e3weeks), Gorilla (n¼ 1; 2 weeks), Hylobates (n¼ 1; at least16 days), and Pongo (n¼ 1; 12e16 days; Beynon et al.,

Table 3b
Enamel secretion rates in the entoconid cuspal enamel of skeleton no. 82a,b
Inner Enamel Mid Enamel Outer Enamel
ED (mm) DSR DPR ED DSR DPR ED DSR DPR
60 2.55� 0.04 24 480 3.69� 0.10 16 900 3.41� 0.09 18
120 2.62� 0.09 23 540 3.73� 0.10 16 960 3.63� 0.18 17
180 3.13� 0.29 19 600 3.27� 0.11 18 1020 3.79� 0.20 16
240 3.31� 0.23 18 660 2.84� 0.11 21 1080 3.87� 0.17 15
300 3.40� 0.12 18 720 3.05� 0.07 20 1140 3.95� 0.17 15
360 3.51� 0.10 17 780 3.22� 0.28 19
420 3.52� 0.23 17 840 3.37� 0.19 18
3.15� 0.16 136 3.31� 0.14 128 3.73� 0.16 81
a The CFT for the entoconid in Table 5a, includes an additional three days as an estimate of the formation time for the final 11 mm of enamel thickness (i.e., total
enamel thickness¼ 1,151 mm).b Accentuated markings were not present in the hypoconid and entoconid so the sequence of cusp growth could not be calibrated and registered between the
cusps (see Materials and methods). However, the timing of the reduced DSRs in the mid enamel of both the hypoconid and entocond makes sense in view of
what is known about the sequence of cusp growth and difference in the timing of cusp initiation for this sample, assuming that the reduced DSRs in the mid enamel
of both cusps is a response to the same event. For example, if the greatest reduction in DSRs in the mid enamel of both cusps is used as a marker, then this occurred
between a minimum and maximum enamel depth of 601 mm (186 days) and 660 mm (207 days) in the entoconid. The greatest reduction in the mid enamel of the
hypoconid occurred at a minimum and maximum enamel depth of 781 mm (234 days) and 840 mm (255 days), respectively (Table 3a.). If the maximum value for
the entoconid is subtracted from the minimum value for the hypoconid this gives 27 days, which is the minimum number of days that the hypoconid could
have recorded the reduction in DSRs before the entoconid. If the minimum value for the entoconid is subtracted from the maximum for the hypoconid this gives
69 days, which is the maximum number of days that the hypoconid could have recorded the reduction in DSRs before the entoconid. These values (27e69 days)
lie close to the difference in the timing of the hypoconid and entoconid cusp initiation recorded for five individuals in this sample (30e64 days; Table 5a;
Fig. 5AeE).
139P. Mahoney / Journal of Human Evolution 55 (2008) 131e147
1991a; Dirks, 1998; Schwartz et al., 2006; Smith et al.,2007a). While few have reported prenatal enamel formationtimes for fossil hominoids, those who have suggest an equiv-alent period of growth in M1s (Mahoney et al., 2007). Thelength of the prenatal growth period in hominoids contrastswith the advanced state of prenatal calcification seen insome prosimians, which along with other aspects of dental
Table 4a
Linear appositional enamel thickness (in mm)
Cuspa
No. Prd Med Hyd End
11 1240 1144 1297 963
14 1434 1212 1260 947
31 1255 1268 1200 1079
36 1534 1294 1300 1066
48 1465 1271 1506 1428
57 1355 1196 1579 1300
59 1696 1271 1386 1493
60 1006 1035 1193 1025
75 1548 1093 1609 1311
80 1231 1093 1297 1216
82 1179 1260 1151
87 1691 1487 1562 1309
100 1451 1377 1350 1303
105 1593 1255 1352 1155
116 1271 1270 1301
Mean 1397 1230 1361 1203
Min 1006 1035 1193 947
Max 1696 1487 1609 1493
�1SD 199 123 138 165
Average pre-natal protoconid enamel thickness ¼ 56 mm.a Abbreviations the same as in Table 2b.
development, has been linked to early weaning and a largelyfolivorous diet (Schwartz et al., 2005, 2007).
Cusp and total crown formation times
The difference in formation time between each of the me-sial cusps compares well with previous findings for modernhumans (Reid et al., 1998a; Reid and Dean, 2006), and Gorilla(Schwartz et al., 2006), while the difference in formation timebetween the distal cusps has only previously been reported forPan (Reid et al., 1998b; Smith et al., 2007a). Like Pan, no sin-gle cusp represented the total period of crown formation,though the buccal cusps represented a greater percentage ofthe total CFT (95e92%) compared to the lingual cusps(83e77%). The additional and final enamel growth period re-corded in the hypoconid compared to the protoconid was equalto 88 days (mean value). The variation in cusp initiation timesand cusp enamel formation times recorded in this study indi-cates that comparisons between modern human and both living
Table 4b
Comparing appositional enamel thickness
Cuspa t df p
Prd vs. med 4.662 12 0.001*
Prd vs. hyd 0.856 14 0.406
Prd vs. end 4.106 14 0.001*
Med vs. hyd �3.229 12 0.007*
Med vs. end 0.631 12 0.540
Hyd vs. end 4.681 14 0.000*
*¼ Significant difference.a Abbreviations the same as in Table 2b.
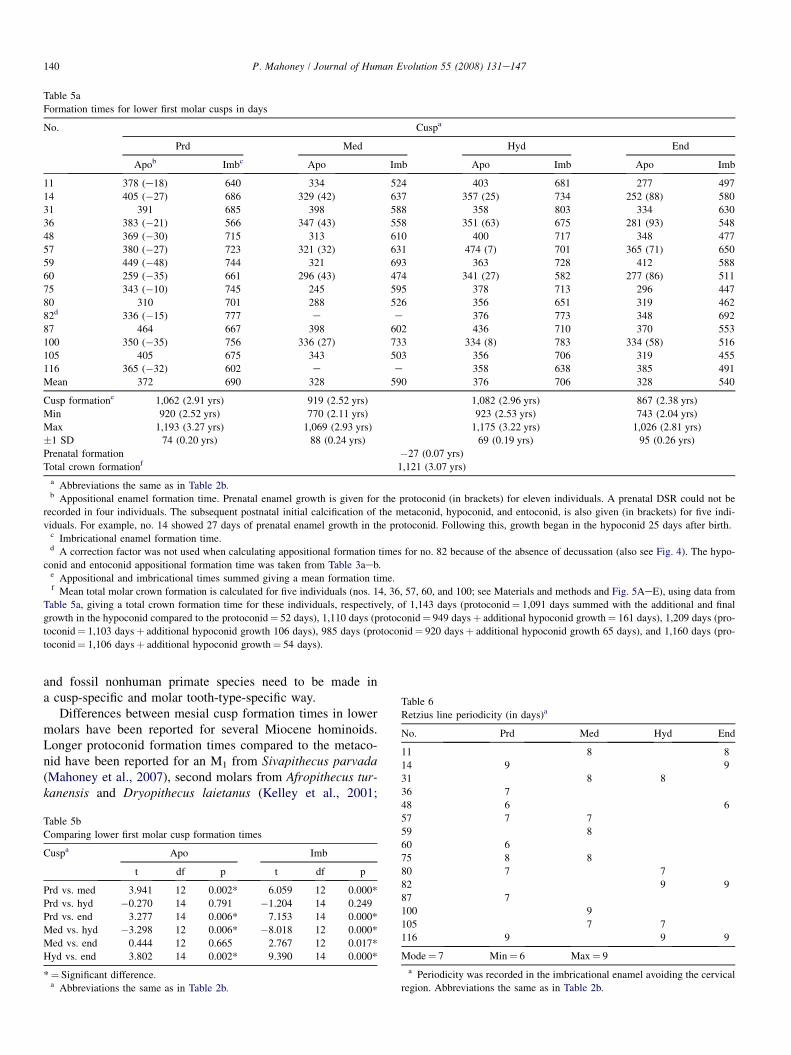
Table 5a
Formation times for lower first molar cusps in days
No. Cuspa
Prd Med Hyd End
Apob Imbc Apo Imb Apo Imb Apo Imb
11 378 (e18) 640 334 524 403 681 277 497
14 405 (�27) 686 329 (42) 637 357 (25) 734 252 (88) 580
31 391 685 398 588 358 803 334 630
36 383 (�21) 566 347 (43) 558 351 (63) 675 281 (93) 548
48 369 (�30) 715 313 610 400 717 348 477
57 380 (�27) 723 321 (32) 631 474 (7) 701 365 (71) 650
59 449 (�48) 744 321 693 363 728 412 588
60 259 (�35) 661 296 (43) 474 341 (27) 582 277 (86) 511
75 343 (�10) 745 245 595 378 713 296 447
80 310 701 288 526 356 651 319 462
82d 336 (�15) 777 e e 376 773 348 692
87 464 667 398 602 436 710 370 553
100 350 (�35) 756 336 (27) 733 334 (8) 783 334 (58) 516
105 405 675 343 503 356 706 319 455
116 365 (�32) 602 e e 358 638 385 491
Mean 372 690 328 590 376 706 328 540
Cusp formatione 1,062 (2.91 yrs) 919 (2.52 yrs) 1,082 (2.96 yrs) 867 (2.38 yrs)
Min 920 (2.52 yrs) 770 (2.11 yrs) 923 (2.53 yrs) 743 (2.04 yrs)
Max 1,193 (3.27 yrs) 1,069 (2.93 yrs) 1,175 (3.22 yrs) 1,026 (2.81 yrs)
�1 SD 74 (0.20 yrs) 88 (0.24 yrs) 69 (0.19 yrs) 95 (0.26 yrs)
Prenatal formation �27 (0.07 yrs)
Total crown formationf 1,121 (3.07 yrs)
a Abbreviations the same as in Table 2b.b Appositional enamel formation time. Prenatal enamel growth is given for the protoconid (in brackets) for eleven individuals. A prenatal DSR could not be
recorded in four individuals. The subsequent postnatal initial calcification of the metaconid, hypoconid, and entoconid, is also given (in brackets) for five indi-
viduals. For example, no. 14 showed 27 days of prenatal enamel growth in the protoconid. Following this, growth began in the hypoconid 25 days after birth.c Imbricational enamel formation time.d A correction factor was not used when calculating appositional formation times for no. 82 because of the absence of decussation (also see Fig. 4). The hypo-
conid and entoconid appositional formation time was taken from Table 3aeb.e Appositional and imbricational times summed giving a mean formation time.f Mean total molar crown formation is calculated for five individuals (nos. 14, 36, 57, 60, and 100; see Materials and methods and Fig. 5AeE), using data from
Table 5a, giving a total crown formation time for these individuals, respectively, of 1,143 days (protoconid¼ 1,091 days summed with the additional and final
growth in the hypoconid compared to the protoconid¼ 52 days), 1,110 days (protoconid¼ 949 daysþ additional hypoconid growth¼ 161 days), 1,209 days (pro-
toconid¼ 1,103 daysþ additional hypoconid growth 106 days), 985 days (protoconid¼ 920 daysþ additional hypoconid growth 65 days), and 1,160 days (pro-
toconid¼ 1,106 daysþ additional hypoconid growth¼ 54 days).
Table 6
Retzius line periodicity (in days)a
No. Prd Med Hyd End
11 8 8
14 9 9
31 8 8
36 7
140 P. Mahoney / Journal of Human Evolution 55 (2008) 131e147
and fossil nonhuman primate species need to be made ina cusp-specific and molar tooth-type-specific way.
Differences between mesial cusp formation times in lowermolars have been reported for several Miocene hominoids.Longer protoconid formation times compared to the metaco-nid have been reported for an M1 from Sivapithecus parvada(Mahoney et al., 2007), second molars from Afropithecus tur-kanensis and Dryopithecus laietanus (Kelley et al., 2001;
Table 5b
Comparing lower first molar cusp formation times
Cuspa Apo Imb
t df p t df p
Prd vs. med 3.941 12 0.002* 6.059 12 0.000*
Prd vs. hyd �0.270 14 0.791 �1.204 14 0.249
Prd vs. end 3.277 14 0.006* 7.153 14 0.000*
Med vs. hyd �3.298 12 0.006* �8.018 12 0.000*
Med vs. end 0.444 12 0.665 2.767 12 0.017*
Hyd vs. end 3.802 14 0.002* 9.390 14 0.000*
*¼ Significant difference.a Abbreviations the same as in Table 2b.
48 6 6
57 7 7
59 8
60 6
75 8 8
80 7 7
82 9 9
87 7
100 9
105 7 7
116 9 9 9
Mode¼ 7 Min¼ 6 Max¼ 9
a Periodicity was recorded in the imbricational enamel avoiding the cervical
region. Abbreviations the same as in Table 2b.
141P. Mahoney / Journal of Human Evolution 55 (2008) 131e147
Smith et al., 2003), and third molars from Gigantopithecusblacki and Graecopithecus freybergi (Dean and Schrenk,2003; Smith et al., 2004). This variation, together with thickerenamel (Graecopithecus, Sivapithecus, Afropithecus) and ear-lier cusp initiation (Graecopithecus, Gigantopithecus) in theprotoconid compared to the metaconid, suggests that someof the fossil species may display a relationship between ratesof enamel formation and enamel thickness that may ultimatelyreflect the functional mechanics of the chewing cycle.
The mean protoconid formation time recorded for othercontemporary northern European populations (3.25 yrs; Reid
Skeleton no. 14
-27 25 42 88
Skeleton no. 36
-21 43 63 93
Skeleton no. 57
-27 7 32 71
Protoconid
Metaconid
Entoconid
Hypoconid
Birth
1143 days
Protoconid
Metaconid
Entoconid
Hypoconid
1110 days
Birth
Protoconid
Metaconid
Entoconid
Hypoconid
1209 days
Birth
A
B
C
Fig. 5. AeE. Lower first molar total crown formation time and sequence of cuspal
pletion of cusp growth, and total formation time (all in days) for five individuals:
and Dean, 2006) is more than the mean protoconid formationtime calculated for the M1s here (2.91 yrs; Table 5a). The dif-ference in mean formation time appears mainly to be due tothe slightly thinner appositional enamel in the present study(mean¼ 1,397 mm; Table 4a), compared to the contemporaryEuropean sample (mean¼ 1,573 mm) of Reid and Dean(2006) that formed in a slightly shorter period of time(1.02 yrs and 1.27 yrs, respectively).
The range of protoconid formation times recorded for theM1s overlaps only at the upper end of the range of M1 proto-conid formation times recorded for Pan (2.01e2.61 yrs), and
920 1008 1064 1116 days
922 928 948 1089 days
984 1076 1086 1182 days
growth (data taken from Table 5a.). The figures show the initiation and com-
skeleton numbers 14 (A), 36 (B), 57 (C), 60 (D), and 100 (E).
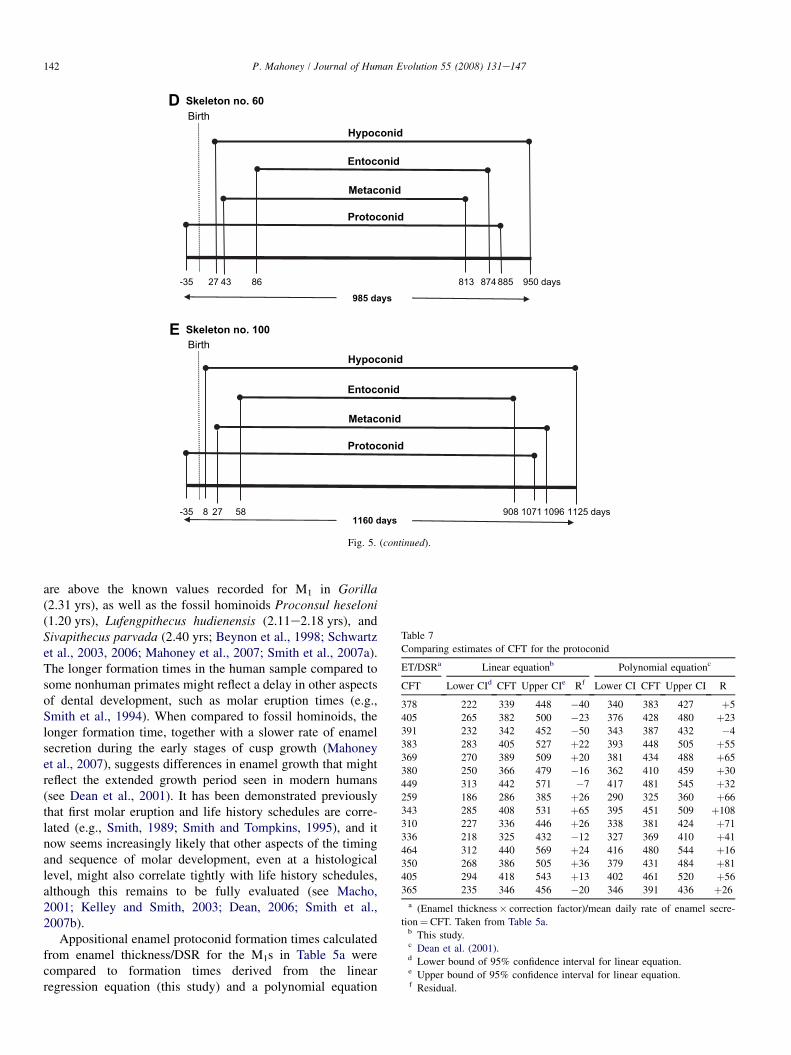
Skeleton no. 60
-35 27 43 86 813 874 885 950 days
Skeleton no. 100
-35 8 27 58 908 1071 1096 1125 days
Protoconid
Metaconid
Entoconid
Hypoconid
985 days
Birth
Protoconid
Metaconid
Entoconid
Hypoconid
1160 days
Birth
D
E
Fig. 5. (continued).
Table 7
Comparing estimates of CFT for the protoconid
ET/DSRa Linear equationb Polynomial equationc
CFT Lower CId CFT Upper CIe Rf Lower CI CFT Upper CI R
378 222 339 448 �40 340 383 427 þ5
405 265 382 500 �23 376 428 480 þ23
391 232 342 452 �50 343 387 432 �4
383 283 405 527 þ22 393 448 505 þ55
369 270 389 509 þ20 381 434 488 þ65
380 250 366 479 �16 362 410 459 þ30
449 313 442 571 �7 417 481 545 þ32
259 186 286 385 þ26 290 325 360 þ66
343 285 408 531 þ65 395 451 509 þ108
310 227 336 446 þ26 338 381 424 þ71
336 218 325 432 �12 327 369 410 þ41
464 312 440 569 þ24 416 480 544 þ16
350 268 386 505 þ36 379 431 484 þ81
405 294 418 543 þ13 402 461 520 þ56
365 235 346 456 �20 346 391 436 þ26
a (Enamel thickness� correction factor)/mean daily rate of enamel secre-
tion¼CFT. Taken from Table 5a.b This study.c Dean et al. (2001).d Lower bound of 95% confidence interval for linear equation.e Upper bound of 95% confidence interval for linear equation.f Residual.
142 P. Mahoney / Journal of Human Evolution 55 (2008) 131e147
are above the known values recorded for M1 in Gorilla(2.31 yrs), as well as the fossil hominoids Proconsul heseloni(1.20 yrs), Lufengpithecus hudienensis (2.11e2.18 yrs), andSivapithecus parvada (2.40 yrs; Beynon et al., 1998; Schwartzet al., 2003, 2006; Mahoney et al., 2007; Smith et al., 2007a).The longer formation times in the human sample compared tosome nonhuman primates might reflect a delay in other aspectsof dental development, such as molar eruption times (e.g.,Smith et al., 1994). When compared to fossil hominoids, thelonger formation time, together with a slower rate of enamelsecretion during the early stages of cusp growth (Mahoneyet al., 2007), suggests differences in enamel growth that mightreflect the extended growth period seen in modern humans(see Dean et al., 2001). It has been demonstrated previouslythat first molar eruption and life history schedules are corre-lated (e.g., Smith, 1989; Smith and Tompkins, 1995), and itnow seems increasingly likely that other aspects of the timingand sequence of molar development, even at a histologicallevel, might also correlate tightly with life history schedules,although this remains to be fully evaluated (see Macho,2001; Kelley and Smith, 2003; Dean, 2006; Smith et al.,2007b).
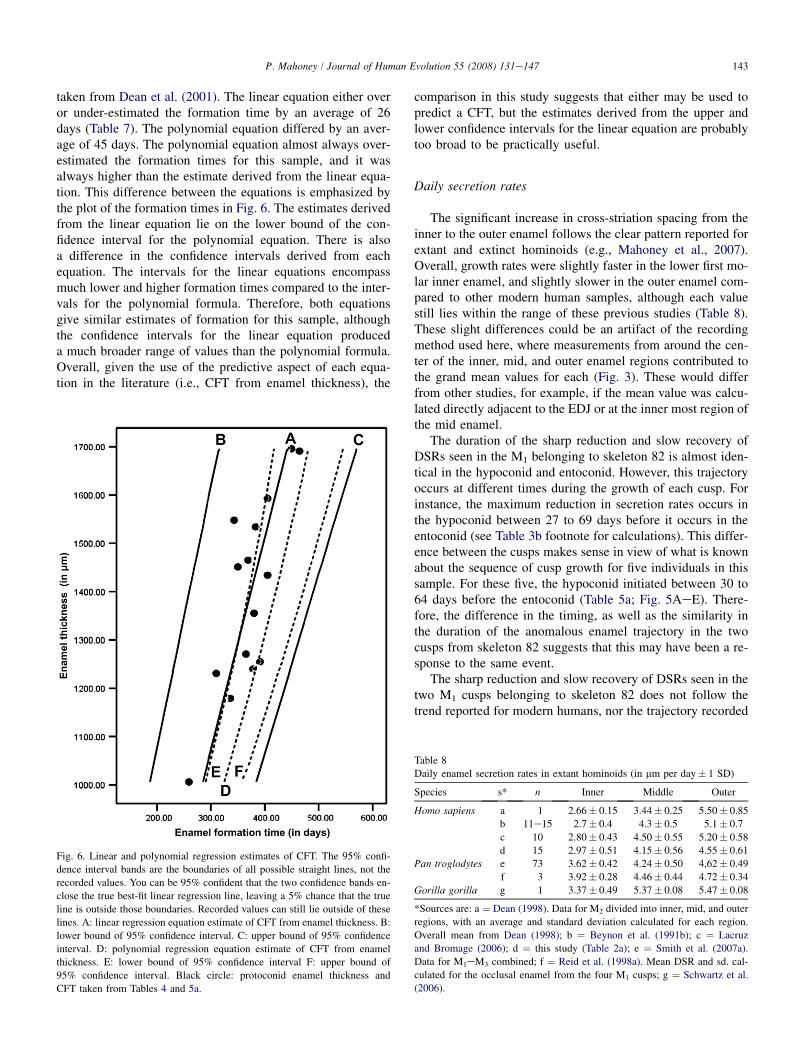
Appositional enamel protoconid formation times calculatedfrom enamel thickness/DSR for the M1s in Table 5a werecompared to formation times derived from the linearregression equation (this study) and a polynomial equation
143P. Mahoney / Journal of Human Evolution 55 (2008) 131e147
taken from Dean et al. (2001). The linear equation either overor under-estimated the formation time by an average of 26days (Table 7). The polynomial equation differed by an aver-age of 45 days. The polynomial equation almost always over-estimated the formation times for this sample, and it wasalways higher than the estimate derived from the linear equa-tion. This difference between the equations is emphasized bythe plot of the formation times in Fig. 6. The estimates derivedfrom the linear equation lie on the lower bound of the con-fidence interval for the polynomial equation. There is alsoa difference in the confidence intervals derived from eachequation. The intervals for the linear equations encompassmuch lower and higher formation times compared to the inter-vals for the polynomial formula. Therefore, both equationsgive similar estimates of formation for this sample, althoughthe confidence intervals for the linear equation produceda much broader range of values than the polynomial formula.Overall, given the use of the predictive aspect of each equa-tion in the literature (i.e., CFT from enamel thickness), the
Fig. 6. Linear and polynomial regression estimates of CFT. The 95% confi-
dence interval bands are the boundaries of all possible straight lines, not the
recorded values. You can be 95% confident that the two confidence bands en-
close the true best-fit linear regression line, leaving a 5% chance that the true
line is outside those boundaries. Recorded values can still lie outside of these
lines. A: linear regression equation estimate of CFT from enamel thickness. B:
lower bound of 95% confidence interval. C: upper bound of 95% confidence
interval. D: polynomial regression equation estimate of CFT from enamel
thickness. E: lower bound of 95% confidence interval F: upper bound of
95% confidence interval. Black circle: protoconid enamel thickness and
CFT taken from Tables 4 and 5a.
comparison in this study suggests that either may be used topredict a CFT, but the estimates derived from the upper andlower confidence intervals for the linear equation are probablytoo broad to be practically useful.
Daily secretion rates
The significant increase in cross-striation spacing from theinner to the outer enamel follows the clear pattern reported forextant and extinct hominoids (e.g., Mahoney et al., 2007).Overall, growth rates were slightly faster in the lower first mo-lar inner enamel, and slightly slower in the outer enamel com-pared to other modern human samples, although each valuestill lies within the range of these previous studies (Table 8).These slight differences could be an artifact of the recordingmethod used here, where measurements from around the cen-ter of the inner, mid, and outer enamel regions contributed tothe grand mean values for each (Fig. 3). These would differfrom other studies, for example, if the mean value was calcu-lated directly adjacent to the EDJ or at the inner most region ofthe mid enamel.
The duration of the sharp reduction and slow recovery ofDSRs seen in the M1 belonging to skeleton 82 is almost iden-tical in the hypoconid and entoconid. However, this trajectoryoccurs at different times during the growth of each cusp. Forinstance, the maximum reduction in secretion rates occurs inthe hypoconid between 27 to 69 days before it occurs in theentoconid (see Table 3b footnote for calculations). This differ-ence between the cusps makes sense in view of what is knownabout the sequence of cusp growth for five individuals in thissample. For these five, the hypoconid initiated between 30 to64 days before the entoconid (Table 5a; Fig. 5AeE). There-fore, the difference in the timing, as well as the similarity inthe duration of the anomalous enamel trajectory in the twocusps from skeleton 82 suggests that this may have been a re-sponse to the same event.
The sharp reduction and slow recovery of DSRs seen in thetwo M1 cusps belonging to skeleton 82 does not follow thetrend reported for modern humans, nor the trajectory recorded
Table 8
Daily enamel secretion rates in extant hominoids (in mm per day� 1 SD)
Species s* n Inner Middle Outer
Homo sapiens a 1 2.66� 0.15 3.44� 0.25 5.50� 0.85
b 11e15 2.7� 0.4 4.3� 0.5 5.1� 0.7
c 10 2.80� 0.43 4.50� 0.55 5.20� 0.58
d 15 2.97� 0.51 4.15� 0.56 4.55� 0.61
Pan troglodytes e 73 3.62� 0.42 4.24� 0.50 4,62� 0.49
f 3 3.92� 0.28 4.46� 0.44 4.72� 0.34
Gorilla gorilla g 1 3.37� 0.49 5.37� 0.08 5.47� 0.08
*Sources are: a ¼ Dean (1998). Data for M2 divided into inner, mid, and outer
regions, with an average and standard deviation calculated for each region.
Overall mean from Dean (1998); b ¼ Beynon et al. (1991b); c ¼ Lacruz
and Bromage (2006); d ¼ this study (Table 2a); e ¼ Smith et al. (2007a).
Data for M1eM3 combined; f ¼ Reid et al. (1998a). Mean DSR and sd. cal-
culated for the occlusal enamel from the four M1 cusps; g ¼ Schwartz et al.
(2006).

24 65 101 135 168 200 234 272 307 339 371
Enamel depth (µm)
Days
Enamel depth (µm)
Months
Days
InnerEnamel regions
Mid Outer
4.0
3.8
3.6
3.4
3.2
3.0
2.8
2.6
2.4
4.0
3.8
3.6
3.4
3.2
3.0
2.8
2.6
2.4
120 240 360 480 600 720 840 960 108024 66 102 136 168 204 244 280 313 345
120 240 360 480 600 720 960 1080 1200
Enamel regions
MidInner Outer
6.5
6.0
5.5
5.0
4.5
4.0
3.5
3.0
2.5
1 2 3 4 5 6 7 8 9 10 11 12 13 14 15 16
InnerEnamel regions
Mid Outer
840
µµM
ean
d
aily en
am
el secretio
n rate ( m
)µ
Mean
d
aily en
am
el secretio
n rate ( m
)µ
Mean
d
aily en
am
el secretio
n rate ( m
)
A
B
C
Fig. 7. Mean enamel secretion rates (Data taken from Table 3a.) in the hypoconid cuspal enamel of skeleton number 82. The pattern of enamel secretion in the M1
(this study) differs from the results for an M2 (Dean, 1998; see Fig. 7c). There was a sharp decrease in the rate of enamel secretion approximately half way through
the period of cuspal growth in the M1, which was not seen in the M2. Instead, the M2 showed a progressive increase in the rate of enamel formation throughout the
course of cuspal growth. The anomalous trajectory seen in the M1 is discussed in the text. B. Mean enamel secretion rates (Data taken from Table 3b.) in the
entoconid cuspal enamel of skeleton number 82. C. Mean enamel secretion rates (Data taken from Dean (1998: his Table 1)) in a human second molar.
144 P. Mahoney / Journal of Human Evolution 55 (2008) 131e147

145P. Mahoney / Journal of Human Evolution 55 (2008) 131e147
in a second molar (Dean, 1998; also see Fig. 7AeC). Nor is itlikely that the reduction in DSRs in the M1 reflects intradianincrements of 8 or 12 hours, rather than a circadian 24 hourincrement, because they are not half those measured previ-ously. Instead, the trajectory of enamel growth reported hereresembles the trajectory described for modern human and Ne-andertal deciduous molars, where a reduction in DSRs acrossthe neonatal line was followed by a slow return to maximumrates of secretion (Macchiarelli et al., 2006). A reduction inthe amount of secreted enamel matrix (inferred from a reduc-tion in spacing between Retzius lines) has also been shown tocorrespond to a surface hypoplasia in wild boar and domesticpigs (Witzel, et al., 2006), while a recovery in enamel secre-tion after a systemic insult (increased fluoride) has been docu-mented for roe and red deer (Kierdorf and Kierdorf, 1997).Like these studies, the M1 in this study may also have retaineda record of a systemic event that produced the reduction inenamel secretion in response to, for example, the type of juve-nile illness that corresponds to some types of hypoplasia (e.g.,Eliot et al., 1934; Pindborg, 1982). The subsequent return tonormal rates of matrix secretion over a period of 15 weekscould then be described as a type of ‘catch-up growth’, whichis commonly seen in nondental skeletal and somatic growth(Prader et al., 1963). ‘Catch-up growth’ occurs often afterperiods of juvenile illness (e.g., Osborne and Mendel, 1916;Williams et al., 1974; Lee and Myers, 1979; Williams, 1981).
Unlike the deciduous teeth described by Macchiarelli et al.(2006), the sudden reduction and then gradual recovery in ma-trix secretion in the M1 cusps described in this study was notassociated with an accentuated marking (which, in their case,was the neonatal line) visible in polarized transmitted light mi-croscopy. Therefore, it may be that this method of recordingthe rate of enamel formation through the entire cuspal enamelis one that is able to distinguish between events that are eitherassociated with accentuated markings, and other events thatmay effect secretion rates but leave no accentuated marking.Clearly some enamel defects are more marked than others,even within the same tooth (compare accentuations in Fig. 1,box aec).
Summary and conclusion
When compared to other extant and fossil hominoids, themodern human sample studied here showed both similaritiesand differences in cusp growth. The relationship betweenenamel formation rates and enamel thickness in the lower firstpermanent molars resembled that reported in previous studiesof fossil hominoids and followed expectations that fit withwhat is known about the mechanics of chewing. All of thehominoids for which there is comparable data shared similarprenatal enamel formation times to those calculated for mod-ern human M1s in this study. In contrast to all fossil species(except Neandertals) where similar data has been published,this modern human sample, like others, had longer cusp for-mation times and a slower rate of enamel secretion, leadingto a longer total crown formation time. These differencesmay reflect the extended growth period seen in modern
humans. With this in mind, the considerable variation ob-served in enamel formation times between molar cusps indi-cates that inter- and intraspecific comparisons should berestricted to identical cusp types. Otherwise, variation that ex-ists between individual cusp formation times is liable to bemisinterpreted in an evolutionary context. The consistency inperiodicity and DSRs when compared between the cusps ofeach molar indicates that either may be calculated for compar-ative purpose from any of the four first molar cusps.
Acknowledgements
I thank Gabriele Macho, Kevin Kuykendall, the editorSusan Anton, an associate editor, and three anonymous re-viewers for helpful comments and advice. The National Mu-seums of Scotland, the Marischal Museum, InvernessMuseum, and Hull and East Riding Museum facilitated accessto samples in their care.
References
Anemone, R., Watts, E.S., 1992. Dental development in apes and humans: a com-
ment on Simpson, Lovejoy, and Meindl (1990). J. Hum. Evol. 22, 149e153.
Antoine, D., 2001. Evaluating the Periodicity of Incremental Structures in
Dental Enamel as a Means of Studying Growth in Children from Past
Populations. Ph.D. Dissertation, University of London.
Berkovitz, B., Holland, G.R., Moxham, B.J., 2002. Oral Anatomy, Embryology
and Histology, third ed. Mosby International Limited, Edinburgh.
Beynon, A.D., Dean, M.C., Reid, D.J., 1991a. Histological study on the
chronology of the developing dentition in gorilla and orangutan. Am.
J. Phys. Anthropol. 86, 189e203.
Beynon, A.D., Dean, M.C., Reid, D.J., 1991b. On thick and thin enamel. Am.
J. Phys. Anthropol. 86, 295e309.
Beynon, A.D., Dean, M.C., Leakey, M.G., Reid, D.J., Walker, A.C., 1998.
Comparative dental development and microstructure of Proconsul teeth
from Rusinga Island, Kenya. J. Hum. Evol. 35, 163e209.
Boyde, A., 1963. Estimation of age at death of young human skeletal remains
from incremental lines in dental enamel, Third international meeting in
forensic immunology, medicine, pathology and toxicology, Plenary session
11A. London, 16e24 April 1963. Excerpta Med. Int. Congr. Ser. vol. 80.
Boyde, A., 1989. Enamel. In: Oksche, A., Vollrath, L. (Eds.), Handbook of
Microscopic Anatomy, vol. V/6: Teeth. Springer-Verlag, Berlin, pp. 309e473.
Boyde, A., 1990. Developmental interpretations of dental microstructure. In:
DeRousseau, J.C. (Ed.), Primate Life History and Evolution. Wiley-Liss,
New York, pp. 229e267.
Bromage, T., 1991. Enamel incremental periodicity in the pig-tailed macaque:
a polychrome fluorescent labeling study of dental hard tissues. Am.
J. Phys. Anthropol. 86, 205e214.
Bromage, T.G., Dean, M.C., 1985. Re-evaluation of the age at death of
immature fossil hominids. Nature 317, 525e527.
Brown, G., 2003. Holm mains farm, Inverness, short cists. Discov. Excav.
Scot. 4, 87.
Childe, V.G., Edwards, A.J.H., Low, A., Macdougall, B., 1944. Newly discovered
short cist burials with beakers. Proc. Soc. Antiq. Scot. 78, 106e119.
Christensen, L., Kraus, B.S., 1965. Initial calcification of the human
permanent first molar. J. Dent. Res. 44, 1338e1342.
Darling, A.I., 1958. Studies of the early lesion of enamel caries. Br. Dent. J.
105, 119e135.
Dean, M.C., 1987. Growth layers and incremental markings in hard tissues;
a review of the literature and some preliminary observations about enamel
structure in Paranthropus boisei. J. Hum. Evol. 16, 157e172.
Dean, M.C., 1995. The nature and periodicity of incremental lines in primate
dentine and their relationship to periradicular bands in OH 16 (Homo ha-bilis). In: Moggi-Cecchi, J. (Ed.), Aspects of Dental Biology, Paleontology,

146 P. Mahoney / Journal of Human Evolution 55 (2008) 131e147
Anthropology and Evolution. International institute for the study of man,
Angelo Pontecorboli. Florence, pp. 239e265.
Dean, M.C., 1998. A comparative study of cross striation spacings in cuspal
enamel and of four methods of estimating the time taken to grow molar
cuspal enamel in Pan, Pongo, and Homo. J. Hum. Evol. 35, 449e462.
Dean, M.C., 2006. Tooth microstructure tracks the pace of human life-history
evolution. Proc. R. Soc. B 273, 2799e2802.
Dean, M.C., Beynon, A.D., 1991. Histological reconstruction of crown
formation times and initial root formation times in a modern human child.
Am. J. Phys. Anthropol. 86, 215e222.
Dean, M.C., Beynon, A.D., Reid, D.J., 1992. Microanatomical estimates of
rates of root extension in a modern human child from Spitalfields, London.
In: Smith, P., Tchernov, E. (Eds.), Structure, Function and Evolution of
Teeth. Freund Publishing House, London, pp. 311e333.
Dean, M.C., Beynon, A.D., Reid, D.J., Whittaker, D.K., 1993. A longitudinal
study of tooth growth in a single individual based on long and short period
incremental markings in dentine and enamel. Int. J. Osteoarchaeol. 3,
249e264.
Dean, M.C., Leakey, M.G., Reid, D.J., Schrenk, F., Schwartz, G.T.,
Stringer, C., Walker, A.C., 2001. Growth processes in teeth distinguish
modern humans from Homo erectus and earlier hominins. Nature 414,
628e631.
Dean, M.C., Schrenk, F., 2003. Enamel thickness and development in a third
permanent molar of Gigantopithecus blacki. J. Hum. Evol. 45, 381e387.
Dirks, W., 1998. Histological reconstruction of dental development and age at
death in a juvenile gibbon (Hylobates lar). J. Hum. Evol. 35, 411e425.
Driessens, F.C.M., Heijligers, H.J.M., Borggreven, J.M.P.H.,
Woltgens, J.H.M., 1984. Variations in the mineral composition of human
enamel on the level of cross-striations and striae of Retzius. Caries Res.
18, 237e241.
Eisenmann, D.R., 1998. Enamel structure. In: Ten Cate, A.R. (Ed.), Oral
Histology: Development, Structure and Function, fifth ed. Mosby-Year,
Missouri, pp. 218e235.
Eliot, M.M., Souther, S.P., Anderson, B.G., Arnim, S.S., 1934. A study of the
teeth of a group of school children previously examined for rickets. Am.
J. Dis. Child 48, 713.
FitzGerald, C.M., 1998. Do enamel microstructures have regular time
dependency? Conclusions from the literature and a large scale study.
J. Hum. Evol. 35, 371e386.
Gantt, D.G., 1977. Enamel of Primate Teeth: its Thickness and Structure
with Reference to Functional and Phyletic Implications. Ph.D. thesis,
Washington University, St. Louis.
Gantt, D.G., Harris, E.F., Rafter, J.A., Rahn, J.K., 2001. Distribution of enamel
thickness on human deciduous molars. In: Brook, A. (Ed.), Dental
Morphology 2001. Sheffield Academic Press, Sheffield, pp. 167e190.
Grine, F.E., 2005. Enamel thickness of deciduous and permanent molars in
modern Homo sapiens. Am. J. Phys. Anthropol. 126, 14e31.
Grine, F.E., Martin, L.B., 1988. Enamel thickness and development in
Australopithecus and Paranthropus. In: Grine, F.E. (Ed.), Evolutionary
History of the ‘‘Robust’’ Australopithecines. Aldine de Gruyter, New
York, pp. 3e42.
Gustafson, A.G., 1959. A morphologic investigation of certain variations in the
structure and mineralization of human dental enamel. Odont. Tidsk. 67,
361e472.
Hillson, S., Bond, S., 1997. Relationship of enamel hypoplasia to tooth crown
growth: a discussion. Am. J. Phys. Anthropol. 104, 89e103.
Image-Pro Express, 1993e2005. Image Analysis Software, Version 5.1.
Media Cybernetics, Inc., 4340 East-West Hwy, Suite 400, Bethesda. MD
20814-4411.
Kajiyama, S., 1965. Total number of regular incremental lines in the enamel of
human permanent teeth. Nihon. Univ. Dent. J. 39, 77e83.
Kay, R.F., 1977. The evolution of molar occlusal in the cercopithecidae and
early catarrhines. Am. J. Phys. Anthropol. 46, 327e352.
Kay, R.F., Hiiemae, K., 1974. Jaw movement and tooth use in recent and fossil
primates. Am. J. Phys. Anthropol. 40, 227e256.
Kelley, J., Dean, M.C., Reid, D.J., 2001. Molar growth in the late Miocene
hominoid, Dryopithecus laietanus. In: Mayhall, J.T., Heikkinen, T.
(Eds.), Dental Morphology 1998. Proceedings of the 11th International
Symposium on dental morphology, Oulu, Finland. Oulu University Press,
Oulu, pp. 123e134.
Kelley, J., Smith, T.M., 2003. Age at first molar emergence in early Miocene
Afropithecus turkanensis and life-history evolution in the Hominoidea.
J. Hum. Evol. 44, 307e329.
Khera, S.C., Carpenter, C.W., Staley, R.N., 1990. Anatomy of cusps of
posterior teeth and their fracture potential. J. Prosthet. Dent. 64, 139e147.
Kierdorf, H., Kierdorf, U., 1997. Disturbances of the secretory stage of
amelogenesis in fluorosed deer teeth: a scanning electron-microscopic
study. Cell. Tissue. Res. 289, 125e135.
Komai, S., 1942. A study of enamel prism cross striations in human teeth.
J. Jap. Stomatol. Soc. (Kobyo-shi) 16, 279e292.
Kono, R.T., Suwa, G., Tanijiri, T., 2002. A three-dimensional analysis of
enamel distribution patterns in human permanent first molars. Arch.
Oral. Biol. 47, 867e875.
Kraus, B.S., Jordan, R.E., 1965. The Human Dentition before Birth. Lea and
Febiger, Philadelphia.
Lacruz, R.S., Bromage, T.G., 2006. Appositional enamel growth in molars of
South African fossil hominoids. J. Anat. 209, 13e20.
Lacruz, R.S., Ramirez Rozzi, F., Bromage, T., 2006. Variation in enamel
development of South African fossil hominids. J. Hum. Evol. 51, 580e590.
Lee, M., Myers, G.S., 1979. The effect of protein-energy malnutrition
on appositional bone growth in the rat. Cell. Mol. Life. Sci. 35 (6),
824e825.
Macchiarelli, R., Bodioli, L., Debenath, A., Mazurier, A., Tournepiche, J.F.,
Birch, W., Dean, C., 2006. How Neanderthal molar teeth grew. Nature
444, 748e751.
Macho, G., 2001. Primate molar crown formation times and life history
evolution revisited. Am. J. Primatol. 55, 189e201.
Macho, G.A., Berner, M.E., 1993. Enamel thickness of human maxillary
molars reconsidered. Am. J. Phys. Anthropol. 92, 189e200.
Macho, G.A., Berner, M.E., 1994. Enamel thickness and the helicoidal
occlusal plane. Am. J. Phys. Anthropol. 94, 327e337.
Macho, G.A., Thackeray, J.F., 1992. Computed tomography and enamel thickness
of maxillary molars of Plio-Pleistocene hominids from Sterkfontein,
Swartkrans, and Kromdraai (South Africa): an exploratory study. Am.
J. Phys. Anthropol. 89, 133e143.
Macho, G., Reid, D., Leakey, M., Jablonski, N., Beynon, A., 1996. Climatic
effects on dental development of Theropithecus oswaldi from Koobi
Fora and Olorgesailie. J. Hum. Evol. 30, 57e70.
Mahoney, P., 2007. Human dental microwear from Ohalo II (22,500e23,500
cal BP), Southern Levant. Am. J. Phys. Anthropol. 132, 489e500.
Mahoney, P., Smith, T., Schwartz, G., Dean, C., Kelley, J., 2007. Molar crown
formation in the late Miocene Asian hominoids, Sivapithecus parvada and
Sivapithecus sivalensis. J. Hum. Evol. 53, 61e66.
Mitchell, A., 1897. Scottish burials and skulls belonging to the Bronze Age.
Proc. Soc. Antiq. Scot. 31, 115e121.
Molnar, S., Gantt, D.G., 1977. Functional implications of primate enamel
thickness. Am. J. Phys. Anthropol. 46, 447e454.
Mortimer, J.R., 1905. Forty Years’ Researches in British and Saxon Burial
Mounds of East Yorkshire. A. Brown and Sons, London.
Nanci, A., 2003. Enamel: composition, formation, and structure. In:
Ten Cate, A.R. (Ed.), Oral Histology, Development Structure and Func-
tion, sixth ed. Mosby Year Book, Inc., St. Louis, Missouri, pp. 145e191.
Norusis, M.J., 1993. SPSS for Windows Professional Statistics Release 6.0.
SPSS, Inc, Chicago.
Osborne, T.B., Mendel, L.B., 1916. Acceleration of growth after retardation.
Am. J. Physiol. 40, 16e20.
Pindborg, J.J., 1982. Aetiology of developmental enamel defects not related to
fluorosis. Int. Dent. J. 32, 123e134.
Prader, A., Tanner, J.M., Von Harnack, G.A., 1963. Catch-up growth following
illness or starvation. An example of developmental canalization in man.
J. Pediatr. 62, 646e659.
Q-Imaging Micropublisher 5.0 RTU, 1999e2008. Q-Imaging Micropublisher
5.0 RTU Color Digital Imaging System. Leeds Precision Instruments, Inc.,
800 Boone Avenue North Minneapolis, MN 55427.
Ramirez Rozzi, F.V., 1993. Tooth development in East African Paranthropus.
J. Hum. Evol. 24, 429e454.
147P. Mahoney / Journal of Human Evolution 55 (2008) 131e147
Reid, D.J., Beynon, A.D., Ramirez Rozzi, F.V., 1998a. Histological reconstruc-
tion of dental development in four individuals from a Medieval site in
Picardie, France. J. Hum. Evol. 35, 463e477.
Reid, D.J., Schwartz, G.T., Dean, C., Chandrasekera, M.S., 1998b. A histological
reconstruction of dental development in the common chimpanzee, Pantroglodytes. J. Hum. Evol. 35, 427e448.
Reid, D.J., Dean, M.C., 2006. Variation in modern human enamel formation
times. J. Hum. Evol. 50, 329e346.
Reid, D.J., Ferrell, R., 2006. The relationship between number of striae of
Retzius and their periodicity in imbricational enamel formation. J. Hum.
Evol. 50, 195e202.
Risnes, S., 1990. Structural characteristics of staircase-type Retzius lines in
human dental enamel analyzed by scanning electron microscopy. Anat.
Rec. 226, 135e146.
Rushton, M.A., 1933. Fine contour lines of enamel milk teeth. Dent. Res. 53, 170.
Schour, I., 1936. Neonatal line in enamel and dentin of human deciduous teeth
and first permanent molar. J. Dent. Res. 18, 91e102.
Schwartz, G.T., 2000a. Enamel thickness and the helicoidal wear plane in
modern human mandibular molars. Arch. Oral. Biol. 45, 401e409.
Schwartz, G.T., 2000b. Taxonomic and functional aspects of the patterning of
enamel thickness distribution in extant large bodied hominoids. Am.
J. Phys. Anthropol. 111, 221e244.
Schwartz, G.T., Godfrey, L.R., Mahoney, P., 2007. Inferring primate growth,
development and life history from dental microstructure. In: Bailey, S.E.,
Hublin, J.J. (Eds.), Dental Perspectives on Human Evolution. Springer,
pp. 145e160.
Schwartz, G.T., Liu, W., Zheng, L., 2003. Preliminary investigation of dental
microstructure in the Yuanmou hominoid (Lufengpithecus hudienensis),
Yunnan Province, China. J. Hum. Evol. 44, 189e202.
Schwartz, G.T., Mahoney, P., Godfrey, L.R., Cuozzo, F.P., Jungers, W.L.,
Randria, G.F.N., 2005. Dental development in Megaladapis edwardsi
(primates, lemuriformes): implications for understanding life history
variation in subfossil lemurs. J. Hum. Evol. 49, 702e721.
Schwartz, G.T., Reid, D., Dean, C., 2001. Developmental aspects of sexual
dimorphism in hominoid canines. Int. J. Primatol. 22, 837e860.
Schwartz, G.T., Reid, D.J., Dean, C.M., Zihlman, A.L., 2006. A faithful record
of stressful life events preserved in the dental developmental record of
a juvenile gorilla. Int. J. Primatol. 27, 1201e1222.
Shellis, P., 1998. Utilization of periodic markings in enamel to obtain information
on tooth growth. J. Hum. Evol. 35, 387e400.
Shellis, R.P., Beynon, A.D., Reid, D.J., Hiiemae, K.M., 1998. Variations in
molar enamel thickness among primates. J. Hum. Evol. 35, 507e552.
Shillingburg Jr., H., Grace, C., 1973. Thickness of enamel and dentin. S. Calif.
Dent. Assoc. 41, 33e52.
Small, A., Bruce, M.F., Shepherd, I.A.G., 1988. A beaker child burial from
Catterline, Kincardine and Deeside. Proc. Sco. Antiq. Scot. 118, 71e77.
Smith, B.H., 1989. Dental development as a measure of life history in
primates. Evolution 43, 683e688.
Smith, B.H., Crummett, T.L., Brandt, K.L., 1994. Ages of eruption of primate
teeth: a compendium for aging individuals and comparing life histories.
Yearb. Phys. Anthropol. 37, 177e231.
Smith, B.H., Tompkins, R.L., 1995. Toward a life history of the Hominidae. A.
Rev. Anthrop. 24, 257e279.
Smith, T.M., Martin, L., Leakey, M.G., 2003. Enamel thickness and
microstructure in Afropithecus turkanensis. J. Hum. Evol. 44, 283e306.
Smith, T.M., Martin, L.B., Reid, D.J., de Bonis, L., Koufos, G.D., 2004. An
examination of dental development in Graecopithecus freybergi
(¼Ouranopithecus macedoniensis). J. Hum. Evol. 46, 551e577.
Smith, T.M., Olejniczak, A.J., Tafforeau, P., Reid, D.J., Grine, F.E.,
Hublin, J.J., 2006. Molar crown thickness and volume and development
in South African Middle Stone Age humans, Molar crown thickness,
volume, and development in South African Middle Stone Age humans.
S. Afr. J. Sci. 102, 1e5.
Smith, T.M., Reid, D.J., Olejniczak, A.J., Martin, L.B., 2007a. Molar crown
development in common chimpanzees (Pan troglodytes). J. Hum. Evol.
52, 201e216.
Smith, T.M., Tafforeau, P., Reid, D.J., Grun, R., Eggins, S., Boutakiout, M.,
Hublin, J.J., 2007b. Earliest evidence of modern human life history in
North African early Homo sapiens. Proc. Natl. Acad. Sci. 104, 6128e
6133.
Spears, I.R., Macho, G.A., 1995. The helicoidal occlusal planeda functional
and biomechanical appraisal of molars. In: Radlenski, R.J., Renz, H.
(Eds.), Proceedings of the 10th International Symposium on Dental
Morphology. ‘‘M’’ Marketing Services, Berlin, pp. 391e397.
Suwa, G., Kono, R.T., 2005. A micro-CT based study of linear enamel
thickness in the mesial cusp section of human molars: re-evaluation of
methodology and assessment of within-tooth, serial, and individual
variation. Anthropol. Sci. 113, 273e289.
Tagiguchi, H., 1966. Chronologic relationship of human tooth crown
formation. Nihon Univ. Dent. J. 40, 391e397.
Williams, J.P.G., 1981. Catch-up growth. J. Embryol. Exp. Morph. 65, 89e101.
Williams, J.P.G., Tanner, J.M., Hughes, P.C.R., 1974. Catch-up growth in male
rats after growth retardation during the suckling period. Pediatr. Res. 8,
149e156.
Witzel, C., Kierdorf, U., Dobney, K., Ervynck, A., Vanpoucke, S.,
Kierdorf, H., 2006. Reconstructing impairment of secretory ameloblast
function in porcine teeth by analysis of morphological alterations in dental
enamel. J. Anat. 209, 93e110.