Intrarenal Volumes of Distribution and Relative...
16
Intrarenal Volumes of Distribution and Relative Diffusion Coefficients of Monohydric Alcohols By^ Francis P. Chinard, M.D., Colette N. Thaw, B.S., Anne C. Delea, B.A., and William Perl, Ph.D. ABSTRACT Indicator dilution outflow patterns in renal venous blood from anesthetized dog kidney were measured for the monohydric alcohols from methanol to hexanol with tritiated water (THO) and T-1824 dye as reference indicators. Also measured were olive-oil-to-water and red-cell-to-plasma partition coefficients. The indicator dilution results were: (1) at normal hematocrit, the mean transit times of all the alcohols were approximately the same as for THO; (2) at low hematocrit, the mean transit time of hexanol was approximately 1.6 times that of THO; (3) at both normal and low hematocrits, the upslope portion of the alcohol curves was earlier and steeper than that of the THO curve, the more so with increasing alcohol carbon number. Results 1 and 2 and the partition coefficients were consistent with an increased volume of distribution of hexanol relative to THO, due to the lipid content of kidney cortical tissue. The previously reported convection-diffusion model applied to result 3 provided diffusion coefficients of the alcohols relative to THO in kidney cortical tissue in vivo. ADDITIONAL KEY WORDS convection-diffusion model tritiated water T-1824 indicator dilution mean transit time n-methanol-l 14 C to n-hexanol-l 14 C dog • The extension of the Stewart-Hamilton indicator dilution method by the simultaneous use of several indicators, both vascular and extravascular, has permitted deductions as to steady-state volumes of distribution, extravas- cular pH and metabolism of these indicators in various body organs and tissues (1-5). This information requires knowledge only of the areas and the mean transit times of the various From the Cardiorespiratory Research Laboratory and the New York University Research Service, Goldwater Memorial Hospital, Welfare Island, New York, New York 10017. The experimental and theoretical studies were supported in part by U. S. Public Health Service Research Grants HE-02492, HE-07482, HE-08147, and HE-09499 from the National Heart Institute, by Grants U-1579 and U-1761 of the Health Research Council of the City of New York, and by grants from die Life Insurance Medical Research Fund. Dr. Chinard was a Career Scientist of the Health Research Council of the City of New York during most of the period of these studies. Received May 8, 1969. Accepted for publication July 3, 1969. indicator curves. Finer details of indicator curve shape have been interpreted by various models (6-12). In a recent model of indicator transport through dog kidney cortex (13), the move- ment of extravascular, nonmetabolized indica- tor from the arteriolar "sources" to the venular "sinks" in the tissue was postulated to occur by two mechanisms: source-to-sink diffusion, called diffusion bypass (4, 14-16), and con- vective washout of the volume of distribution by capillary blood flow. The earlier appear- ance and faster initial rise (precession) of tracer water (DHO and THO) relative to the extracellular indicator creatinine, experimen- tally observed in the renal venous outflow, was interpreted as showing the relatively greater influence of diffusion bypass than of convective washout on the transport of tracer water through kidney cortex. Furthermore, the observed precession of the chemically nonreacting gases krypton ( 85 Kr) and tritium Circulation Research, Vol. XXV, September 1969 343 by guest on July 9, 2018 http://circres.ahajournals.org/ Downloaded from
Transcript of Intrarenal Volumes of Distribution and Relative...

Intrarenal Volumes of Distributionand Relative Diffusion Coefficientsof Monohydric Alcohols
By^ Francis P. Chinard, M.D., Colette N. Thaw, B.S.,
Anne C. Delea, B.A., and William Perl, Ph.D.
ABSTRACTIndicator dilution outflow patterns in renal venous blood from anesthetized
dog kidney were measured for the monohydric alcohols from methanol tohexanol with tritiated water (THO) and T-1824 dye as reference indicators.Also measured were olive-oil-to-water and red-cell-to-plasma partitioncoefficients. The indicator dilution results were: (1) at normal hematocrit, themean transit times of all the alcohols were approximately the same as for THO;(2) at low hematocrit, the mean transit time of hexanol was approximately 1.6times that of THO; (3) at both normal and low hematocrits, the upslopeportion of the alcohol curves was earlier and steeper than that of the THOcurve, the more so with increasing alcohol carbon number. Results 1 and 2 andthe partition coefficients were consistent with an increased volume ofdistribution of hexanol relative to THO, due to the lipid content of kidneycortical tissue. The previously reported convection-diffusion model applied toresult 3 provided diffusion coefficients of the alcohols relative to THO in kidneycortical tissue in vivo.
ADDITIONAL KEY WORDSconvection-diffusion modeltritiated water T-1824
indicator dilution mean transit timen-methanol-l14C to n-hexanol-l14C
dog
• The extension of the Stewart-Hamiltonindicator dilution method by the simultaneoususe of several indicators, both vascular andextravascular, has permitted deductions as tosteady-state volumes of distribution, extravas-cular pH and metabolism of these indicatorsin various body organs and tissues (1-5). Thisinformation requires knowledge only of theareas and the mean transit times of the various
From the Cardiorespiratory Research Laboratoryand the New York University Research Service,Goldwater Memorial Hospital, Welfare Island, NewYork, New York 10017.
The experimental and theoretical studies weresupported in part by U. S. Public Health ServiceResearch Grants HE-02492, HE-07482, HE-08147,and HE-09499 from the National Heart Institute, byGrants U-1579 and U-1761 of the Health ResearchCouncil of the City of New York, and by grants fromdie Life Insurance Medical Research Fund. Dr.Chinard was a Career Scientist of the Health ResearchCouncil of the City of New York during most of theperiod of these studies.
Received May 8, 1969. Accepted for publicationJuly 3, 1969.
indicator curves. Finer details of indicatorcurve shape have been interpreted by variousmodels (6-12).
In a recent model of indicator transportthrough dog kidney cortex (13), the move-ment of extravascular, nonmetabolized indica-tor from the arteriolar "sources" to the venular"sinks" in the tissue was postulated to occur bytwo mechanisms: source-to-sink diffusion,called diffusion bypass (4, 14-16), and con-vective washout of the volume of distributionby capillary blood flow. The earlier appear-ance and faster initial rise (precession) oftracer water (DHO and THO) relative to theextracellular indicator creatinine, experimen-tally observed in the renal venous outflow,was interpreted as showing the relativelygreater influence of diffusion bypass than ofconvective washout on the transport of tracerwater through kidney cortex. Furthermore,the observed precession of the chemicallynonreacting gases krypton (85Kr) and tritium
Circulation Research, Vol. XXV, September 1969 343
by guest on July 9, 2018http://circres.ahajournals.org/
Dow
nloaded from

344 CHINARD, THAW, DELEA, PERL
(T2) relative to tracer water was interpretedas a greater diffusion bypass effect for theinert gases than for tracer water. Since thegases are lipid soluble, their exhibition of agreater diffusion bypass effect was thought tobe made possible by the lipid in cellmembranes, which acts as a diffusion barrierfor tracer water but not for the inert gases.
This "lipophilic diffusion bypass" effect wasstudied by determining the renal venousoutflow patterns of the monohydric alcohols,methanol (CH3-OH) tohexanol (CH3-(CH)5-OH). The lipid-to-water solubility of theseindicators increases with increase in carbonnumber. In addition to providing informationon lipophilic diffusion pathways in kidneycortex, it was expected that the outflowpatterns of these indicators would also discloseany significant amount of lipid-like substancepresent in kidney cortex, as they already hadin lung (4).
Methods
Experimental—The detailed experimentalprocedure has been given elsewhere (17). Inbrief, mongrel dogs were anesthetized withpentobarbital (25 to 30 mg/kg, with subse-quent doses as required), paralyzed withsuccinylcholine, and ventilated mechanicallyby a Harvard pump. The left kidney wasexposed by flank incision. A polyethylenecatheter was inserted into the left renal veinand connected to a sampling pump thatdelivered blood at a constant average butpulsatile rate. Approximately 0.5 ml of injec-tate solution (0.04 ml/kg body weight) wasinjected rapidly (0.3 seconds) into the leftrenal artery from a 2-ml syringe through a 26-gauge, 2»-inch bent needle. Blood sampleswere collected sequentially in plastic vialscontaining 0.02 ml of heparin solution andmounted in a rack moving at constant linearvelocity past the pump delivery tube. Threeseries of experiments were performed. In the1967 series, approximately 30 blood samples of1 ml each were collected at the rate of about 1sec/sample. In the 1968 series, we arranged tochange the rack speed suddenly in midcourseso that 24 blood samples of 0.5 ml each were
collected at the rate of about 0.5 sec/sample,followed by 18 blood samples of 1 ml eachcollected at the rate of about 1 sec/sample. Inthe 1969 series, 60 blood samples of 0.5 mleach were collected at the rate of about 0.3sec/sample.
The typical injectate was a 0.9% NaClaqueous solution, each milliliter of which con-tained: 2.25 mg T-1824 (Evans blue, EastmanOrganic Chemicals); 25 fie tritiated water(THO, 2 mc/mmole, New England NuclearCorp.); 25 fie tracer alcohol H( CH2 )n_1
14COH( n = l , methanol, 1.3 to 10 mc/mmole; n = 2,ethanol, 1.6 to 7 mc/mmole; n = 3, n-propa-nol, 2.5 to 5 mc/mmole; n = 4, n-butanol, 1.1to 3.7 mc/mmole; n = 5; n-pentanol, 1.76 me/mmole; n = 6, n-hexanol, 1.4 to 3.9 me/mmole; commercial sources). In some experi-ments creatinine, 20 mg/ml, was included.
The amount of each indicator in eachcollected sample of blood was determined bystandard analytical methods (17). Thisamount was divided by the amount of thatindicator in the injection mixture and furtherdivided by the volume of whole blood in thesample. The resulting quantity is fraction pervolume, w(t) (ml4) where * is time afterinjection. No correction for injection durationwas made.
At the conclusion of each experiment, theweight of the left kidney was determined byclamping the renal artery and vein at thehilum and excising and weighing the kidneywith its contained blood. The dog wassubsequently killed by an overdose of pento-barbital. The hematocrit was determined on asample of left renal venous blood drawn justbefore each sample run. All kidneys for whichresults are presented were determined to begrossly normal by inspection of the slicedkidney.
The 1969 series of experiments was per-formed to determine the effect of lowhematocrit values. The hematocrit was low-ered by bleeding the dog and infusing anequal volume of isotonic 5% dextran solution.The volume exchanged was approximately 500ml in 1 hour.
Olive oil-water partition coefficients ofCirculation Research, Vol. XXV, September 1969
by guest on July 9, 2018http://circres.ahajournals.org/
Dow
nloaded from

INTRARENAL VOLUMES AND DIFFUSION OF ALCOHOLS 345
tritiated water and of the 14C-alcohols weredetermined as follows: to 5 ml of S0rensen'sphosphate buffer, adjusted to pH 7.4, in a 25-ml flask was added approximately 3.4 /JLC of»C-alcohol or 25 /ic of THO. To this wasadded 5 ml of olive oil (Italian commercialgrade). Duplicate flasks of the precedingmixture were prepared, tightly stoppered, andshaken gently in a water bath at 37°C for 3and 5 hours, respectively. The contents werethen centrifuged at 2,000 rpm for 4 minutes.The oil phase supernatant fluid was carefullyremoved by oipetting. Aliquots (0.2 ml) ofthe oil and the water phases were preparedfor counting by mixing with 2 ml of absoluteethanol and 8 ml of scintillation fluid (125 mgPOPOP, 385 ml dioxan, 5 g PPO, 66.7 gnaphthalene: total 400 ml). Tritiated waterand 14C-alcohol were added to oil and tobuffer separately and treated similarly forcontrol recovery purposes. Nonradioactiveblanks of oil and of buffer were preparedsimilarly. All samples were counted in a liquidscintillation counter. The ratio of the countsper minute in the oil phase to the counts perminute in the buffer phase, corrected for therespective recoveries, yielded the oil-waterpartition coefficient.
Red cell-plasma partition coefficients ofhexanol and butanol were determined asfollows: into each of two 1-ml samples ofheparinized venous dog blood was pipetted0.1 ml of an ethanol-saline solution containing2.5 fie of hexanol-14C and 25 pc of THO. Thesamples, as well as 1 ml of blank blood, wereshaken gently for 1 hour in a water bath at37°C. One sample and the blank blood wereplaced in Wintrobe tubes and spun at 25,000rpm for 30 minutes. The Wintrobe tubetemperature after this operation was 35°C.The Wintrobe rubes were broken at appropri-ate places and the plasma was separated fromthe red cells. Then 0.1 ml each of radioactiveplasma, radioactive red cells, radioactivewhole blood, blank plasma, blank red cellsand blank whole blood were put into 1.5 ml ofdistilled water and processed for counting aspreviously described, except that 10% trichloro-acetic acid solution was used for precipitation
Circulation Research, Vol. XXV, September 1969
instead of alcohol. The 14C counts per minutein the red cell sample was divided by the 14Ccounts per minute in the plasma sample toyield the partition coefficient of the alcohol onthe basis of volume of red cells to volume ofplasma. Division of this number by the ratioof 3H counts per minute in the red cell sampleto the 3H counts per minute in the plasma sam-ple yielded the partition coefficient of the al-cohol on the basis of volume of water in redcells to volume of water in plasma. A check onthe procedure was obtained as He (counts/minin red cells) + (1-He) (counts/min in plasma)= counts/min in whole blood sample, whichwas compared with the independently andsimilarly measured radioactivity in the wholeblood sample.
Theoretical.—The experimental outflowpattern tv(t) was corrected for recirculationby extrapolating the initial linear downslopeportion of the semilogarithmic plot of log wagainst time, t. The resulting corrected curveis the indicator curve, wc(t). The classical, or"Stewart-Hamilton," information contained inthe indicator curve is derived from a flowtheorem and a mass theorem. The flowtheorem is obtained from mass balance ofindicator between the inlet and the outlet atwhich measurements are made. Thus,
R = / F(t)wj[t)dt, (1)
where R is the recovery, or fraction of theinjected indicator which emerges in the renalvenous outflow, and F(t) (ml/sec) is the (ingeneral time-dependent) renal venous bloodflow. A weighted average blood flow, F(cm3/sec), is defined as
wjt)dt. (2)F = / F(t)w,j[t)dt
This weighted average flow is to be distin-guished from the simple time average flow
/ Fdt/T considered by Cropp and Burton^ o(18). The present analysis is similar to thatof Effros et al. (19). The area, A ( m F sec),
by guest on July 9, 2018http://circres.ahajournals.org/
Dow
nloaded from

346 CHINARD, THAW, DELEA, PERL
under the indicator curve is
A = / Wc(t)dt. (3)
Equations 2 and 3 in 1 give the outflowtheorem in the form
or also
A"1 = F/R.
(4)
(5)
The experiment determines only A for eachindicator used. Hence F and R are not deter-mined uniquely, but only their ratio. If theblood flow varies during the sampling, theweighted average flow, F, may differ for eachindicator. Also the recovery, R, for each indi-cator may differ from unity because (1) indi-cator may emerge by routes other than renalvenous outflow (urine, metabolism) (in thepresent experiments the contributions fromsuch routes were negligible); (2) chemicalanalytical error in determining w(t); (3) ifthe blood flow F(t) changes during thesampling run, the weighted average flow FPcalculated from the plasma indicator curve(T-1824) may be different from the weightedaverage flow Fx corresponding to an extra-vascular indicator X that takes a longer timeto traverse the kidney. Substitution of FP andAx into equation 4 for indicator X would thenyield an erroneous value for Rx-
The mass theorem for the present systemcan be expressed as (20-22)
+ xr + SxXJX ( 6 )
Here txP, txr, ixu (sec) are the mean transittimes of an indicator (subscript X) as meas-ured in the actual finite injection experiment,respectively in the renal venous plasma, in therenal venous red cells, and in the urine. Themass m^x (g or dpm) of indicator X is thatwhich would exist in the system at infinite timein a constant infusion experiment, that is, inthe indicator steady state. In the indicatorsteady state, the output rates of indicator Xare: exXp (g/sec or dpm/sec) in the renalvenous plasma, e^Xr in the renal venous redcells, and emXu in the urine. Thus, equation 6
contains two types of terms: (1) mean transittimes of indicator as measured in the actualfinite (sudden) injection experiments reportedin this paper and (2) masses and outflow ratesof indicator that would exist after a long timein constant infusion experiments (indicatorsteady state) that could in principle be per-formed but actually were not in the presentinvestigation. The mass theorem, equation 6,requires (1) that the system be in a steadystate (stationary) with respect to all relevant"substrate" (traced, indicated) substances and(2) that the system be linear with respect tothe indicator substance. It is important to em-phasize that the system need not be, and ingeneral is not, linear with respect to its normal"substrate" substances.
The urinary term in equation 6 was estimat-ed to be about 10% of the renal venous term(for X = THO or "C-alcohol, eaaZJ(ea>Zp +e<nxr) is approximately 0.01 and iXu/iXp isapproximately 10). Moreover, this term wouldrepresent contributions to m r f mainly fromthe collecting ducts in the medulla. Contribu-tions from the medulla to the plasma and tothe red cell terms in equation 6 are in anyevent largely removed by the recirculationcorrection procedure, which removes lowblood flow contributions to iXv and tXr. Thusfor consistency, the urinary term in equation6 must be neglected.
It is assumed also that the vascular concen-trations of the indicators THO and 14C-alcohol,at all times between entrance and exit, arepartitioned between red cells and plasma withconstant partition coefficients. The meantransit time ix, determined from the correctedfraction per volume wcX for indicator x by
(7)
where tce is the catheter effect mean transittime (see Results), is then equal to tXp andiXr- Equation 6 then becomes
«W = (exXp + exXr)ix. (8)
Equation 8 is converted to a volume theoremby expressing mmX as a sum of concentrationtimes volume terms and emXp + exXr as a sum
Circulation Research, Vol. XXV, September 1969
by guest on July 9, 2018http://circres.ahajournals.org/
Dow
nloaded from

INTRARENAL VOLUMES AND DIFFUSION OF ALCOHOLS 347
of concentration times flow terms. Thus, foralcohol with x = A = alcohol carbon number,equation 8 becomes
CxJ,V, + CxA,V, = (CxA,Ff + C»ArFr)tA. (9)The tissue, including its contained blood, isregarded as composed additively of a lean(nonlipid) volume V, (ml) and a fat (Hpid)volume V, (ml), in which the concentrationsof indicator A in the indicator steady state are,respectively, CxAi and CxAf (dpm/ml). Therenal venous blood flow F (ml/sec) is re-garded as composed additively of the renalvenous plasma flow Fp (ml/sec) and the renalvenous red cell flow Fr (ml/sec), in whichthe concentrations of alcohol are, respectively,CwAp and CrAr (dpm/ml). Equation 9 isdivided by CxAp and expressed in terms ofrenal venous blood hematocrit H,: — Fr/F togive
= yA , yAfV, =
where VdA is the volume of distribution ofalcohol, in units of plasma volume and
yAi = CxA,ICxAp, (11)yAf = CKA//CxAp, (12)yAr=Cr,ArlCxAp, (13)
are the indicator partition coefficients in theindicator steady state between, respectively,nonlipid and plasma, lipid and plasma andred cells and plasma. For tritiated water (sub-script W) equation 10 becomes
Vr/ir= ywiVi + ywfVf =(l-H,: + yWrH,:)Fiw, (14)
where V,nr is the volume of distribution ofTHO, that is, the total exchangeable volumeof tissue water, in units of plasma volume, andwhere the y coefficients are defined as in equa-tions 11 through 13. Equation 10 is divided byequation 14 and yWf is assumed approximatedby the oil-water partition coefficient of THOwhich is negligible (Table 5). The result is
in which VdA and Vdw may be expressed in anyconvenient but identical units, and similarlyfor Vf and V(.
Circulation Research, Vol. XXV, September 1969
For the ratio of mean transit time of theplasma indicator T1824 (subscript P) to thatof tritiated water, a similar derivation byequation 8 gives
where Vp,,/V,r is the fraction of tissue watervolume that is in the blood plasma andfp,o = Fptc/F,r is the fraction of renal venousblood water that is in the renal venous plasma.
Because the mass theorem, equations 6 or 8,requires the system to be in a steady state, allvolumes, flow rates, partition coefficients, andhematocrit in equations 9 through 16 are as-sumed to be constant. In addition, the partitioncoefficients, equations 11 through 13, definedfor indicator in the indicator steady state, areassumed to differ negligibly from correspond-ing partition coefficients measured at thermo-dynamic equilibrium.
The simultaneously measured alcohol andtracer water indicator curves were analyzedfor relative diffusion coefficients in kidneycortical tissue by the convection-diffusionmodel (13). The recirculation corrected indi-cator curves were corrected for shape dis-tortion due to catheter effect by (23)
to'(t') = w,.(t) + h(dwj dt), (17)
where w' is the corrected ordinate at timef = t — tn and to, t\ are the sampling catheterdead time and lag time, respectively. Thecorrected ordinate was nondimensionalized to100 FR-Hw'= lOOA-Hw' and plotted on a linearscale against nondimensionalized time t/t.These curves, which have an area of 100 anda mean transit time of unity, were comparedwith the theoretical model curves as describedunder Results, to yield the nondimensionalPeclet parameter
px = LaIDxix, (18)
where L (cm) is the source-to-sink diffusion
(15)
distance, Dx (cm-'/sec) is the diffusion co-efficient of the indicator in the tissue, and tx
is given by equation 7 for x = alcohol, A, or
by guest on July 9, 2018http://circres.ahajournals.org/
Dow
nloaded from
348 CHINARD, THAW, DELEA, PERL
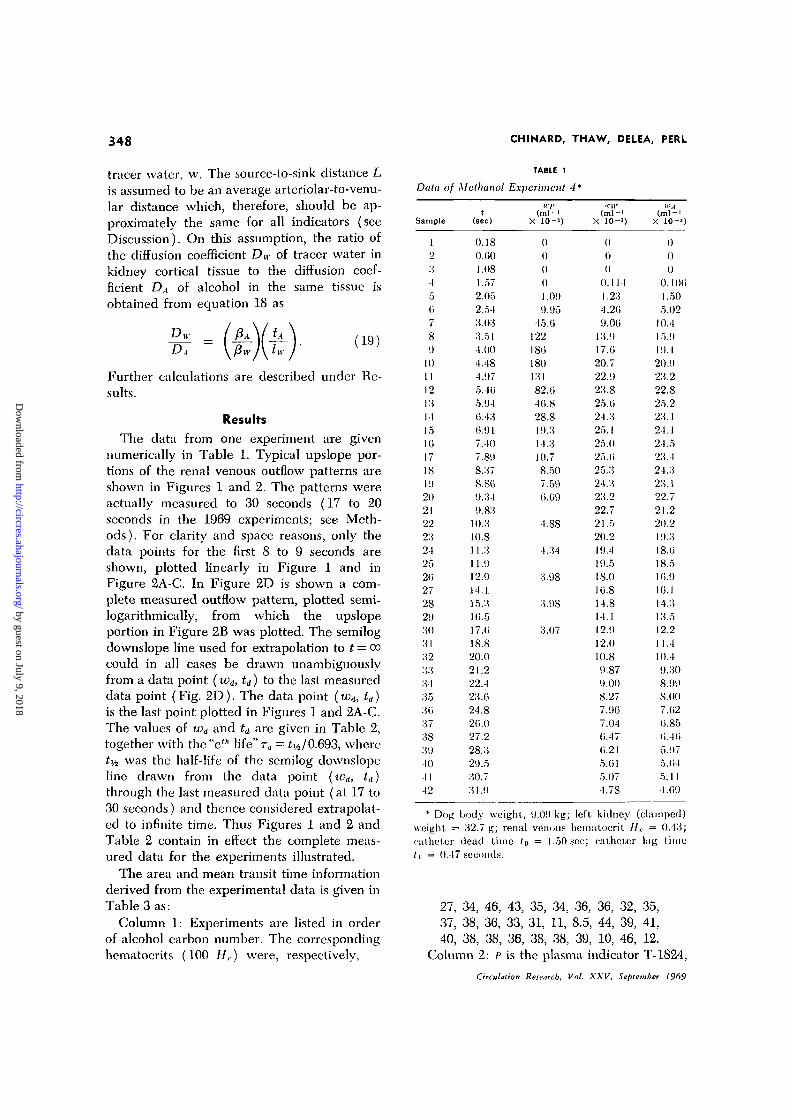
tracer water, w. The source-to-sink distance Lis assumed to be an average arteriolar-to-venu-lar distance which, therefore, should be ap-proximately the same for all indicators (seeDiscussion). On this assumption, the ratio ofthe diffusion coefficient Dw of tracer water inkidney cortical tissue to the diffusion coef-ficient T>A of alcohol in the same tissue isobtained from equation 18 as
TABLE 1
Data of Metlianol Experiment 4*
D,(19)
Further calculations are described under Re-sults.
Results
The data from one experiment are givennumerically in Table 1. Typical upslope por-tions of the renal venous outflow patterns areshown in Figures 1 and 2. The patterns wereactually measured to 30 seconds (17 to 20seconds in the 1969 experiments; see Meth-ods). For clarity and space reasons, only thedata points for the first 8 to 9 seconds areshown, plotted linearly in Figure 1 and inFigure 2A-C. In Figure 2D is shown a com-plete measured outflow pattern, plotted semi-logarithmically, from which the upslopeportion in Figure 2B was plotted. The semilogdownslope line used for extrapolation to t = oocould in all cases be drawn unambiguouslyfrom a data point (wd, td) to the last measureddata point (Fig. 2D). The data point (wt, td)is the last point plotted in Figures 1 and 2A-C.The values of iod and td are given in Table 2,together with t h e V life"r<; = £..4/0.693, whereUh was the half-life of the semilog downslopeline drawn from the data point (wd, td)through the last measured data point (at 17 to30 seconds) and thence considered extrapolat-ed to infinite time. Thus Figures 1 and 2 andTable 2 contain in effect the complete meas-ured data for the experiments illustrated.
The area and mean transit time informationderived from the experimental data is given inTable 3 as:
Column 1: Experiments are listed in orderof alcohol carbon number. The correspondinghematocrits (100 H,.) were, respectively,
Sample
12
345
078'.)1011121314151017IS102021222324252027282!)3031323331353037383(.)
404112
t(sec)
0.18
0.00
1.08
1.57
2.05
2.54
3.03
3.51
4.00
4.48
4.97
5.40
5.94
0.43
0.9 L
7.40
7.89
8.37
8.S0
9.34
9.83
10.3
10.8
11.3
11.9
12.9
14.1
15.3
10.5
17.0
18.8
20.0
21.2
22.4
23.0
24.8
20.0
27.2
28.3
29.5
30.7
31.9
u-r(ml-1
X 10-')
0000
1.09
9.95
45.0
12218018013182.0
40.8
28.8
19.3
14.3
10.7
8.50
7.59
0.09
4.88
4.34
3.98
3.98
3.07
(ml-1X 10-')
000
0.11 1
1.23
4.20
9.00
13.9
17.0
20.7
22.9
23.8
25.0
24.3
25.1
25.0
25.0
25.3
24.3
23.2
22.7
21.5
20.2
19.4
19.5
18.0
10.8
14.8
14.1
12.9
12.0
10.8
9.87
9.00
S.27
7.90
7.04
0.47
0.21
5.01
5.07
4.7S
U.-.4(ml-1X 10-J)
000
0.100
1.50
5.02
10.4
15.9
19.1
20.9
23.2
22.8
25.2
23.1
24.1
2-1.5
23.4
24.3
23.1
22.7
21.2
20.2
19.3
18.0
18.5
10.9
10.1
14.3
13.5
12.2
1 1.4
10.4
9.30
8.99
S.00
7.02
0.85
0.40
5.97
5.04
5.1 1
4.09
* Dog body weight,, 9.09 kg; left kidney (clamped)weight, = 32.7 g; renal venous hematoerit Ile = 0.43;catheter dead time t0 = 1.50 sec; catheter lag time/i = 0.47 seconds.
27, .34, 46, 43, 35, 34, 36, 36, 32, 35,37, 38, 36, 33, 31, 11, 8.5, 44, 39, 41,40, 38, 38, 36, 38, 38, 39, 10, 46, 12,
Column 2: I' is the plasma indicator T-1824,
Circulation Research, Vol. XXV, September 1969
by guest on July 9, 2018http://circres.ahajournals.org/
Dow
nloaded from

INTRARENAL VOLUMES AND DIFFUSION OF ALCOHOLS 349
10* w
Ozwf
28 n
2 4 -
2 0 -
16 -
12-
8 -
4 -
0 -
A
JJ
AAA Vfl
IJl expr. -c
V/—1 1 1 1 1 1 1
4 9 6 7 STIME,1. SECONDS
IO3w
4 5 6 7TIME.1, SECONDS
10'
2 3 4 3 6 7 8 9
TIME,t, SECONDS
FIGURE 1
Typical renal venous outflow patterns of the monohydric alcohols (n-alcohol-11'<C) relative totritiated water (THO) and to the plasma indicator T-1824. Ordinate: 10s X fraction pervolume, w, or 102 X fraction per volume of T-1824 indicator, IUJ,. Open squares — alcohol;open circles = THO; filled triangles = first few points of T-1824 pattern; half-filled triangles,remaining points of T-1824 pattern, reduced in scale by one tenth. The coordinates 10s wd, td
of the last plotted point and subsequent "eth life" TA are given in Table 2. A, n-methanol-1'iC;B, n-ethanol-V'iC; C, n-pwpanol-l"'C; D, n-butanol-1'lC.
the subscript to A is the alcohol carbon numberand w the tracer water THO.
Column 3: The reciprocal of the area underthe recirculation corrected indicator curve isA"1 which equals F/R by equation 5. The areawas determined in accordance with equation3 as
A = (id + to-, + . . . + wd)M + wd(T,, - %At)l 20)
where At was the time increment betweensamples.
Column 4: The ratio of the area A under theindicator curve to the area Aw under the THOindicator curve is obtained from column 3.This ratio equals, by equation 4,
R/Rir
A,,-(21)
The ratio A/Aw is an index of the "quality" ofthe experiment. For example, in experimentno. 2 the ratio A,/Aw= 1.17 indicates that therelative recovery of methyl alcohol to waterwas 1.17, since the weighted average bloodflow during the almost equal times of emer-gence of these indicators should be the same(Fig. 1A). The ratio AP/AW= 1.09 for T-1824in the same experiment, on the asump-tion of good absolute recovery for T-1824,suggests (1) that the absolute recovery' oftracer water was somewhat low (hence that ofmethyl alcohol was good) and (2) that theblood flow decreased during sampling, so thatFH- was less than F,> (19).
Column 5: The renal venous mean transittime was determined from the indicator curvein accordance with equation 7 as
Circulation Research. Vol. XXV, September 1969
by guest on July 9, 2018http://circres.ahajournals.org/
Dow
nloaded from

350 CHINARD, THAW, DELEA, PERL
TIME, t, SECONDS
I ' i—•—r6 6 10 12 14
TIME, f, SECONDS
FIGURE 2
Legend as in Figure 1. A, n-pentanol-l'iC; B, n-hexanol-1'iC; C, n-hexanol-1''>C, 0.10hematocrit; D, n-hexanol-l"iC, semilogarithmic plot of experiment in B, 0.46 hematocrit.
t = A"-1 [tui + 2u;o + . . . + ? +wti(T<i-
(22)
where t,:e — t^+ tx is the mean transit time.Column 6: The ratio of mean transit time of
indicator to that of tracer water was obtainedfrom the data in column 5 and is interpretedby equation 15 or 16. These equations, in con-
_ l -o _+. rv 9 dpm/ml red cells _ ^dpm/ml plasma
trast to equation 5, require a steady state, thatis, constancy of blood flow. Equations 15 and16 become suspect if the variation of bloodHow suggested by column 4 becomes apprecia-ble.
To interpret equation 15, the partition co-efficient of alcohol between red cells and plas-ma is required. These values, determined aspreviously described, were: for hexanol,
dpm/g red cell waterdpm/g plasma water
and for butanol,
-— {J--Ldpm/ml red cells _dpm/ml plasma
— \J.Xdpm/g red cell water
dpm/g plasma water
(23)
(24)
Circulation Research, Vol. XXV, September 1969
by guest on July 9, 2018http://circres.ahajournals.org/
Dow
nloaded from

INTRARENAL VOLUMES AND DIFFUSION OF ALCOHOLS 351
TABLE 2
Experimental Downslope Data
Expt.
4
7
11
14
21.
29
28
Ind.1
PA,W
P\->
wpA3
W
PA4W
PA 5
W
PA 6W
PA6
W
10> wd(ml"')
13123.425.0
13410.521.1
7S.09.439.02
13720.522.8
11922.524.0
12422.320.0
80.311.621.3
id
(sec)
4.977.S97.89
4.7510.410.4
5.7510.510.5
0.759.479.47
5.737.777.77
4.428.417.84
3.2710.57.93
(sec)
0.94114.314.2
1.1112.112.0
0.90912.212.3
1.2315.014.4
1.1817.010.8
0.07813.011.8
0.71913.00.53
*P = plasma indicator T-1824; subscript to A =alcohol carbon number; W = tracer water THO.
in which 0.2 represents 2 standard deviationsof the five hexanol measurements and 0.1represents 2 standard deviations of the fourbutanol measurements.
The ratios of mean transit times of alcoholto tracer water obtained from Table 3, column6, are plotted against alcohol number (Fig. 3).These values should be largely independent ofvariation in recovery (which has little effect onmean transit time) or of variation in bloodflow (which should affect the mean transittimes of alcohol and water similarly). Moder-ate variations in recovery or blood flow shouldhave only a minor influence on the nondimen-sionalized shape of the indicator curves (seebelow), which were the data of primary inter-est in the present study.
The basic result of the present experimentswas that at normal hematocrits the alcoholindicator curves differed significantly from thewater indicator curves mainly in the upslope
Circulation Research. Vol. XXV, September 1969
region (Figs. 1 and 2). This difference wasascribed to the "diffusion bypass" effect (14-16) and was analyzed by the convection-diffu-sion model (13). The indicator curves werefirst corrected for shape distortion due tocatheter effect by equation 17 and thennondimensionalized as previously described. Atypical pair (methanol and water) of correctedand nondimensionalized indicator curves iscompared with the corresponding pair of un-corrected curves (Fig. 4). The shape-correctedcurves were then compared with the theoreti-cal model curves (Fig. 5) in the upsloperegion, as follows. The theoretical curves are
1.6-
0 1 2 3 4 5 6 7ALCOHOL CARBON NUMBER,!!
FIGURE 3
Ratio of mean transit time of alcohol (or krypton,tritium gas) to mean transit time of tritiated (or deu-terated) water. Open circles = 1967 series; solid circles= 1968 series; vertical half-solid circles = 1969series at low hematocrit; horizontal half-solid circle =experiment 29 at normal hematocrit; squares = tritiumgas (13); triangles = krypton (13); cross = tritiatedwater.
by guest on July 9, 2018http://circres.ahajournals.org/
Dow
nloaded from

352 CHINARD, THAW, DELEA, PERL
Area,
!
Expt.
1
2
3
4
5
G
7
8
9
10
11
12
13
14
15
I t\l u
Mean
2
Ind.
PA,W
PA,W
PA,W
PA,\V
PA 2\V
PA 2W
PA2
W
PA2
W
PA3
W
PA 3
\V
PA 3W
PA,W
PA,W
PA 4W
PA 4
W
pi
A.,\V
i Transit
3A~'
(cm!/sec)
3.433.473.19
3.293.083.G0
2.942.852.92
2.382.252.12
2.282.402.15
3.233.112.97
2.472.582.40
3.893.793.S2
2.823.213.00
2.202.031.95
2.592.922.95
7.210.000.49
3.082.993.25
2.27
2.319 i^
3.774.173.93
A 704 . / U
3.913.09
TABLE ;
Time and
4
A/Aw
0.930.92
1.091.17
0.991.02
0.890.94
0.940.87
0.920.95
1.000.95
0.981.01
LOG0.93
0.800.90
1.141.01
0.900.98
1.001.09
1.04
1.02
1.040.94
0 70\l. t ,f
0.94
i
Peclet
5
(sec)
2.4414.015.4
3.3813.713.3
2.7513.213.1
2.9210.110.4
3.1418.722.4
2.5910.317.0
2.5814.314.0
2.1110.410.4.
3.4013.014.3
3.8020.821.9
3.1015.010.3
1.789.039.47
2.9015.914.3
4.00
10.017.3
2.279.00
10.0
1 70l. i \j
9.218.47
Parameter
6
I/Ill-
0.100.95
0.251.03
0.211.01
O.1S0.98
0.140.83
0.150.90
0.180.98
0.201.00
0.240.95
0.170.95
0.190.9G
0.190.95
0.211.11
0.23
0.90
0.230.97
n 9n\J ,£d\J
1.09
7
(3
0.8G11.22
0.8741.29
1.021.51
0.7000.833
0.3510.000
0.44G0.G89
0.9991.25
1.311.35
0.0851.11
0.3910.809
O.GIS1.27
0.7401.4S
0.3501.19
0.8001.315
0.0531.70
0.4472.03
17
18
19
20
21
22
23
24
25
20
27
28
29
30
PA.,W
PA5
W
PA5
W
PA 5
\V
PA 5W
P
A 3
W
PAo
W
PAnW
PA«W
PA 6
W
PA6
W
PAcW
PA f)
W
PA6
W
5.503.92x inO. 1 \J
0.510.76G.24
0.780.325.92
3.293.042.81
2.042.001.90
3.133.052.95
4.043.924.31
4.554.254.04
3.933.102.90
2.742.482.45
2.091.881.80
4.833.713.74
2.572.322.23
5.094.974.37
0.070.94
0.9G0.92
0.870.94
0.850.92
0.900.98
0.940.97
1.071.10
1.021.09
0.740.94
0.890.99
0.800.90
0.771.01
0.870.90
0.770.88
2.179.739.17
1.887.808.9S
2.239.50
10.0
2.4011.211.8
3.3918.018.8
2.9214.0H.2
2.3411.011.3
2.1811.911.1
2.1713.512.9
2.5214.514.4
2.9520.421.0
1.8814.78.85
2.4514.513.7
1.309.900.11
plots of the nondimensional
0.24LOG
0.210.87
0.210.90
0.200.95
0.180.9G
0.210.99
0.211.03
0.201.07
0.171.05
0.181.01
0.140.97
0.21LOG
0.181.00
0.211.03
ordinate
0.5822.21
0.9151.50
0.7501.39
0.4911.07
0.3780.005
0.4191.38
0.7311.72
0.5580.850
0.5801.04
0.3971.17
0.2240.402
0.2521.98
0.3030.940
0.2822.33
100A~llwth against the nondimensional abscissat/t/3 =
for various values ofL-IDt,
tance fromandthe
wherethe Peclet parameter
L (cm) is anarteriolar sources to
D (cm2/sec) iis the idiffusion
average dis-venular sinkscoefficient of
indicator in the tissue. Cross plots of thetheoretical curves were made 1for values of
Circulation Research, Vol. XXV, September 1969
by guest on July 9, 2018http://circres.ahajournals.org/
Dow
nloaded from

INTRARENAL VOLUMES AND DIFFUSION OF ALCOHOLS 353
100 100
.2 .3
t'/t,FIGURE 4
.4
t/'t.6
Normalized indicator curves before (solid line) andafter (dashed line) catheter shape correction. Theuncorrected curves have area = 100 and the meantransit time is at 1 -\- (to/t). The shape-corrected curveshave area = 100 and the mean transit time is at 1.Open circles = tritiated water, uncorrected; solidcircles = tritiated water corrected; open squares =methanol uncorrected; solid squares = methanol, cor-rected. Experiment 1.
the ordinate equal to constant fractions oftheir maximum values (Fig. 6, Table 4). Forexample, column 4 in Table 4 contains thevalues of the nondimensional time at which
t/tj/tFIGURE 5
Comparison of shape-corrected, normalized indicatorcurves with the theoretical model curves of reference13. Solid lines = theoretical curves; dashed lines =experimentally derived curves; circles = tritiatedwater; squares = methanol. Experiment 1.
the ordinate on the theoretical curve, for the/3 value in column 1, is at 90% of its maximumvalue. Column 2 of Table 4 contains, for refer-ence, the maximum values of the theoreticalordinates. The cross plot (Fig. 6) was used toestimate /3 for the corrected experimentalcurves at nondimensional times corresponding
TABIE 4
Cross Plot of Conccction-Difjusion Model Curves
1
0
0
0.10.5]
25
1050
100-----
2100 f w,i,
A
100'.)().!)
02.4
00.0
'.)().5
08.2
11-1
210200
3
' i n n
I
0.05:5
.IS
.2SA2S,:i
.77
.01
.071
4
<mt
0.027
.1 II
. 1 SO
.:«)()
.-18!)
.o:i5
.802
.00!)
1
5
' , 0
?
0.022
.0005
.158
.258
.«55
.58:-!
.825
,ss:̂J
li
'TO
?
0.018.077.VA7.220.SOS.54-1.708.8021
7' «(
0.015.000.121.205.3075.5075.772.8-121
8
<M
(
I).0125.050.108.185.33!).4755.747.S221
Circulation Research. Vol. XXV, September 1969
by guest on July 9, 2018http://circres.ahajournals.org/
Dow
nloaded from

354 CHINARD, THAW, DELEA, PERL
.40-
FlGURE 6
Cross-plots of theoretical model curves. Ordinateequals abscissa of theoretical curves (Fig. 5) at whichordinate of theoretical curve (Fig. 5) is at percentagem of maximum ordinate. Abscissa is Peclet parameterp, which labels each theoretical curve (Fig. 5).
to ordinates at various percentage fractions oftheir maximum value. For example, for themethanol curve (Fig. 5) the ordinate that ishalf the maximum ordinate has the abscissat'/t = 0.088. At the ordinate value 0.088 inFigure 6, the abscissa corresponding to the 50%curve is /3- 0.78. Similarly, the 60, 70, 80 and90% ordinates of the methanol curve (Fig. 5)had abscissas which, on the correspondingcurves in Figure 6, yielded j3 values of 0.84,0.86, 0.88, 0.86, respectively (abscissas outsidethe range of 50 to 90% were too imprecise to beof use). Similarly, the water curve (Fig. 5)yielded 50, 60, 70, 80, and 90% f3 values of1.10, 1.18, 1.22, 1.26, and 1.24. For a perfect fitof the model to the experimental data, thepreceding values of /3 for a given indicatorshould all be the same. It was found that the60, 70, and 80% {S values were not very differ-
ent. Accordingly, these values for the waterindicator were averaged to give /3,,- (Table 3,column 7). The product of /3W and the aver-aged (over 60, 70, 80 percent) ratio /3A/f3w
gave /3A for the alcohol (Table 3, column 7).The values of pAtdPwhv obtained from Table3, columns 6 and 7 are plotted against alcoholcarbon number n in Figure 7 (the value 1 atn = 0 corresponds to tracer water which is re-garded as an alcohol of carbon number zero).The data for krypton (8r'Kr) and for tritiumgas (To) from reference 13 are included inFigure 7. For this inclusion, "equivalent alco-hol carbon numbers" n(T2) = 5.1 and n(Kr) =5.9 were assigned to these gases by interpolat-ing their oil-water coefficients (24), A.ft(H2) =3.1, Xo(Kr) =9.6 on a plot of log \ 0 (alcohol)against n, where Xo (alcohol) was determinedas previously described (Table 5). The oil-water partition coefficients for methanol to
0 1 2 3 4 5 6 7ALCOHOL CARBON NUMBER,!!
FIGURE 7
Ratio of diffusion coefficient Dw of tritiated waterto diffusion coefficient DA of indicator. Ordinate:indicator-to-water ratio of Peclet parameters, PA/PW,times indicator-to-water ratio of mean transit times,iA/tw. Abscissa: alcohol carbon number or equivalentcarbon number. Data point legend same as in Figure 3.
Circulation Research, Vol. XXV, September 1969
by guest on July 9, 2018http://circres.ahajournals.org/
Dow
nloaded from

INTRARENAL VOLUMES AND DIFFUSION OF ALCOHOLS 355
TABLE 5
Oil-Water Partition Coefficietds and Diffusion Coefficients in Water of the Alcohols
u* 0 1 2 3 4 5 (iXuf 0.001!) 0.013 0.074 0.220 0.700 2.55 10.9DAKX 1-S3 1.20 1.00 0.S7 0.77 0.70§ O.04§
* Alcohol carbon number, n = 0 denotes THO.t Olive oil-water partition coefficient a t 37°C, see text.X Diffusion coefficient (cin-/105 sec) in water at 15°C, from reference 20. The value for u = 0
is denoted Dww in text.§ Obtained by extrapolation, see text.
pentanol (Table 5) may be compared to thevalues 0.0095 (methanol), 0.035 (ethanol),0.155 (propanol), 0.63 (butanol), 2.3 (pen-tanol) measured at 25°C by a nonradioactivetechnique (25). For theoretical interpretation,the data ordinates in Figure 7 were multipliedby the ration DA,JDWw of the diffusion coef-ficient of alcohol in water to the diffusioncoefficient of tracer water in water (Table 5)and the results are plotted in Figure 8. Thesediffusion coefficients for alcohols 1 to 4 wereobtained in similar experiments at 15°C (26).A log-log plot of these diffusion coefficientsagainst molecular weight was almost linearand was extrapolated to yield the diffusioncoefficients for pentanol and hexanol in water.
Discussion
The main results of the present experimentsare:
1. At normal hematocrit the mean transittimes of the monohydric alcohols from meth-anol to hexanol are about the same as fortritiated water (Fig. 2).
2. At low hematocrit induced by bleedingand dextran loading, the mean transit time ofhexanol was significantly increased relative tothat for tritiated water (Table 3, experiments28 and 30 at low hematocrit. Experiment 30 atlow hematocrit 0.12 was performed after ex-periment 29 at normal hematocrit 0.46 on thesame dog).
3. The upslope of the alcohol indicatorcurve occurs sooner than that of tritiatedwater, the more so with increasing alcoholcarbon number (Figs. 1 and 2). This effectpersists at low hematocrit (Fig. 2C).
Result 1 alone would normally be inter-
Circulaiion Research, Vol. XXV, September 1969
preted as indicating approximately equal vol-umes of distribution for the alcohols and fortritiated water. Result 2 and the red-cell-to-plasma partition coefficient, equation 23, makethis interpretation untenable. If the values ij£,r=1.06, He = 0.46 from the normal hemato-crit hexanol experiment I-14-69b, the red cellto plasma partition coefficient of tritiatedwater yWr = 0.75 and the red cell to plasmapartition coefficient of hexanol, equation 23,y6r = 1.58, are substituted into equation 15, theresult is Vdc,/Viw = 1.52. The values ijiw —1.63 and He = 0.12 from the low hematocrit
0 I 2 3 4 5 6 7
ALCOHOL CARBON NUMBER.D
FIGURE 8
Kidney cortex to water ratio of tritiated water diffusioncoefficients, Dw/DWw, divided by similar ratio forindicator, DA/DAlc. Ordinate: ordinate of Figure 7times DAw/DWw, Abscissa: same as in Figure 7. Datapoint legend same as in Figure 3.
by guest on July 9, 2018http://circres.ahajournals.org/
Dow
nloaded from

356 CHINARD, THAW, DELEA, PERL
hexanol experiment 30 and the same partitioncoefficients yield similarly Vd6/Vdw = 1.80.Result 2 and equation 23 are then consistentwith a volume of distribution of hexanol rela-tive to that of water of Vd6/Vdw= 1.66. In-sertion of this value into the middle member ofequation 15, together with the estimated valuesyWi = 0.88, yei = 1.0 and the measured value(Table 5) A(i/= 11, yields Vf/Vt = 0M, whichdoes not differ significantly from the normallipid content of non-adipose tissue. Thus theincreased hexanol volume of distribution overthat of water may reasonably be ascribed tothe normal lipid content of kidney cortical tis-sue, although a greater than normal lipidcontent (ascribable to lipid-preferring path-ways of tracer hexanol) is not ruled out.
Result 3 of the present experiments, thatthe upslope portion of the alcohol indicatorcurve occurs sooner than that of the waterindicator curve, is interpreted on the convec-tion-diffusion model (13) as a greater diffusi-bility of the alcohol relative to the tritiatedwater, in kidney cortical tisue. That this effectwas not due to a red cell effect was verified bythe low hematocrit experiments which yieldedapproximately the same upslope position (Fig.2C) and therefore diffusibility deductionssimilar to those from the normal hematocritexperiments (Figs. 7 and 8).
The ratio DWIDA of diffusion coefficient oftritiated water to diffusion coefficient of alco-hol shows considerable scatter when plottedagainst alcohol carbon number (Fig. 7). Adownward trend is evident, however, whichbecomes much clearer (Fig. 8) when theordinates are divided by the ratio DWm/DAw
of the respective diffusion coefficients inwater (Table 5). The ordinate in Figure 8represents the effect of the tissue in decreas-ing the diffusion coefficient in water of tritiatedwater, relative to the same effect for alcohol.This effect is presumably due to the barriereffect of the various lipid membranes of thetissue. Thus the lipid insoluble tritiated watertraverses a path from arteriolar source tovenular sink which is more tortuous than thatof the lipid soluble indicator hexanol. On thepresent macroscopic distance level, hexanol
would therefore have a higher diffusion coeffi-cient than tracer water. The ratio DttID6u, ofthe tissue diffusion coefficient of hexanol to itswater diffusion coefficient may be estimatedas unity, since little lipid barrier effect wouldbe expected to exist for hexanol (the oil-waterpartition coefficient for hexanol is 10.9 [Table5]). The results in Figure 8 show that thecorresponding ratio Dw/DWt0 for tritiatedwater is approximately 0.18. This value maybe compared with Kety's estimate (27) thatdiffusion coefficients of gases in tissues arefrom one-third to one-half their values inwater.
If the interpretation by the convection-dif-fusion model is basically correct, then to ourknowledge the present work represents thefirst attempt to deduce diffusion coefficientsin perfused tissue. Although absolute diffusioncoefficients cannot at present be derived quan-titatively because of insufficient knowledge ofthe vascular geometry in the tissue, it appearsthat relative diffusion coefficients among vari-ous substances are capable of reliable deriva-tion by the present method. Such data shouldbe of value in elucidating transport mecha-nisms in living perfused tissues.
Finally, we wish to point out that multipleindicator dilution studies have been carriedout in patients with essential hypertension(19). Studies in which one or more of the ali-phatic alcohols (or similar substances) is usedcould be of value in assessing the functionaldistortion of the kidneys in patients with renaldisease and thus provide evaluation by non-destructive means of some of the structuralchanges of the kidneys. Possible conditionsin which such tests could be applied arepyelonephritis, acute renal failure, and renaltransplants.
References
1. CHINARD, F. P.: Capillary Permeability. Bull.Johns Hopkins Hosp. 88: 489, 1951.
2. ZIERLER, K. L.: Circulation times and the theoryof indicator-dilution methods for determiningblood flow and volume. In Handbook ofPhysiology, sec. 2, vol. 1, Circulation, edited byW. F. Hamilton and P. Dow. Washington,D. C , American Physiological Society, 1962, p.585.
Circulation Research, Vol. XXV, September 1969
by guest on July 9, 2018http://circres.ahajournals.org/
Dow
nloaded from

INTRARENAL VOLUMES AND DIFFUSION OF ALCOHOLS 357
3. GORESKY, C. A.: Distribution of substances in aflow-limited organ, the liver. In Compartments,Pools, and Spaces in Medical Physiology,edited by P.-E. E. Bergner and C. C. Lush-baugh, 1967, p. 423. Available as CONF-661010, Clearinghouse, U. S. Dept. of Com-merce, Springfield, Virginia 22151.
4. CHINABD, F. P., EFFHOS, R., PERL, W., ANDSILVERMAN, M.: Organ vascular and extravas-cular compartments in vivo. Ibid. p. 381.
5. EFFROS, R. M., AND CHINARD, F. P.: In vivo pHof the extravascular space of the lung. J. Clin.Invest., in press.
6. GOMEZ, D. M., DEMEESTER, M., STEINMETZ, P.R., LOWENSTEIN, J., SAMMONS, B. P.,BALDWIN, D. S., AND CHASIS, H.: Functionalblood volume and distribution of specific bloodflow in the kidney of man. J. Appl. Physiol.20: 703, 1965.
7. MARTIN, P., AND YUDILEVICH, D.: Theory forthe quantification of transcapillary exchange bytracer-dilution curves. Am. J. Physiol. 207:162, 1964.
8. NEWMAN, E. V., MERRELL, M., GENECIN, A.,MONCE, C., MlLNOR, W. R., AND McKEEVER,W. P.: Dye dilution method for describing thecentral circulation. Analysis of factors shapingthe time-concentration curves. Circulation 4:735, 1951.
9. GORESKY, C. A.: Linear method for determiningliver sinusoidal and extravascular volumes. Am.J. Physiol. 204: 626, 1963.
10. GORESKY, C. A.: Initial distribution and rate ofuptake of sulfobromophthalein in the liver.Am. J. Physiol. 207: 13, 1964.
11. LILIENFIELD, L. S., FREIS, E. D., PARTENOPE, E.A., AND MOROWITZ, H. J.: Transcapillarymigration of heavy water and thiocyanate ionin the pulmonary circulation of normal subjectsand patients with congestive heart failure. J.Clin. Invest. 34: 1, 1955.
12. CRONE, C : Permeability of capillaries in variousorgans as determined by use of the 'indicatordiffusion' method. Acta Physiol. Scand. 58:292, 1963.
13. PERL, W., AND CHINAHD, F. P.: A convection-diffusion model of indicator transport throughan organ. Circulation Res. 22: 273, 1968.
14. CHINARD, F. P., AND ENNS, T.: Relative renalexcretion patterns of sodium ion, chloride ion,urea, water and glomerular substances. Am. J.Physiol. 182: 247, 1955.
15. LEVY, M. N., AND SAUCEDA, G.: Diffusion ofoxygen from arterial to venous segments ofrenal capillaries. Am. J. Physiol. 196: 1336,1959.
16. CHINARD, F. P.: Evidence for a diffusion by-passof the renal cortical vascular system (abstr.).International Conference on Nephrology,Washington, D. C , 1966.
17. CHINARD, F. P., ENNS, T., GORESKY, C. A., ANDNOLAN, M. F.: Renal transit times anddistribution volumes of T-1824, creatinine, andwater. Am. J. Physiol. 209: 243, 1965.
18. CROPP, G. J. A., AND BURTON, A. C: Theoreticalconsiderations and model experiments on thevalidity of indicator dilution methods formeasurements of variable flow. Circulation Res.18: 26, 1966.
19. EFFROS, R. M., LOWENSTEIN, J., BALDWIN, D. S.,AND CHINARD, F. P.: Vascular and extravascu-lar volumes of the kidney of man. CirculationRes. 20: 162, 1967.
20. PERL, W., EFFROS, R. M., AND CHINARD, F. P.:Indicator equivalence theorem for input ratesand regional masses in multi-inlet steady statesystems with partially labeled input. J. Theoret.Biol., in press.
21. ZIERLER, K. L.: Equations for measuring bloodflow by external monitoring of radioisotopes.Circulation Res. 16: 309, 1965.
22. STEPHENSON, J. L.: Theory of measurement ofblood flow by dye dilution technique. IRETrans. Med. Electron. PGME-12: 82, 1958.
23. GORESKY, C. A., AND SILVERMAN, M.: Effect ofcorrection of catheter distortion on calculatedliver sinusoidal volumes. Am. J. Physiol. 207:883, 1964.
24. LAWRENCE, J. H., LOOMIS, W. F., TOBIAS, C. A.,AND TURPIN, F. H.: Preliminary observationson the narcotic effect of xenon with a review ofvalues for solubilities of gases in water andoils. J. Physiol. (London) 105: 197, 1946.
25. LINDENBERG, B. A.: Sur la solubilite dessubstances organiques amphipatiques dans lesglycerides neutres et hydroxyles. J. Chim. Phys.48: 350, 1951.
26. JOHNSON, P. A., AND BABB, A. L.: Liquiddiffusion of non-electrolytes. Chem. Rev. 56:387, 1956.
27. KETY, S. S.: Theory and applications of theexchange of inert gas at the lungs and tissues.Pharmacol. Rev. 3: 1, 1951.
Circulation Research, Vol. XXV, September 1969
by guest on July 9, 2018http://circres.ahajournals.org/
Dow
nloaded from

Francis P. Chinard, Colette N. Thaw, Anne C. Delea and William PerlAlcohols
Intrarenal Volumes of Distribution and Relative Diffusion Coefficients of Monohydric
Print ISSN: 0009-7330. Online ISSN: 1524-4571 Copyright © 1969 American Heart Association, Inc. All rights reserved.is published by the American Heart Association, 7272 Greenville Avenue, Dallas, TX 75231Circulation Research
doi: 10.1161/01.RES.25.3.3431969;25:343-357Circ Res.
http://circres.ahajournals.org/content/25/3/343World Wide Web at:
The online version of this article, along with updated information and services, is located on the
http://circres.ahajournals.org//subscriptions/
is online at: Circulation Research Information about subscribing to Subscriptions:
http://www.lww.com/reprints Information about reprints can be found online at: Reprints:
document. Permissions and Rights Question and Answer about this process is available in the
located, click Request Permissions in the middle column of the Web page under Services. Further informationEditorial Office. Once the online version of the published article for which permission is being requested is
can be obtained via RightsLink, a service of the Copyright Clearance Center, not theCirculation Research Requests for permissions to reproduce figures, tables, or portions of articles originally published inPermissions:
by guest on July 9, 2018http://circres.ahajournals.org/
Dow
nloaded from