Intrarenal Distribution of Nutrient Blood Flow...
19
Intrarenal Distribution of Nutrient Blood Flow Determined with Krypton 85 in the Unanesthetized Dog By Geoffrey D. Thorburn, M.B., Hugh H. Kopald, M.D., J. Alan Herd, M.D., Milton Hollenberg, M.D., Charles C. C. O'Morchoe, M.D., and A. Clifford Barger, M.D. • The development of the couutercnrrent hypothesis as an explanation for the osmotic gradient from cortex to papilla of the kidney 1 has again stimulated investigation of the in- trarenal distribution of blood flow. Theoret- ical considerations have emphasized the necessity of a relatively low medullary blood flow for the maintenance of this gradient. 2 However, present methods of measuring renal blood flow in the intact animal do not esti- mate the distx-ibution of flow to the medulla. Trueta and co-workers 3 demonstrated by renal angiography that medullary flow was slower than that of the cortex; these obser- vations have been confirmed by Kramer et al., 4 ' r ' who found that the medullary transit time of Evans blue dye was much longer than that of the cortex. In the present investigation, a method has been developed for determining distribution of renal blood flow in the unanesthetized dog by monitoring the disappearance of Kr 85 from the kidney after injection of the isotope into the chronically catheterized renal artery; no blood samples are needed for the measure- ment. .Kr**, an inexpensive and readily available isotope, was used by Brun and co- workers" to measure renal blood flow by the modified ICety 7 technique; they were, at that time, unaware of the gamma emissions from Kr a '\ Although Kr 8S is primarily a beta emit- ter, 0.6% of its disintegrations are gamma From the Dormrtiiicnts of Physiology and Anatomy, Harvard Medical School, Boston, Massachusetts. Supported in part by Grant HE 02493 froDi the U. S. Public Health Service, the Massachusetts Heart Association, and the Eugene Higgins Trust through Harvard University. Eeeeived for publication April 11, 1963. 290 rays which can be detected externally. Since urine samples are also unnecessary, the method can be used in oligurie or an uric states. The validity and accuracy of this method for measurement of blood flow in the myocardium has recently been demonstrated in this laboratory 8 ; in this tissue, with uni- form distribution of blood flow, a single expo- nential disappearance curve was obtained. The decay curves in the kidney are more com- plex, and can be described by a series of exponentials, each associated with blood flow through localized regions of the kidney. These regions, which have been identified in acute experiments by the autoradiographic tech- nique to be described below, are (1) cortex, (2) outer medulla and inner cortex, (3) inner medulla, and (4) perirenal and hilar fat. Methods Polyvinyl catheters (OD 0.030 indies and ID 0.015 inches) were introduced for chronic use into the renal artery of four anesthetized male dogs by a method previously described"; in three dogs only the left renal artery was catheterized, while both renal arteries were intubated in the fourth animal. The animals were allowed at least one week recovery before the flow measurements were started. During this period the animals were trained to lie quietly fox* several hours on a padded table (fig. 1A). Before each experiment the animals were fasted for 16 to 20 hours; although they had free access to water, the ani- mals maintained themselves in a relatively dehy- drated state, with low basal urine flows. No water was allowed during the two to four hours of blood flow measurements. Preliminary experiments indi- cate that a negligible amount of krypton is carried into the pelvic urine under these conditions. Two hundred to four hundred microeuries of Kr S5 dis- solved in 0.2 ml to 0.5 ml saline (0.S5%) were injected rapidly through a double-barreled adapter into the catheter (fig. IB) followed immediately Circulation Research. Volume XIII, October 19GS by guest on May 28, 2018 http://circres.ahajournals.org/ Downloaded from
Transcript of Intrarenal Distribution of Nutrient Blood Flow...

Intrarenal Distribution of Nutrient Blood FlowDetermined with Krypton85 in theUnanesthetized Dog
By Geoffrey D. Thorburn, M.B., Hugh H. Kopald, M.D., J. Alan Herd, M.D.,Milton Hollenberg, M.D., Charles C. C. O'Morchoe, M.D., andA. Clifford Barger, M.D.
• The development of the couutercnrrenthypothesis as an explanation for the osmoticgradient from cortex to papilla of the kidney1
has again stimulated investigation of the in-trarenal distribution of blood flow. Theoret-ical considerations have emphasized thenecessity of a relatively low medullary bloodflow for the maintenance of this gradient.2
However, present methods of measuring renalblood flow in the intact animal do not esti-mate the distx-ibution of flow to the medulla.Trueta and co-workers3 demonstrated byrenal angiography that medullary flow wasslower than that of the cortex; these obser-vations have been confirmed by Kramer etal.,4'r' who found that the medullary transittime of Evans blue dye was much longer thanthat of the cortex.
In the present investigation, a method hasbeen developed for determining distributionof renal blood flow in the unanesthetized dogby monitoring the disappearance of Kr85
from the kidney after injection of the isotopeinto the chronically catheterized renal artery;no blood samples are needed for the measure-ment. .Kr**, an inexpensive and readilyavailable isotope, was used by Brun and co-workers" to measure renal blood flow by themodified ICety7 technique; they were, at thattime, unaware of the gamma emissions fromKra'\ Although Kr8S is primarily a beta emit-ter, 0.6% of its disintegrations are gamma
From the Dormrtiiicnts of Physiology and Anatomy,Harvard Medical School, Boston, Massachusetts.
Supported in part by Grant HE 02493 froDi theU. S. Public Health Service, the Massachusetts HeartAssociation, and the Eugene Higgins Trust throughHarvard University.
Eeeeived for publication April 11, 1963.
290
rays which can be detected externally. Sinceurine samples are also unnecessary, themethod can be used in oligurie or an uricstates. The validity and accuracy of thismethod for measurement of blood flow in themyocardium has recently been demonstratedin this laboratory8; in this tissue, with uni-form distribution of blood flow, a single expo-nential disappearance curve was obtained.The decay curves in the kidney are more com-plex, and can be described by a series ofexponentials, each associated with blood flowthrough localized regions of the kidney. Theseregions, which have been identified in acuteexperiments by the autoradiographic tech-nique to be described below, are (1) cortex,(2) outer medulla and inner cortex, (3) innermedulla, and (4) perirenal and hilar fat.
MethodsPolyvinyl catheters (OD 0.030 indies and ID
0.015 inches) were introduced for chronic use intothe renal artery of four anesthetized male dogsby a method previously described"; in three dogsonly the left renal artery was catheterized, whileboth renal arteries were intubated in the fourthanimal. The animals were allowed at least oneweek recovery before the flow measurements werestarted. During this period the animals weretrained to lie quietly fox* several hours on apadded table (fig. 1A). Before each experimentthe animals were fasted for 16 to 20 hours;although they had free access to water, the ani-mals maintained themselves in a relatively dehy-drated state, with low basal urine flows. No waterwas allowed during the two to four hours of bloodflow measurements. Preliminary experiments indi-cate that a negligible amount of krypton is carriedinto the pelvic urine under these conditions. Twohundred to four hundred microeuries of KrS5 dis-solved in 0.2 ml to 0.5 ml saline (0.S5%) wereinjected rapidly through a double-barreled adapterinto the catheter (fig. IB) followed immediately
Circulation Research. Volume XIII, October 19GS
by guest on May 28, 2018
http://circres.ahajournals.org/D
ownloaded from

INTRARENAL NUTRIENT BLOOD FLOW DISTRIBUTION 291
FIGURE 1
A. Illustration of arrangement for measuring nutrient blood flow distribution inthe kidney of the unanesthetized dog, with scintillation detector in position over thecatheterized kidney. B. Injection into catheter through double-barreled adapter ofsolution containing Kr 8sJ followed by saline.
by 1 ml of saline. A scintillation probe, with atwo-inch sodium iodide crystal throe inches fromthe end of a cylindrical colliinatov, was locatedover the kidney of the recumbent animal. The out-put from the probe was led into a linear mtemeterand the decay curve transcribed on a linear re-c order.
The decrease in radioactivity as a, functionof time wns plotted on seiriilogarithmic graphpaper.30 For analysis of the data (fig. 2) astraight line was drawn by inspectiou throughthe terminal portion of the curve and extrapolatedback to zero time (Component IV). The counts/min of the extrapolated line were then subtractedgraphically from the original curve to obtainthe thi r d exponential (Component Til). The secondand first exponentials similarly were drawn insequential fashion (Components II and I ) .
The general form of the equation describingsuch a scries of exponential curves is:A = A^e-Vt + Aa»e-V't -f J^.-e-fc'"' + A0--e-k""t
(1)Where A = total radioactivity (counts/min attime t), k', k", k'", and k"" = the slopesof the four lines, and A- A-, A —, A— —the number of counts present initially in Com-ponents I, IT, III, and IV as determined bythe intercept of each line with the ordinnte. Thepercentage of the total counts distributed initiallyto each compartment was obtained by dividingAo by A at time zero and multiplying by 100.From the general form of the Fiek equation.
^ = F(Ca - C) (2)
WheredQdt
— moles removed from the tissue
per unit time, F = arterial inflow = venous out-flow in ml/niin, Ca and Cv = concentration inarterial and venous blood in moles/ml. Since re-circulation of krypton is extremely small,11 it canbe assumed that Gn = 0 immediately after injec-tion is completed. Thus
= - FG (3)
If the assumption is made that equilibration ofkrypton between blood and tissue is extremelyrapid,7 the rate of desaturation will depend uponthe nutrient or capillary blood flow, and
Gv - Ci (4)A
Where Ot = concentration of the gas in thetissue, and \ the partition coefficient for theinert gas between tissue and blood,* and since
Qr (5)
Where Q = number of moles in the tissue, Y =volume of the tissue in ml.Then
C - Q
°r ~ FXBy substituting for Cr in equation 3
dQ _ FQdt • ~ V\
(6)
(7)
•For renal parenchyma
Research, Volume Xlll, October 19SI
by guest on May 28, 2018
http://circres.ahajournals.org/D
ownloaded from

292 THOEBUBN, KOPALD, HEED, HOLLENBERG, O'MORCHOE, BAEGER
RADIO-ACTIVITY
K r "
CPM
IO0K
10 K
IK
•
COMPONENT I(CORTEX)
COMPONENT H(OUTER
MEDULLA
COMPONENT m•INNER
MEDULLA)
COMPONENT 17(PERIRENAL a
MILAR FAT)
LcOMPONENT D
LcOMPONENT I
V "
9.7
3 4 .
300.
1800.
.O695
mln"1
4 . 4
1.2
.14
.02
COMPONENT I
COMPONENT m
PARTITIONCOEFFICIENT
1
1
1
7=—-
NUTRIENT FLOWml/IOOg/mln
F.ljLA\tflC
440
120
14
19
- — — — _
A.INITIAL
Kr" ACTIVITY
80.000
15,000
3.000
2,000
" " - _
OF TOTALCOUNTS
eo
15
2
'
10 4 030TIME IN MINUTES
K r " INJECTED
FIGURE 2
Typical Kr85 disappearance curve (heavy black line) following injection of theisotope into the renal artery. Graphic representation of the resultant exponentialsis shown by thinner lines (see text). The accompanying table presents pertinent dataand derived values obtained from such a curve.
Rearranging this for integration
*Q £ _ _ J dt (8)
and integrating we obtain Q = 5 oe ~ ' ' (^)
Where Q = number of moles in the tissue at time*j Qo = initial number of moles at time t = 0.Since the activity (eounts/min) is proportionalto the number of MOLES, equation 9 may be written
A = As-tW*)* (10)
F FThus, k (slope of line) — —=> or — = k\.
To convert the nutrient flow into ml/100 g oftissue/min, k~k is multiplied by 100, and dividedby the specific gravity (p) of the tissue. Thus,
F (ml/100 g/mm) = k X k X 10°
and
t, -
0.693
Where a2 = counts/min at time t11 «f = counts/mia at time tt.
FIGURE 3
A u tor a diograpii of renal tissue equilibrated ivithsaline solution containing KrS5
} showing uniformdistribution of radioactivity in the kidney paren-chyma, and the greater isotope concentration inthe hilar and perirenal fat.
Circulation Research. Volume XIII. October 19GS
by guest on May 28, 2018
http://circres.ahajournals.org/D
ownloaded from

INTEARENAL NUTRIENT BLOOD FLOW DISTRIBUTION 293
FIGURE 4A. Autoradiograph from a kidney removed five seconds after KrS5 injection, showinginitial distribution of radioactivity in the cortex, blood vessels and fat (exposure timeof film one hour). Medulla, as shown by large central ivhite area, is relatively freeof Kr"s. B. Corresponding tissue section.
under identical conditions; the films were freeof artifact when developed. To demonstrate uni-form affinity for krypton throughout the kidneyparenchyma, 1-mm slices of renal tissue wereequilibrated with a saline solution containingKr85 and autoradiographs were pre pared afterfreezing the sections (fig. 3). Uniform densitywas observed throughout the kidney parenchyma.However, because of the greater solubility ofkrypton in fat (partition coefficient for fat/blood s 9),7 the hilar and perirenal fat containedmore activity and appeared more dense. Diffusionof Kr85 in the frozen tissue during exposuredid not appear to be A significant problem, sincereap plication of film to the same section of tissueone to two weeks after the original exposureshowed excellent duplication of the margins.
ResultsFigure 2 illustrates a typical disappearance
curve following the rapid injection of Kr85into the renal artery. The heavy line repre-sents the original decay curve, while the vari-ous components resulting from the analysisof the curve are shown as thin lines. Repre-sentative calculations from such a curve aregiven in the table in figure 2.
AUTORADIOGRAPHSIn order to relate each exponential to a specific
anatomical region of the kidney, autoradiographswere made from kidneys removed at various timesafter intrarenal injection of Kr85 in a seriesof anesthetized animals (pentobarbital sodium 25mg/kg). The kidney and pedicle were exposedthrough a lumbar incision, and a catheter insertedinto the renal artery. In each experiment a con-trol Kf8f "washout" curve was obtained to demon-strate the pi'esence of four exponentials; thenumerical value for each exponential was similarto that observed in the unanesthetized dog. Afterthe completion of the control curve a secondinjection, containing approximately the sameamount of radioactivity, was made. At a pre-determined time after Kr8i administration, therenal pedicle was ligated, the kidney extirpatedand frozen immediately in an acetone and dry-icemixture. The frozen kidney was sliced into one-mincross-sections which were placed in contact withX-ray film* between ferrotype plates and storedat —50°C for varying periods of time, dependingupon the amount of activity remaining in thetissue. The exposure time (one hour to nine days)for each autoradiograph is given in the legends.Finally, each tissue section was photographedfor comparison with the corresponding auto-radiograph.
As an additional control, kidney sections withoutradioactivity were placed in contact with film
*Koclak Blue Brand Medical X-ray Film.
Circulation Research, Volwno XIII, October 19GS
A. ANATOMICAL LOCALIZATION OFIN THE KIDNEY BY AUTORADIOGRAPHY
The anatomical distribution of KrSi in thekidney was determined autoradiographically
by guest on May 28, 2018
http://circres.ahajournals.org/D
ownloaded from

294 THORBURN, KOPALD, HERD, HOLLENBERO, O'MORCHOE, BAROER
RADIO-ACTIVITY
K r "
CPM
100 K
I0K
20 40TIME IN MINUTES
A. Autoradiograph from a kidney removed 15 seconds after Kr85 injection showingradioactivity in all areas of the kidney except the inner medulla and papilla (exposuretime of film three hours). Exposure of film for 76 hours still did not reveal significantamount of Rrsl in the papilla. B. Corresponding tisstie section. C. Graph showing,on a typical disappearance curve, the time at which the kidney ivas removed.
in acute experiments by clamping the vesselsand removing the kidney at various time in-tervals after intrarenal injection of the iso-tope. When the kidney was removed withinfive seconds of the administration of Krs", thedistribution was limited to the cortex, largeblood vessels, and fat (fig. 4). Fifteen secondsafter injection (fig. 5), radioactivit}' waspresent in the cortex, outer medulla, largeveins, and fat; no KvS!i was detected in theinner medulla. Two minutes after the injec-tion of the same amount of KrS6 (fig. 6), the
outer cortex was largely cleared of radioac-tivity ; Krs'; in the renal parenchyma wasfound chiefly in the outer medulla and innercortex, with no detectable activity in thepapilla. Thus, it may be concluded that Com-ponent I of the Kr8J removal curve representsdisappearance of the isotope from the outercortex.
At six minutes (fig. 7) the inner cortex andouter medulla no longer contained appreciableamounts of Kr85; the parenchymal activitywas confined to the inner medulla. Therefore,
Circulation Research, Volume XIII, October 1963
by guest on May 28, 2018
http://circres.ahajournals.org/D
ownloaded from
INTKARENAL NUTRIENT BLOOD FLOW DISTRIBUTION 295
RADIO-ACTIVITY
Kr85
CPM
20 40TIMC iN MINUTES
2 0 80
FIGURE 6
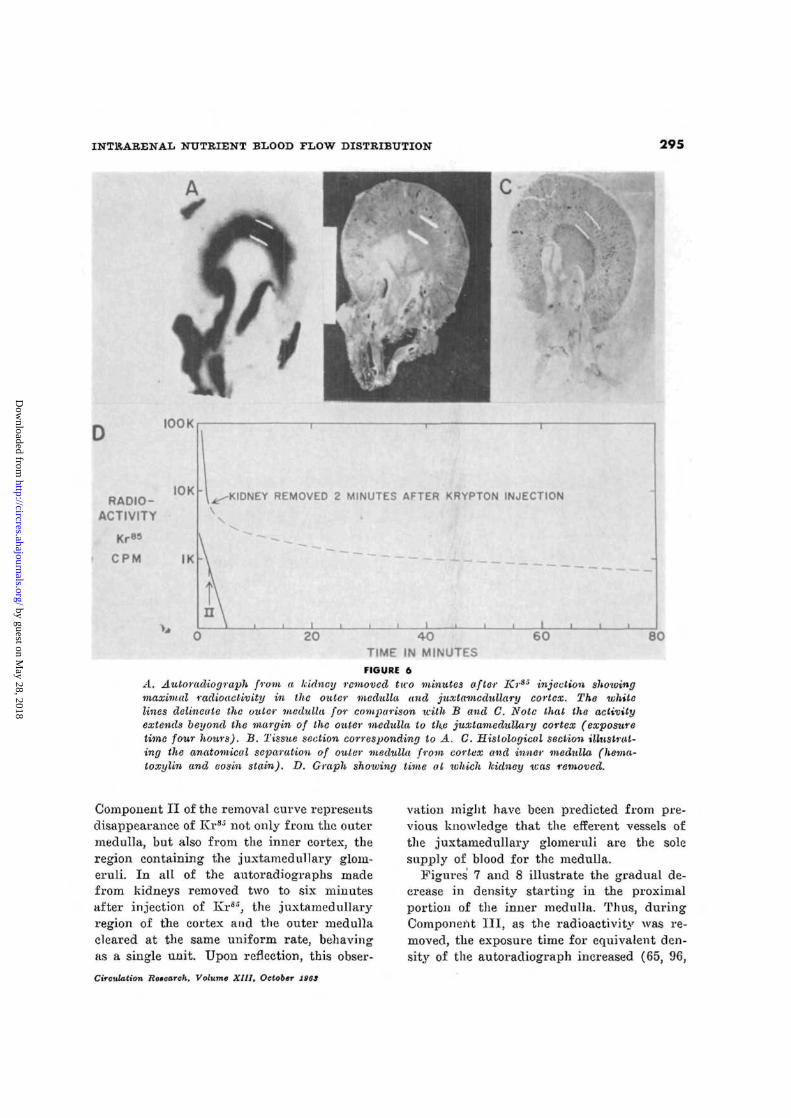
A. Autoradiograph from a kidney removed two minutes after Kras injection showingmaximal radioactivity in the outer medulla and juxlamedullary cortex. The whilelines delineate the outer medulla Jw comparison with B and C. Note that the activityextends beyond the margin of the outer medulla to the juxtamedullary cortex (exposuretime four hours). B. Tissue section corresponding to A. C. Histological section illustrat-ing the anatomical separation of outer medulla from cortex and inner medulla (hema-toxylin and eosin stain). D. Graph shoiuing time at which kidney teas removed.
Component II of the removal curve representsdisappearance of Kr85 not only from the outermedulla, but also from the inner cortex, theregion containing the juxtamedullary gloni-eruli. In all of the autoradiographs madefrom kidneys removed two to six minutesafter injection of Krs", the juxtamedullaryregion of the cortex and the outer medullacleared at the same uniform rate, behavingas a single unit. Upon reflection, this obser-
Circulation Research, Volume XIII, October 1963
vation might have been predicted from pre-vious knowledge that the efferent vessels ofthe juxtamedullary glomeruli are the solesupply of blood for the medulla.
Figures 7 and 8 illustrate the gradual de-crease in density starting in the proximalportion of the inner medulla. Thus, duringComponent III, as the radioactivity was re-moved, the exposure time for equivalent den-sity of the autoradiograph increased (65, 96,
by guest on May 28, 2018
http://circres.ahajournals.org/D
ownloaded from

296 THORBURN, KOPALD, HERD, HOLLENBERG, O'MORCHOE, BARGER
IOOK
KIDNEY A-B REMOVED 6 MINUTES AFTER KRYPTON INJECTION
KIDNEY C-D REMOVED 10 MINUTESAFTER KRYPTON INJECTION
20TIME IN MINUTES
20 60
FIGURE 7A. Autoradiograph from a kidney removed six minutes after Krss injection showingmaximal radioactivity in the inner medulla (exposure time of film 65 hours). B. Tissuesection corresponding to A. C. Autoradiograph from a kidney removed W minutesfollowing Kr8S injection showing maximal radioactivity in the papilla, (exposure timeof film 96 hours). The border of the kidney is indicated by the dots drawn by hand.D. Tissue section corresponding to C. E. Graph shoiuing times at which the kidneyswere removed.
Circulation Research, Volume XIII, October
by guest on May 28, 2018
http://circres.ahajournals.org/D
ownloaded from

INTRARENAL NUTRIENT BLOOD FLOW DISTRIBUTION 197
100 K
RADIO-ACTIVITY
K r "
CPM
K REMOVED 28 MINUTES AFTER KRYPTON INJECTION10 K
20 40TIME IN MINUTES
60
FIGURE 8
A. Autoradiograph from a kidney removed 2S minutes following Kr35 injection (endof Component III) showing radioactivity still remaining in the papilla (exposuretime of film 119 hours). B. Corresponding tissue section. C. Graph showing the timeat lohich the kidney xoas removed.
and 119 hours). The persistence of radioac-tivity in the tip of the papilla at 28 minutesafter injection (fig. 8) emphasizes the slowrate of "washout" in this region. At 52 min-utes (fig. 9) activity was present in the fatonly; thus Component IV represents the re-moval of Kr8J from the perirenal and hilarfat.
B. NUTRIENT RENAL BLOOD FLOWDISTRIBUTION
Data from 65 experiments in four unanes-thetized dogs are summarized in table 1, show-ing the half-times of the four exponentials,the calculated nutrient flow rates for the cor-tex, outer medulla, inner medulla, and hilar
fat, with the percentage of counts initiallydistributed to each of these areas. In the 65experiments (five kidneys) the mean corticalblood flow was 472 ml/100 g/min (ComponentI) ; outer medullary and inner cortical flow(Component II) was 132 ml/100 g/min; in-ner medullary flow (Component III) was17 ml/100 g/min. Under the conditions ofthese experiments approximately 80% of theKrw was initially distributed to the cortex,16% to the outer medulla and only 2% to theinner medulla. The hilar and perirenal fatblood flow was 21 ml/100 g/min and thisarea received 2% of the initial counts.
Renal blood flow of these animals was de-
Circulation Research. Volume XIII, October IOCS
by guest on May 28, 2018
http://circres.ahajournals.org/D
ownloaded from

00
TA
BL
E
1
Sum
mar
y of
65
Exp
erim
ents
in
F
our
Una
nest
heti
zed
Bog
s (F
ive
Kid
neys
) Sh
owin
g H
alf-
Tim
es
of
the
Exp
on
enti
als
, N
utr
ien
t F
low
B
ate
s,an
d D
istr
ibut
ion
of K
r85
in
Cor
tex,
Out
er M
edul
la,
Inne
r M
edul
la,
Per
irem
il in
id H
ilar
Fat
Nut
rien
t fl
ow (
ml/1
00 g
/min
)m
ean
and
rang
ep
_ k
X \
X
lO
Ot
Per
cen
t co
unts
dis
trib
uted
Hal
f tim
es
(ti/
2 se
c)
p in
itial
ly t
o ea
ch c
ompa
rtm
ent
Ani
mal
* N
o. o
f O
uter
In
ner
R«n
al
Out
er
Inne
r R
enal
O
uter
In
ner
Ren
alnu
mbe
r ex
peri
men
ts
Cor
tex
med
ulla
m
edul
la
fat
Cor
tex
med
ulla
m
edul
la
fat
Cor
tex
med
ulla
m
edul
la
fat
1 9
10
.1
50
.2
39
2 36
20
41
7 9
5 12
12
88
7
3 2
H
(326
-482
) (4
5-1S
5)
(7-1
7)
(S-1
S)
(78-
94)
(3-1
5)
(2-5
) (1
-4)
g a2
24
9.8
42.7 452
3670
468
127
12
12
SO
16
2
2
^(left kidney)
(264-885)
(49-251)
(4-27)
(9-23)
(31-96)
(2-65)
(1-3) (1-5)
3 W o2
S
9.7
34.2 315
2970
446
128
15
15
78
19
2
1
£(rt. kidney)
(310-640)
(76-1S5)
(8-24)
(9-26)
(53-94)
(4-42)
(1-8) (1-2)
w B3
14
S.8
28.0 219 1320
486
165
21
30
76
21
2
1
H(3(54-886)
(77-2S5)
(12-33)
(22-40)
(4S-91)
(10-48)
(1-3) (1-2)
g
§4
10
S.5
39.2
15
0 93
8 53
4 13
2 2S
45
77
18
3
2 °
| %
(2
42-7
04)
(78-
200)
(1
S-36
) (3
5-51
) (5
5-93
) (5
-37)
(1
-6)
(1-3
) £
| M
ean
valu
es
9.4
39.0
33
1 26
50
472
132
17
21
SO
16
2 2
^?
Q
= K
q "U
nles
s no
ted,
re
sults
ar
e fo
r le
ft
kidn
ey.
2I •̂
tk
=
slop
e of
lin
e. X
=
part
itio
n co
effic
ient
(a
fig
ure
of
1 ha
s be
en
used
in
ea
ch
case
ex
cept
fo
r fa
t,
in
whi
ch
a \
of
9 h
as
been
as
sum
ed).
w
5;
. O
.*- p
=
spec
ific
grav
ity
of
tissu
e, a
ssum
ed
to b
e 1.
0.
Wo &
F
or
labo
rato
ry
iden
tific
atio
n,
dog
no.
1 =
C
anis
Min
or;
dog
no.
2 =
R
adar
; do
g no
. 3
=
Qui
ntus
; do
g no
. 4
=
Cyr
ano.
W
by guest on May 28, 2018http://circres.ahajournals.org/Downloaded from

INTRARENAL NUTRIENT BLOOD FLOW DISTRIBUTION 299
IOOK
RADIO-ACTIVITY
CPM
IOK
KIDNEY REMOVED 52 MINUTES AFTER KRYPTON INJECTION
20 20TIME IN MINUTES
2 0 80
FIGURE 9
A. A.utoradiograph from a kidney removed 52 minutes after Kr85 injection (ComponentIV) showing radioactivity remaining only in the hilar and perirenal fat (exposuretime of film nine days). The border of the kidney is indicated by the dots draion byhand. B. Corresponding tissue section. C. Graph showing the time at which kidneyloas removed.
termined repeatedly for periods up to oneyear, with considerable variation noted fromday to day. The widest range of cortical flowobserved in one normal dog was 264 to 885ml/100 g/min (dog no. 2, left kidney, table1). However, in a well-trained animal, con-secutive flow rates determined over a periodof three to five hours on a given day fre-quently were relatively constant, as shown intable 2. Moreover, as experience was gainedm the use of the method, it became apparent
Research, Volume XIII, October 19S3
that rapid, serial determinations of corticalblood flow could be obtained at six-minuteintervals. For such measurements, it wasfound empirically that the slope of the cor-tical component could be obtained as follows:(1) the number of counts at four and one-half minutes was subtracted from the preced-ing curve, which yielded two exponentials;(2) the slower or second exponential was sub-tracted from the initial portion of the curve.A slope for Component I was thus obtained
by guest on May 28, 2018
http://circres.ahajournals.org/D
ownloaded from

300 THORBTJRN, KOPALD, HERD, HOLLENBERG, O'MORCHOE, BARGER
TABLE 2
Consoeutice Flotv Rates Determined ivith KrS5 in the Unanesthetized Dog
Time
S:00 AM
9:30 AM
11:00 AM
Cortex
11.6
12.2
10.3
Half times (ti/= aec)Outermedulla
70.3
43.1
60.0
Innermedulla
720
792
51S
Renalfat
46S0
6480
4800
Nutrient flowmean a
F _ k X
Cortex
35S
341
403
Outermedulla
59
96
69
(ml/100 g/min)nd range
X X 100»P
Innerniedulla
G
5
S
Renalfat
S
'O
9
Per <:ent counts distributedinitially to each compartment
Cortex
96
94
9G
Outer Innermedulla medulla
2 1
4 1
2 1
Renalfat
1
1
1
*k = slope of line. X = partition coefficient (a figure of 1 lins been used in e;ich case except for fat,in which a X of 9 has been assumed), p = specific gravity of tissue, assumed to be 1.0.
which agreed well with the value obtainedwhen the curve was analyzed in the usualfashion. Figure 10A illustrates the relativeconstancy of cortical blood flow obtained everysix minutes in the normal unanesthetized dog.Figure 10B demonstrates that rapid changesin cortical blood flow can be detected by themethod as shown in an animal with cardiacvalvular damage in which cortical flow wasmore variable. The variability in blood flowin the other areas of the kidney is indicatedin tables 1 and 2.
DiscussionFor the measurement of nutrient blood
flow by the method described above, the as-sumption is made that a highly diffusablesubstance will equilibrate between blood andtissue in a single passage through the capil-lary bed.7 Because we have obtained corticalblood flow rates of 1200 ml/100 g/min duringintrarenal infusion of acetyleholine, the as-sumption would appear to be valid. Therefore,the rate of removal of such a substance fromthe tissue will vary directly with the capillary
IOO K
RADIO-ACTIVITY
K r "CPM
2OK
10 K20 4 0 " 0
TIME IN SECONDS
FIGURE 10
Graphs shenoing Component I and derived cortical flow rates of a series of Kr115disappearance curves obtained sequentially at six-minute intervals using the modifiedtechnique for the estimation of cortical blood floiu described in the text. A. A seriesof curves from a normal uncmesthetized animal shoiving relative constancy of corticalblood flow. B. A series of curves from an animal with valvular damage (mild tricuspidinsufficiency and pulmonary artery stenosis) showing a marked variaition in corticalflow rates.
Circulation Research, Volume XIII , October 19G3
by guest on May 28, 2018
http://circres.ahajournals.org/D
ownloaded from

INTRARENAL NUTRIENT BLOOD FLOW DISTRIBUTION 301
INNERCORTEX
OUTERMEDULLA
INNERMEDULLA
JUXTAMEDULLARY
GLOMERULI
JUXTAMEDULLARY
CORTEX
MEDULLARY
BUNDLESAND
VASA RECTA
FIGURE 11
Histological section (Mallory stain) showing medullary bundles and vasa recta extendingfrom jux ta medullary glomeruli to border of inner medulla, X 30.
blood flow to the organ.7-I3' 1(i Kety7 derivedan expression for the rate of disappearanceof an inert gas from an organ; if the parti-tion coefficient is known, then the nutrientblood flow per unit volume of tissue can bedetermined. Krypton85 qualifies as an idealsubstance for such measurements since it is aninert, lipid-soluble, highly diffusible, radio-active gas. Furthermore, because of its lowsolubility in blood relative to air, 95% ormore of the gas is removed in one circulationthrough the lungs.11 Thus, the amount ofKrw returning to the kidney is negligible.
When a tracer substance is injected into anorgan and the rate of removal is a multi-ex-ponential function of time, the various com-ponents obtained can be interpreted on thebasis of differing parallel rates of blood flow.Dobson and Warner10 recorded the multi-ex-ponential disappearance of Na22 after intra-arterial injections in the forearm and devel-
Circulation Rcnearck, Volume XIII, October 196S
oped a theory and a technique of handlingthe data from a multi-compartmental vascularsystem. The disappearance of Kr85 from thekidney is also multi-exponential, with threedifferent rates of blood flow through the pa-renchyma. The autoradiographs (figs. 4 to 9)have demonstrated that the first exponentialdescribes the rate of nutrient blood flow inthe outer cortex, the second component is ameasure of outer medullary and inner corticalflow and the third component is an estimateof the inner medullary flow. The values ob-tained for nutrient flow in cortex and innermedulla agree with those originally reportedby Kramer and co-workers using Evans bluetransit times as an index of total blood flow4.In a more recent review Ullrich et al.1T re-ported unpublished observations of Krameron inner and outer medullary flow which areapproximately twice the values found in thisstudy; the discrepancy may be explained in
by guest on May 28, 2018
http://circres.ahajournals.org/D
ownloaded from

302 THORBTJRN, KOPALD, HERD, HOLLENBERa, O'MORCHOE, BARGER
ERYTHROCYTESIN
PERITUBULARCAPILLARIES
MEDULLARYBUNDLE
ANDVASA RECTA
ERYTHROCYTESIN
VASA RECTA
FIGURE 12
Histological sections (Mallory stain) of outer medulla (cross-seclional and longitudinal)shoxving medullary bundles, vasa recta containing erythrocytes, and periiubular capil-Urries interspersed among the distal portions of the proximal tubules, descending andascending tubules, and collecting ductus, X 130.
the following discussion concerning nutrientand total blood flow.
In seeking anatomical correlations betweenthe three exponentials and the three zonesobserved autoradiographically, it became ap-parent that these components representedflow in the three major histological divisionsof the canine kidney (fig. 6C). The decaycurves obtained may be the sum of a largerseries of exponentials but the three main com-ponents undoubtedly represent physiological-ly significant averages referable to the threedivisions of the renal parenchyma. The rapidcortical flow, with a turnover rate of four tofive times a minute, represents the majorfraction of blood flow in the kidney. Thishigh rate of blood flow supplies the large vol-ume of plasma for filtration. Although, in thenormal animal, krypton is uniformly distrib-uted in this area to both tubular and vascularelements, only a relatively small amount ofthe glomerular filtrate leaves the cortex.Therefore, the urine removes an insignificantproportion of the krypton compared to the
large amount removed by the blood.* Assum-ing that the cortex is 75% of the kidney vol-itme, the outer medulla 15% and the innermedulla 10%, then the average flow rates/100g of total kidney for the three areas are 354,20 and 2 ml/min respectively. Thus nutrientcortical flow is approximately 17.7 times asgreat as oiiter medullary flow, and 177 timesthat of inner medullary flow, or, relative flowsare 177, 10, and 1. Using the average figuresgiven above, a value for total renal blood flowof 376 ml/100 g/min is obtained, a figurewhich agrees with the average renal bloodflow of 400 ml/100 g/min obtained withPAH.1 8
Although the indicated nutrient flow to theouter medulla is only 5% of total nutrientblood flow in the dog kidney, the actual vol-ume flow through this region (nutrient plusvasa recta) is undoubtedly higher, as sug-
*In vitro equilibration experiments in this labora-tory have shown tile mine/blood partition coefficientto be 0.6S ± 0.06 (so).
Circulation Research, Volnmo XIII, October 19C3
by guest on May 28, 2018
http://circres.ahajournals.org/D
ownloaded from

INTRARENAL NUTRIENT BLOOD FLOW DISTRIBUTION 303
ERYTHROCYTES
INPERITUBULAR
/ CAPILLARIESOF
INNERMEDULLA
FIGURE 13
Histological section (Mallory stain) of inner medulla showing erythrocytes in theperitubular cupillaries, X 130.
gested by the observations of Kramer.17 Thisregion is supplied solely by the efferent bloodvessels of the juxtamedullary glomeruli whichdivide to form the vasa recta and the peri-tubular capillaries. The bundles of vasa recta,which extend from the juxtarnedullary areaof the cortex (figs. 11 and 14) to the outerportion of the inner medulla, have been shownby Trueta8 to be comprised of hairpin loopsof vessels which, peaetrate the outer medullato different depths. Thus, as the number ofvessels decreases progressively, the bundlestaper as they approach the inner medulla(fig. 11). The short loops at the top of theA'asa recta, with their apparent low resistance,may act as arteriovenous anastomoses with aflow rate so fast that the shunt flow is notdetected by the Krw "washout." Moreover,
with such a vascular arrangement only asmall percentage of the juxtaglomevular flowwill reach the inner medulla.
Trueta3 and Lougley10 have emphasized thepresence of a large surface area available forinter capillary exchange within the bundles ofvasa recta which facilitates rapid movementof diffusible substances from the descendinglimb to the ascending portion (fig. 12). Hence,the vasa recta act as efficient counter currentexchangers for diffusible substances.212 AsSeholander20 and Lassen12 have indicated,whenever a gradient for a diffusible substanceexists between the two limbs, a countercurrentexchanger acts as a barrier to the net trans-port of that substance along the long axes ofthe vessels; the effectiveness of the barrier isdirectly proportional to the diffusibility of
Circulation Research, Volume XIII, October
by guest on May 28, 2018
http://circres.ahajournals.org/D
ownloaded from

304 THORBURN, KOPALD, HERD, HOLLENBERG, O'MORCHOE, BAROER
•EoyLLARYPEffiTUBULARCAPILLARIES
INNER V JMEOULLARYW
ITUBULARVPILLARItsJ
FIGURE 14
Schematic illustration of renal circulation in the dog.
the material. Thus, as Lassen,1- and the aboveobservations have demonstrated, the counter-current exchange in the vasa recta retardsthe deposition in the papilla of Kr85, an inert,lipid-soluble and diffusible substance (fig.15). Moreover, the effectiveness of the ex-change is indicated by the slow medullarydeposition of antipyrine, a much less lipid-soluble material with an olive oil/water parti-tion coefficient only l/300th that of kryp-ton.7' 12'1B
• Although the vasa recta have a large inter-capillary surface area for exchange withinthe bundles, the capillary surface area ex-posed to the tubules of the outer medulla iscomparatively small (figs. 11 and 12). There-fore, the vasa recta are relatively ineffectiveas a nutrient blood supply to the tubular cellsof the outer medulla (figs. 14 and 15). The
peritubular capillaries in this region alsoarise from the efferent vessels of the juxta-medullary glomeruli. They penetrate to theouter border of the inner medulla (figs. 5 and6), and then return to the arcuate veins inthe juxtamedullary area. The nutrient flowsupplying the tubular cells in the outer me-dulla is represented by Component II ofthe Kr8i disappearance curve, and averages132 ml/100 g/min.
The arterial blood supply to the inner me-dulla and papilla is derived from the terminalbranches of the vasa recta which divide intolongitudinal capillaries in intimate coutactwith the tubular elements (figs. 13 and 15).Available evidence indicates that the venousblood returns through the ascending limb ofthe vasa recta in the bundles of the outermedulla.3 Although these terminal capillaries
Circulation Rrttrarch, Volume XIII. Ortobrr
by guest on May 28, 2018
http://circres.ahajournals.org/D
ownloaded from

INTEAEENAL NUTBIENT BLOOD FLOW DISTEIBUTION 305
s
Circulation Research, Volume XUI, October JUGS
by guest on May 28, 2018
http://circres.ahajournals.org/D
ownloaded from

306 THORBURN, KOPALD, HERD, HOLLENBERG, O'MORCHOE, BARGEE
are the sole nutrient supply to the region,they function as effective countercurrent ex-changers because of their length and density."Thus the rate of accumulation of a diffusiblesubstance in the inner medulla, and its re-moval from this part of the kidney are bothextremely slow in the antidiuretic state. Be-cause of the slow entrance of Kr85 into theinner medulla the number of counts initiallydistributed to this region is difficult to de-termine ; the uncertainty in the calculation ofAo... is indicated by the use of a dotted linein figure 2. However, variations in Ao- donot alter significantly the calculated flowrates and distribution of Kr55 in ComponentsI and II.
During the "washout" of the inner me-dulla, the concentration and total amount ofKr8i progressively decreases, necessitatinginci'easing exposure time for the autoradio-graphs, as noted in the legends of figures 7and 8. In addition, since the effectiveness ofthe countercurrent exchange for retardingthe outflow of a diffusible substance is pro-portional to its length, the activity is lost firstin the proximal part of the inner medulla,while the papilla is the last area to be cleared.The cotintercurrent exchange introduces someerror in the calculation of the nutrient flow;for this reason it may be more appropriateto designate the estimated "washout" rate inthis region as effective flow. However, sincethe movement of Kr in the medulla mayserve as a model for that of water, 02 andCOo, the physiological importance of thismethod of measuring capillary flow is appar-ent. Moreover, the low effective inner medul-lary flow is ideally suited for the maintenanceof the high solute concentration observed inthis region in the antidiuretic state.
In the antidiuretic state the urine appearsto play a minor role quantitatively in themovement of krypton within the kidney, orthe clearance of krypton from the organ. Theouter medulla effectively " t raps" highly dif-fusible substances from the tubular urine aswell as from the blood, retarding their depo-sition in the inner medulla. As indicated
above, preliminary experiments show that anegligible amount of Kr8" is carried into thepelvic urine at urine flow rates of less than0.5 ml/min. At the present time insufficientdata are available to iudieate whether thelymphatics play any significant role in theremoval of Kr8S from the kidney.
SummaryA method has been described for the meas-
urement, by means of Krs;, of intrarenal nu-trient blood flow distribution in the unanes-thetized dog. Injection of the isotope into therenal artery is followed by a multi-exponentialdisappearance curve which can be obtainedby external monitoring with a scintillationdetector. In acute experiments autoradio-graphs haA'e demonstrated that the first ex-ponential component represents coi'tical bloodflow; the second, outer medullary blood flow :the third, inner medullary blood flow; andthe fourth, hilar and perirenal fat blood flow.The average cortical blood flow in 65 experi-ments in five kidneys of four nnanesthetizeddogs was 472 ml/100 g/min, the outer medul-lary 132 ml/100 g/min, and the inner medul-lary 17 ml/100 g/min. Eighty per cent ofthe radioactivity was distributed initially tothe cortex, 16% to the outer medulla, and 2%to the inner medulla. The hilar and perirenalfat. which receives approximately 2% of theinitial radioactivity, was estimated to have aflow rate of 21 ml/100 g/min. In addition, amethod for the rapid determination of serialcortical blood flow rates has been described.The importance of these findings has beendiscussed with reference to the anatomy ofthe kidne3r, and to the countercurrent conceptas it applies to passive reabsorption of lipidsoluble substances, and to the maintenance ofan osmotic gradient.
AcknowledgmentWe express our thanks to Mr. Franklin Smith
for his devoted care of the dogs, and for histechnical assistance.
AddendumSince this paper was submitted for publication,
a number of the Kr'5 curves have been analyzed onthe IBM 7090 computer at the Massachusetts Institute
Circulation Rc.Rr.arch, Volume A'//A, October WfiS
by guest on May 28, 2018
http://circres.ahajournals.org/D
ownloaded from
INTRARENAL NUTRIENT BLOOD FLOW DISTRIBUTION 307
of Technology with the program developed by Bermanand co-workers.21' ^ Excellent agreement was ob-served between the values obtained by graphicalanalysis and those determined by the computer.We express our sincere appreciation to Drs. MonesBerman and Marjory F. Weiss of the NationalInstitutes of Health, Dr. Frank Perkins of theMassachusetts Institute of Technology, Drs. WalterScheider, and Gordon Nordby of the University ofMichigan for their advice and aid.
References1. WIRZ, H., HARGITAT, B., AND KUHN, W.: Lokali-
sation des Konzentrierungsprozesses in derNiere durch direkte Kryoskopie. Helv. Physiol.Pharmacol. Acta 9: 196, 1951.
2. BERLINER, R. W., LEVINSKT, N. G., DAVIDSON,D. G., AND EDEN, M.: Dilution and concentra-tion of the urine and the action of the anti-diuretic hormone. Am. J. Med. 24: 730, 1958.
3. TRUETA, J., BARCLAY, A. E., DANIEL, P. M.,FRANKLIN, K. J., AND PRICHARD, M. M. L.:Studies of the Renal Circulation. Springfield,Charles C Thomas, 1947.
•1. KRAMER, K., THURAU, K., AND DEETJEN, P.:Hiimodynamik des Nierenmarks. I. PfliigersArch. Ges. Physiol. 270: 251, 1960.
5. THTIRAT;, K., DEETJEN,, P., AND KRAMER, K.:Hamodynamik des Niereiunarks. I I . PfliigersArch. Ges. Physiol. 270: 270, 1960.
0. BBUN, C, CRONE, C, DAVIDSON, H. G., FABRICIUS,J., HANSEN, A. TYB.TAERO, LASSEN, N. A., ANDMUNCK, O.: Benal blood flow in anuric humansubject determined by use of radioactivekrypton 85. Proc. Soc. Exptl. Biol. Med. 89:687, 1955.
7. K.ETY, S. S.: The theory and applications of theexchange of inert gas at the lungs and tissues.Pharmacol. Rev. 3: 1, 1951.
8. HERD, J. A., HOLLENBERCI, M., THORBURN, G. D.,KOPALD, H. H., AND BARGER, A. C.: Myocardialblood flow determined with krypton85 in unanes-thotized dogs. Am. J. Physiol. 203: 122, 1962.
9. RUDOLPH, A. M., ROKAW, S. N., AND BARGER,A. C.: Chronic catlieterization of the renalartery. Technic for studying direct effectsof substances on kidney function. Proc. Soc.Exptl. Biol. Med. 93: 323, 1956.
3 0. DEBARKS, J. G., AND SNEDDON, I. N.: The
Mathematics of Medicine and Biology. Chicago,Year Book Publishers, 1960, pp. 582-590.
11. CHIDSEY, C. A., I l l , FRITTS, H. W., JR.,HARDEWIQ, A., RICHARDS, D. W., AND COUR-NAND, A.: Fate of radioactive krypton (Kr*)introduced intravenously in man. J. Appl.Physiol. 14: 63, 1959.
12. LASSEN, N. A., AND LONGLEY, J. B.: Counter-current exchange in vessels of renal medulla.Proc. Soc. Exptl. Biol. Mea. 106: 743, 1961.
13. JONES, H. B.: vol. 2, Respiratory system: nitro-gen elimination. In Medical Physics, ed. byO. Glasser. Chicago, Tear Book Publishers,1950, pp. 855-871.
14. PAPPENHEIMER, J. R., RENKIN, E. M., ANDBORBERO, L. M.: Filtration, diffusion andmolecular sieving through peripheral capillarymembranes. A contribution to the pore theoryof capillary permeability. Am. J. Physiol. 167:13, 1951.
15. RENKIN, E. M.: Capillary permeability to lipid-soluble molecules. Am. J. Physio!. 168: 53S,1952.
16. DOBSON, E. L., AND WARNER, G. F . : Measure-ment of regional sodium turnover rates and^lioir application to the estimation of regionalblood flow. Am. J. Physiol. 189: 269, 1957.
17. ULLRICH, K. J., KRAMER, K., AND BOYLAN, J. W.:Present knowledge of the counter-current sys-tem in the mammalian kidney. Progr. Cardio-vascular Diseases. 3: 395, 1961.
18. SMITH, H. W.: The Kidney. Oxford Med. Publ.,Oxford University Press, New York, 1951.
19. LONGLEY, J. B., BANFIELD, W. G., AND BRINDLEY,D. C.: Structure of the rete mirabile in thekidney of the rat as seen with the electronmicroscope. J. Biophys. Biochem. Cytol. 7:103, 1960.
20. SCHOLANDER, P. F., AND KROG, J.: Counter-current heat exchange and vascular bundlesin sloths. J. Appl. Physiol. 10: 405, 1957.
21. BRRMAN, M., SHAHN, E., AND WEISS, M. F. :The routine fitting of kinetic data to models:A mathematical formalism for digital com-puters. Biophys. J. 2: 275, 1902.
22. BERMAN, M., WEISS, M. F., AND SHAHN, E.:
Some formal approaches to the analysis ofkinetic data in terms of linear compartmentalsystems. Biophys. J. 2: 2S9, 1962.
Circulation Research, Volume Xflf, October 1963
by guest on May 28, 2018
http://circres.ahajournals.org/D
ownloaded from

HOLLENBERG, CHARLES C. C. O'Morchoe and A. CLIFFORD BARGERGEOFFREY D. THORBURN, HUGH H. KOPALD, J. ALAN HERD, MILTON
Unanesthetized Dog in the85Intrarenal Distribution of Nutrient Blood Flow Determined with Krypton
Print ISSN: 0009-7330. Online ISSN: 1524-4571 Copyright © 1963 American Heart Association, Inc. All rights reserved.is published by the American Heart Association, 7272 Greenville Avenue, Dallas, TX 75231Circulation Research
doi: 10.1161/01.RES.13.4.2901963;13:290-307Circ Res.
http://circres.ahajournals.org/content/13/4/290World Wide Web at:
The online version of this article, along with updated information and services, is located on the
http://circres.ahajournals.org//subscriptions/
is online at: Circulation Research Information about subscribing to Subscriptions:
http://www.lww.com/reprints Information about reprints can be found online at: Reprints:
document. Permissions and Rights Question and Answer about this process is available in the
located, click Request Permissions in the middle column of the Web page under Services. Further informationEditorial Office. Once the online version of the published article for which permission is being requested is
can be obtained via RightsLink, a service of the Copyright Clearance Center, not theCirculation Research Requests for permissions to reproduce figures, tables, or portions of articles originally published inPermissions:
by guest on May 28, 2018
http://circres.ahajournals.org/D
ownloaded from
![Dietary Nutrient and Food Intake and Their Relations with ...€¦ · ing systolic blood pressure as well as diastolic blood pres-sure, increases the risk of hypertension [2]. One](https://static.fdocuments.net/doc/165x107/5f1a531b5a6ac0031229519b/dietary-nutrient-and-food-intake-and-their-relations-with-ing-systolic-blood.jpg)