Intrapreneurship in Sweden: an international perspective · Intrapreneurship in Sweden: an...
67
Intrapreneurship in Sweden: an international perspective Erik Stam and Mikael Stenkula Document Identifier D5.4 Case Study on Swedisch Intrapreneurship Version 1.0 Date Due M18 Submission date 31 st January 2017 WorkPackage 2 Lead Beneficiary IFN
Transcript of Intrapreneurship in Sweden: an international perspective · Intrapreneurship in Sweden: an...

Intrapreneurship in Sweden: an international perspective
Erik Stam and Mikael Stenkula
Document Identifier D5.4 Case Study on Swedisch Intrapreneurship Version 1.0 Date Due M18 Submission date 31st January 2017 WorkPackage 2 Lead Beneficiary IFN

Intrapreneurship in Sweden: an international perspective*
Draft version 30 January 2017
Erik Stam and Mikael Stenkula
Abstract:
In this report we provide an extensive overview of the nature, measurement, prevalence and causes of intrapreneurship at the country level. With adding intrapreneurship to the range of entrepreneurship indicators we arrive at a more adequate coverage entrepreneurial behavior in society than before, when only measures of independent entrepreneurship were taken into account. This, perhaps more adequate, measure of entrepreneurship might also solve another paradox: the Swedish entrepreneurship paradox. Even though Sweden, and other Nordic countries alike, lead global innovation and prosperity rankings, their independent entrepreneurship rates are relatively low. This report set out to explain why the Nordic countries, and Sweden in particular, rank very high with respect to entrepreneurial employee activity, i.e. intrapreneurship.
This study suggests that intrapreneurship levels in a country are positively affected by levels of generalized trust, which increase job autonomy and welfare state arrangements for employees that ultimately enhances intrapreneurship and make self-employment a relatively less attractive occupational choice. These factors also largely explain the high levels of intrapreneurship in the Nordics and Sweden in particular.
Keywords: intrapreneurship, entrepreneurship, entrepreneurial behavior, trust, job autonomy, welfare state, Sweden, Nordics
JEL-codes: H30 J20 J83 L26 M13 O12 O31 O43 O57
* We thank Claire Economidou, Niklas Elert and Saul Estrin for useful comments and suggestions.
1

1. Introduction
Entrepreneurs are often equated with actors creating new combinations, innovations, who are the engine of economic development (Schumpeter 1934; Baumol 1990; Rosenberg & Birdzell 1986). Even though entrepreneurship is generally regarded as a driver of economic growth in the modern economic literature (Wennekers & Thurik 1999; Aghion & Howitt 1992), many empirical studies have not confirmed the causal relation between entrepreneurship and economic growth (Van Stel et al. 2005; Stam & Van Stel 2011), and some even found negative relations (Van Stel & Storey 2004; Stam 2013).
This lack of confirmation in empirical studies might be explained by a focus on inadequate measures of entrepreneurship. The field suffers from what might be called the Einstein paradox1: Not all the entrepreneurship that can be measured counts for economic growth, and not all entrepreneurship that counts for economic growth can be measured. Recent empirical studies suggest that the field has been misguided by focusing on measures of independent entrepreneurship, while entrepreneurial activity by employees might count more with respect to the Schumpeterian mechanism of innovation based growth (see also Schumpeter 1934: p.74-75). The Einstein paradox could be solved once we have access to better measures of entrepreneurship and bycounting entrepreneurial activity by employees.
A more adequate measure of entrepreneurship might also solve another paradox: the Swedish entrepreneurship paradox. Even though Sweden and other Nordic countries alike lead global innovation and prosperity rankings, their (independent) entrepreneurship rates are relatively low (Henrekson 2005). Some recent studies suggest that intrapreneurship is indeed very prevalent in the Nordics (Bosma et al. 2012; Nyström 2012; Bager and Schøtt 2011; Braunerhjelm et al. 2016).
This report sets out to explain why the Nordic countries, and Sweden in particular, rank very high with respect to entrepreneurial employee activity, i.e. intrapreneurship. With this in-depth study, we will provide an alternative for, or perhaps even improvement of, the debate on the role of independent start-ups in economic growth within Europe and globally.
1 The original Einstein quote is: Not everything that can be counted counts, and not everything that counts can be counted.
2

2. Intrapreneurship defined
Before going into more detail about the prevalence of intrapreneurship and what might influence its extent, we will thoroughly discuss what is meant by intrapreneurship and how it is measured in practice.
2.1 What is intrapreneurship?
Entrepreneurship can be expressed in many different forms. For a long time, entrepreneurship was often synonymous with small or family firms (firm-level studies) or self-employment (occupational studies) in the empirical literature. An implicit idea was that these entities should be innovative to survive and hence were an appropriate expression for entrepreneurial activity in the economy. However, recent studies have shown that the bulk of all small firms and self-employed persons are not innovative; most small firms are ordinary mom-and-pop stores or livelihood firms (Santarelli & Vivarelli 2007; Stam 2008).
If the focus is on novelty, the flow of new firms (or new organizations) is a better measure of entrepreneurial behavior instead of the stock of a specific firm category. Research about the innovation effects of firm size and age is far from conclusive, and it is new firms, not small firms that in general create the most new jobs (Haltiwanger et al. 2013). The focus on the stock of small firms or the stock of self-employed has also gradually vanished from the debate and nowadays new firms and start-ups seem to be in center stage. Even if this approach is better, it is far from a satisfying and complete measure of capturing all entrepreneurial activity in the economy.2 In addition, a lot of persons may be forced to start a firm because of lack of better alternatives. These new firms and these self-employed persons—often denoted as necessity entrepreneurship (Acs 2006)—are not necessarily entrepreneurial in any meaningful sense.
Entrepreneurship is the ability and willingness of individuals, both independently and within organizations,
• to identify circumstances and develop ideas perceived to be conducive of the creation of new economic activities (i.e., what is commonly referred to as discovering or creating new economic opportunities);
• to introduce their ideas in the market under uncertainty, making decisions regarding the location, product design, use of resources and reward systems; and
• to create value.3
Intrapreneurship, in our view, refers to this type of activity when it is undertaken by employees in existing firms. Entrepreneurship is not a firm or occupational notion, but a behavioral notion. Where and in what form an individual exploits an entrepreneurial opportunity or idea is an empirical question, not necessary for the delineation of entrepreneurship. Entrepreneurship is a function and not a specific organizational form (small firms, family firms, owner-managed firms, closely held firms or new firms) or an occupational choice (self-employed, business owner). Entrepreneurial behavior
2 Cf. Foss et al. (2007a): “[…]there is an undue emphasis on new venture creation in the applied entrepreneurship literature.” 3 In line with the definition proposed in Henrekson & Stenkula (2016) and closely related to Wennekers & Thurik (1999) and Stam et al. (2011).
3
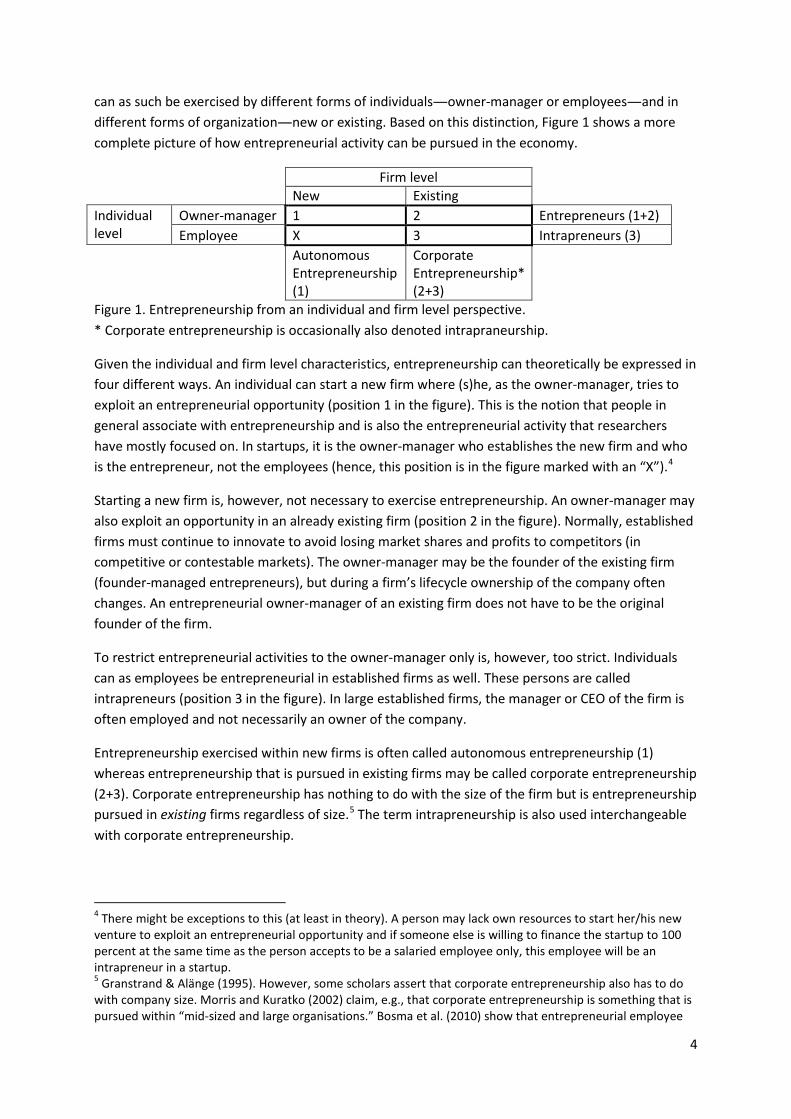
can as such be exercised by different forms of individuals―owner-manager or employees―and in different forms of organization―new or existing. Based on this distinction, Figure 1 shows a more complete picture of how entrepreneurial activity can be pursued in the economy.
Firm level New Existing Individual level
Owner-manager 1 2 Entrepreneurs (1+2) Employee X 3 Intrapreneurs (3)
Autonomous Entrepreneurship (1)
Corporate Entrepreneurship* (2+3)
Figure 1. Entrepreneurship from an individual and firm level perspective. * Corporate entrepreneurship is occasionally also denoted intrapraneurship.
Given the individual and firm level characteristics, entrepreneurship can theoretically be expressed in four different ways. An individual can start a new firm where (s)he, as the owner-manager, tries to exploit an entrepreneurial opportunity (position 1 in the figure). This is the notion that people in general associate with entrepreneurship and is also the entrepreneurial activity that researchers have mostly focused on. In startups, it is the owner-manager who establishes the new firm and who is the entrepreneur, not the employees (hence, this position is in the figure marked with an “X”).4
Starting a new firm is, however, not necessary to exercise entrepreneurship. An owner-manager may also exploit an opportunity in an already existing firm (position 2 in the figure). Normally, established firms must continue to innovate to avoid losing market shares and profits to competitors (in competitive or contestable markets). The owner-manager may be the founder of the existing firm (founder-managed entrepreneurs), but during a firm’s lifecycle ownership of the company often changes. An entrepreneurial owner-manager of an existing firm does not have to be the original founder of the firm.
To restrict entrepreneurial activities to the owner-manager only is, however, too strict. Individuals can as employees be entrepreneurial in established firms as well. These persons are called intrapreneurs (position 3 in the figure). In large established firms, the manager or CEO of the firm is often employed and not necessarily an owner of the company.
Entrepreneurship exercised within new firms is often called autonomous entrepreneurship (1) whereas entrepreneurship that is pursued in existing firms may be called corporate entrepreneurship (2+3). Corporate entrepreneurship has nothing to do with the size of the firm but is entrepreneurship pursued in existing firms regardless of size.5 The term intrapreneurship is also used interchangeable with corporate entrepreneurship.
4 There might be exceptions to this (at least in theory). A person may lack own resources to start her/his new venture to exploit an entrepreneurial opportunity and if someone else is willing to finance the startup to 100 percent at the same time as the person accepts to be a salaried employee only, this employee will be an intrapreneur in a startup. 5 Granstrand & Alänge (1995). However, some scholars assert that corporate entrepreneurship also has to do with company size. Morris and Kuratko (2002) claim, e.g., that corporate entrepreneurship is something that is pursued within “mid-sized and large organisations.” Bosma et al. (2010) show that entrepreneurial employee
4
The definitions of intrapreneurship and corporate entrepreneurship have varied considerably over time and there are still huge terminology differences in the literature over different academic disciplines.6 It is suitable to define intrapreneurship as “entrepreneurship within existing organizations” (Antoncic 2001). Intrapreneurs can, more specifically, be defined as employees who develop new business activities for their employer, e.g., launching new goods and services, establishing new markets or outlets, or improving the production process.7 Table 1, gives example of different business activities and Box 1 gives an example of an intrapreneur.
Occasionally, scholars also make a distinction between what is known as bottom-up and top-down corporate entrepreneurship. Bottom-up corporate entrepreneurship refers to entrepreneurial initiatives taken spontaneously from (an) individual employee(s) without any instructions from the owners or managers (this is mostly counted as intrapreneurship). Top-down corporate entrepreneurship, on the other hand, refers to a deliberate manager strategy initiated at the owner/manager level to foster entrepreneurial action among its employees. Some researchers/scholars restrict the use of intrapreneurship to bottom-up processes only at the same time as they denote top-down processes corporate entrepreneurship.8
activity is not more prevalent in large organizations than in small organizations. The only logical restriction that can be posed is that solo self-employed ‘firms’ cannot involve intrapreneurship, since they have not employees. 6 See Sharma & Chrisman (1999) for an extensive list of different overlapping or even contradicting definitions that have been used by scholars over time. 7 Bosma et al. (2013). Zahra (1991, p. 261) defines corporate entrepreneurship as ”[…]formal or informal activities aimed at creating new businesses in established companies through product and process innovations and market developments. These activities may take place at the corporate, division (business), functional, or project levels, with the unifying objective of improving a company’s competitive position and financial performance.” 8 As can be concluded, the concepts are not used consistently in the academic literature. We will not make any distinction between bottom-up and top-down intrapreneurship in this paper. We will in the rest of this paper use the terms intrapreneur referring to the person who exercises intrapreneurship, where intrapreneurship refers to the entrepreneurial activity (performed by the individual in the firm).
5

Table 1. Examples of new business activities that can be characterized as intrapreneurship New goods and services New markets or outlets New production processes Consultancy, business to business, business take-overs
To merge two independent institutions.
Digital printing
To set up training program, exercise program, for people with lung disorders.
Company for leasing and financing cars.
To be able to train students on the job.
Introduction of new products. Making/producing and importing products. We are expanding to Asia.
Innovations in education
Training and communication services.
To set up new offices abroad. I am outsourcing activities
Expanding services. Started a cooperation with another firm
Starting a production line.
Started a new training. Investment company To get more money by creative thinking.
Starting a new department for assurance products/services.
Foundation of Good Ideas: to give a chance to ideas that are difficult to develop.
R&D
To develop and promote a new, state subsidized scheme.
We build satellites of our own company all over the country: a kind of "Shop in shop" concept.
To introduce a new and faster internet connection.
Manager in a dolphin house, thinking up and promoting new shows with animals, new animation programs for children.
Taken over companies New automated ticket selling system
Positioning business intelligence by means of the newest Microsoft technologies.
Starting a new company in Romania.
Importing more from China and Japan.
Source: Extract from Bosma et al. (2011).
From an individual perspective, owner-managers exploiting entrepreneurial opportunities are called entrepreneurs (1+2). A more narrow definition, which quite often also is used, restricts entrepreneurs to owner-managers of startups only (1). Sometimes the term independent entrepreneurs are used interchangeably. Intrapreneurs are, as described above, restricted to persons who conduct entrepreneurship as employees within existing organizations (independent of size). Of course entrepreneurship may be pursued by a team including both entrepreneurs (owner-managers) and intrapreneurs (employees).9
9 In the literature, the importance of capital is occasionally stressed (see, e.g., Klein 2008, Foss et al. 2007a or Foss et al. 2007b). Entrepreneurship is, according to this view, about exercising judgment over how to arrange or organize one’s own capital goods or resources. An entrepreneur without capital cannot be viewed as an entrepreneur or pursuing entrepreneurship. It is of course true that capital normally is required to perform entrepreneurship, but it must not necessarily be your own capital. The owner or managers (especially in large companies) may decide to delegate decision making to an employee who then can be said to exercise “derived judgment” and work as a “proxy-entrepreneur.” In our terminology, this kind of employee is an intrapreneur.
6
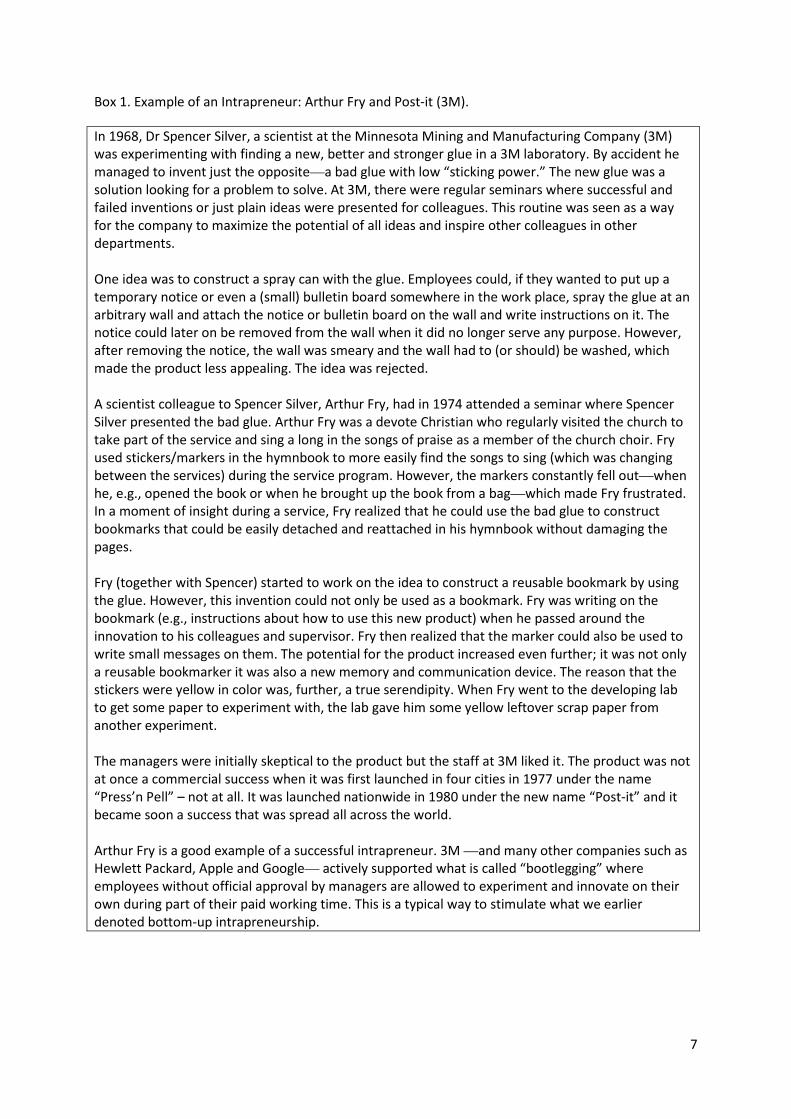
Box 1. Example of an Intrapreneur: Arthur Fry and Post-it (3M).
In 1968, Dr Spencer Silver, a scientist at the Minnesota Mining and Manufacturing Company (3M) was experimenting with finding a new, better and stronger glue in a 3M laboratory. By accident he managed to invent just the opposite—a bad glue with low “sticking power.” The new glue was a solution looking for a problem to solve. At 3M, there were regular seminars where successful and failed inventions or just plain ideas were presented for colleagues. This routine was seen as a way for the company to maximize the potential of all ideas and inspire other colleagues in other departments. One idea was to construct a spray can with the glue. Employees could, if they wanted to put up a temporary notice or even a (small) bulletin board somewhere in the work place, spray the glue at an arbitrary wall and attach the notice or bulletin board on the wall and write instructions on it. The notice could later on be removed from the wall when it did no longer serve any purpose. However, after removing the notice, the wall was smeary and the wall had to (or should) be washed, which made the product less appealing. The idea was rejected. A scientist colleague to Spencer Silver, Arthur Fry, had in 1974 attended a seminar where Spencer Silver presented the bad glue. Arthur Fry was a devote Christian who regularly visited the church to take part of the service and sing a long in the songs of praise as a member of the church choir. Fry used stickers/markers in the hymnbook to more easily find the songs to sing (which was changing between the services) during the service program. However, the markers constantly fell out—when he, e.g., opened the book or when he brought up the book from a bag—which made Fry frustrated. In a moment of insight during a service, Fry realized that he could use the bad glue to construct bookmarks that could be easily detached and reattached in his hymnbook without damaging the pages. Fry (together with Spencer) started to work on the idea to construct a reusable bookmark by using the glue. However, this invention could not only be used as a bookmark. Fry was writing on the bookmark (e.g., instructions about how to use this new product) when he passed around the innovation to his colleagues and supervisor. Fry then realized that the marker could also be used to write small messages on them. The potential for the product increased even further; it was not only a reusable bookmarker it was also a new memory and communication device. The reason that the stickers were yellow in color was, further, a true serendipity. When Fry went to the developing lab to get some paper to experiment with, the lab gave him some yellow leftover scrap paper from another experiment. The managers were initially skeptical to the product but the staff at 3M liked it. The product was not at once a commercial success when it was first launched in four cities in 1977 under the name “Press’n Pell” – not at all. It was launched nationwide in 1980 under the new name “Post-it” and it became soon a success that was spread all across the world. Arthur Fry is a good example of a successful intrapreneur. 3M —and many other companies such as Hewlett Packard, Apple and Google— actively supported what is called “bootlegging” where employees without official approval by managers are allowed to experiment and innovate on their own during part of their paid working time. This is a typical way to stimulate what we earlier denoted bottom-up intrapreneurship.
7

In practice these categories may overlap. For instance, an employed CEO in a large company may own a small proportion of the company (to decrease principal-agent problems). Hence, (s)he is both an employed manager and part-owner/manager of the company. It is, however, reasonable to view persons with only a small stake in a company as employees in the first place and hence as intrapreneurs. A person may also be both an intrapreneur in an established company at the same time as (s)he starts up a new independent firm or controls an own firm.10
A new firm may, likewise, be part of a business group and it will be owned by the parent company and not by the manager of the new firm (a so-called dependent startup or internal startup). The entrepreneurial activity is pursued in a new firm, but in an existing business group. This kind of activity is normally also referred to as intrapreneurship. If there is an independent startup due to a spinoff, this is, however, classified as entrepreneurship.
2.2 Costs and benefits of being an intrapreneur
What is the benefit of being an intrapreneur instead of an (independent) entrepreneur? Why would anyone want to be an intrapreneur instead of an entrepreneur? The main benefit is the reduced risk exposure associated with performing entrepreneurship as an employee. The remuneration as an employee is normally a pre-determined wage (with or without a bonus-related compensation) but as an entrepreneur you will have a more uncertain remuneration based on the surplus (if any) from the company. If you fail you may, as an independent entrepreneur, lose all your invested capital (and collateral such as, e.g., your own home). As an employee you do not normally have these kinds of financial risks.
On the other hand, if you are successful, you may as an independent entrepreneur receive the lion’s share of the potential surplus, but as an employee other stakeholders may seize all or part of the financial rewards. At worst your remuneration will be independent of whether your entrepreneurial endeavor is successful or not if you are an intrapreneur. Of course, it is not riskless to be intrapreneur. If you fail you may lose status, get unemployed and damage your future career even if you do not personally have invested any financial resources in the business (see Bosma et al. 2011).
There might also be other benefits to be an intrapreneur. As an intrapreneur you may have access to the resources of the existing firm. You do not necessarily need to invest your own money and you may be backed up by the firm’s organization, including personal support, networks and in-house knowhow. Hence, as an intrapreneur, you have access to complementary assets and a larger knowledge base than as an independent entrepreneur (Stam 2013, p. 889) and the company may offer operational and administrative support (Martiarena 2013, Luchsinger and Bagby 1987).
2.3 Intrapreneurship vs entrepreneurship
How do intrapreneurship and (independent) entrepreneurship relate to each other? Is a high intrapreneurship level associated with a low entrepreneurship level or vice versa? At the end of the day, this is an empirical question (which we will come back to in section 3.2), but from a theoretical point of view they can be seen as both substitutes and complements.
10 These persons are often called ”hybrid entrepreneurs” (Folta et al. 2010).
8

Entrepreneurial activity can manifest itself in different ways, as entrepreneurship or as intrapreneurship. Given a specific supply of potential entrepreneurs, these individuals can, if they decide to, pursue their entrepreneurial aspirations. They can either exercise entrepreneurship as employee or as owner-manager of their own company. Hence, from this point of view, entrepreneurship and intrapreneurship might be seen as substitutes: the more entrepreneurs the less intrapreneurs.
However, being an intrapreneur might also be the first step towards being an independent entrepreneur. Many ideas that are exploited in new startups originate from employees in established companies that have resulted in spin-offs.11 Also, experience as an independent entrepreneur enables employees to act more entrepreneurially (Bosma et al. 2011; Liebregts et al. 2015). Looking at it from this perspective, entrepreneurs and intrapreneurs are complementarities and there may exist a positive relationship between these groups over time. Hence, many intrapreneurs may induce many entrepreneurs. A particular institutional framework or national culture might stimulate or support entrepreneurial activities in general, hence stimulate both entrepreneurship and intrapreneurship. The ideas are summarized in Figure 2.
Figure 2. The relationship between intrapreneurship and entrepreneurship.
From a governance of innovation point of view (Gilson 2010) independent (innovative) entrepreneurship and intrapreneurship might just be two alternative organizational forms to govern
11 However, due to non-compete covenants or intellectual property rights, it may be impossible for an employee to start a spin-off based on an idea or invention developed in an established company. In that case, the employee is forced to be an intrapreneur if (s)he wants to exploit the idea/invention further.
Entrepreneurial aspiration
intrapreneurship
Entrepreneurhsip
Entrepreneurhsip
Institutional framework and national culture
9

innovation. It depends on the nature of innovation and institutional conditions which organizational form is more effective and efficient to explore and exploit opportunities for innovation (Stam 2013).
2.4 Measuring intrapreneurship
In section 2.1, we discussed what is meant by intrapreneurship. In this section we will discuss how intrapreneurship is measured. Even if intrapreneurship―at least in the later literature―might have a theoretically clear and distinct definition, it is difficult to find a suitable empirical measure. Entrepreneurship as a concept is much easier to measure, if it is defined as small or new firms or as self-employed persons (although one can discuss if these measures are suitable). To untangle who performs intrapreneurship among all employees is more complicated. You may have to rely on self-reporting surveys which opens up for response biases. The willingness to consider oneself to be an intrapreneur may differ between cultures and countries. These surveys will also only cover a part of all employees as it will be too costly and time consuming to investigate all employees on the labor market.
As most attention of entrepreneurial activity historically has focused on independent entrepreneurship, measures of intrapreneurship are new and do not cover as many countries. The most consistent way to measure the intrapreneurship level in the economy has been performed by the GEM (Global Entrepreneurship Monitor). Beginning in 1999, they have surveyed the extent of independent entrepreneurship around the world. In 2011, GEM was extended to also include measures of intrapreneurship.12 However, it was not until 2014 that all countries participating in GEM measured the intrapreneurship level again and it was decided that intrapreneurship should be measured on a yearly basis, as had been done with entrepreneurship.13 Hence, intrapreneurship rates are available for the years 2011, 2014 and 2015.
To avoid arbitrary self-reporting, a distinct questionnaire has been developed within GEM. Figure 3, shows how GEM narrows down the questions to find different measures of intrapreneurship (described below). The intrapreneurship levels are measured as the number of intrapreneurs as a proportion of the working age adults (18-64 years) in the population.
12 Already in 2008, an explorative pilot study was initiated where eleven countries participated (See Bosma et al. 2010). 13 Some countries measured the intrapreneurship level also in 2013.
10
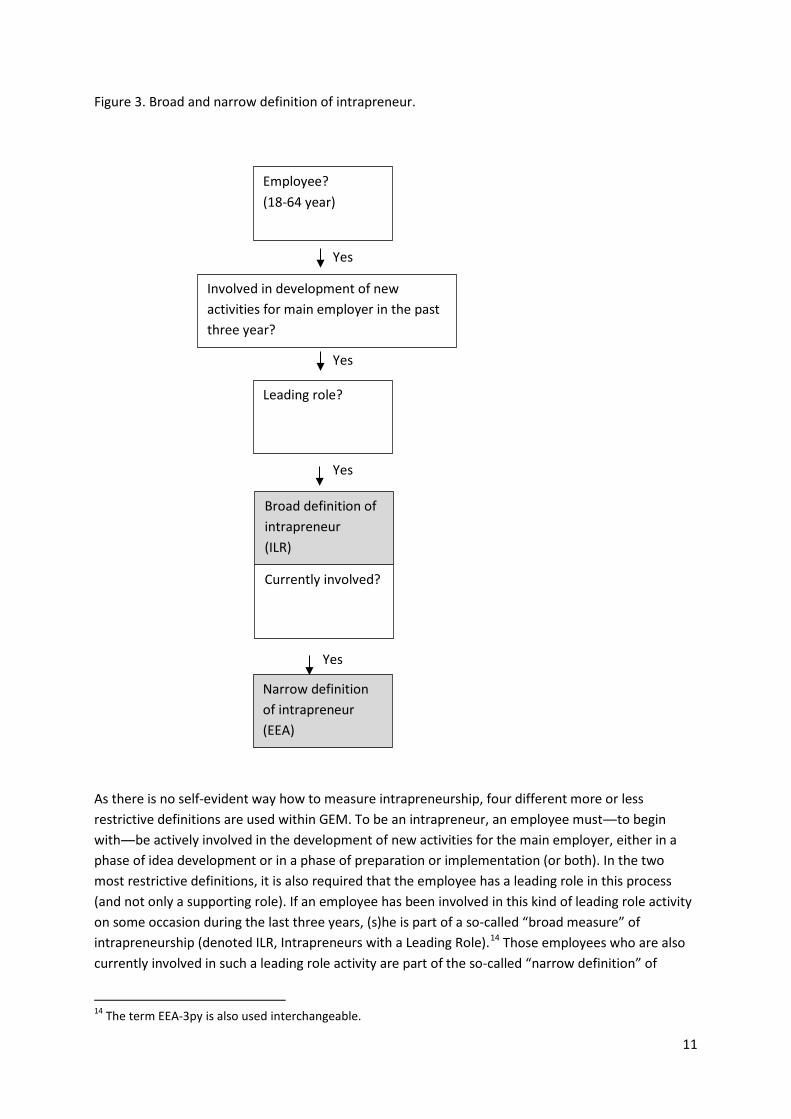
Figure 3. Broad and narrow definition of intrapreneur.
As there is no self-evident way how to measure intrapreneurship, four different more or less restrictive definitions are used within GEM. To be an intrapreneur, an employee must―to begin with―be actively involved in the development of new activities for the main employer, either in a phase of idea development or in a phase of preparation or implementation (or both). In the two most restrictive definitions, it is also required that the employee has a leading role in this process (and not only a supporting role). If an employee has been involved in this kind of leading role activity on some occasion during the last three years, (s)he is part of a so-called “broad measure” of intrapreneurship (denoted ILR, Intrapreneurs with a Leading Role).14 Those employees who are also currently involved in such a leading role activity are part of the so-called “narrow definition” of
14 The term EEA-3py is also used interchangeable.
Employee? (18-64 year)
Involved in development of new activities for main employer in the past three year?
Leading role?
Currently involved?
Yes
Yes
Yes
Narrow definition of intrapreneur (EEA)
Broad definition of intrapreneur (ILR)
Yes
11

intrapreneurship (denoted as EEA, Entrepreneurial Employee Activity), which, hence, is a subset of the broader measure.
If one relaxes the requirement that the employee must have a leading role in the intrapreneurial activity (it is enough to have a supportive role), GEM adds two additional measures of intrapreneurship depending on the time frame. If you are currently involved in a supportive or leading activity, the intrapreneurship measure is denoted IP1 and, in the same way, IP3 is used if you have been involved sometime during the last three year. Figure 4, summarize the different definitions of intrapreneurship used in GEM. EEA is the most restrictive and the most commonly used measure. IP3 (the broadest measure) and in particular IP1 are seldom used.
Figure 4. Different definitions of intrapreneurship used in GEM. Time frame Currently
involved Involved during past three years
Leading role?
Yes Narrow measure (EEA)
Broad measure (ILR)
Not necessarily (IP1) (IP3) Note: An intrapreneur is an employee who has been actively involved in the development of new activities for the main employer. Depending on the time frame and whether the employee has a leading or only supportive role, different definitions are used.
The corresponding measure to intrapreneurship when it comes to “ordinary” entrepreneurship is denoted TEA (Total Entrepreneurial Activity) in GEM and is defined as the proportion of working age adults (18–64 years) in the populations who either are involved in the process of founding a firm or are active as owner-managers of firms that are less than 3.5 years old. TEA can be divided into different subsamples based on, e.g., growth expectation and whether the individuals became entrepreneurs due to necessity or because they wanted to exploit an opportunity.
One commonly used measure is Growth expectation early-stage entrepreneurship (TEA-MH), defined as those involved in TEA who expects to employ at least five employees five years from now. 15 Another measure is, Improvement-driven opportunity entrepreneurship (TEA-IMP), defined as those involved in TEA who (i) claim to be driven by opportunity as opposed to finding no other option for work, and (ii) who indicate the chief motive for being involved in this opportunity is being independent or increasing the income, rather than just maintaining it.16
A corresponding measure when it comes to intrapreneurship is Growth expectation intrapreneurship (EEA-MH), defined in the same way as for entrepreneurship but based on intrapreneurship instead.17 Improvement-driven opportunity intrapreneurship is not measured. All intrapreneurs should be regarded as opportunity intrapreneurs and intrapreneurs by necessity seem not to be a reasonable
15 However, opportunity perceptions might be biased and entrepreneurs are not seldom over-optimistic and overstate the potential prospects of an opportunity. Hence, caution should be used when interpreting this measure. 16 These measures can either be presented as a share of total TEA or as a share of the working age adults (18-64 years). We will in this paper use the latter definition. 17 In the same way, EEA-SL is defined as intrapreneurs who think that their activity will result in no or at most four new jobs within five years.
12

concept. To be independent is not an option to an employee. GEM also distinguishes intrapreneurs who are currently involved in starting up (or have the intention to start up) their own businesses (EEA-IEO). This will partly cover what was called “hybrid entrepreneurs” above.
13

3. Intrapreneurship data
This section will in more detail present intrapreneurship levels in developed western countries based on the methodology developed by GEM.18
3.1 intrapreneurship measures Table 2, shows different intrapreneurship levels (as described in section 2) as a share of each country’s working age adults (18-64 years) in the population. Figure 5 also portraits the value of EEA —that is, the most commonly used and most narrow definition of intrapreneurship. As can be seen from the table, the broader the definition, the larger share of the population can obviously be described as intrapreneurs. The difference between EEA (currently having a leading role as intrapreneur) and ILR (currently or during the last three years having a leading role as intrapreneur) is not dramatic (average values are 3.5 percent and slightly more than 4.5 percent respectively). Relaxing the requirement that the intrapreneur must have a leading role only requiring a supportive role increases the estimated share of intrapreneurs greatly—the average value almost triple from a little more than 4.5 to almost 13 percent. The correlations between the different measures are, however, high as depicted in table 3. Thus, independently of how you measure the intrapreneurship level the rank between the countries will be about the same; countries with a high level of EEA will also have a high value of IP3. Figure 6a-b shows a scatterplot between the narrowest measure (EEA) and the broadest measure (IP3) and between EEA and ILR.
18 All data (at aggregate country level) can with some time lag be downloaded at http://www.gemconsortium.org/.
14

Table 2. Intrapreneurship levels per country
Country EEA ILR IP3 Australia 5.8 7.7 12.6 Austria 4.2 5.6 n.a. Belgium 5.9 7.0 21.3 Bosnia and Herzegovina 2.0 2.5 8.9 Bulgaria 0.4 0.4 n.a. Canada 4.3 5.9 n.a. Croatia 3.6 4.3 16.7 Czech Republic 3.2 3.8 13.5 Denmark 8.9 13.3 32.7 Estonia 4.0 4.9 n.a. Finland 5.5 6.6 23.3 France 3.3 4.3 15.6 Germany 3.4 4.6 15.8 Greece 0.9 1.1 4.5 Hungary 2.1 2.9 9.4 Ireland 5.3 6.4 10.7 Israel 4.8 6.6 n.a. Italy 1.0 1.1 n.a. Japan 2.0 2.2 7.3 Korea Rep. 2.3 2.5 6.1 Kosovo 0.1 0.2 n.a. Latvia 2.4 3.2 7.5 Lithuania 3.4 5.0 11.6 Luxembourg 4.7 6.8 n.a. Macedonia 1.6 2.3 n.a. Netherlands 5.1 7.0 17.9 Norway 6.7 8.9 18.7 Poland 2.6 3.4 10.8 Portugal 2.8 3.7 7.8 Romania 3.4 4.5 11.7 Russia 0.4 0.6 1.3 Slovakia 3.4 4.0 12.0 Slovenia 4.2 5.1 14.6 South Africa 0.2 0.3 1.2 Spain 1.6 1.9 6.9 Sweden 7.6 9.4 27.9 Switzerland 4.6 5.7 12.1 United Kingdom 4.6 5.4 10.1 United States 5.2 6.7 11.7 Average 3.5 4.6 12.7
Source: GEM Note: EEA, ILR and IP3 defined as described in section 2 and as a share of working age adults (18-64 years) in the population. EEA and ILR refer to average values for 2011, 2014 and 2015. IP3 refers to values for 2011 as values for 2014 and 2015 is not available. Values for IP1 are not available.
15

Figure 5. EEA (Entrepreneurial employee activity) levels.
Source: GEM Note: Refers to average values for 2011, 2014 and 2015. Table 3. Correlation between different intrapreneurship measures.
EEA ILR IP3 EEA 1.0 ILR 0.9741 1.0 IP3 0.8945 0.9279 1.0 Note: Refers to values in 2011.
02
46
810
EE
A
Kos
ovo
Sou
th A
frica
Bul
garia
Rus
sia
Gre
ece
Italy
Mac
edon
iaS
pain
Bos
nia
and
Her
zego
vina
Japa
nH
unga
ryK
orea
Rep
.La
tvia
Pol
and
Por
tuga
lC
zech
Rep
ublic
Fran
ceG
erm
any
Lith
uani
aR
oman
iaS
lova
kia
Cro
atia
Est
onia
Aus
tria
Slo
veni
aC
anad
aS
witz
erla
ndU
nite
d K
ingd
omLu
xem
bour
gIs
rael
Net
herla
nds
Uni
ted
Sta
tes
Irela
ndFi
nlan
dA
ustra
liaB
elgi
umN
orw
ayS
wed
enD
enm
ark
16

Figure 6a-b. Scatterplots between the different intrapreneurship measures.
Note: EEA and ILR refers to average values 2011, 2014 and 2015. IP3 refers to values in 2011.
The tables and figures show that the Nordic countries―including Sweden―stand out as countries with a very high levels of intrapreneurship. Looking at the more narrow measures (EEA and ILR), Denmark has exceptionally high values followed by Sweden and Norway. Analyzing broader measures, Finland and Belgium (and to a lesser extent the Netherlands) also have much higher values of intrapreneurship compared with the other countries. In section 4, we will try to disentangle why Sweden, as a Nordic country, has such a high intrapreneurship level compared to many other western countries.
3.2 Intrapreneurship versus entrepreneurship
As discussed in section 2, intrapreneurship and entrepreneurship can be related to each other on the macro and the micro level. In this section we will analyze if the relation is positive, negative or non-existing on the macro level.
Australia
Austria
Belgium
Bosnia and Herzegovina
Bulgaria
Canada
CroatiaCzech Republic
Denmark
Estonia
Finland
FranceGermany
Greece
Hungary
IrelandIsrael
Italy
JapanKorea Rep.
Kosovo
Latvia
Lithuania
Luxembourg
Macedonia
Netherlands
Norway
PolandPortugalRomania
Russia
Slovakia
Slovenia
South Africa
Spain
Sweden
SwitzerlandUnited Kingdom
United States
05
1015
ILR
0 2 4 6 8 10EEA
Australia
Belgium
Bosnia and Herzegovina
Croatia
Czech Republic
Denmark
Finland
FranceGermany
Greece
HungaryIreland
JapanKorea Rep.Latvia
Lithuania
Netherlands Norway
Poland
Portugal
Romania
Russia
Slovakia
Slovenia
South Africa
Spain
Sweden
SwitzerlandUnited Kingdom
United States
010
2030
40IP
3
0 2 4 6 8 10EEA
17

In table 4 and figure 7, the intrapreneurship (defined as EEA) and entrepreneurship (TEA) levels are displayed. The average entrepreneurship level is more than twice as large as the intrapreneurship level in the investigated sample (7.9 percent versus 3.5 percent). The correlation between the measures is as low as 0.19. As can be seen from the figure, no clear positive or negative relationship is apparent between the measures. Instead, one can discern (four) different types of countries with different characteristics (with a high and/or low levels of entrepreneurship and intrapreneurship) (cf. Bosma et al. 2013).
Some countries have a low level of both intrapreneurship and entrepreneurship. Here we find eastern European countries (such as Russia, Bulgaria and Kosovo) but also Mediterranean countries (such as Italy and Spain) and from further east, Japan. Other countries have a low level of entrepreneurship, but a high level of intrapreneurship. Here we find the Nordic countries―including Sweden―and Belgium (but not the Netherlands). Most countries with a high entrepreneurship level have a medium rate of intrapreneurship. However, the USA, Canada and Australia (and Israel to a lesser extent) reveal both a high level of entrepreneurship and a relatively high level of intrapreneurship (albeit not as high as in the Nordic countries). Countries with a high level of entrepreneurship but a low level of intrapreneurship are rare in our dataset: South Africa has a very low level of intrapreneurship and a relatively high level of entrepreneurship, Latvia has a very high level of entrepreneurship and relatively low level of intrapreneurship. However, if we would have included more low-income countries, the occurrence of high levels of independent entrepreneurship (in the formal and informal economy) and low levels of intrapreneurship would be much more prevalent.
The differences between European countries are noteworthy: Spain has about the same entrepreneurship level as Belgium and the Nordic countries, but these latter countries have four to five times as many intrapreneurs. Only analyzing the entrepreneurship level will miss much of the entrepreneurial activity in the economy and may give a completely wrong picture of entrepreneurial aspiration levels in Europe and may lead to misleading policy advice. The prevalence of entrepreneurial activity is manifested through intrapreneurship in a much higher extent in the Nordic countries (and Belgium) than in most other countries. Table 4. TEA and EEA levels [See Appendix]
18

Figure 7. TEA versus EEA level.
Note: refers to average rates 2011, 2014 and 2015. Lines in the figures refer to average values in the sample.
Not all entrepreneurial activity is of equal importance, and one can also analyze what we in section 2 denoted Growth expectation early-stage entrepreneurship (TEA-MH) and Growth expectation intrapreneurship (EEA-MH), i.e., entrepreneurial/intrapreneurial activity that is expected to result in at least five new jobs within five years. Table 5 shows these measures (as share of the adult population. The table also shows how large a share of the total entrepreneurship and intrapreneurship that has growth expectation and the rightmost column shows how large share of the total growth expectation activity that is associated with intrapreneurship.
Australia
Austria
Belgium
Bosnia and Herzegovina
Bulgaria
Canada
CroatiaCzech Republic
Denmark
Estonia
Finland
FranceGermany
GreeceHungary Ireland
Israel
Italy Japan
Korea Rep.
Kosovo
Latvia
Lithuania
Luxembourg
Macedonia
Netherlands
Norway
PolandPortugal
Romania
Russia
Slovakia
Slovenia
South Africa
Spain
SwedenSwitzerland
United Kingdom
United States
46
810
1214
TEA
0 2 4 6 8 10EEA
19

Figure 8. Growth expectation intrapreneurship.
Note: Refers to figures in 2011
Table 5. Growth expectation intrapreneurship and entrepreneurship [See Appendix] Whereas the average entrepreneurship level (measured as TEA) was much higher than the average intrapreneurship level (measured as EEA), the growth expectation levels of both entrepreneurship and intrapreneurship are roughly the same (approximately 2.5 percent). Hence, from a job generating perspective intrapreneurship seems to be as important as (independent) entrepreneurship.19 As can be seen from figure 8, the Nordic countries ( as well as Belgium and the Netherlands) score highly on this intrapreneurship measure.
The share of all intrapreneurs who expect to grow is much higher than the share of all entrepreneurs who expect to grow. The average share is approximately 65 percent compared to being slightly above 30 percent, i.e. roughly two thirds of all intrapreneurs expects that their activity will result in at least five new jobs, whereas the same figure for entrepreneurs is only roughly one third. Bosnia & Herzegovina and Latvia are the countries with the highest share of their intrapreneurs who have growth expectations (80 and 91 percent). However, the total intrapreneurship level in these countries is relatively low, hence the intrapreneurship level with a growth expectation as a share of the population is still low. Concerning growth expectation entrepreneurs, the highest share (above 40 percent) can be found among some eastern European countries (e.g. Latvia, Romania, Poland) followed by some Anglo-Saxon countries (e.g., Canada, Ireland and US).
19 Assuming that there is no more or less overconfidence bias among intrapreneurs about future job prospects than independent entrepreneurs. This could be debated, stating that intrapreneurs are less biased, as they might be more realistic given intra-organizational checks and balances.
02
46
810
EE
A_M
H
Sou
th A
frica
Rus
sia
Gre
ece
Pol
and
Spa
inP
ortu
gal
Latv
iaH
unga
ryS
witz
erla
ndS
lova
kia
Kor
ea R
ep.
Cze
ch R
epub
licG
erm
any
Japa
nB
osni
a an
d H
erze
govi
naR
oman
iaC
roat
iaS
love
nia
Lith
uani
aFr
ance
Uni
ted
Kin
gdom
Irela
ndA
ustra
liaU
nite
d S
tate
sN
ethe
rland
sFi
nlan
dB
elgi
umD
enm
ark
Sw
eden
20

From the rightmost column in table 5 one can also see that the intrapreneurship share among those with growth expectation is much larger than the corresponding “ordinary” intrapreneurship (as expressed in the rightmost column in Table 4). The average share value is slightly above 50 percent (compared to about 30 percent) for most countries. The Nordic countries (and Belgium) have a share value of 80 to 85 percent (compared to around 50 percent in Table 4). We can again conclude that when we restrict the analysis to entrepreneurs/intrapreneurs with growth expectations, the importance of intrapreneurs increases.
Figure 9. Growth expectation intrapreneurship vs entrepreneurship.
Note: refers to rates in 2011. Lines in the figures refer to average values in the sample.
As can be seen in Figure 9, there is no clear positive or negative relationship between growth expectation entrepreneurship and intrapreneurship, although it seems that there is no country with both a (very) high level of intrapreneurship and entrepreneurship. The correlation between the measures is -0.25. As before the Nordic countries and Belgium have a high level of intrapreneurship but low level of entrepreneurship. Sweden is a clear outlier here. The Mediterranean countries (Greece, Spain and Portugal) have a low level of both growth expectation intrapreneurship and entrepreneurship. In this group we now also find Germany and Switzerland. Many eastern European countries (such as Romania, Slovakia and Poland) have a high level of growth expectation entrepreneurship but a low level of growth expectation intrapreneurship. United States and Australia can be considered countries with both high level of growth expectation entrepreneurship and intrapreneurship, although the intrapreneurship level is not as high as in the Nordic countries.20
20 One could also analyze the relationship between the ordinary intrapreneurship levels (with or without job expectations) and entrepreneurs with job expectations. The pattern and results will be about the same. The correlation between the measures are -0.11.
Australia
Belgium
Croatia
Czech Republic
DenmarkFinland
France
GermanyGreece
Hungary
Ireland
Japan
Latvia
Lithuania
Netherlands
Poland
Portugal
RomaniaSlovakia
Slovenia
Spain
Sweden
Switzerland
United Kingdom
United States
12
34
56
TEA
_MH
0 2 4 6 8 10EEA_MH
21

As a final analysis of the relationship between entrepreneurship and intrapreneurship level, one can use the measure called Improvement-driven opportunity entrepreneurship (TEA-IMP) as discussed above. Figure 11a and 11b shows this entrepreneurship measure in relationship to the ordinary intrapreneurship level and to the growth expectation intrapreneurship level. If anything at all can be said now, it seems that there is a positive relationship between this entrepreneurship level and intrapreneurship, at least when the ordinary intrapreneurship measure (EEA) is used.21
A general conclusion derived from these analyses is that the Nordic countries (and Belgium/the Netherlands to some extent) have high levels of intrapreneurship and low levels of (independent) entrepreneurship whereas the opposite is true in the Eastern European countries. Anglo-Saxon countries have a high levels of entrepreneurship and a relatively high levels of intrapreneurship. Many Mediterranean countries have both a low levels of entrepreneurship and intrapreneurship (see Figure 10 for an overview).22 There is no clear-cut positive or negative relationship between entrepreneurship and intrapreneurship across countries. About one third of all entrepreneurial activity comes from entrepreneurial employees, about half of all entrepreneurial activity that is expected to result in job growth comes from entrepreneurial employees.
Figure 10. Classification of countries according to entrepreneurial activity.
Entrepreneurial activity High Low Intrapreneurial activity
High Anglo-Saxon countries Nordic countries Belgium and the Netherlands
Low Eastern Europe Mediterranean countries
21 The correlation is 0.33. 22 Cf. Table S1 and S2 in Bosma et al. (2013).
22

Figur 11a–b. Improvement-driven opportunity entrepreneurship (TEA-IMP) versus intrapreneurship
Note: Refers to average level of 2011, 2014 and 2015
Note: Refers to year 2011.
Australia
Austria Belgium
Bulgaria
Canada
Croatia
Czech Republic
Denmark
Estonia
FinlandFrance
GermanyGreece
Hungary Ireland
Israel
Italy
Japan
Korea Rep.
Latvia
LithuaniaLuxembourg
Macedonia
Netherlands
NorwayPolandPortugalRomania
Slovakia
Slovenia
South Africa
Spain
Sweden
SwitzerlandUnited Kingdom
United States
02
46
8TE
A_I
MP
0 2 4 6 8 10EEA
Australia
Belgium
Croatia
Czech Republic
Denmark
FinlandFrance
GermanyGreece
Hungary
Ireland
Japan
LatviaLithuania
Netherlands
Poland
Portugal
Romania
Slovakia
Slovenia
Spain
SwedenSwitzerland
United Kingdom
United States
24
68
TEA
_IM
P
0 2 4 6 8 10EEA_MH
23

4. Explaining the prevalence of intrapreneurship
As shown in section 3, Sweden―as well as the other Nordic countries―stands out as an economy with a high share of intrapreneurs (independently of how it is measured). In this section we will analyze some potential explanations for this result.
What might cause a high intrapreneurship level is not obvious and the potential variables to explore are not self-evident. Systematic analysis of intrapreneurship from an economics point of view has hardly been done before. As this study, hence, must be seen as a pioneering analysis and one of the first of its kind, there are no precursor investigation that can be used as the basis for the choice of variables to explore. The only exception includes Stam (2013), which is a large-scale cross-country level analysis of intrapreneurship. Stam (2013) focuses on the knowledge level in the economy as a potential explanation for (part of) the difference in the prevalence of intrapreneurship between countries.
To find more suitable variables to explore, one has to dig further into the academic literature. Even if analyses of intrapreneurship are sparse, there are many studies analyzing the prevalence of (independent) entrepreneurship in the economy. Today almost everyone claims that the institutional framework is an important factor that will influence the entrepreneurial activity in the economy. From a Nordic perspective—which seems to be a reasonable basis to use for this study—one can mention Henrekson (2005) who emphasizes the Welfare state as well as cultural factors as important variables that influence the institutional framework in the economy, the incentives among individuals and, in the end, the entrepreneurial activity in the economy. It is not too far-fetched that these factors might not only influence independent entrepreneurship but intrapreneurship level as well. An important cultural factor that has hardly been analyzed before, but for good reasons (see discussion below) should be important for the prevalence of intrapreneurship, is generalized trust.
Based on the discussion above we will in this section discuss generalized trust (section 4.1), the welfare state / ”the Swedish model” (section 4.2) and the knowledge level (section 4.3). In section 4.4, a final analysis will be done based on all these explanations and other covariates.
4.1 Generalized trust
4.1.1 The Concept of Generalized trust
Generalized trust (henceforth called trust) has been shown to have positive effect on macroeconomic outcomes such as growth and efficiency in the economy (see, e.g., Zak and Knack 2001, Glaeser et al. 2002, Sobel 2002, Beugelsdijk et al. 2004, Berggren et al. 2008 and Bjørnskov 2012). Trust has also been shown to be beneficial to individual firms and organization and, as will be discussed below, it may in the end also stimulate intrapreneurship.
There is no generally agreed definition of trust in the economic literature. In Webster (1953), trust is defined as “confidence in the honesty, integrity, reliability, justice of another person [or thing].” From an economic point of view, trust can be defined as “the willingness of a party to be vulnerable to the actions of another party based on the expectation that the other will perform a particular action important to the trustor, irrespectively of the ability to monitor or control that other party.” (Mayer et al. 1995).
24

As there is no general accepted definition of trust, trust can be measured in different way. The most commonly used empirical measure is based on survey data from World Value Survey database or European Value Survey database where the percentage of people agreeing on the statement that “most people can be trusted” is seen as a proxy for the level of trust within a particular society.
Even if trust―measured in the above mentioned way―is said to correlate with (or cause) many positive aspects of the economy (such as lower transaction costs, improved cooperation etc.), trust cannot unconditionally be seen as something positive and as an ultimate goal in itself. If most people in an economy are trustworthy, trusting people in general is a good rule of thumb among the economic agents as this will facilitate transactions and exchange in the economy. If, on the other hand, most people in the economy are not trustworthy, trusting people is not advisable as individuals will abuse the trust and behave opportunistic.
If a country consists of sufficiently high proportion of trustworthy people, trust among its population will hopefully―given that the people are rational and not too risk avert―spontaneously evolve.23 Hence, what matters is trustworthiness, with trust (at the country level) being a good proxy for this. To increase trust by political means in an economy where people in general are not trustworthy is not an advisable goal.
4.1.2 Intrapreneurship and trust
Discussing and analyzing trust is nowadays an integral part of the economic literature. Trust and intrapreneurship is, however, seldom analyzed together.24 In this section we will analyze why and how trust may influence the intrapreneurship level in an economy and in section 4.1.3 we will show some empirics supporting our view. Our arguments are summarized in figure 12.
23 The best way to establish trust is to be trustworthy (Hardin 1996). 24 Notable exceptions include Bosma et al. (2016) and Stull and Arm (2010). The latter is, however, a case study written within the domain of business administration. Intrapreneurship and trust has independently been studied within both the economics and management literature. However, linking trust and intrapreneurship together has hardly been done in earlier studies, and Stull and Arm (2010, p. 30) conclude that “[t]rust is largely overlooked in the study of intrapreneurship.”
25

Figure 12. Relationship between trust and intrapreneurship.
To understand the potential connection between trust and intrapreneurship, we must first say something about the importance of knowledge. In the economy as well as within the firm, knowledge is dispersed and fragmented. Independent entrepreneurs act on local knowledge which is enhanced through learning and experimentation. In the same way as entrepreneurship is stimulated if business owner-managers have the opportunity to act (e.g., start business, expand business or change business orientation according to perceived business opportunities) based on the information that (s)he possesses, intrapreneurship within the firm is stimulated if employees are allowed to do the same. Hence, to stimulate intrapreneurship within a firm, employees must be able to act on local knowledge and generate and experiment with ideas.
However, If an employee is supposed to be able to act on local knowledge, (s)he must have the possibility to do so. As employees are not independent entrepreneurs, the owner-manager must delegate the possibility to act as stated above to the employees or allow the employees to be autonomous enough. That is, the workers must have job autonomy to behave entrepreneurial. A more formal way to express this idea is to say that the owner-manager must use incomplete contracts and “relational contracts” that do not restrict the entrepreneurial endeavor among the workers completely.25
25 “Relational contracts” include informal agreements and unwritten codes of conduct. The idea of so-called “relational contracts” was introduced by Macneil (1978) and according to Baker et al. (2002) it “allows the parties to utilize their detailed knowledge of their specific situation and to adapt to new information as it becomes available.” See Rose (2012) for a further discussion.
Generalized trust in society
Job autonomy / incomplete contracts
Increased prevalence of large firms
Intrapreneurship
Trust between employer/employees
Innovation & growth
Direct effect
Indirect effect
Feedback mechanisms
26

However, giving employees increased freedom and job autonomy through incomplete and relational contracts has a flipside as it also opens up for opportunistic behavior.26 One reason that human interaction will not always result in a socially optimal outcome is opportunism, i.e. the “acting to promote one’s welfare by taking advantage of a trust extended by an individual, group, or society as a whole.”27
If trust in the economy is low, the employer will look upon the employees with suspicion. As the (perceived) threat of opportunism is high, the managers will spend more time on monitoring the employees than otherwise and the job autonomy will be lower. Incomplete and relational contracts will be used to a lesser extent and the room for employee discretion will be low. Bureaucratic structures and procedures will be used extensively in such companies instead. The employer simply wants to minimize the possibility of employees acting opportunistically. Even if this is a rational response from the employer’s perspective and will reduce the extent of opportunistic behavior in the firm, it will also stifle entrepreneurial activity among its employees.
Trust may work as a substitute for formal and complete contracts. If trust (and trustworthiness) is high in the economy and in the firms, the need for detailed contractual and monitoring devices is decreased and hence, job autonomy may be larger. Hence, larger job autonomy increases the opportunity for employees to act on local knowledge and promotes entrepreneurial behavior. This effect is shown as the “direct effect” in Figure 12. Simply stated it says that the more managers trust the employees, the more decision-making can be delegated to subordinates, which maximizes flexibility and stimulates entrepreneurial behavior among the firm’s employees.28
There might also be an indirect effect (as depicted in Figure 12). A larger company is more complex, making it harder to control and supervise. In order to expand, the firm must sooner or later delegate decision-making out in the organization if the firm is supposed to work properly and efficiently.
In a low trust environment, managers will be reluctant to delegate power and authority to subordinates as they will fear that the employees may behave opportunistic. Managers will instead use strict procedures, routines and rules. In a high trust environment, on the other hand, it will be easier for managers to delegate authority to its subordinates (by using incomplete and relational contracts for example). These companies have a higher probability to be flexible and quickly adapt to changing circumstances―even if they are large―and, hence, companies in such a high trust environment will be more prone to expand and survive.
As a result, the presence of multi-person firms and employment in multi-person firms (relative to self-employed, in the formal and informal economy) will be higher in high trust societies than in low trust societies. The higher the share of employment in multi-person firms, the more people can be
26 The ideas about trust and opportunism are based on the book of Rose (2012). Even if Rose does not frame his book from an intrapreneurial perspective, it is not hard to extend his discussion about opportunism to see how it can be relevant for the intrapreneurial activity in the economy. 27 Definition of opportunism taken from Rose (2012, p. 21). 28 According to Chung and Gibbons (1997), a high level of trust within organizations will promote knowledge transfer and information exchange about market opportunities and facilitate learning from experiments and mistakes. Hence, high trust within the firm is associated exactly with the kind of activities that also will stimulate intrapreneurship.
27

intrapreneurs.29 Hence, trust might stimulate intrapreneurship through an increased prevalence of (employment in) multi-person firms.
It is, however, too harsh to conclude that no large firms will evolve in low trust economies. Large firms might evolve in a low trust economy as well but they will tend to be bureaucratic and only exist in sectors of the economy with less complex or standardized production with low value added and where the need for delegation of authority is of less importance. In a high trust economy, large companies may evolve in all sectors of the economy (Rose 2012).
In high trust societies we will find small entrepreneurial firms and large firms with a high degree of intrapreneurship. In low trust societies we might also find small entrepreneurial firms but only large bureaucratic firms. As a result, economies with a high share of (employment in) large firms will have more intrapreneurs.30
There might also be some feedback mechanisms. Vivid intrapreneurship will foster innovation and in the end growth at the micro level (successful intrapreneurial firms) and at the macro level (economic growth).31 This might increase the (employment) share of large companies even further. It may also increase the trust-level.
4.1.3 Empirics
To examine whether there is any relationship between trust and intrapreneurship we will in this section do a simple analysis of the empirical relationship between these entities and show some scatterplots. As already mentioned, we will do a more formal econometric analysis including other explanatory variables and covariates in section 4.4. The data used in this section are presented in Table 6 and the correlation between the variables is presented in Table 7.
29 As discussed in section 2.1, some scholars even argue that intrapreneurship is not perused in small companies at all, which is not in line with empirical evidence (Bosma et al. 2010). Hence we focus here on multi-person firms (large and small) in contrast to solo self-employed, as this reflects the probability of being an employee in a private sector organization in a country, a logical precondition for being an entrepreneurial employee / intrapreneur. 30 Note that this explanation does not imply a causal effect between the share of large firms and intrapreneurs, only a correlation. High trust and high job autonomy cause both a larger presence of intrapreneurship and large firms. 31 Antoncic and Hisrich (2001) has shown that intrapreneurship is an important predictor of firm growth. Of course, even vivid entrepreneurship may foster growth which in the end might stimulate intrapreneurship; richer countries have more intrapreneurship.
28

Table 6. Variables used in this section Variable N Average Stdv Min Max Definition Source
Intrapreneurship
39
3.5
2.05
0.1
8.9
The proportion of working age adults (18–64 years) in the population who are employees and are currently actively involved in the development of new activities for the main employer and has a leading role in this process (EEA).
GEM
Generalized trust 26 34.3 16.69 12.8 76.1 The percentage of people agreeing on the statement that “most people can be trusted.”
European Value Survey
Job autonomy 28 30.8 9.90 9.4 51.1 The percentage of workers who enjoy work autonomy and learning opportunities.
OECD Job quality database
Employment share in large firms
27 0.299 0.0678 0.135 0.468 The share of the employment working in firms with more than 250 employees.
Eurostat SBS database
Entrepreneurship
39
7.9
2.75
3.5
13.9
The proportion of working age adults (18–64 years) in the populations who either are involved in the process of founding a firm or are active as owner-managers of firms that are less than 3.5 years old (TEA).
GEM
Note: Data for trust refers to year 2008. All other variables refer to average level of 2011, 2014 and 2015.
Table 7. Correlation between the variables used in this section. Intrapreneurship Generalized
trust Job autonomy
Large firms
Entrepreneurship
Intrapreneurship 1.0 Generalized trust 0.7758 1.0 Job autonomy 0.8774 0.7972 1.0 Large firms 0.5614 0.4512 0.6151 1.0 Entrepreneurship 0.1944 -0.3052 0.1635 -0.1960 1.0
Figure 13, shows, to begin with, the relationship between generalized trust and the share of intrapreneurship (narrow definition). As can be seen from the figure, there seems to be a clear positive relationship―high trust countries also have a high share of intrapreneurship and vice versa.32 The Nordic countries together with the Netherlands stand out as countries with a high trust level and a high share of intrapreneurship. Eastern European countries (for example Bulgaria and Hungary) as well as Mediterranean countries (such as Greece and Italy) have a low degree of trust and also a low level of intrapreneurship.
32 The correlation is 0.78.
29
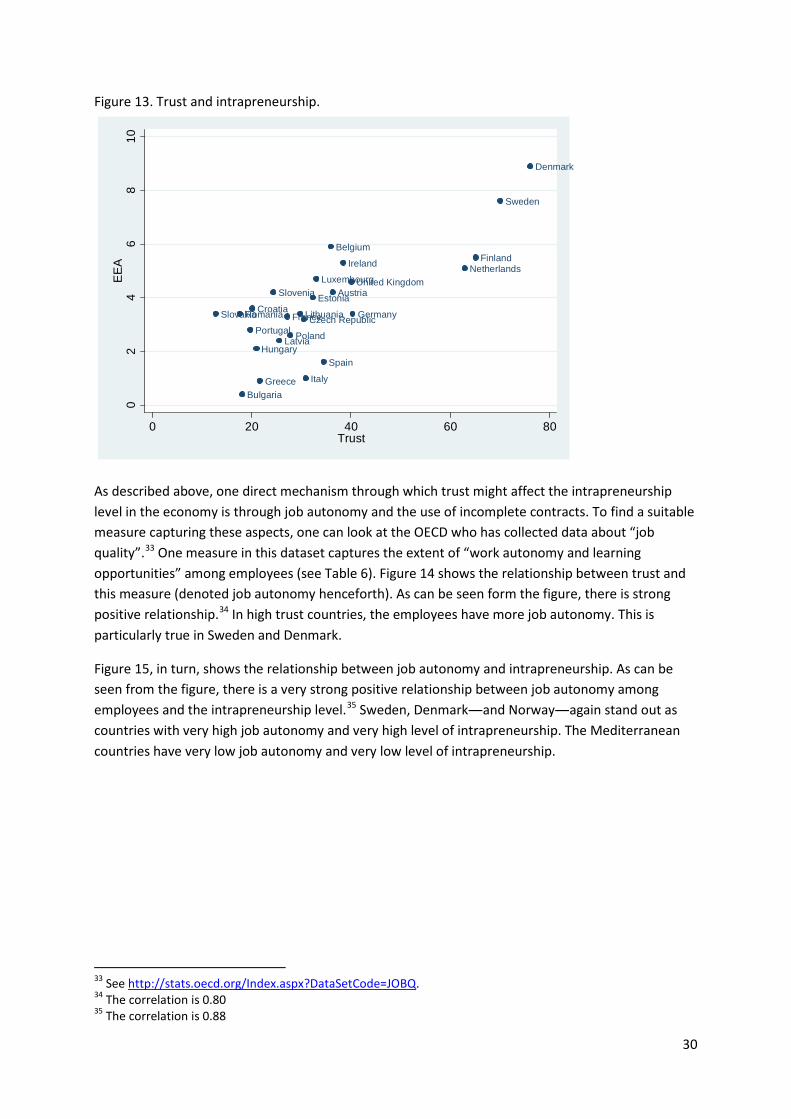
Figure 13. Trust and intrapreneurship.
As described above, one direct mechanism through which trust might affect the intrapreneurship level in the economy is through job autonomy and the use of incomplete contracts. To find a suitable measure capturing these aspects, one can look at the OECD who has collected data about “job quality”.33 One measure in this dataset captures the extent of “work autonomy and learning opportunities” among employees (see Table 6). Figure 14 shows the relationship between trust and this measure (denoted job autonomy henceforth). As can be seen form the figure, there is strong positive relationship.34 In high trust countries, the employees have more job autonomy. This is particularly true in Sweden and Denmark.
Figure 15, in turn, shows the relationship between job autonomy and intrapreneurship. As can be seen from the figure, there is a very strong positive relationship between job autonomy among employees and the intrapreneurship level.35 Sweden, Denmark―and Norway―again stand out as countries with very high job autonomy and very high level of intrapreneurship. The Mediterranean countries have very low job autonomy and very low level of intrapreneurship.
33 See http://stats.oecd.org/Index.aspx?DataSetCode=JOBQ. 34 The correlation is 0.80 35 The correlation is 0.88
Austria
Belgium
Bulgaria
CroatiaCzech Republic
Denmark
Estonia
Finland
France Germany
Greece
Hungary
Ireland
Italy
Latvia
Lithuania
LuxembourgNetherlands
PolandPortugal
RomaniaSlovakia
Slovenia
Spain
Sweden
United Kingdom
02
46
810
EE
A
0 20 40 60 80Trust
30

Figure 14. Trust and job autonomy.
Figure 15. Job autonomy and intrapreneurship.
Hence, the scatterplots and the correlations shown above support the direct mechanisms as discussed in section 3.1.2. In economies with high trust levels, the employees have high job autonomy and economies with high job autonomy among its employees have a high level of intrapreneurship.
Austria
Belgium
Czech Republic
Denmark
EstoniaFinland
FranceGermany
Greece
Hungary
Ireland
Italy
LuxembourgNetherlands
Poland
Portugal
Slovenia
Spain
Sweden
United Kingdom
1020
3040
50Jo
b au
tono
my
0 20 40 60 80Trust
Australia
Austria
Belgium
Canada
Czech Republic
Denmark
Estonia
Finland
FranceGermany
Greece
Hungary
IrelandIsrael
Italy
JapanKorea Rep.
LuxembourgNetherlands
Norway
PolandPortugal
Slovenia
Spain
Sweden
SwitzerlandUnited Kingdom
United States
02
46
810
EE
A
10 20 30 40 50Job autonomy
31
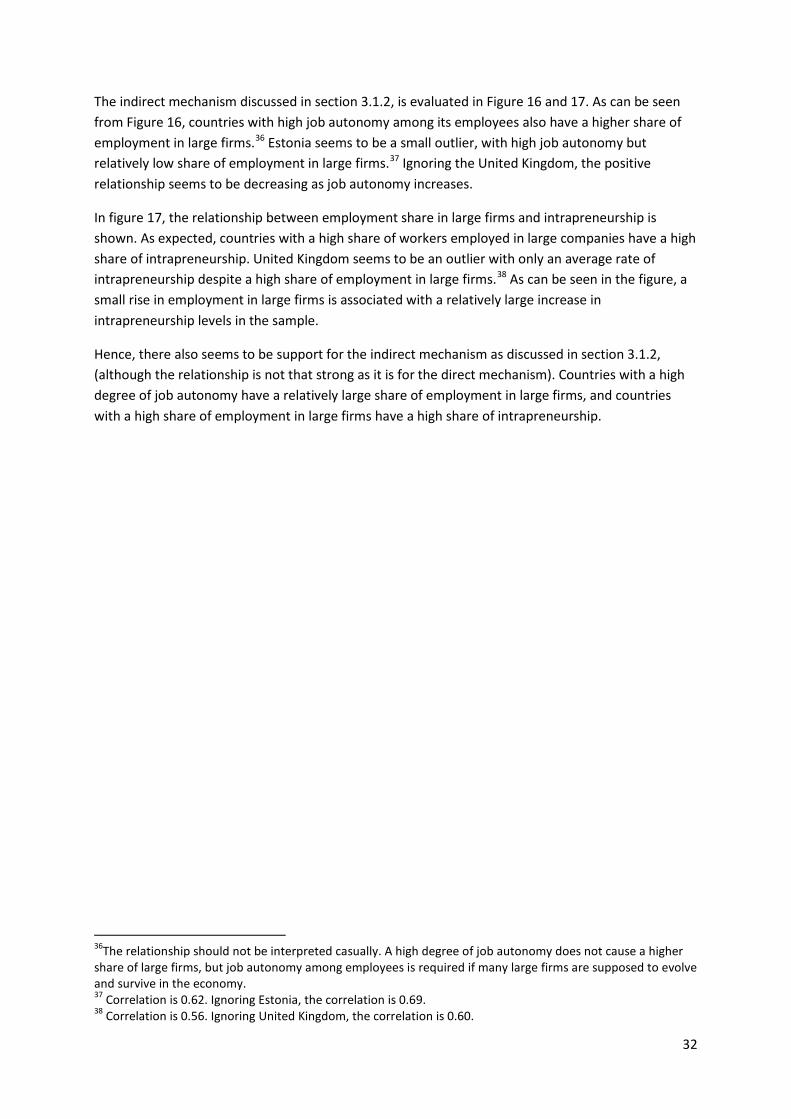
The indirect mechanism discussed in section 3.1.2, is evaluated in Figure 16 and 17. As can be seen from Figure 16, countries with high job autonomy among its employees also have a higher share of employment in large firms.36 Estonia seems to be a small outlier, with high job autonomy but relatively low share of employment in large firms.37 Ignoring the United Kingdom, the positive relationship seems to be decreasing as job autonomy increases.
In figure 17, the relationship between employment share in large firms and intrapreneurship is shown. As expected, countries with a high share of workers employed in large companies have a high share of intrapreneurship. United Kingdom seems to be an outlier with only an average rate of intrapreneurship despite a high share of employment in large firms.38 As can be seen in the figure, a small rise in employment in large firms is associated with a relatively large increase in intrapreneurship levels in the sample.
Hence, there also seems to be support for the indirect mechanism as discussed in section 3.1.2, (although the relationship is not that strong as it is for the direct mechanism). Countries with a high degree of job autonomy have a relatively large share of employment in large firms, and countries with a high share of employment in large firms have a high share of intrapreneurship.
36The relationship should not be interpreted casually. A high degree of job autonomy does not cause a higher share of large firms, but job autonomy among employees is required if many large firms are supposed to evolve and survive in the economy. 37 Correlation is 0.62. Ignoring Estonia, the correlation is 0.69. 38 Correlation is 0.56. Ignoring United Kingdom, the correlation is 0.60.
32

Figure 16. Job autonomy and share of employment in large firms.
Figure 17. Share of employment in large firms and intrapreneurship.
One can also, as an extension, examine the relationship between ordinary entrepreneurship (TEA) and trust. The relationship is displayed in Figure 18. As can be seen from the figure, there does not seem to exist any positive relationship between trust and the prevalence of entrepreneurship. If
AustriaBelgiumCzech Republic
Denmark
Estonia
FinlandFranceGermany
Greece
Hungary
Italy
LuxembourgNetherlands
NorwayPoland
Portugal
SloveniaSpain
SwedenSwitzerland
United Kingdom
.1.2
.3.4
.5S
hare
of l
arge
firm
s
10 20 30 40 50Job autonomy
Austria
Belgium
Bulgaria
CroatiaCzech Republic
Denmark
Estonia
Finland
FranceGermany
Greece
Hungary
Italy
Latvia
Lithuania
LuxembourgNetherlands
Norway
PolandPortugal
RomaniaSlovakia
Slovenia
Spain
Sweden
Switzerland United Kingdom
02
46
810
EE
A
.1 .2 .3 .4 .5Share of large firms
33

anything can be said at all, it seems that there is a negative relationship.39 There is no country with high trust and a high level of entrepreneurship in the sample. Bulgaria and Slovenia, on the other hand, are countries with a low level of trust and a low level of entrepreneurship.
This section has shown that one reason for the high intrapreneurship level in Sweden may be that Sweden is a high trust country. High trust is associated with more job autonomy among employees and a higher share of employment in large firms. These variables are, in turn, associated with a high level of intrapreneurship.
Figure 18. Trust and entrepreneurship.
39 Correlation is -0.31. This result is in contrast to Guiso et al. (2006) and Kwon et al. (2013) who both find a positive relationship. These analyses are, however, based on the stock of self-employed as measure of entrepreneurship and not the flow of start-ups. Our results are in line with Welter (2012) who claims that the relationship between trust and entrepreneurship is ambiguous as trust can affect the entrepreneurship level both positively and negatively.
Austria
Belgium
Bulgaria
Croatia Czech Republic
Denmark
Estonia
Finland
FranceGermany
GreeceHungary Ireland
Italy
Latvia
Lithuania
LuxembourgNetherlands
PolandPortugal
Romania
Slovakia
SloveniaSpain
Sweden
United Kingdom
46
810
1214
TEA
0 20 40 60 80Trust
34

4.1.4 Trust level in Sweden
If trust is such an important factor, one might wonder why Sweden has such a high trust level.40 First, one should note that the level of trust seems to be relatively stable over time being part of a country’s established set of culture and norms. The generalized trust level is a stable cultural feature of society being deeply rooted in the economy.41 The high level of trust that characterizes Sweden has not evolved during recent years. This is a structural characteristic of Swedish society, which cannot be explained by short run fluctuations in other societal characteristics or outcomes.
There is, nevertheless, extensive literature discussing trust and analyzing what might influence or explain its higher or lower level around the world. There is no one single or simple variable or relationship that can explain the level of trust within a society. The literature has discussed several topics including the extent of conflicts and cleavages within the society, the extent of social strain and disruption, the level of economic development and modernization, the presence of democracy and good government, the presence of voluntary organizations and civil society, and influences from religion and culture.42
One main problem when analyzing trust is the causality. If you find a correlation between trust and a distinct variable, it is difficult to decide whether trust is the cause or the effect. Often the causality goes in both directions and reinforces each other. Many of the links that scholars have found to explain trust might be spurious or the variables found are more likely to be caused by trust.43
Delhey and Newton (2005) show that the best explanation for trust includes a direct effect from Christian protestant traditions (positive effect) and ethnic fractionalization (negative effect) and positive intermediate effects through good government, economic development (GDP) and income equality.44 Bjørnskov (2006) has concluded in another study – including a somewhat larger sample – that income inequality and ethnic diversity reduces trust whereas Protestantism and having a monarchy increases trust.45
Both Delhey and Newton (2005) and Bjørnskov (2006), emphasize the Nordic countries and their high level of trust. Delhey and Newton (2005) even claim that the protestant, rich and ethnically homogenous Nordic countries with good governments are exceptional cases with their very high trust level. The effects found in their study are partly driven by the Nordic countries. Ignoring these countries will reduce the effect from the explanatory variables substantially.
Hence, the homogenous population, the religious tradition (Evangelical-Lutheran Protestants) as well as the high and relatively equal income among its population together with good and well-
40 In Sweden more than 70 percent of the population trusts people in general according to the last European Value Survey. The average trust level among the 28 participant countries was about 35 percent, i.e., half of the Swedish trust level. See table 16 at the end of this article. 41 See Uslaner (2002, 2008), Bjørnskov (2006). 42 Delhey and Newton (2005). 43 Bjørnskov (2006). 44 Intermediate effect means that religious tradition and ethnic fractionalization affects or influences government performance, economic wealth and income equality in the country which, in turn, affects the trust level. 45 Concerning the causality of trust level and income equality see Bergh and Bjørnskov (2014).
35

functioning government may all be part of the explanation for the high level of trust within the kingdom of Sweden. The combination of all these effect may also reinforce the effect on trust.
4.2 The welfare state
4.2.1 The welfare state and intrapreneurship
There are strong reasons to believe that the extent of the welfare state may influence the prevalence of intrapreneurship in a country. The arguments are summarized in Figure 19. As described earlier, the entrepreneurial aspiration among the population may be realized either as entrepreneurship or intrapreneurship. The costs and benefits (both monetary and non-monetary) between these two forms differ. These costs and benefits will ultimately decide whether an individual will be an entrepreneur or intrapreneur.
The institutional framework in an economy and the extent of the welfare state will―both intentionally and unintentionally―influence these costs and benefits. There can be many different mechanisms through which the welfare state might affect intrapreneurship. The extent of the social expenditures on different forms of welfare programs, i.e., the tax payer’s entitlement to different forms of social benefits such as family, health and unemployment benefits, will directly make it more or less favorable to be an entrepreneur versus an intrapreneur.
More specifically, the welfare state and the social security system may influence the difference between entrepreneurs and intrapreneurs in three ways. Firstly, some welfare benefits provided by the government may be restricted to employees only. To be entitled to some benefits, you must have a formal wage/salary as many employee benefit schemes, such as unemployment/sickness benefits or parent’s allowances are often designed to compensate a specific share of your wage/salary (up to a pre-specified cap).46 Some independent entrepreneurs (in partnerships or sole proprietorships) are not formally employees and they do not receive a wage, but they are remunerated through the surplus (business income) the business generates (if any), which may not entitle to any social benefits.
Secondly, even if some independent entrepreneurs (such as owner-managers in incorporated businesses) formally may be employees in their own companies, they often do not give themselves a salary or only a very low salary (in particular when they just started a new business and the liquidity may be constrained). Further, the economic fluctuations that encounter most businesses are often counteracted by increasing/decreasing the remuneration to the entrepreneur/owner. This low and/or fluctuating salary/wage makes the potential compensation within a public benefit program low and/or uncertain for an independent entrepreneur. Owner/managers may also remunerate themselves through dividends or through capital gains when they are selling their company. These capital incomes are not included in the income that is entitled to any welfare benefits.
46 In Sweden the parent’s allowance is (in 2016), e.g., 80 percent of your wage/salary but at most SEK 942/day (about EUR 100/day). There are special rules for sole proprietorship.
36
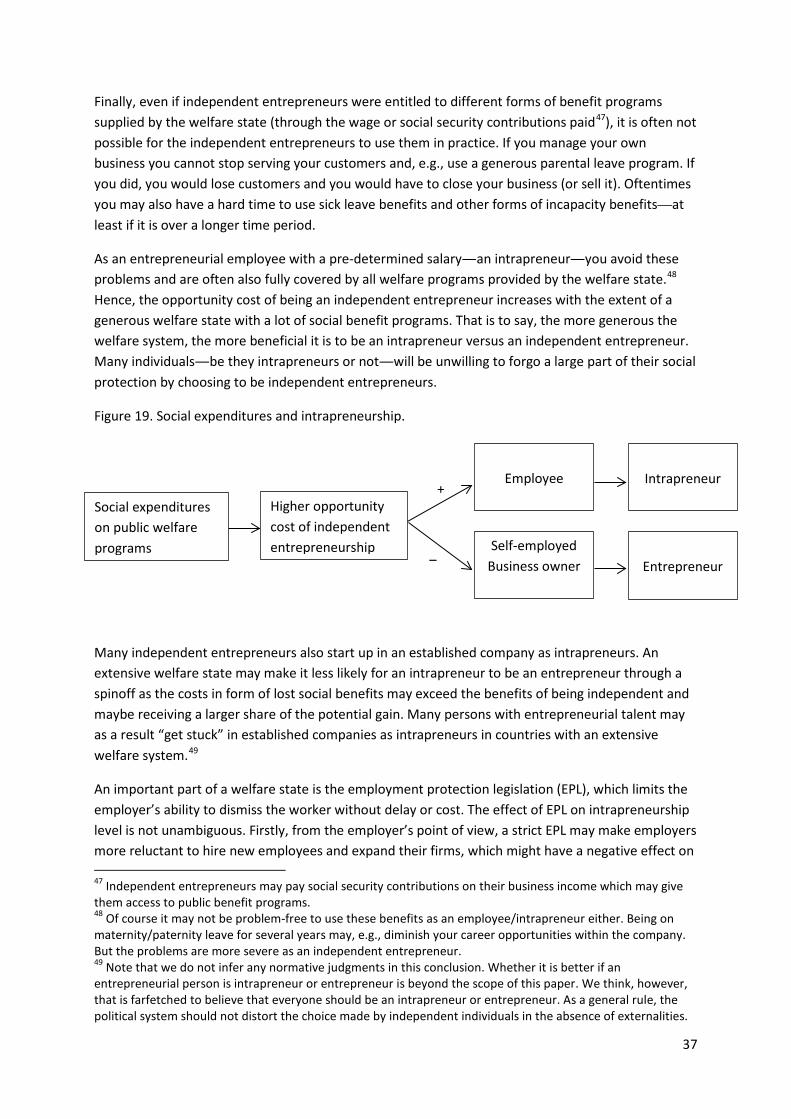
Finally, even if independent entrepreneurs were entitled to different forms of benefit programs supplied by the welfare state (through the wage or social security contributions paid47), it is often not possible for the independent entrepreneurs to use them in practice. If you manage your own business you cannot stop serving your customers and, e.g., use a generous parental leave program. If you did, you would lose customers and you would have to close your business (or sell it). Oftentimes you may also have a hard time to use sick leave benefits and other forms of incapacity benefits—at least if it is over a longer time period.
As an entrepreneurial employee with a pre-determined salary―an intrapreneur―you avoid these problems and are often also fully covered by all welfare programs provided by the welfare state.48 Hence, the opportunity cost of being an independent entrepreneur increases with the extent of a generous welfare state with a lot of social benefit programs. That is to say, the more generous the welfare system, the more beneficial it is to be an intrapreneur versus an independent entrepreneur. Many individuals―be they intrapreneurs or not―will be unwilling to forgo a large part of their social protection by choosing to be independent entrepreneurs.
Figure 19. Social expenditures and intrapreneurship.
Many independent entrepreneurs also start up in an established company as intrapreneurs. An extensive welfare state may make it less likely for an intrapreneur to be an entrepreneur through a spinoff as the costs in form of lost social benefits may exceed the benefits of being independent and maybe receiving a larger share of the potential gain. Many persons with entrepreneurial talent may as a result “get stuck” in established companies as intrapreneurs in countries with an extensive welfare system.49
An important part of a welfare state is the employment protection legislation (EPL), which limits the employer’s ability to dismiss the worker without delay or cost. The effect of EPL on intrapreneurship level is not unambiguous. Firstly, from the employer’s point of view, a strict EPL may make employers more reluctant to hire new employees and expand their firms, which might have a negative effect on
47 Independent entrepreneurs may pay social security contributions on their business income which may give them access to public benefit programs. 48 Of course it may not be problem-free to use these benefits as an employee/intrapreneur either. Being on maternity/paternity leave for several years may, e.g., diminish your career opportunities within the company. But the problems are more severe as an independent entrepreneur. 49 Note that we do not infer any normative judgments in this conclusion. Whether it is better if an entrepreneurial person is intrapreneur or entrepreneur is beyond the scope of this paper. We think, however, that is farfetched to believe that everyone should be an intrapreneur or entrepreneur. As a general rule, the political system should not distort the choice made by independent individuals in the absence of externalities.
Social expenditures on public welfare programs
Employee
Self-employed Business owner
+
–
Higher opportunity cost of independent entrepreneurship
Entrepreneur
Intrapreneur
37

intrapreneurship. A related effect might be that employers will contract-out work to self-employed to circumvent EPL.50 However, from the employee’s point of view, a strict EPL increases the opportunity costs on self-employment and employees might be unwilling to become independent entrepreneurs as they have to give up their legal rights as an employee. A possible outcome could be that employees prefer to be intrapreneurs within established companies.
New research has found that different parts of the EPL might influence the intrapreneurship level in different directions. More specifically, the severance pay is found to be negatively related to the prevalence of intrapreneurship whereas the notice period is found to be positively related.51 Which effect that will dominate, if any, is in the end of the day an empirical question.
4.2.2 Empirics
We will in this section investigate the relationship between the extent of the welfare system and the prevalence of intrapreneurship. Data about aggregate governmental and social expenditures in different countries are easy to extract from OECD.52 The data used in this section are presented in Table 8 and the correlations between the variables are presented in Table 9.
Table 8. Variables used in this section
Variable N Average Stdv Min Max Definition Source
Intrapreneurship
39
3.5
2.05
0.1
8.9
The proportion of working age adults (18–64 years) in the population who are employees and are currently actively involved in the development of new activities for the main employer and has a leading role in this process (EEA).
GEM
Welfare state
28
4.7
1.76
2.1
8.8
Public social expenditures on incapacity and family benefits as a share of GDP.
OECD
Welfare state access of self-employed
25
0.71
0.110
0.47
0.92
Experts answering “yes” to the question “Entrepreneurs have much less access to social security than employees.”
GEM
Employment protection legislation
28
2.1
0.687
0.25
3.62
A composite measure or index of employment protection for regular employment.
OECD
Generalized trust 26 34.3 16.69 12.8 76.1 The percentage of people agreeing on the statement that “most people can be trusted.”
European Value Survey
Note: Data for trust refers to year 2008 and data about welfare refers to year 2011. All other variables refer to average level of 2011, 2014 and 2015.
50 Román et al. (2011). 51 See Liebregts and Stam (2016) for a further discussion and analysis. 52 A proper figure should measure the generosity of the specific welfare programs. We use the government expenditure on social welfare programs as a rough indicator of this.
38

Table 9. Correlation between the variables used in this section. Intrapreneurship Welfare
state Welfare access
EPL Generalized trust
Intrapreneurship 1.0 Welfare state 0.7494 1.0 Welfare access 0.5135 0.6722 1.0 EPL -0.1390 0.1609 0.0700 1.0 Generalized trust 0.7758 0.7791 0.5373 0.0052 1.0
There is no correlation between the intrapreneurship level and total social expenditures.53 However, not all social expenditures may influence the level of intrapreneurship or different benefit schemes may be of different importance for the incentives of being an employee/intrapreneur. If one restricts the analysis to social expenditure programs connected to incapacity (like sick leave benefits) and family (like maternity and parental leave benefits), there will be a clear positive relationship as displayed in Figure 20.54 Sweden and the other Nordic countries stand out as countries with particularly generous welfare programs within these areas (see next section). Hence, the subset of welfare programs associated with incapacity and family are positively related to the prevalence of intrapreneurship in the economy.
Figure 20. Intrapreneurship and social expenditures on incapacity and family.
An alternative measure to capture the disincentive effects that the welfare system may have on independent entrepreneurship is to use the national aggregated responses to different statements in
53 Not shown in any table. It can, however, be noted that the level of total public social expenditures have a negative correlation with the prevalence of entrepreneurship (TEA). 54 Correlation is 0.75.
Australia
Austria
Belgium
Canada
Czech Republic
Denmark
Estonia
Finland
FranceGermany
Greece
Hungary
Ireland
Italy
JapanLatvia
LuxembourgNetherlands
Norway
PolandPortugal
Slovakia
Slovenia
Spain
Sweden
Switzerland United Kingdom
United States
02
46
810
EE
A
2 4 6 8 10Social expenditures (incapacity and family)
39

the GEM National Experts Survey (NES) on entrepreneurial issues. More specifically, one of the statements concerned how well the social security system covered “entrepreneurs”, i.e. self-employed.55 Even if this is only based on a handful subjective responses from national experts concerning the social security system, it is probably a relatively good “informed judgment” of the national welfare state system in the countries that capture the incentive effect that we are interested in.
Figure 21. Social security expenditures and access to social security for self-employed.
Note: Welfare state access refers to an informed judgment by country experts whether entrepreneurs have less access to social security. The correlation between social expenditures and the experts’ answers about welfare state access is high, as can be seen from Figure 21. Both of these measures probably capture the same thing, in that the greater the expenditure on incapacity and family benefits (which probably can be less used by independent entrepreneurs), the more experts agree that entrepreneurs (self-employed) have less access to social security entitlements. Sweden has the highest number in both of these measures. There is also a positive correlation between the prevalence of intrapreneurship and these experts’ answers about access, but the correlation is not that pronounced (and that high) as it is with the level of social security expenditures (see Figure 22).56
55 The statement was ”Entrepreneurs have much less access to the social security than employees.” 56 However, restricting the sample to only EU-countries, the difference in correlation is minor.
Australia
Czech Republic
Finland
FranceGermany
Greece
Hungary
Ireland
Latvia
Netherlands
Norway
Poland
Portugal
Slovakia
SloveniaSpain
Sweden
Switzerland
United Kingdom
24
68
10S
ocia
l exp
endi
ture
s (in
capa
city
and
fam
ily)
.5 .6 .7 .8 .9Welfare state access
40

Figure 22. Intrapreneurship and access to welfare state for self-employed
The analysis could stop here, but the relationships are a bit more complex. As described in section 4.1, trust may be one important determinant for the prevalence of intrapreneurship in the economy. But trust may also influence the extent of the welfare system. If people trust each other, they may be more favorable to an extensive welfare system as the fear of abuse and opportunism will be lower. In a low trust society, people will be reluctant to introduce overly generous welfare program as they may suspect that people will cheat and overuse the system.57 As seen in Figure 23, there seems to be a relationship between trust and the extent of welfare programs concerning incapacity and family.58
57 See Bergh and Bjørnskov (2011) for a discussion. Kumlin and Rothstein (2005) infer that the causality might go in the other direction, i.e., if you have an extensive welfare state, trust will increase in the economy. There are possible feedback-mechanisms between trust and the welfare state implying that the causality might go in both directions. 58 Correlation is 0.78. There is, however, no clear relationship between the total social expenditure level and trust (not shown).
Australia
Bosnia and Herzegovina
CroatiaCzech Republic
Finland
FranceGermany
Greece
Hungary
Ireland
Korea Rep.Latvia
Lithuania
Netherlands
Norway
Poland Portugal
Russia
Slovakia
Slovenia
South Africa
Spain
Sweden
Switzerland United Kingdom
02
46
810
EE
A
.5 .6 .7 .8 .9Welfare state access
41

Figure 23. Trust and social expenditures on incapacity and family.
Trust directly influences the level of intrapreneurs in the economy, but a high level of trust is also associated with a larger welfare state which further strengthens the incentives of being an intrapreneur. As can be seen in Figure 23, the results between trust and the welfare state are, however, partly driven by the Nordic countries. If the Nordic countries are dropped from the analysis, the relationship decreases substantially.59 Hence, there seems to be a Nordic model with an extensive welfare state and a high trust level among its citizens. The Netherlands stands out as a country with only a moderate spending on social expenditures despite very high trust levels.
The OECD also has statistics about the strictness of EPL in different countries. The correlation between EPL and intrapreneurship is depicted in Figure 24.60 As can be seen from the figure, there is no correlation in the dataset. Greece and the Nordic countries have, e.g., about the same strictness in their EPL, but Greece has a very low level of intrapreneurship whereas the Nordic countries have a very high level. As mentioned in the section above, the strictness of EPL might influence the prevalence of intrapreneurship in both positive and negative directions and in our dataset no effect seems to dominate.61
59 The correlation drops to 0.44. Hence, the correlation between trust and welfare state may be spurious; there might be some other factor and underlying cause in the Nordic countries that influences both the trust level and welfare system. It is, however, beyond the scope of this paper to provide a more elaborate answer to this interesting question. See Bergh and Bjørnskov (2014) for an extensive discussion about trust and the welfare state. 60 The statistics above uses EPL for regular employment. Using EPL for temporary employment instead will not change the results (not shown). 61 It is beyond the scope of this paper to dig further into the composition of EPL and its effect on intrapreneurship in different countries. However, it should be noted that Greece has a high severance pay but
Austria
Belgium
Czech Republic
Denmark
Estonia
Finland
FranceGermany
Greece
Hungary
Ireland
ItalyLatvia
Luxembourg
Netherlands
Poland
Portugal
Slovakia
SloveniaSpain
Sweden
United Kingdom
24
68
10S
ocia
l exp
endi
ture
s (in
capa
city
and
fam
ily)
0 20 40 60 80Trust
42
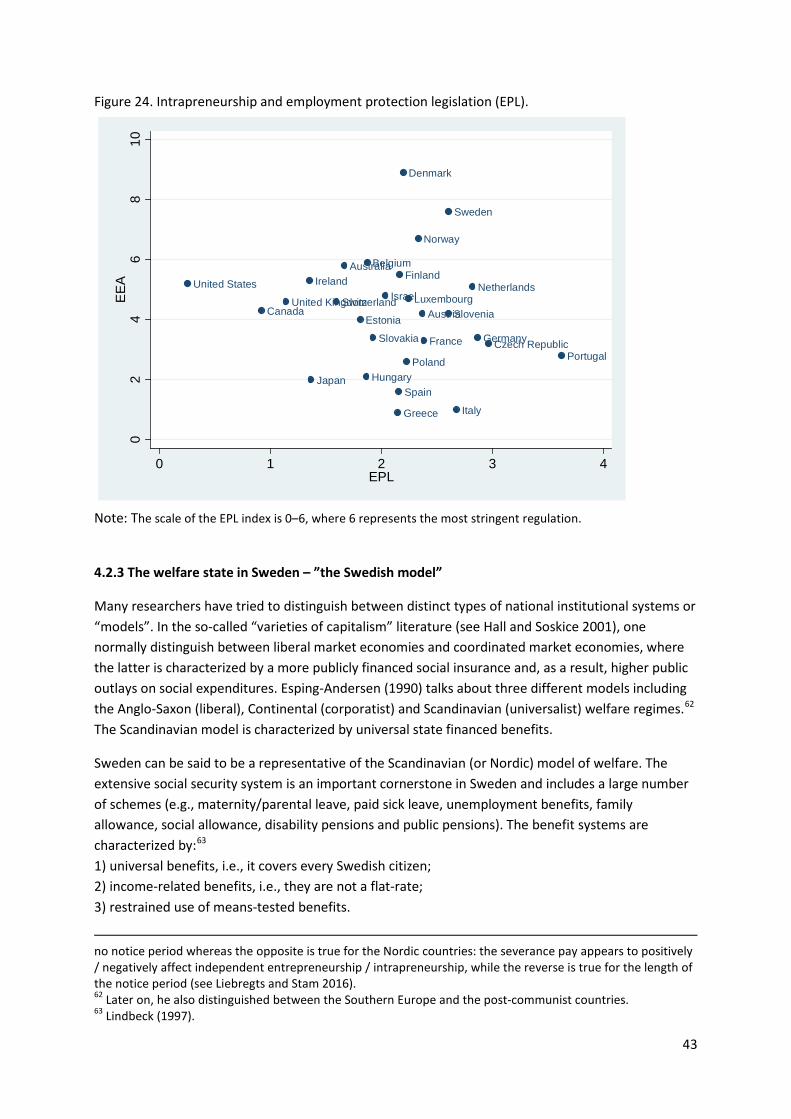
Figure 24. Intrapreneurship and employment protection legislation (EPL).
Note: The scale of the EPL index is 0–6, where 6 represents the most stringent regulation.
4.2.3 The welfare state in Sweden – ”the Swedish model”
Many researchers have tried to distinguish between distinct types of national institutional systems or “models”. In the so-called “varieties of capitalism” literature (see Hall and Soskice 2001), one normally distinguish between liberal market economies and coordinated market economies, where the latter is characterized by a more publicly financed social insurance and, as a result, higher public outlays on social expenditures. Esping-Andersen (1990) talks about three different models including the Anglo-Saxon (liberal), Continental (corporatist) and Scandinavian (universalist) welfare regimes.62 The Scandinavian model is characterized by universal state financed benefits.
Sweden can be said to be a representative of the Scandinavian (or Nordic) model of welfare. The extensive social security system is an important cornerstone in Sweden and includes a large number of schemes (e.g., maternity/parental leave, paid sick leave, unemployment benefits, family allowance, social allowance, disability pensions and public pensions). The benefit systems are characterized by:63 1) universal benefits, i.e., it covers every Swedish citizen; 2) income-related benefits, i.e., they are not a flat-rate; 3) restrained use of means-tested benefits.
no notice period whereas the opposite is true for the Nordic countries: the severance pay appears to positively / negatively affect independent entrepreneurship / intrapreneurship, while the reverse is true for the length of the notice period (see Liebregts and Stam 2016). 62 Later on, he also distinguished between the Southern Europe and the post-communist countries. 63 Lindbeck (1997).
Australia
Austria
Belgium
Canada
Czech Republic
Denmark
Estonia
Finland
France Germany
Greece
Hungary
IrelandIsrael
Italy
Japan
LuxembourgNetherlands
Norway
Poland Portugal
Slovakia
Slovenia
Spain
Sweden
SwitzerlandUnited Kingdom
United States
02
46
810
EE
A
0 1 2 3 4EPL
43

This highly ambitious Swedish welfare system resulting in a large number of welfare programs with the above mentioned characteristics implies that the social system is costly and that the public expenditures will be large. And as have been seen in section 4.2.2, Sweden also stands out as one of the European countries with the highest public expenditure ratios of GDP. The universal principal mentioned above must, however, be qualified. Many entitlements require labor force participation and a formal income. As mentioned above, Sweden also has the highest score on the experts’ judgment that entrepreneurs have less access to the welfare system.
This “Swedish model” has roots far back in time. However, as far back as in 1960, Sweden’s public expenditures were not much higher than in many other (western) European countries. It was not until the mid-1960s or early 1970s, that one can depict a clear Swedish model distinct from many other countries.64 Even if most western countries were building up different forms of welfare systems during the post-war period, the obligations and extensions of the welfare state were much higher in Sweden compared to many other countries. Even if many changes and reforms have been done in the Swedish welfare system after the 1990s crises where, e.g., many replacement rates were cut-down, Sweden can still be depicted as having a system with a relatively extensive welfare regime.
Table 10, gives a general view about the Swedish public social expenditures as a share of GDP. Average OECD figures are also included as a comparison. As can be seen from the Table 10, the Swedish system is more generous than the average OECD country. This is particularly true for old age and incapacity related schemes.
Table 10. Public social expenditures as a share of GDP. Scheme Sweden OECD Old age 9.4 7.4 Survivors 0.4 1.0 Incapacity related 4.3 2.2 Health 6.7 6.2 Family 3.6 2.2 Active labour market programmes 1.2 0.5 Unemployment 0.4 1.0 Housing 0.4 0.4 Other social policy areas 0.7 0.5 Total 27.2 21.4 Note: Refers to year 2011. Source: OECD Even if the Swedish welfare model probably has managed to keep poverty rates down and equalizing incomes, its construction and extent created disincentive effects for entrepreneurs by increasing the opportunity cost by making this career choice instead of being a regular employee. As have been argued and shown by, e.g., Henrekson (2005), the extensive and ambitious Swedish welfare system may have detrimental effect on entrepreneurial activity in the economy. Stam et al. (2010) also maintain that individuals in the Scandinavian welfare regime have fewer incentives to pursue entrepreneurial intentions and efforts relative to individuals in the Anglo-Saxon regime. A potential entrepreneur within this regime is more likely to give up its intention as (s)he is less likely to be paid
64 Lindbeck (1997).
44

off in comparison to wage labor. On the other hand, this kind of extensive welfare system that benefits employees might instead have stimulated intrapreneurship as argued in the section above.
Sweden also has a long tradition of labor security and employment protection in combination with a strong union movement. The union density has been―and still is―high compared to many other countries. During the 1970s and 1980s, strict and general employment protection laws were introduced (in Sweden called LAS). In contrast to Sweden and the other Nordic countries, most Anglo-Saxon countries stand out as having the least stringent EPL. Even if Sweden still has stringent regulation of permanent jobs, substantial liberalization has been done in the past 20 years for temporary contracts. Sweden exhibits today one of the largest difference between regular and temporary contracts among the OECD countries.
4.3 Knowledge
4.3.1 Knowledge and intrapreneurship
Concurrent with the rise of the knowledge society, the importance of investments in knowledge capital and the development and diffusion of new technologies have been emphasized for the economy (Jones & Romer 2010; Sianesi & Van Reenen 2003). Knowledge capital is linked to single individuals, where it is usually termed human capital, or to firms, where it is usually termed organizational capabilities (Teece 2009). Organizational capabilities enable human capital to function in firms. Organizational capabilities are an organizational property, which remain, even when people leave the firm organization (Nelson and Winter 1982). Firms can be seen as entities where employees create and share knowledge (Kogut & Zander 1992). Earlier analysis about intrapreneurship has shown that the prevalence of intrapreneurship at the country level is strongly related to the knowledge level in the economy.65 Knowledge investments, activities and outputs may influence the economy and the entrepreneurial/intrapreneurial activities in several different ways.
More knowledge in the economy in the form of higher educated employees in the firms stimulates intrapreneurship. There may be many reasons or mechanisms for this.66 Firstly, higher educated employees may have a better “absorptive capacity”, i.e., a better capacity to recognize and apply new knowledge and ideas to commercial ends. Secondly―and more indirectly―higher educated employees normally have a higher wage and as a result a higher opportunity cost of leaving employment and being an independent entrepreneur. Hence, higher educated employees are more prone to stay as employees and pursue their entrepreneurial endeavor as intrapreneurs. The importance of knowledge at the individual level has also been confirmed in several studies showing that the probability that an individual will be an intrapreneur increases with the educational level.67
65 See Stam (2013), which, as mentioned above, is the first large-scale cross-country level analysis of intrapreneurship from an economics point of view. 66 See Stam et al. (2012) and Stam (2013). 67 See, e.g., Bosma et al. (2010) and a follow-up study Bosma et al. (2012). For the Swedish case, see Nyström (2010).
45

R&D will also increase the knowledge base in the economy and will influence the possibilities to pursue entrepreneurship. R&D, inventions and new knowledge generation cannot in itself be equated to entrepreneurship or intrapreneurship. However, new knowledge does create opportunities for entrepreneurial and intrapreneurial discoveries.68 Entrepreneurs and intrapreneurs can be considered agents who transform new knowledge into business opportunities, and they may realize these opportunities by creating new firms but also within existing organizations.
R&D can be provided by the public sector through, e.g., universities and the academic world or by established and new firms. Even if knowledge investments in the firms where the intrapreneurs work might directly lead to recognition and pursuit of entrepreneurial opportunities, independent academic research is important as well. The intrapreneurs are not necessarily those who originally produce and develop the new knowledge.
4.3.2 Empirics
Earlier research has used four indicators of the knowledge capital in the economy that might influence the prevalence of intrapreneurship.69 The first indicator is spending on R&D as a share of GDP. As described in the section above, R&D can be seen as a contribution that the intrapreneur uses as an input for new business activity and entrepreneurial endeavors. This measure can be seen as a measure of the level of invention in the economy.70 The second measure that has been found to be important for the prevalence of intrapreneurship is the share of the employment that is working within knowledge-intensive services. This will capture the presence of “knowledge workers” in the workforce. The third measure is the share of population that has a high (tertiary) education. The higher educated an employee is, the higher the probability that (s)he will be an intrapreneur, as described above. The final measure is the number of patent applications (per billion GDP), which might cover some part of the flow of innovations in the economy. The data used in this section are presented in Table 11 and the correlation between the variables is presented in Table 12. The correlation between, in particular R&D, and the other knowledge measures is relatively high.
68 See Holcombe (1998, 2003). 69 Stam (2013). 70 One could also make a distinction between private and public R&D but it is beyond the scope of this study.
46

Table 11. Variables used in this section.
Variable N Average Stdv Min Max Definition Source
Intrapreneurship
39
3.5
2.05
0.1
8.9
The proportion of working age adults (18–64 years) in the population who are employees and are currently actively involved in the development of new activities for the main employer and has a leading role in this process (EEA).
GEM
R&D 28 2.1 0.904 0.72 4.19 Total domestic spending on R&D as a percentage of GDP.
OECD
Knowledge workers
29
37.5
7.30
21.8
47.2
Sum of people in categories ‘professional, technical and related workers; administrative and managerial workers; clerical and related workers’ and ‘legislators, senior officials and managers; professionals; technicians and associate professionals’, as a percentage of total people employed.
ILO, Laborsta database
Education 31 33.1 9.82 14.9 53.5 Percentage of population which attained tertiary degree in the age group 25–64.
OECD
Patent 36
834 1,042 115 6,042 Number of resident applications per 100 billion USD GDP (2011 PPP)
WIPO database
Note: Data for knowledge workers refers to year 2008. All other variables refer to average level of 2011, 2014 and 2015.
Table 12. Correlation between the variables used in this section. Intrapreneurship R&D Knowledge
workers Education Patent
Intrapreneurship 1.0 R&D 0.48 1.0 Knowledge workers 0.58 0.58 1.0 Education 0.24 0.51 0.28 1.0 Patent 0.11 0.53 0.27 0.30 1.0
Figure 25, shows a scatterplot between intrapreneurship and R&D. As can be seen from the figure, there seems to exist a weak positive correlation.71 The Nordic countries, including Sweden, together with Japan and Israel are countries with a high level on R&D expenditures. Japan (and maybe Israel) is an outlier with a high level on R&D expenditures but―despite of this―a low level of intrapreneurship. The correlation increases sharply without Japan and Israel.72 One problem with R&D and entrepreneurial and intrapreneurial activity concerns the time frame. It may take time
71 Correlation is 0.48. 72 The correlation increases to 0.64.
47
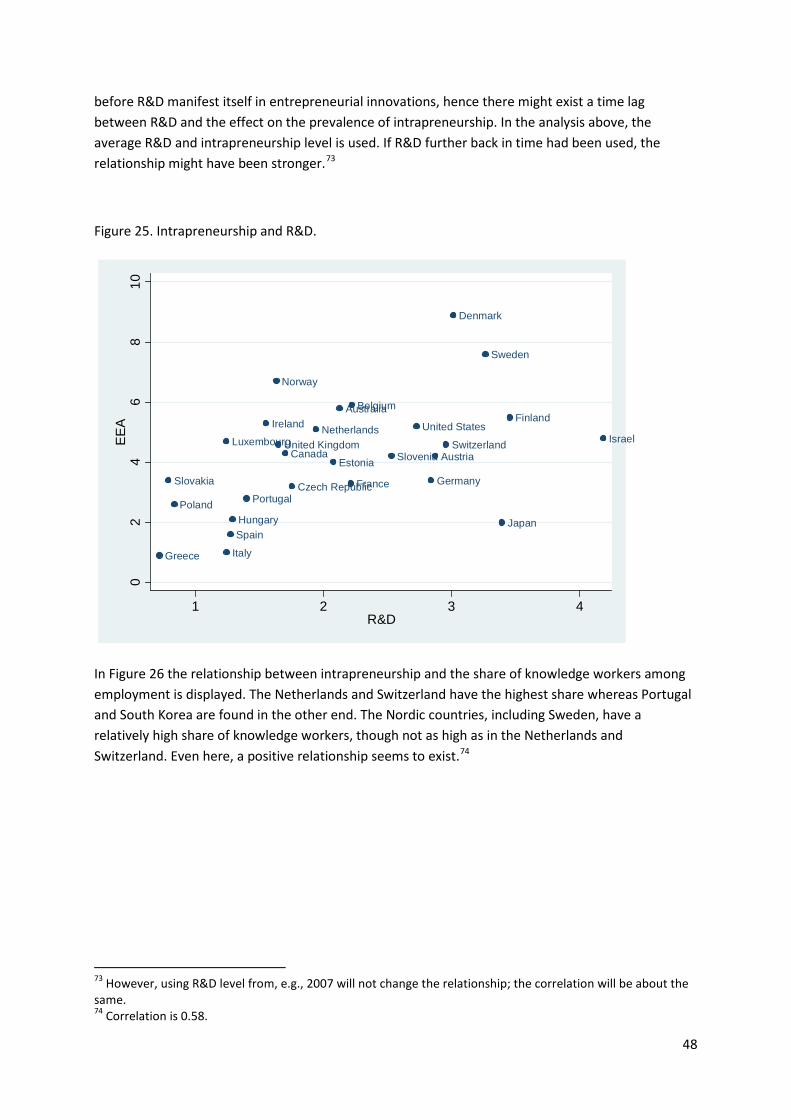
before R&D manifest itself in entrepreneurial innovations, hence there might exist a time lag between R&D and the effect on the prevalence of intrapreneurship. In the analysis above, the average R&D and intrapreneurship level is used. If R&D further back in time had been used, the relationship might have been stronger.73
Figure 25. Intrapreneurship and R&D.
In Figure 26 the relationship between intrapreneurship and the share of knowledge workers among employment is displayed. The Netherlands and Switzerland have the highest share whereas Portugal and South Korea are found in the other end. The Nordic countries, including Sweden, have a relatively high share of knowledge workers, though not as high as in the Netherlands and Switzerland. Even here, a positive relationship seems to exist.74
73 However, using R&D level from, e.g., 2007 will not change the relationship; the correlation will be about the same. 74 Correlation is 0.58.
Australia
Austria
Belgium
Canada
Czech Republic
Denmark
Estonia
Finland
France Germany
Greece
Hungary
IrelandIsrael
Italy
Japan
LuxembourgNetherlands
Norway
Poland Portugal
Slovakia
Slovenia
Spain
Sweden
SwitzerlandUnited Kingdom
United States
02
46
810
EE
A
1 2 3 4R&D
48
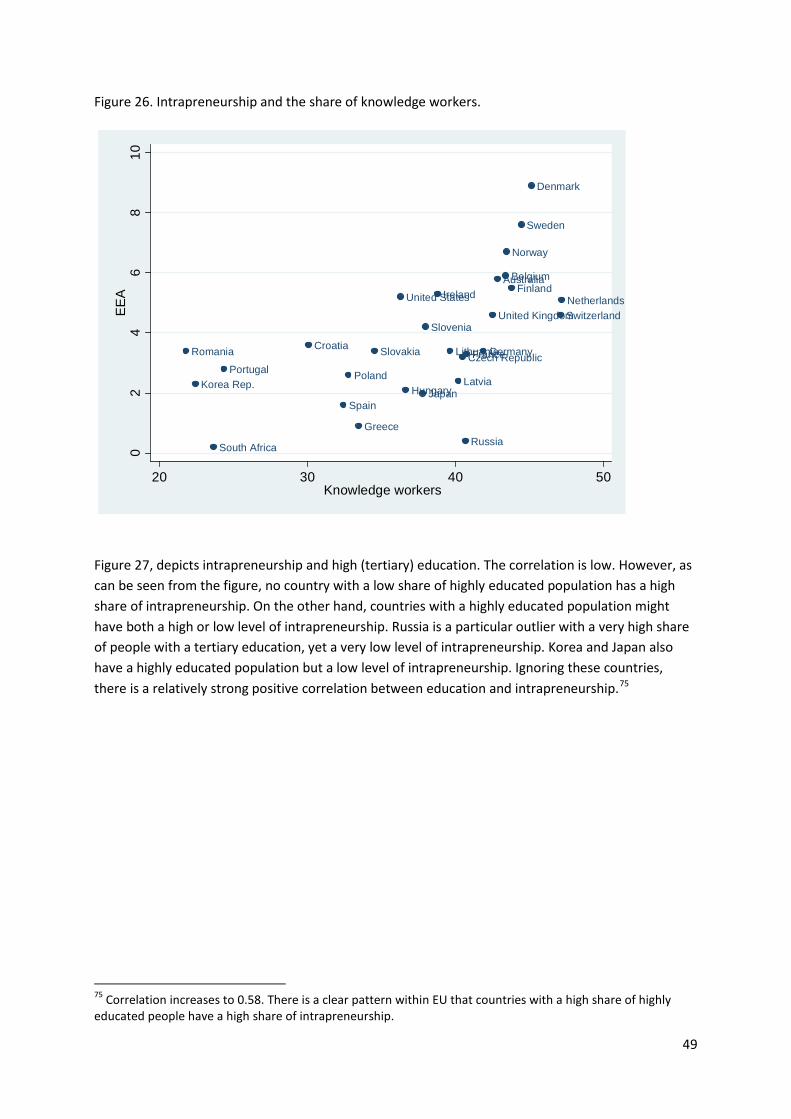
Figure 26. Intrapreneurship and the share of knowledge workers.
Figure 27, depicts intrapreneurship and high (tertiary) education. The correlation is low. However, as can be seen from the figure, no country with a low share of highly educated population has a high share of intrapreneurship. On the other hand, countries with a highly educated population might have both a high or low level of intrapreneurship. Russia is a particular outlier with a very high share of people with a tertiary education, yet a very low level of intrapreneurship. Korea and Japan also have a highly educated population but a low level of intrapreneurship. Ignoring these countries, there is a relatively strong positive correlation between education and intrapreneurship.75
75 Correlation increases to 0.58. There is a clear pattern within EU that countries with a high share of highly educated people have a high share of intrapreneurship.
AustraliaBelgium
CroatiaCzech Republic
Denmark
Finland
FranceGermany
Greece
Hungary
Ireland
JapanKorea Rep. Latvia
Lithuania
Netherlands
Norway
PolandPortugal
Romania
Russia
Slovakia
Slovenia
South Africa
Spain
Sweden
SwitzerlandUnited Kingdom
United States
02
46
810
EE
A
20 30 40 50Knowledge workers
49

Figure 27. Intrapreneurship and education.
Finally, Figure 28 and Figure 29 (without Japan) depict the relationship between patent and intrapreneurship. The correlation is very low. Japan is a clear outlier with many more patents than the other countries. If Japan is removed, the correlation will increase (as can be seen from figure 29).76 Besides Japan, Switzerland and Germany have many patents, however, their intrapreneurship level are only at average values. The number of patents is probably a too narrow measure of knowledge in the economy.
76 Correlation increases to 0.45.
Australia
Austria
Belgium
Canada
Czech Republic
Denmark
Estonia
Finland
FranceGermany
Greece
Hungary
IrelandIsrael
Italy
JapanKorea Rep.Latvia
LuxembourgNetherlands
Norway
PolandPortugal
Russia
Slovakia
Slovenia
Spain
Sweden
SwitzerlandUnited Kingdom
United States
02
46
810
EE
A
10 20 30 40 50Tertiary education
50
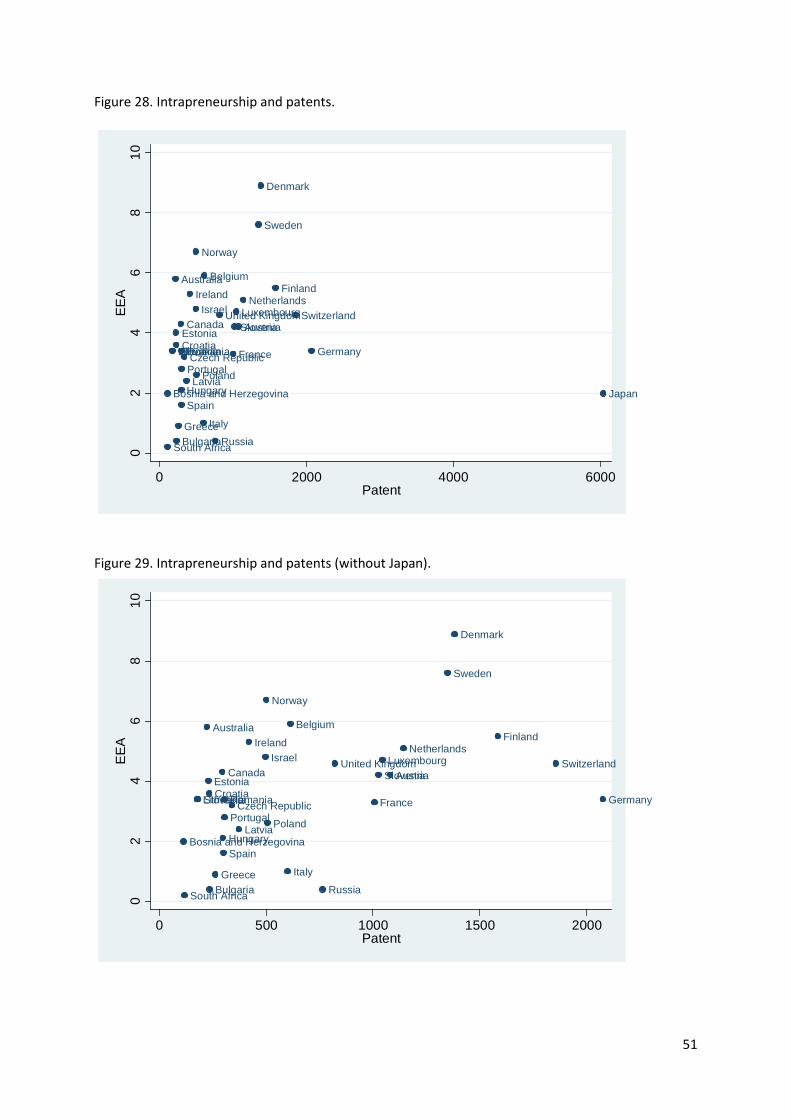
Figure 28. Intrapreneurship and patents.
Figure 29. Intrapreneurship and patents (without Japan).
Australia
Austria
Belgium
Bosnia and Herzegovina
Bulgaria
Canada
CroatiaCzech Republic
Denmark
Estonia
Finland
France Germany
Greece
Hungary
IrelandIsrael
Italy
JapanLatvia
Lithuania
LuxembourgNetherlands
Norway
PolandPortugal
Romania
Russia
Slovakia
Slovenia
South Africa
Spain
Sweden
SwitzerlandUnited Kingdom
02
46
810
EE
A
0 2000 4000 6000Patent
Australia
Austria
Belgium
Bosnia and Herzegovina
Bulgaria
Canada
CroatiaCzech Republic
Denmark
Estonia
Finland
France Germany
Greece
Hungary
IrelandIsrael
Italy
Latvia
Lithuania
LuxembourgNetherlands
Norway
PolandPortugal
Romania
Russia
Slovakia
Slovenia
South Africa
Spain
Sweden
SwitzerlandUnited Kingdom
02
46
810
EE
A
0 500 1000 1500 2000Patent
51

4.3.3 Knowledge capital in Sweden
Sweden has a long tradition of building up the human capital among its population. Already in 1842, Sweden implemented a mandatory primary school for children, and currently Swedish students do not have to pay any tuition fees to study at the domestic universities. Today, about 40 percent of the population (25–64 year) is university-trained (compared with an OECD average of about 34 percent of the population).77 It should, however, be stressed that important human capital from an entrepreneurial point of view is more than formal education.
Historically, Sweden has also been among those countries with the highest level of R&D expenditure as a share of GDP. Even if the Swedish share has decreased somewhat during recent years its share is still higher than in OECD and EU-28 on average (see section 4.3.2).
The largest share (greater than 60 percent) of the R&D in Sweden is financed by private firms. The importance of large corporations in general and the largest multinational corporations in particular is huge. About 80 percent of all private R&D is performed in corporation with at least 250 employees and about half of all private R&D is performed by the 20 largest multinational corporations.
Concerning knowledge workers, it has been shown that the 30 largest companies employ 80 percent of all employees working with R&D, and the 10 largest employ about half. The 20 largest multinational corporations employ two-thirds of the employee within high-tech industry, 40 percent of industry employees with a university degree and 60 percent of the employees with a PhD.78
This structure is an effect of Swedish history which has been dominated by privately owned large corporations within, in particular, technical and research intense industries, together with a high inflow of well-educated people from the publicly financed educational system in combination with well-functioning clusters. No doubt this business structure should influence how entrepreneurial activities manifest itself in Sweden and this is probably one explanation for the high prevalence of intrapreneurship in Sweden. Innovations have been launched mainly by large corporations where intrapreneurship has been an important factor.79
4.4 Final analysis
In section 4 we have, until now, discussed three topics that can explain the prevalence of intrapreneurship in a country―the level of trust, the extent of the welfare state and the level of knowledge. Each of these explanations seems to be part of the story that can explain the high intrapreneurship level in Sweden. Sweden has a high level of trust, an extensive welfare state and a high level of knowledge. However, a complete evaluation should try to analyze all these explanations together in a cross-country regression, as will be done in this section. The data used in this section are presented in Table 13 and the correlation between the variables used is presented in Table 14.
77 The Swedish university systems with no tuition fees have some advantages relative to, e.g., the U.S. system as it makes the best universities affordable irrespective of one’s social background. However, the U.S. university system seems more responsive to the economic needs of society than most universities in Sweden. To justify high tuition fees, students expect a high degree of relevance of the offered curricula. 78 Data in this section is taken from SOU 2016:72 and Anderson et al. (2012). 79 See Grandstrand and Aläng (1995) for a further analysis.
52
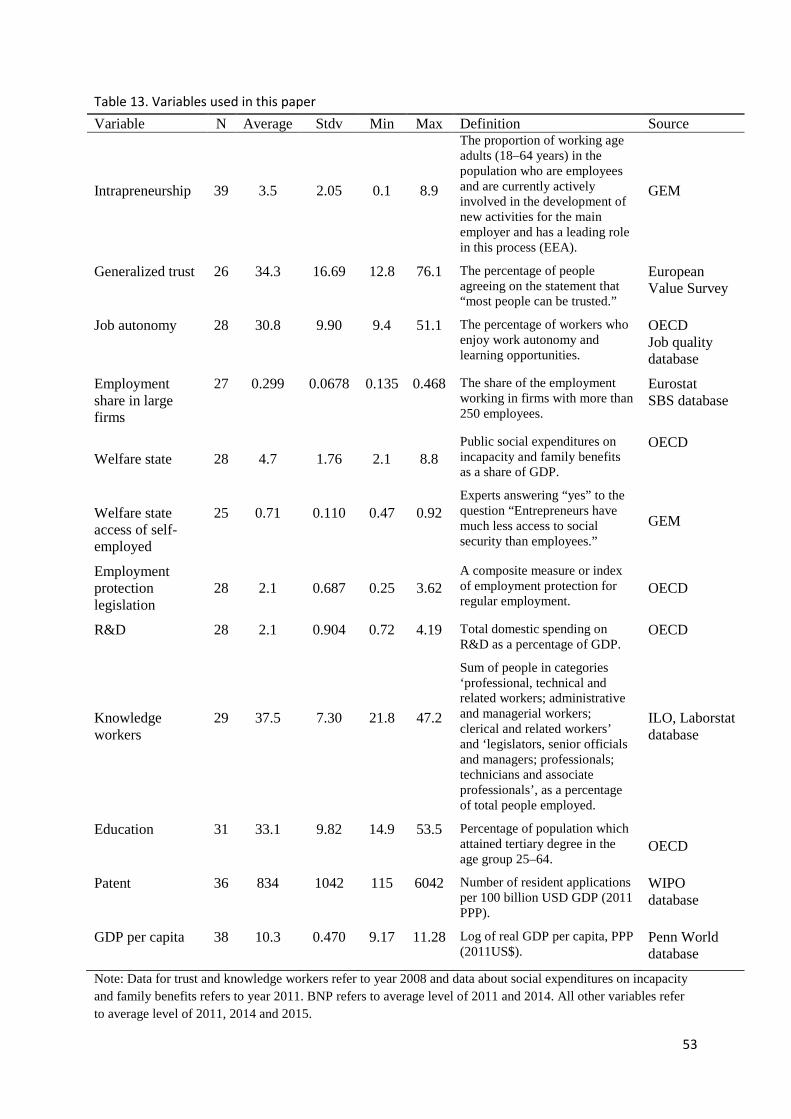
Table 13. Variables used in this paper Variable N Average Stdv Min Max Definition Source
Intrapreneurship
39
3.5
2.05
0.1
8.9
The proportion of working age adults (18–64 years) in the population who are employees and are currently actively involved in the development of new activities for the main employer and has a leading role in this process (EEA).
GEM
Generalized trust 26 34.3 16.69 12.8 76.1 The percentage of people agreeing on the statement that “most people can be trusted.”
European Value Survey
Job autonomy 28 30.8 9.90 9.4 51.1 The percentage of workers who enjoy work autonomy and learning opportunities.
OECD Job quality database
Employment share in large firms
27 0.299 0.0678 0.135 0.468 The share of the employment working in firms with more than 250 employees.
Eurostat SBS database
Welfare state
28
4.7
1.76
2.1
8.8
Public social expenditures on incapacity and family benefits as a share of GDP.
OECD
Welfare state access of self-employed
25
0.71
0.110
0.47
0.92
Experts answering “yes” to the question “Entrepreneurs have much less access to social security than employees.”
GEM
Employment protection legislation
28
2.1
0.687
0.25
3.62
A composite measure or index of employment protection for regular employment.
OECD
R&D 28 2.1 0.904 0.72 4.19 Total domestic spending on R&D as a percentage of GDP.
OECD
Knowledge workers
29
37.5
7.30
21.8
47.2
Sum of people in categories ‘professional, technical and related workers; administrative and managerial workers; clerical and related workers’ and ‘legislators, senior officials and managers; professionals; technicians and associate professionals’, as a percentage of total people employed.
ILO, Laborstat database
Education 31 33.1 9.82 14.9 53.5 Percentage of population which attained tertiary degree in the age group 25–64.
OECD
Patent 36
834 1042 115 6042 Number of resident applications per 100 billion USD GDP (2011 PPP).
WIPO database
GDP per capita 38
10.3 0.470 9.17 11.28 Log of real GDP per capita, PPP (2011US$).
Penn World database
Note: Data for trust and knowledge workers refer to year 2008 and data about social expenditures on incapacity and family benefits refers to year 2011. BNP refers to average level of 2011 and 2014. All other variables refer to average level of 2011, 2014 and 2015.
53

Table 14. Correlation between the variables Intra Trust Auton Large Welfare Access EPL R&D Knowl Educat Patent BNP Intrapreneurship 1.0 Generalized trust 0.7758* 1.0 Job autonomy 0.8774* 0.7972* 1.0 Large firms 0.5614* 0.4512* 0.6151* 1.0 Welfare state 0.7494* 0.7791* 0.6192* 0.6298* 1.0 Welfare access 0.5135 * 0.5373* 0.4787* 0.2908 0.6722* 1.0 EPL -0.1390 0.0052 -0.3055 -0.3045 0.1609 0.0700 1.0 R&D 0.4766* 0.7137* 0.4554* 0.4717* 0.2809 0.4285 -0.0993 1.0 Knowledge workers 0.5803* 0.7137* 0.6610* 0.4122 0.5629* 0.2190 -0.1472 0.5782* 1.0 Education 0.2435 0.5911* 0.5313* 0.4972* 0.1576 0.1912 -0.6658* 0.5131* 0.2795 1.0 Patent 0.1103 0.7070* 0.0349 0.5643* -0.0987 0.2084 -0.1829 0.5343* 0.2721 0.3082 1.0 GDP per capita 0.6682* 0.6631* 0.6195* 0.4512* 0.3942* 0.2153 -0.2111 0.2902 0.6479* 0.3530 0.3518* 1.0 Note: star indicates significance at the 5 percent level.
54

There are, however, some caveats to mention before showing the formal regression analyses. Firstly, it is not self-evident what variables to use. We suspect that trust influences the level of intrapreneurship through its effect on job autonomy and share of employment in large firms. This could be tested by either including trust (the underlying cause) or measures of job autonomy and the share of large firms (the intermediate cause), but not all these variables together in the regression analysis. Further problems concerns causality: the causal relation between many of the variables discussed above probably goes in both directions which makes the regression analysis hard to evaluate. The statistical relationship may be caused by other underlying variables.
There is also correlation between the independent variables used, i.e., there are probably problems with multicollinearity. As can be seen in Table 14, the correlations between some of the independent variables are occasionally high. This implies that there might be problems to find significant effects from specific variables and disentangling separate effect from each explanatory variable, even if the model as a whole including all variables gives a good explanation for the variance of the dependent variable and has a high R2. To mitigate this problem we will regress several different models where some of the most highly correlated variables are dropped. We will also drop the EPL variable and restrict ourselves to three out of the four knowledge measures by dropping the patent variable as these variables, anyhow, have not shown to be an important variable in the sections above.80
A normal procedure when running regressions is to add controls or covariates that may influence the dependent variable (in our case the intrapreneurship level). What and how many controls to add is not self-evident, but from looking at the earlier entrepreneurship literature, one can find dozens of controls or explanatory variables examined. The intrapreneurship literature using regression analyses is much more sparse. One common control (or even explanatory variable) used (and found to be significant) in most regressions is a variable capturing economic development (normally GDP). Hence, we will in the regressions below add GDP per capita as a control variable. Due to the limited dataset and as the effect from many other controls are ambiguous in earlier studies we do not add more controls.
Table 15 shows the outcomes of the regression analysis. The first model includes trust, the welfare state, the three measures of knowledge and GDP as control. Only the welfare state variable is significant (at the 1 percent level) but the R2 is high (above 0.85).81 Probably multicollinearity makes it hard to find significant effects.82 Trust and the extent of the welfare state are highly correlated (see Table 14) and trust might influence the intrapreneurship level through the size of the welfare state (together with job autonomy and extent of large firms). Dropping the welfare state variable and keeping the knowledge variable that correlates most with intrapreneurship gives model 2.83 Trust gives now a significant effect (at the 1 percent level), but still neither the knowledge variable nor GDP are significant in this model (R2 also drops to 0.65). The trust coefficient indicates that if the trust variable increases with ten percentage points, the prevalence of intrapreneurship would increase
80 They are not significant in the regressions we have run, but this is now shown to reduce the number of models presented. The degrees of freedom are also limited as the number of country observations with full data coverage is restricted. 81 If the experts’ variable (welfare state access) is used instead, the result would be the same, i.e., the welfare state variable will be significant but no other variables (not shown). 82 High R2 but no or few significant effects is a clear sign of multicollinerarity. 83 The results will be the same even if knowledge workers or R&D were used instead (not shown).
55

with about 0.8 percentage points (which is a non-negligible effect, given the average intrapreneurship level of 3.5 percent in the sample).84
If we disregard the trust variable and instead use the intermediate variables (job autonomy, large firms and now also the welfare state) that might explain the prevalence of intrapreneurship, we will have model 3. Job autonomy and the welfare state are here statistically significant. The share of large firm is not significant (and point estimate has the wrong sign) and the knowledge variable is still not significant.85 Disregarding the non-significant (and highly correlated) variables gives, finally, model 4 with highly significant effects from job autonomy and the welfare state (and the constant). These two variables explain almost 85 percent of the variation in the intrapreneurship rate among the examined countries.86
The last model implies that an increase of the job autonomy measure with ten percentage points would increase the prevalence of intrapreneurship with 1.3 percentage points, i.e. job autonomy has a huge effect on the intrapreneurship level according to this model.87 A one percentage point increase of the welfare spending on incapacity and parental benefits would increase the prevalence of intrapreneurship with about 0.3 percentage point which also must be considered an economically significant effect.88
The results could be interpreted as if trust indirectly affects the prevalence of intrapreneurship through an increase of the job autonomy in the firms and a more generous welfare state. The knowledge level in the economy (expressed as education, R&D level and share of knowledge workers) has not found any support in this analysis.89 No effect has been found from GDP.90 Hence, according to the regression analysis the high prevalence of intrapreneurship in Sweden is caused indirectly through the high trust level in Sweden in combination with high job autonomy among Swedish workers and an extensive welfare state provided by the Swedish state. Adding a Nordic dummy does not change the significant results and the dummy is not significant (not shown in the table), i.e., it is nothing particular with the Nordic countries that cannot be explained by trust, work autonomy or the welfare state.91
84 The trust coefficient is rather stable and around 0.06–0.08 in the models where it is significant (not shown). 85 If the experts’ variable (welfare state access) is used instead, the result would be the same, i.e., the welfare state and job autonomy variables will be significant but no other variables (not shown). 86 The reader should keep in mind, however, that this regression only includes 26 cross-country observations and the degrees of freedom is low. 87 According to model 3, the effect should be about 0.99 percentage points, i.e., a much lower―but still large―effect. Large instability of the coefficient estimates when dropping/adding variables is often a sign of problems with multicollinearity. 88 Note, however, that there is a problem with the interpretation here as the causality might go in both directions. If the experts’ variable (welfare state access) is used instead, the result would be the same, i.e., job autonomy and the welfare state are highly significant. It is, however, hard to interpret this coefficient. 89 In contrast to Stam (2013). 90 However, in this analysis we have only included developed western countries where the difference in GDP is not that large. If developing countries―with much lower GDP levels and also much lower intrapreneurship levels―had been included there would probably be a positive effect as have been found in other studies. 91 Or to state it more clearly, what is particular with Sweden and the other Nordic countries is the high trust level, the extensive welfare state and the high job autonomy among workers, but nothing otherwise unspecific “fuzzy” about being a Swede or Northerner.
56

Table 15. Regression analyses.
Model 1 EEA
Model 2 EEA
Model 3 EEA
Model 4 EEA
Trust 0.013 (0.48)
0.079 (3.11)***
Job autonomy 0.099 (2.16)*
0.132 (6.58)***
Share large firms -7.07 (-1.75)
Welfare state 0.930 (3.42)***
0.589 (2.78)**
0.338 (2.93)***
R&D 0.06 (0.13)
Knowledge worker 0.021 (0.31)
-0.006 (0.92)
0.034 (0.58)
Education -0.102 (-1.67)
GDP per capita 2.65 (1.53)
0.58 (0.41)
0.38 (0.37)
Constant -26.6 (-1.62)
-4.54 (-0.34)
-4.89 (-0.51)
-1.49 (-2.76)**
R2 0.87 0.65 0.90 0.84 N 17 21 17 26
Note: t-values in parenthesis. Stars indicate significance level at the 1, 5 and 10 percent level.
The analysis above gives support for the idea that institutional differences may be an important element of the Nordic outcome and the high prevalence of intrapreneurship in Sweden, including high levels of generalized trust and a strongly developed social security system favoring wage labor over self-employment.92 This is also in line with Lorenz (2013) who claims that there exists a specific Nordic model of innovation, which favors workplace innovation that is strongly related to intrapreneurship.
To underline the Swedish case, Table 16 shows all explanatory variables and the intrapreneurship level for Sweden together with the average values in the sample. The explanatory variables that have found a significant effect in the regressions are in bold. As can be seen from the table, Sweden scores high on all or most variables and in particular on those variables found significant in the regression analysis.
92 Cf. Braunerhjelm and Henrekson (2013), Henrekson (2005).
57

Table 16. Sweden vs other countries in the sample
Variable Sweden Sample average
Intrapreneurship 7.6 3.5
Generalized trust 70.1 34.3
Job autonomy 51.0 30.8
Employment share in large firms
0.344 0.299
Welfare state 7.9 4.7
Welfare state access 0.92 0.71
Employment protection legislation
2.6 2.1
R&D 3.3 2.1
Knowledge workers 44.5 37.5
Education 35.2 33.1
Patent 1,351 834
It is beyond the scope of this paper to discuss normative questions whether other European countries should increase their prevalence of intrapreneurship and how this, based on the Swedish situation, in that case should be done. One should, however, note that some policies may increase the intrapreneurship level at the expense of the prevalence of independent entrepreneurship while other policies might increase the prevalence of intrapreneurship without necessarily being bad for independent entrepreneurship. Expanding the welfare state in a way that disfavors independent entrepreneurs might, e.g. increase the probability of intrapreneurship at the expense of entrepreneurship. Increasing trust and job autonomy at the work place might increase intrapreneurship activities without necessarily hurting independent entrepreneurs.
58

5. Conclusions
This report set out to explain why the Nordic countries, and Sweden in particular, rank very high with respect to entrepreneurial employee activity, i.e. intrapreneurship. With adding intrapreneurship to the range of entrepreneurship indicators we arrive at a more adequate coverage of entrepreneurial behavior in society than before, when only measures of independent entrepreneurship were taken into account. This―perhaps more adequate―measure of entrepreneurship might also solve another paradox: the Swedish entrepreneurship paradox. Even though Sweden, and other Nordic countries alike, lead global innovation and prosperity rankings, their (independent) entrepreneurship rates are relatively low.
This study suggests that intrapreneurship levels in a country are positively affected by levels of generalized trust, which increase job autonomy and welfare state arrangements for employees that ultimately enhances intrapreneurship. These factors also largely explain the high levels of intrapreneurship in the Nordics and Sweden in particular.
With this in-depth cross country study on intrapreneurship, we have provided an alternative for, or perhaps even improvement of, the debate on the role of independent entrepreneurship in the European economy and beyond.
The welfare implications of this study might be that intrapreneurship is as, or perhaps even more, important as independent entrepreneurship. From an employment point of view, this study shows that the prevalence of job generation oriented intrapreneurs is as high as the prevalence of job generation oriented independent entrepreneurs, with the Nordics, Belgium and the Netherlands showing substantially higher rates of job generation oriented intrapreneurs. From an innovation point of view, investments in knowledge seem to be very strongly related to intrapreneurship, suggesting that intrapreneurship is an important means to turn knowledge into useful applications in society (see also Stam 2013).
The overall relation between intrapreneurship and level of economic development also seems to be positive, in contrast to the (negative) relation between independent entrepreneurship and economic development (see also Bosma et al. 2014). In addition, societies that have high levels of trust breed high levels of job autonomy and a well-developed welfare state, i.e. open societies with respect to participation of its citizens (however sometimes with a bias towards employees over self-employed), which also enhances intrapreneurship. From a societal point of view, it seems that open, knowledge based societies, with a well-developed welfare state provide the best conditions for intrapreneurship, and ultimately prosperity.
59

References
Acs, Zoltan J. (2006). “How is entrepreneurship good for economic growth?” Innovations 1(1), 97–107.
Aghion, Philippe, and Peter Howitt (1992). “A Model of Growth through Creative Destruction.“ Econometrica 60(2), 323–351.
Andersson, Martin, Sten Dieden, and Olof Ejermo (2012). ”Sverige som kunskapsnation – klarar sig näringslivet utan storföretagen?” Globaliseringsforum Rapport #4. Stockholm: Entreprenörskapsforum.
Antoncic, Bostjan (2001). ”Organizational processes in intrapreneurship: a conceptual integration.” Journal of Enterprising Culture 09(02), 221–235.
Antoncic, Bostjan, and Robert D. Hisrich (2001). “Intrapreneurship: Construct refinement and Cross-cultural Validation.” Journal of Business Venturing 16(5), 495–527.
Bager, Torben, and Thomas Schøtt (2011). “Entrepreneurial Work by Employees and Independent Entrepreneurs: Understanding Nordic, Anglo-Saxon and Continental Countries.“ In Entrepreneurial Work by Employees in Enterprises – studied via Global Entrepreneurship Monitor in Denmark 2011. University of Southern Denmark and GEM: Kolding, Denmark.
Baker, George, Robert Gibbons, and Kevin J. Murphy (2002). “Relational Contracts and the Theory of the Firm.” Quarterly Journal of Economics 117(1), 39–84.
Baumol, William J. (1990). “Entrepreneurship: Productive, Unproductive, and Destructive.” Journal of Political Economy 98(5), 893–921.
Berggren, Niclas, Mikael Elinder, and Henrik Jordahl (2008). “Trust and Growth: A Shaky Relationship.” Empirical Economics 35(2), 251–274.
Bergh, Andreas, and Christian Bjørnskov (2011). ”Historical Trust Levels Predict the Current Size of the Welfare State.” Kyklos 64(1), 1–19.
Bergh, Andreas, and Christian Bjørnskov (2014). “Trust, Welfare States and Income Equality: Sorting out the Causality.” European Journal of Political Economy 35(C): 183–199.
Beugelsdijk, Sjoerd, Henri L. De Groot and Anton B. van Schaik (2004). ”Trust and Economic Growth: A Robustness Analysis.” Oxford economic papers 56(1), 118–134.
Bjørnskov, Christian (2006). “Determinants of Generalized Trust: A Cross-Country Comparison.” Public Choice 130(1), 1–21.
Bjørnskov, Christian (2012). “How does Social Trust Affect Economic Growth?” Southern Economic Journal 78(4), 1346–1368.
Bosma, Niels S., Erik Stam, and Sander Wennekers (2010). ”Intrapreneurship–An international Study.” EIM research report H201005. Zoetermeer: EIM.
60
Bosma, Niels S., Erik Stam, and Sander Wennekers (2011). ”Intrapreneurship versus Independent Entrepreneurship: A Cross-national Analysis of Individual Entrepreneurial Behavior.” Utrecht School of Economics Tjalling C. Koopmans Research Institute Discussion Paper Series 11–04.
Bosma, Niels S., Erik Stam, and Sander Wennekers (2012). “Entrepreneurial Employee Activity: A Large Scale International Study.” Utrecht School of Economics Tjalling C. Koopmans Research Institute Discussion Paper Series 12-12.
Bosma, Niels S., Sander Wennekers, Maribel Guerrero, José Ernesto Amorós, Aloña Martiarena, and Slavica Singer (2013). “The Global Entrepreneurship Monitor. Special Report on Entrepreneurial Employee Activity.” London: GEM.
Bosma, Niels S., Erik Stam, and Sander Wennekers (2016). “Institutions, Contracts and the Allocation of Entrepreneurship in Society.” Mimeo.
Braunerhjelm, Pontus, and Magnus Henrekson (2013). “Entrepreneurship, institutions, and Economic Dynamism: Lessons from a Comparison of the United States and Sweden.” Industrial and Corporate Change 22(1), 107–130.
Braunerhjelm, Pontus, Johan P. Larsson, Per Thulin, and Ylva Skoogberg (2016). “Intrapreneurs–Entrepreneurial Employees.” In The Entrepreneurial Challenge – A Comparative Study of Entrepreneurial Dynamics in China, Europe and the US. Stockholm: GEM and Entreprenörskapsforum.
Chung, Lai Hong, and Patrick T. Gibbons (1997). “Corporate Entrepreneurship: The Roles of Ideology and Social Capital.” Group and Organization Management 22(1), 10–30.
Delhey, Jan, and Kenneth Newton (2005). “Predicting Cross-National Levels of Social Trust: Global Pattern or Nordic Exceptionalism?” European Sociological Review 21(4), 311–327.
Esping-Andersen, Gøsta (1990). “The Three Worlds of Welfare Capitalism.” Princeton: Princeton University Press.
Folta, Timothy B., Frédéric Delmar, and Karl Wennberg (2010). “Hybrid entrepreneurship. “ Management Science 56(2), 253–269.
Foss, Kirsten, Nicolai J. Foss, Peter G. Klein, and Sandra K. Klein (2007). “The Entrepreneurial Organization of Heterogeneous Capital.” Journal of Management Studies 44(7), 1165–1186.
Foss, Kirsten, Nicolai J. Foss, and Peter G. Klein (2007). “Original and Derived Judgment: An Entrepreneurial Theory of Economic Organization.” Organization Studies 28(12), 1893–1912.
Gilson, R. J. (2010). Locating Innovation: The Endogeneity of Technology, Organizational Structure, and Financial Contracting. Columbia Law Review, 885-917.
Glaeser, Edward L., David Laibson, and Bruce Sacerdote (2002). “The Economic Approach to Social Capital.” Economic Journal 112(November), 437–458.
Granstrand, Ove, and Sverker Alänge (1995). “The Evolution of Corporate Entrepreneurship in Swedish Industry – Was Schumpeter Wrong?” Journal of Evolutionary Economics 5(2), 133–156.
61

Guiso, Luigi, Paola Sapienza, and Luigi Zingales (2006). “Does Culture Affect Economic Outcomes?” Journal of Economic Perspectives 20(2), 23–48.
Hall, Peter A., and David Soskice (2001). “Varieties of Capitalism: the Institutional Foundations of Comparative Advantage.” Oxford: Oxford University Press.
Haltiwanger, John C., Ron S. Jarmin, and Javier Miranda (2013). “Who creates jobs? Small versus large versus young.” Review of Economics and Statistics 95(2), 347–361.
Hardin, Russell (1996). “Trustworthiness.” Ethics 107(1), 26–42.
Henrekson, Magnus (2005). “Entrepreneurship: A Weak Link in the Welfare State?” Industrial and Corporate Change 14(3), 437–467.
Henrekson, Magnus, and Mikael Stenkula (2016). “Understanding Entrepreneurship. Definition, Function and Policy.” Lund: Studentlitteratur.
Holcombe, Randall G. (1998). “Entrepreneurship and Economic Growth.” Quarterly Journal of Austrian Economics 1(2), 45–62.
Holcombe, Randall G. (2003). “The Origins of Entrepreneurial Opportunities.” Review of Austrian Economics 16(1), 25–43.
Jones, Charles J., and Paul M. Romer (2010). “The New Kaldor Facts: Ideas, Institutions, Population, and Human Capital.” American Economic Journal: Macroeconomics 2(1), 224–245.
Klein, Peter G. (2008). “Opportunity Discovery, Entrepreneurial Action, and Economic Organization.” Strategic Entrepreneurship Journal 2(3), 175–190.
Kogut, Bruce, and Udo Zander (1992). “Knowledge of the Firm, Combinative Capabilities, and the Replication of Technology.” Organization Science 3(3), 383–397.
Kumlin, Staffan, and Bo Rothstein (2005). “Making and Breaking Social Capital: The Impact of Welfare-State Institutions.” Comparative Political Studies 38(4), 339–365.
Kwon, Seok-Woo, Colleen Heflin, and Martin Ruef (2013). “Community Social Capital and Entrepreneurship.” American Sociological Review 78(6), 980–1008.
Liebregts, Werner, Paul Preenen, and Steven Dhondt (2015). ”Niet iedere werknemer is een intrapreneur.” Economisch Statistische Berichten 100(4706), 180–181.
Liebregts, Werner, and Erik Stam (2016). “Employment Protection and Entrepreneurship. Unpacking the Effects of Employment Protection Legislation on the Allocation of Entrepreneurial Activity in society.” Utrecht School of Economics Tjalling C. Koopmans Research Institute Discussion Paper Series 16-08.
Lindbeck, Assar (1997). “The Swedish Experiment.” Journal of Economic Literature 35(3), 1273–1319.
Lorenz, Edward (2013). “Innovation, Work Organization, and Systems of Social Protection.” In Fagerberg, Jan, Ben R. Martin, and Esben S. Andersen, eds., Innovation Studies: Evolution and Future Challenges. Oxford: Oxford University Press, 71–89.
62
Luchsinger, Vince, and Ray Bagby (1987). “Entrepreneurship and Intrapreneurship: Behaviors, Comparisons, and Contrasts.” SAM Advanced Management Journal 42(3), 10–13.
Macneil, Ian R. (1978). “Contracts: Adjustments of Long-term Economic Relations under Classical, Neoclassical, and Relational Contract Law.” Northwestern University Law Review 72, 854–906.
Mayer, Roger C., James H. Davis, and David Schoorman (1995). “An Integrative Model of Organizational Trust.” Academy of Management Review 20(3), 709–734.
Martiarena, Aloña (2013). “What’s Entrepreneurial about Intrapreneurs?” Small Business Economics 40(1), 27–39.
Morris, Michael H., and Donald F. Kuratko, D. (2002). “Corporate Entrepreneurship–Entrepreneurial Development within Organizations.” Fort Worth, TX: Harcourt.
Nelson, Richard R., and Sidney G. Winter (1982). “An Evolutionary Theory of Economic Change.” Carmbridge, MA: Cambridge University Press.
Nyström, Kristina (2012). “Entrepreneurial Employees: Are They Different from Independent Entrepreneurs?” Swedish Entrepreneurship Forum Working paper 2012:10.
Román, Concepción, Emilio Congregado, and José María Millán (2011). “Dependent Self-Employment as a Way to Evade Employment Protection Legislation.” Small Business Economics 37(3), 363–392.
Rose, David C. (2012). “The Moral Foundation of Economic Behavior.” Oxford University Press: Oxford.
Rosenberg, Nathan, and L. E. Birdzell (1986). “How the West grew rich. Economic transformation of the industrial world.” I.B.Tauris.
Santarelli, Enrico, and Marco Vivarelli (2007). “Entrepreneurship and the process of firms’ entry, survival and growth.” Industrial and Corporate Change 16(3), 455–488.
Schumpeter, Joseph A. (1934). “Theory of Economic Development .” London: Transaction publisher.
Sharma, Pramodita, and James J. Chrisman (1999). “Toward a Reconciliation of the Definitional Issues in the Field of Corporate Entrepreneurship.” Entrepreneurship: Theory & Practice 23(3), 11–27.
Sianesi, Barbara, and John van Reenen (2003). “The Returns to Education: Macroeconomics.” Journal of Economic Surveys 17(2), 157–200.
Sobel, Joel (2002). “Can We Trust Social Capital?” Journal of Economic Literature 40(1), 139–154.
SOU 2016:72. “Entreprenörskap i det tjugoförsta århundradet.” Betänkande av Entreprenörskaps-utredningen. Wolters Kluwers: Stockholm.
Stam, Erik (2008). “Entrepreneurship and Innovation Policy.” In Nooteboom, Bart, and Erik Stam, eds., Micro-Foundations for Innovation Policy. Amsterdam/Chicago: Amsterdam University Press/Chicago University Press, 135–172.
63

Stam, Erik (2013). “Knowledge and Entrepreneurial Employees: A Country Level Analysis.” Small Business Economics 41(4), 887–898.
Stam, Erik, Niels Bosma, Arjen van Witteloostuijn, Jeroen De Jong, Sandy Bogaert, Nancy Edwards, and Ferdinand Jaspers (2012). “Ambitious Entrepreneurship. A Review of the Academic Literature and New Directions for Public Policy.” Den Haag: Adviesraad voor het Wetenschapsen Technologiebeleid.
Stam, Erik, A. Roy Thurik, and Peter van der Zwan (2010). “Entrepreneurial Exit in Real and Imagined Markets.” Industrial and Corporate Change 19 (4), 1109–1139.
Stam, Erik, and André van Stel (2011). “Types of entrepreneurship and economic growth.” Entrepreneurship, innovation, and economic development, 78–95.
Stull, Mike, and John D. Arm (2010). “Exploring Trust as an Influencing Mechanism of Intrapreneurship.” International Journal of Management and Marketing Research 3(3), 17–38.
Teece, David J. (2009). “Dynamic Capabilities and Strategic Management. Organizing for Innovation and Growth.” Oxford: Oxford University Press.
Uslaner, Eric M. (2002). “The Moral Foundations of Trust.” Cambridge, UK: Cambridge University Press.
Uslaner, Eric M. (2008). “The Foundations of Trust: Macro and Micro.” Cambridge Journal of Economics 32(2), 289–294.
van Stel, Adriaan J., and David J. Storey (2004). “The link between firm births and job creation: Is there a Upas tree effect?” Regional Studies 38(8), 893–909.
van Stel, André, Martin Carree, and A. Roy Thurik (2005). “The effect of entrepreneurial activity on national economic growth.” Small business economics 24(3), 311–321.
Websters' New World Dictionary (1953). Cleveland, OH: World Publishing Company.
Welter, Friederike (2012). “All You Need is Trust? A Critical Review of the Trust and Entrepreneurship Literature.” International Small Business Journal 30(3), 193–212.
Wennekers, Sander, and A. Roy Thurik (1999). “Linking Entrepreneurship and Economic Growth.” Small Business Economics 13(1), 27–56.
Zahra, Shaker A. (1991). “Predictors and Financial Outcomes of Corporate Entrepreneurship: An Exploratory Study.” Journal of Business Venturing 6(4), 259–285.
Zak, Paul J., and Stephen Knack (2001). “Trust and Growth.” Economic Journal 111(470), 295–331.
64

Appendix
Table 4. TEA and EEA levels Country EEA TEA Intrapreneurship
share Australia 5.8 12.1 32.3 Austria 4.2 8.7 32.8 Belgium 5.9 5.8 50.3 Bosnia and Herzegovina 2.0 7.8 20.6 Bulgaria 0.4 3.5 9.2 Canada 4.3 13.9 23.6 Croatia 3.6 7.7 32.1 Czech Republic 3.2 7.6 29.4 Denmark 8.9 5.0 63.8 Estonia 4.0 11.3 26.4 Finland 5.5 6.2 47.0 France 3.3 5.5 37.2 Germany 3.4 5.2 39.8 Greece 0.9 7.5 10.9 Hungary 2.1 7.9 20.9 Ireland 5.3 7.7 40.9 Israel 4.8 11.8 28.7 Italy 1.0 4.6 17.4 Japan 2.0 4.5 30.7 Korea Rep. 2.3 8.5 21.2 Kosovo 0.1 4.0 2.6 Latvia 2.4 13.0 15.4 Lithuania 3.4 11.3 22.9 Luxembourg 4.7 8.7 35.4 Macedonia 1.6 6.1 20.2 Netherlands 5.1 8.3 37.9 Norway 6.7 5.7 54.1 Poland 2.6 9.1 22.3 Portugal 2.8 9.0 23.5 Romania 3.4 10.7 24.3 Russia 0.4 4.6 7.9 Slovakia 3.4 11.6 22.6 Slovenia 4.2 5.3 43.9 South Africa 0.2 8.4 2.6 Spain 1.6 5.7 22.4 Sweden 7.6 6.6 53.7 Switzerland 4.6 7.0 39.4 United Kingdom 4.6 8.3 35.5 United States 5.2 12.7 29.2 Average 3.5 7.9 30.8
Note: EEA and TEA refers to average rates of 2011, 2014 and 2015 year’s values. Intrapreneurship share is defined as intrapreneurship level as a share of the sum of entrepreneurship and intrapreneurship level.
65

Table 6. Growth expectation intrapreneurship and entrepreneurship Country
EEA_MH
Share of EEA
TEA_MH
Share of TEA Intrapreneurship
share Australia 3.4 68.9 4.2 39.7 45.1 Austria n.a. n.a. n.a. n.a. n.a. Belgium 5.2 61.3 0.9 16.3 85.0 Bosnia and Herzegovina 2.1 91.2 2.4 29.9 46.4 Bulgaria n.a. n.a. n.a. n.a. n.a. Canada n.a. n.a. n.a. n.a. n.a. Croatia 2.5 66.7 2.5 33.8 50.1 Czech Republic 1.7 53.3 3.0 38.8 36.4 Denmark 5.6 60.7 1.1 24.1 83.4 Estonia n.a. n.a. n.a. n.a. n.a. Finland 4.7 59.1 1.1 17.7 81.0 France 2.7 69.8 1.8 32.0 59.8 Germany 1.9 53.5 1.3 22.4 60.0 Greece 0.7 57.4 1.2 15.2 37.4 Hungary 1.6 59.0 2.4 38.4 39.0 Ireland 3.4 73.6 2.9 39.7 54.1 Israel n.a. n.a. n.a. n.a. n.a. Italy n.a. n.a. n.a. n.a. n.a. Japan 2.0 63.4 1.3 25.5 59.7 Korea Rep. 1.7 70.2 1.8 23.4 47.8 Kosovo n.a. n.a. n.a. n.a. n.a. Latvia 1.5 67.0 5.6 47.4 20.8 Lithuania 2.7 80.4 4.2 37.4 39.1 Luxembourg n.a. n.a. n.a. n.a. n.a. Macedonia n.a. n.a. n.a. n.a. n.a. Netherlands 4.0 70.8 1.8 22.0 68.7 Norway n.a. n.a. n.a. n.a. n.a. Poland 1.1 48.2 3.9 43.0 22.3 Portugal 1.3 51.1 1.5 20.3 46.6 Romania 2.1 70.8 4.5 45.1 32.1 Russia 0.2 47.7 1.6 33.8 11.9 Slovakia 1.6 59.9 4.4 30.8 27.2 Slovenia 2.5 62.3 1.6 44.0 60.9 South Africa 0.2 57.7 2.6 28.3 6.7 Spain 1.3 50.9 1.2 21.3 50.4 Sweden 9.5 70.7 1.5 26.4 86.2 Switzerland 1.6 49.3 1.1 16.0 60.6 United Kingdom 2.9 66.8 2.0 27.4 58.8 United States 3.7 70.1 4.0 32.5 48.0 Average 2.6 64.6 2.4 31.1 52.1 Note: Refers to year 2011. Share of EEA refers to EEA_MH/EEA. Share of TEA refers to TEA_MH/TEA. Intrapreneurship share is defined as growth expectation intrapreneurship level as a share of the sum of growth expectation entrepreneurship and intrapreneurship level, i.e. as EEA_MH/(EEA_MH+TEA_MH).
66