
INTRADAY STEALTH TRADING: WHICH TRADES MOVE PRICES …faculty.bus.olemiss.edu/rvanness/Accepted...
21
The Journal of Financial Research • Vol. XXXII, No. 1 • Pages 1–21 • Spring 2009 INTRADAY STEALTH TRADING: WHICH TRADES MOVE PRICES DURING PERIODS OF HIGH VOLUME? Benjamin M. Blau Utah State University Bonnie F. Van Ness and Robert A. Van Ness University of Mississippi Abstract Research documents a U-shaped intraday pattern of returns. We examine which trade sizes drive the U-shaped pattern and find that intraday price changes from larger trades exhibit a U-shaped pattern whereas price changes from smaller trades show a reverse U-shaped pattern. We argue that price changes from smaller trades are higher during the middle of the day because informed investors break up their trades to disguise their information when intraday volume is low. Price changes from larger trades are likely higher at the beginning and end of the day because high volume allows informed investors to increase their trade size without revealing their information to the market. JEL Classification: G1, G14 I. Introduction Research finds a peculiar intraday U-shaped pattern in returns (Wood, McInish, and Ord 1985; Harris 1986) as well as a U-shaped pattern in volume and the number of trades (Jain and Joh 1988; Chan, Christie, and Schultz 1995; Chung, Van Ness, and Van Ness 1999). The literature provides several explanations for these persistent patterns. Copeland (1976, 1977) shows in theory that the arrival of sequential information is disseminated to only one trader at a time, which suggests a positive correlation between volume and prices changes. Admati and Pfleiderer (1988) predict that informed trading occurs during periods of high liquidity volume, thus partially explaining the U-shaped patterns in price changes and higher volume. Foster and Viswanathan (1993) show that asymmetric information is higher at the beginning and end of the day, which supports the prediction of Admati and Pfleiderer. The theory of Kyle (1985) posits that informed traders earn more profit when engaging in dynamic trading strategies or spreading their trades over time. Evidence of the stealth trading hypothesis, which posits that informed investors break up their trades into smaller trades to hide their information, is found by 1
Transcript of INTRADAY STEALTH TRADING: WHICH TRADES MOVE PRICES …faculty.bus.olemiss.edu/rvanness/Accepted...
The Journal of Financial Research • Vol. XXXII, No. 1 • Pages 1–21 • Spring 2009
INTRADAY STEALTH TRADING: WHICH TRADES MOVEPRICES DURING PERIODS OF HIGH VOLUME?
Benjamin M. BlauUtah State University
Bonnie F. Van Ness and Robert A. Van NessUniversity of Mississippi
Abstract
Research documents a U-shaped intraday pattern of returns. We examine whichtrade sizes drive the U-shaped pattern and find that intraday price changes fromlarger trades exhibit a U-shaped pattern whereas price changes from smaller tradesshow a reverse U-shaped pattern. We argue that price changes from smaller tradesare higher during the middle of the day because informed investors break up theirtrades to disguise their information when intraday volume is low. Price changesfrom larger trades are likely higher at the beginning and end of the day because highvolume allows informed investors to increase their trade size without revealingtheir information to the market.
JEL Classification: G1, G14
I. Introduction
Research finds a peculiar intraday U-shaped pattern in returns (Wood, McInish, andOrd 1985; Harris 1986) as well as a U-shaped pattern in volume and the number oftrades (Jain and Joh 1988; Chan, Christie, and Schultz 1995; Chung, Van Ness, andVan Ness 1999). The literature provides several explanations for these persistentpatterns. Copeland (1976, 1977) shows in theory that the arrival of sequentialinformation is disseminated to only one trader at a time, which suggests a positivecorrelation between volume and prices changes. Admati and Pfleiderer (1988)predict that informed trading occurs during periods of high liquidity volume, thuspartially explaining the U-shaped patterns in price changes and higher volume.Foster and Viswanathan (1993) show that asymmetric information is higher atthe beginning and end of the day, which supports the prediction of Admati andPfleiderer.
The theory of Kyle (1985) posits that informed traders earn more profitwhen engaging in dynamic trading strategies or spreading their trades over time.Evidence of the stealth trading hypothesis, which posits that informed investorsbreak up their trades into smaller trades to hide their information, is found by
1
2 The Journal of Financial Research
Barclay and Warner (1993), Chakravarty (2001), and Hansch and Choe (2007).Together with the ex ante theories explaining the intraday pattern of returns andtrading activity, stealth trading suggests that smaller trades will move prices whenvolume is low because informed traders do not want to reveal their information to themarket. During periods of high volume, informed traders are able to increase theirtrade sizes because high volume provides a sufficient disguise for their information.
When examining intraday price changes of different trade sizes, we findthat, indeed, price changes from larger trades exhibit a U-shaped intraday patternwhereas price changes from smaller trades typically show a reverse U-shaped in-traday pattern. Our results are robust to trading during different tick-size regimes.We interpret these findings to be consistent with our conjecture that periods of highvolume at the beginning and end of the day motivate informed traders to use largersizes because higher volume disguises their information. We argue that when vol-ume is low during the middle of the day, smaller trades move prices more becauseinformed traders are breaking up their trades to hide their information.
Karpoff (1987) surveys the evidence that reports a positive relation betweenvolume and price changes and presents a simple model that shows that volume willbe directly related to positive price changes. When further examining the relationbetween volume and price changes, we find that the relation is increasing acrosstrade sizes. These results suggest that when volume is high, larger trades moveprices more than smaller trades, which is consistent with our argument that informedtraders can use larger trade sizes during periods of higher volume without revealingtheir information to the market.
Our findings present new evidence that the familiar U-shaped pattern inintraday returns is driven by larger trades. Combined with the other documentedU-shaped patterns in volume and number of trades, our results support the notionthat stealth trading occurs less frequently during periods of high trading activitybecause informed investors can reduce the time and cost of breaking up their tradesand execute larger trades without revealing their information to other sophisticatedtraders.
II. Prior Literature
Kyle’s (1985) theoretical model describes the behavior of insider (informed) tradersin a single auction and a continuous auction setting and predicts that prices haveconstant volatility over time, suggesting that information is gradually incorporatedinto prices. By the end of trading, prices converge to their true value, or the valuethat reflects all relevant information.1 The equilibrium property that we are most
1The efficient market condition requires normality and martingale properties for price movements.Kyle (1985) notes that prices will follow a Brownian motion process with instantaneous variance.
Intraday Stealth Trading 3
interested in is that informed investors will earn greater profit in the continuousauction than in the single auction. That is, informed investors maximize profits bystrategically trading in a dynamic context.
Wood, McInish, and Ord (1985) document a U-shaped intraday patternin returns and standard deviation of returns, and Jain and Joh (1988) and Chan,Christie, and Schultz (1995) find that volume and the number of trades have aU-shaped intraday pattern. In attempt to explain the intraday pattern of tradingactivity and returns, Admati and Pfleiderer (1988) present a model that describes thebehavior of liquidity traders and informed traders and the discretion over when theytrade. For instance, liquidity traders prefer to trade when trading has little effect onprices. Admati and Pfleiderer argue that this intuition suggests that liquidity tradersmay have an incentive to trade together. In equilibrium, informed trading will bemore prevalent during periods of concentrated liquidity volume. Furthermore, themodel predicts that prices will be more informative in periods of high liquidityvolume because more traders become privately informed if information acquisitionis endogenous.
Consistent with Admati and Pfleiderer (1988), Back and Pedersen (1998)show that volatility follows the same pattern as liquidity volume, and Foster andViswanathan (1993) find that adverse selection costs are higher during the beginningof the day, suggesting that informed trading occurs during the first few hours ofthe trading day. Our objective is to examine which trade sizes drive the U-shapedpattern in intraday returns.
The theory behind the Admati and Pfleiderer (1988) model and the Kyle(1985) model provides the framework for the stealth trading hypothesis. Barclayand Warner (1993) suggest that although the theories of Kyle and of Admati andPfleiderer predict informed investors attempt to camouflage their trades by spread-ing them over time or trading during periods of high volume, theories regardinginformed trading strategies ignore the possibility that informed investors break uplarger trades into smaller trades so as to not reveal their information.2 Barclay andWarner’s original stealth trading hypothesis posits that if informed investors breakup their trades into smaller trade sizes, most of the cumulative price change shouldoccur in medium-sized trades—not too large to reveal information and not too smallbecause of transaction costs. Barclay and Warner test the stealth trading hypothesisby examining 105 NYSE stocks that were tender offer targets in the early 1980s.Consistent with their hypothesis, they find that more than 92% of the cumulativeprice change occurs in medium-sized trades.
Chakravarty (2001) further investigates the stealth trading hypothesis bydistinguishing between institutional and individual traders. Chakravarty’s investi-gation is motivated by several studies that show that institutions are more informed
2Hasbrouck (1988) argues that “large” trades will contain information; therefore, stealth trading sug-gests that informed traders will break up “large” trades into smaller trades in attempt to hide their information.

4 The Journal of Financial Research
than individuals (Lo and MacKinlay 1990; Cornell and Sirri 1992; Chakravartyand McConnell 1997, 1999). Using a sample of 97 NYSE-listed stocks that ex-perience at least a 5% stock price increase, Chakravarty finds that nearly 80%of the cumulative price change occurs from medium-sized trades (500 to 9,999shares) by institutions.3 Furthermore, he finds that individuals make up very littleof the cumulative price change. The findings of his analysis suggest that medium-sized institutional trades are driving the evidence supporting the stealth tradinghypothesis.
In their investigation into trade size clustering, Alexander and Peterson(2007) find that trades cluster on rounded sizes that are multiples of 500, 1,000,and 5,000 shares. They find that rounded trades move prices more than unroundedtrades, medium-sized rounded trades in particular move prices more than othertrades. Alexander and Peterson argue that these trades are likely being executedby stealth traders. To overcome the potential that trade sizes and order sizes aredifferent, Alexander and Peterson use data on orders as well as trades and find theresults to be qualitatively similar.
Both Barclay and Warner (1993) and Chakravarty (2001) use data fromthe 1/8th tick-size environment.4 Larger transaction costs may persuade informedinvestors to execute medium-sized trades as opposed to small trades. Hansch andChoe (2007) provide a thorough investigation of the stealth trading hypothesis from1993 to 2003 and find that the distribution of informed trades shifts from medium-sized trades to small trades around 2000. They argue that part of the distributionalshift is due to increased information access in the Internet age, but most of the shiftis likely due to a decrease in transaction costs. Hvidkjaer (2006) finds that smallsell trades by individuals outperform small buy trades by individuals, suggestingthat stocks favored by individuals become overvalued and underperform stocksthat are not favored by individuals. Hvidkjaer’s findings suggest that individualsare relatively uninformed and add to the conclusion of Hansch and Choe that insti-tutional investors are breaking trades into small sizes to disguise their informationin the decimal tick-size environment. As transaction costs have declined, so has thelower bound on the size of stealth trades. Therefore, we anticipate finding, similarto Hansch and Choe, that most of the cumulative price change occurs in small(medium-sized) trades using data from 2005 (1995 and 1998).
Hasbrouck (1988) suggests that trade sizes provide important insights intothe behavior of informed investors. We attempt to combine the theoretical predic-tions of Kyle (1985) and Admati and Pfleiderer (1988) with the stealth trading
3Chakravarty (2001) argues that stocks with at least a 5% price increase will provide a higher probabilityof detecting stealth trading.
4Alexander and Peterson (2007) use TORQ data from 1991 and TAQ data from 1995, 1998, and 2002to control for the tick size changes. They find that the price impact of medium-sized trades is larger thanthe price impact of small trades for a sample of stocks in 2002 (which is during the decimalization period).

Intraday Stealth Trading 5
framework to determine which trades sizes move prices during the intraday. AsKyle argues, profit-maximizing, informed investors will choose an optimal trad-ing strategy while accounting for time, which implies that informed investors mayspread trades over time. Admati and Pfleiderer suggest that informed investorswill trade during periods of high volume, not only because they wish to hide theirinformation but also because markets are “thick,” meaning their trades will not sub-stantially move prices. Combining the theoretical predictions of Kyle and Admatiand Pfleiderer, we expect that informed investors will execute larger trades duringperiods of high volume and break up their trades during periods of low volume.
III. Data Description
Similar to Chakravarty (2001), we use a sample of NYSE-listed stocks for 64 tradingdays in three years. Following tests of stealth trading by Alexander and Peterson(2007), we use three periods to compensate for different tick-size environments. In1995 and 1998, stocks were traded in 1/8ths and 1/16ths, respectively. Since 2001,stocks trade in decimals.5 To account for the different tick-size environments, weexamine the second quarter (April 1 to June 30) of 1995, 1998, and 2005 and usethe 200 most active (in terms of average daily volume) NYSE stocks for the secondquarter of 1995, 1998, and 2005 (as long as the price is at least $5).
We obtain trade data from the Trades and Quotes (TAQ) database. Weseparate trades into trade size categories following Barclay and Warner (1993),Chakravarty (2001), Alexander and Peterson (2007), and Hansch and Choe (2007).Small trades are trades of 100–499 shares, medium trades are 500–9,999 shares, andlarge trades are greater than or equal to 10,000 shares. We also define finer mediumtrade-size categories similar to past research. Medium–low trades are trades of 500–1,999 shares, medium–mid trades are 2,000–5,999 shares, and medium–high tradesare 6,000–9,999 shares. We break up the trading day into seven intervals.
We recognize an important limitation in our ability to test the stealth tradinghypothesis during the intraday. Our preference is to use order data rather than tradedata because of the possibility that orders are split and that the true trade size choiceof the investor is not reflected in the trade size. However, we are unable to obtainorder data and make the assumption that larger trades at the beginning and end ofthe trading day are highly correlated with larger orders. Alexander and Peterson(2007) use TORQ data from 1991, which is the only publicly available database
5Barclay and Warner (1993) argue that informed investors will break up larger trades into medium-sized trades to avoid revealing their information and redundant transaction costs. Hansch and Choe (2007)find that around the time of decimalization, the distribution of informed trades shifts from medium-sizedtrades to small trades. They argue that although some of the shift is caused by individual investors beingbetter able to obtain information in the information age, most of the distributional shift is likely frominstitutional investors breaking up trades into small sizes to avoid revealing their information.

6 The Journal of Financial Research
that consists of both orders and trades. They look for differences in trades andorders and argue, “If [no noticeable differences] are observed, then trade-size resultsusing samples from larger and more recent TAQ data are likely applicable to orders”(p. 438). After examining TORQ data, they find that trade sizes are not significantlydifferent from order sizes and the results appear robust for all trade-size categories.Therefore, they argue that using trade data instead of order data does not bias theirresults.
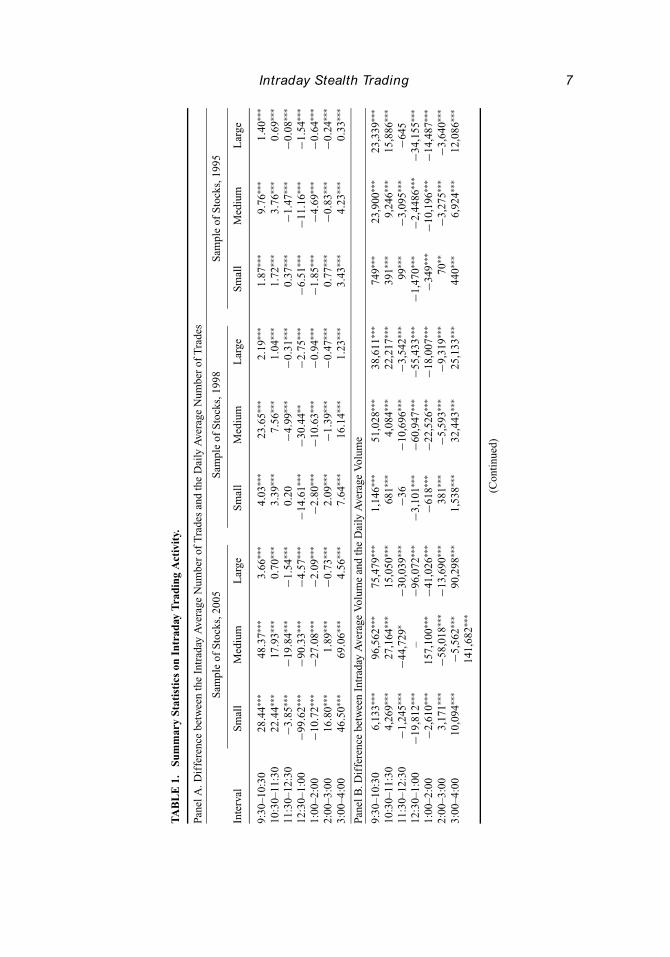
Table 1 presents an initial test of the U-shaped intraday pattern of tradingactivity for each subsample. Panel A shows the difference between the number oftrades in each intraday interval and the intraday mean for small, medium, and largetrades in each tick-size regime. Similar to Chan, Christie, and Schultz (1995), wefind a U-shaped pattern in the number of trades. Panel B examines the intradaypattern of volume for each trade size and shows that intraday volume for each tradesize is U-shaped. Panels C and D report the results for the different medium trade-size categories. The U-shaped pattern is generally found in the number of tradesand intraday volume across the subsamples. The medium–high trade-size categorydoes not exhibit a U-shaped pattern in volume for the 1998 and 1995 subsamples.
IV. Methods and Empirical Results
Methods
To determine which trade size drives the U-shaped intraday pattern in returns, wefollow the methods of Barclay and Warner (1993), Chakravarty (2001), and Huang(2002). The weighted price contribution (WPC) for each trade size in each intervalis estimated to capture the contribution to a stock’s price change by trades classifiedin specific trade sizes. We first define the price change as the difference between thecurrent trade price and the price at the last trade. We calculate the cumulative pricechange by summing all price changes that occur in a given trade-size category foreach stock over the sample of observations. We divide this sum by the cumulativeprice change for each stock and then estimate the weighted cross-sectional meanof the cumulative price change where the weights are the absolute value of thecumulative price change for each stock over the sample period.6 We calculate thepercentage of the cumulative price change in each trade-size category for sevenintraday time intervals.
Although other measures of informed trading exist, Huang (2002) ar-gues that the WPC is preferred to other measures because of its flexibility in
6Barclay and Warner (1993) argue that weighting the sum of the price changes in a trade-size categorydivided by the total sum of price changes for each stock by the absolute value of the cumulative price changecontrols for potential heteroskedasticity, particularly for firms with small cumulative price changes.
Intraday Stealth Trading 7
TA
BL
E1.
Sum
mar
ySt
atis
tics
onIn
trad
ayT
radi
ngA
ctiv
ity.
Pane
lA.D
iffe
renc
ebe
twee
nth
eIn
trad
ayA
vera
geN
umbe
rof
Tra
des
and
the
Dai
lyA
vera
geN
umbe
rof
Tra
des
Sam
ple
ofS
tock
s,20
05S
ampl
eof
Sto
cks,
1998
Sam
ple
ofS
tock
s,19
95
Inte
rval
Sm
all
Med
ium
Lar
geS
mal
lM
ediu
mL
arge
Sm
all
Med
ium
Lar
ge
9:30
–10:
3028
.44∗∗
∗48
.37∗∗
∗3.
66∗∗
∗4.
03∗∗
∗23
.65∗∗
∗2.
19∗∗
∗1.
87∗∗
∗9.
76∗∗
∗1.
40∗∗
∗
10:3
0–11
:30
22.4
4∗∗∗
17.9
3∗∗∗
0.70
∗∗∗
3.39
∗∗∗
7.56
∗∗∗
1.04
∗∗∗
1.72
∗∗∗
3.76
∗∗∗
0.69
∗∗∗
11:3
0–12
:30
−3.8
5∗∗∗
−19.
84∗∗
∗−1
.54∗∗
∗0.
20−4
.99∗∗
∗−0
.31∗∗
∗0.
37∗∗
∗−1
.47∗∗
∗−0
.08∗∗
∗
12:3
0–1:
00−9
9.62
∗∗∗
−90.
33∗∗
∗−4
.57∗∗
∗−1
4.61
∗∗∗
−30.
44∗∗
−2.7
5∗∗∗
−6.5
1∗∗∗
−11.
16∗∗
∗−1
.54∗∗
∗
1:00
–2:0
0−1
0.72
∗∗∗
−27.
08∗∗
∗−2
.09∗∗
∗−2
.80∗∗
∗−1
0.63
∗∗∗
−0.9
4∗∗∗
−1.8
5∗∗∗
−4.6
9∗∗∗
−0.6
4∗∗∗
2:00
–3:0
016
.80∗∗
∗1.
89∗∗
∗−0
.73∗∗
∗2.
09∗∗
∗−1
.39∗∗
∗−0
.47∗∗
∗0.
77∗∗
∗−0
.83∗∗
∗−0
.24∗∗
∗
3:00
–4:0
046
.50∗∗
∗69
.06∗∗
∗4.
56∗∗
∗7.
64∗∗
∗16
.14∗∗
∗1.
23∗∗
∗3.
43∗∗
∗4.
23∗∗
∗0.
33∗∗
∗
Pane
lB.D
iffe
renc
ebe
twee
nIn
trad
ayA
vera
geV
olum
ean
dth
eD
aily
Ave
rage
Vol
ume
9:30
–10:
306,
133∗∗
∗96
,562
∗∗∗
75,4
79∗∗
∗1,
146∗∗
∗51
,028
∗∗∗
38,6
11∗∗
∗74
9∗∗∗
23,9
00∗∗
∗23
,339
∗∗∗
10:3
0–11
:30
4,26
9∗∗∗
27,1
64∗∗
∗15
,050
∗∗∗
681∗∗
∗4,
084∗∗
∗22
,217
∗∗∗
391∗∗
∗9,
246∗∗
∗15
,886
∗∗∗
11:3
0–12
:30
−1,2
45∗∗
∗−4
4,72
9∗−3
0,03
9∗∗∗
−36
−10,
696∗∗
∗−3
,542
∗∗∗
99∗∗
∗−3
,095
∗∗∗
−645
12:3
0–1:
00−1
9,81
2∗∗∗
–−9
6,07
2∗∗∗
−3,1
01∗∗
∗−6
0,94
7∗∗∗
−55,
433∗∗
∗−1
,470
∗∗∗
−2,4
486∗∗
∗−3
4,15
5∗∗∗
1:00
–2:0
0−2
,610
∗∗∗
157,
100∗∗
∗−4
1,02
6∗∗∗
−618
∗∗∗
−22,
526∗∗
∗−1
8,00
7∗∗∗
−349
∗∗∗
−10,
196∗∗
∗−1
4,48
7∗∗∗
2:00
–3:0
03,
171∗∗
∗−5
8,01
8∗∗∗
−13,
690∗∗
∗38
1∗∗∗
−5,5
93∗∗
∗−9
,319
∗∗∗
70∗∗
−3,2
75∗∗
∗−3
,640
∗∗∗
3:00
–4:0
010
,094
∗∗∗
−5,5
62∗∗
∗90
,298
∗∗∗
1,53
8∗∗∗
32,4
43∗∗
∗25
,133
∗∗∗
440∗∗
∗6,
924∗∗
∗12
,086
∗∗∗
141,
682∗∗
∗
(Con
tinu
ed)

8 The Journal of Financial Research
TA
BL
E1.
Con
tinu
ed.
Pane
lC.D
iffe
renc
ebe
twee
nth
eIn
trad
ayA
vera
geN
umbe
rof
Tra
des
and
the
Dai
lyA
vera
geN
umbe
rof
Tra
des
for
Med
ium
-Siz
edT
rade
s
Med
–Lo
Med
–Mid
Med
–Hi
Med
–Lo
Med
–Mid
Med
–Hi
Med
–Lo
Med
–Mid
Med
–Hi
9:30
–10:
3031
.64∗∗
∗14
.24∗∗
∗2.
49∗∗
∗13
.83∗∗
∗8.
59∗∗
∗1.
24∗∗
∗4.
96∗∗
∗4.
24∗∗
∗0.
61∗∗
∗
10:3
0–11
:30
13.8
7∗∗∗
3.65
∗∗∗
0.42
∗∗∗
4.45
∗∗∗
2.67
∗∗∗
0.44
∗∗∗
1.95
∗∗∗
1.54
∗∗∗
0.26
∗∗∗
11:3
0–12
:30
−11.
81∗∗
∗−6
.74∗∗
∗−1
.29∗∗
∗−2
.95∗∗
∗−1
.79∗∗
∗−0
.25∗∗
∗−0
.75∗∗
∗−0
.65∗∗
∗−0
.07∗∗
∗
12:3
0–1:
00−6
5.07
∗∗∗
−21.
90∗∗
∗−3
.36∗∗
∗−1
9.09
∗∗∗
−9.8
8∗∗∗
−1.4
8∗∗∗
−6.4
6∗∗∗
−4.0
9∗∗∗
−0.6
5∗∗∗
1:00
–2:0
0−1
6.72
∗∗∗
−8.7
9∗∗∗
−1.5
8∗∗∗
−6.3
3∗∗∗
−3.7
0∗∗∗
−0.5
9∗∗∗
−2.6
0∗∗∗
−1.8
0∗∗∗
−0.2
9∗∗∗
2:00
–3:0
03.
59∗∗
∗−1
.20∗∗
∗−0
.49
−0.1
3−1
.04∗∗
∗−0
.23∗∗
∗−0
.22∗∗
∗−0
.52∗∗
∗−0
.11∗∗
∗
3:00
–4:0
044
.51∗∗
∗20
.74∗∗
∗3.
81∗∗
∗10
.16∗∗
∗5.
12∗∗
∗0.
85∗∗
∗2.
88∗∗
∗1.
12∗∗
∗0.
19∗∗
∗
Pane
lD.D
iffe
renc
ebe
twee
nIn
trad
ayA
vera
geV
olum
ean
dth
eD
aily
Ave
rage
Vol
ume
for
Med
ium
-Siz
edT
rade
s
9:30
–10:
3030
,481
∗∗∗
47,3
73∗∗
∗18
,709
∗∗∗
13,1
57∗∗
∗28
,268
∗∗∗
7,38
7∗∗∗
4,86
8∗∗∗
14,2
98∗∗
∗1,
907
10:3
0–11
:30
12,5
13∗∗
∗11
,569
∗∗∗
3,08
2∗∗∗
4,08
4∗∗∗
8,87
8∗∗∗
578
1,84
1∗∗∗
5,25
0∗∗∗
−3,3
13∗
11:3
0–12
:30
−12,
378∗∗
∗−2
2,63
4∗∗∗
−9,7
17∗∗
∗−2
,858
∗∗∗
−5,8
98∗∗
∗−1
−734
∗∗∗
−2,0
66∗∗
∗7,
576∗∗
∗
12:3
0–1:
00−6
0,69
6∗∗∗
−71,
233∗∗
∗−2
5,17
2∗∗∗
−17,
656∗∗
∗−3
2,31
9∗∗∗
−9,5
34∗∗
∗−6
,020
∗∗∗
−13,
399∗∗
∗−3
,392
1:00
–2:0
0−1
6,93
4∗∗∗
−29,
239∗∗
∗−1
1,84
4∗∗∗
−5,9
33∗∗
∗−1
2,20
2∗∗∗
3,59
4∗∗−2
,375
∗∗∗
−5,9
91∗∗
∗30
,289
∗∗∗
2:00
–3:0
02,
752∗∗
∗−4
,574
∗∗∗
−3,7
39∗∗
∗−2
71∗∗
−3,6
95∗∗
∗−1
,279
−277
∗∗∗
−1,9
88∗∗
∗−2
,414
3:00
–4:0
044
,263
∗∗∗
68,7
37∗∗
∗28
,682
∗∗∗
9,42
1∗∗∗
16,8
59∗∗
∗−7
532,
472∗∗
∗3,
404∗∗
∗−3
0,81
1∗∗∗
Not
e:T
heta
ble
repo
rts
the
diff
eren
cebe
twee
nth
eav
erag
ein
trad
aytr
adin
gac
tivit
yin
each
inte
rval
and
the
aver
age
intr
aday
mea
nfo
rea
chtr
ade-
size
cate
gory
inse
ven
intr
aday
inte
rval
sfo
rth
een
tire
sam
ple
of20
0N
YS
E-l
iste
dst
ocks
.
∗∗∗ S
igni
fica
ntat
the
1%le
vel.
∗∗S
igni
fica
ntat
the
5%le
vel.
∗ Sig
nifi
cant
atth
e10
%le
vel.

Intraday Stealth Trading 9
cross-sectional analyses. Furthermore, Hansch and Choe (2007) use the WPC alongwith two other measures: the information share (Hasbrouck 1995) and the commonfactor weights (Gonzalo and Granger 1995). Because they do not find qualitativelydifferent results between the measures, we use Barclay and Warner’s (1993) origi-nal stealth trading measure.7 Similar to Chakravarty (2001), we also calculate theaverage price change per unit volume to isolate the magnitude of the price changerelative to the trade size. We examine the cumulative and average price changesduring the intraday intervals and expect that price changes from larger trades willbe greater at the beginning and end of the day and price changes from smaller tradeswill be greater during the middle of the trading day.
Empirical Results
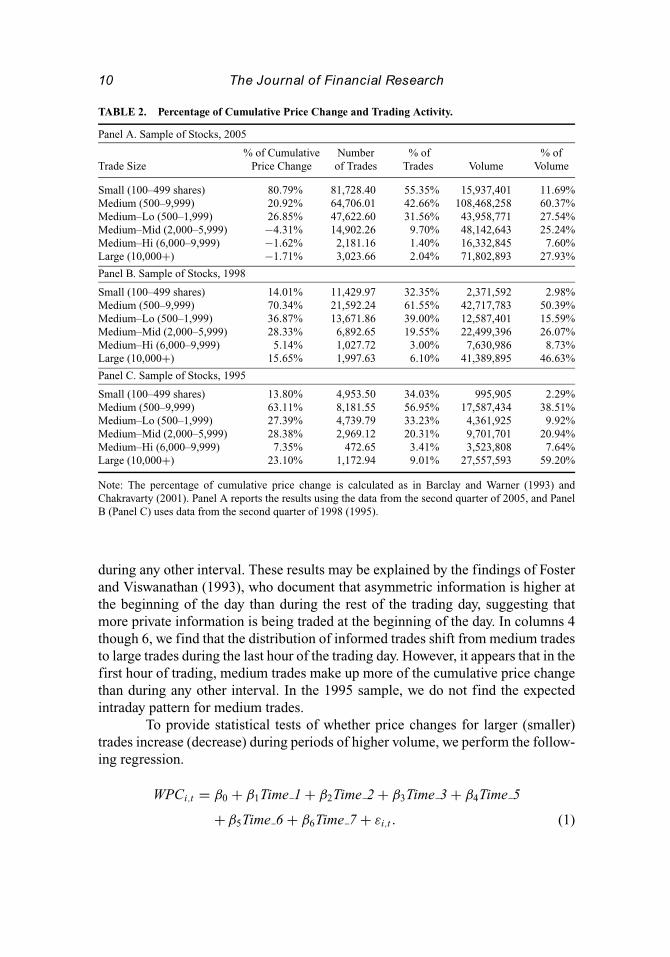
We begin our analysis by examining whether stealth trading exists in our sample ofstocks for each period. Table 2 reports the WPC for each trade size along with thetrading activity measures discussed in Table 1.8 For the 2005 sample, we find thatsmall trades make up approximately 80% of the cumulative price change whereasthey reflect only 55% of the number of trades and 12% of volume. These resultsare consistent with Hansch and Choe (2007) and Blau, Van Ness, and Van Ness(2008). We also find that stealth trading is persistent during years in the 1/16thand 1/8th tick-size environment. Panel B reports that before decimalization, theWPC of medium-sized trades is 70% in 1998 and 63% in 1995. These estimatesare consistent with Chakravarty (2001), who documents that the cumulative pricechanges for medium-sized trades range from 65% to 78%.
Next, we examine the WPC of different-sized trades during seven intradayintervals. If stealth trading occurs less during periods of high trading activity, whichare found at the beginning and end of the day in Table 1, the WPC for smaller tradeswill be less during the beginning and end of the day and the WPC for larger tradeswill be greater during the beginning and end of the day. Looking at the first columnof Table 3, Panel A, we find that the percentage of the cumulative price changefor small trades is substantially less during the first hour of trading than duringthe entire trading day. For the first hour of the day, 68.14% of the cumulative pricechange is made up of small trades whereas 32.93% of the cumulative price changeis made up of medium trades. It appears that some of the distribution of informedtrades shifts from small trades to medium trades during the first hour. However,contrary to our hypothesis, we find that in the last hour of the trading day, smalltrades make up the more of the percentage of the cumulative price change than
7Cao, Ghysels, and Hatheway (2000) and Barclay and Hendershott (2003) also use the WPC whenexamining after-hours trading.
8We exclude the first trade of each day for each stock because of the likelihood that the first trade is abatch of smaller trades.
10 The Journal of Financial Research
TABLE 2. Percentage of Cumulative Price Change and Trading Activity.
Panel A. Sample of Stocks, 2005
% of Cumulative Number % of % ofTrade Size Price Change of Trades Trades Volume Volume
Small (100–499 shares) 80.79% 81,728.40 55.35% 15,937,401 11.69%Medium (500–9,999) 20.92% 64,706.01 42.66% 108,468,258 60.37%Medium–Lo (500–1,999) 26.85% 47,622.60 31.56% 43,958,771 27.54%Medium–Mid (2,000–5,999) −4.31% 14,902.26 9.70% 48,142,643 25.24%Medium–Hi (6,000–9,999) −1.62% 2,181.16 1.40% 16,332,845 7.60%Large (10,000+) −1.71% 3,023.66 2.04% 71,802,893 27.93%
Panel B. Sample of Stocks, 1998
Small (100–499 shares) 14.01% 11,429.97 32.35% 2,371,592 2.98%Medium (500–9,999) 70.34% 21,592.24 61.55% 42,717,783 50.39%Medium–Lo (500–1,999) 36.87% 13,671.86 39.00% 12,587,401 15.59%Medium–Mid (2,000–5,999) 28.33% 6,892.65 19.55% 22,499,396 26.07%Medium–Hi (6,000–9,999) 5.14% 1,027.72 3.00% 7,630,986 8.73%Large (10,000+) 15.65% 1,997.63 6.10% 41,389,895 46.63%
Panel C. Sample of Stocks, 1995
Small (100–499 shares) 13.80% 4,953.50 34.03% 995,905 2.29%Medium (500–9,999) 63.11% 8,181.55 56.95% 17,587,434 38.51%Medium–Lo (500–1,999) 27.39% 4,739.79 33.23% 4,361,925 9.92%Medium–Mid (2,000–5,999) 28.38% 2,969.12 20.31% 9,701,701 20.94%Medium–Hi (6,000–9,999) 7.35% 472.65 3.41% 3,523,808 7.64%Large (10,000+) 23.10% 1,172.94 9.01% 27,557,593 59.20%
Note: The percentage of cumulative price change is calculated as in Barclay and Warner (1993) andChakravarty (2001). Panel A reports the results using the data from the second quarter of 2005, and PanelB (Panel C) uses data from the second quarter of 1998 (1995).
during any other interval. These results may be explained by the findings of Fosterand Viswanathan (1993), who document that asymmetric information is higher atthe beginning of the day than during the rest of the trading day, suggesting thatmore private information is being traded at the beginning of the day. In columns 4though 6, we find that the distribution of informed trades shift from medium tradesto large trades during the last hour of the trading day. However, it appears that in thefirst hour of trading, medium trades make up more of the cumulative price changethan during any other interval. In the 1995 sample, we do not find the expectedintraday pattern for medium trades.
To provide statistical tests of whether price changes for larger (smaller)trades increase (decrease) during periods of higher volume, we perform the follow-ing regression.
WPCi,t = β0 + β1Time 1 + β2Time 2 + β3Time 3 + β4Time 5
+ β5Time 6 + β6Time 7 + εi ,t . (1)

Intraday Stealth Trading 11
TA
BL
E3.
Intr
aday
Stea
lth
Tra
ding
.
Pane
lA.I
ntra
day
Perc
enta
geof
the
Cum
ulat
ive
Pri
ceC
hang
e
Perc
enta
geof
Cum
ulat
ive
Pri
ceC
hang
e(w
itho
utfi
rstt
rade
ofth
eda
y)
Sam
ple
ofS
tock
s,20
05S
ampl
eof
Sto
cks,
1998
Sam
ple
ofS
tock
s,19
95
Inte
rval
Sm
all
Med
ium
Lar
geS
mal
lM
ediu
mL
arge
Sm
all
Med
ium
Lar
ge
9:30
–10:
3068
.14%
32.9
3%−1
.07%
12.6
8%75
.39%
11.9
3%−0
.62%
71.2
3%29
.39%
10:3
0–11
:30
84.1
2%15
.80%
0.08
%14
.95%
64.6
2%20
.43%
27.7
6%41
.69%
30.5
5%11
:30–
12:3
079
.64%
20.1
5%0.
20%
11.7
5%74
.76%
13.5
0%15
.72%
64.5
4%19
.74%
12:3
0–1:
0082
.12%
17.6
1%0.
28%
10.5
8%74
.28%
15.1
4%18
.26%
58.1
2%23
.62%
1:00
–2:0
080
.86%
18.7
2%0.
42%
11.1
3%71
.15%
17.7
2%11
.45%
66.5
3%22
.03%
2:00
–3:0
082
.70%
19.3
8%−2
.08%
21.2
6%65
.85%
12.8
8%7.
06%
65.6
6%27
.28%
3:00
–4:0
086
.39%
18.6
9%−5
.09%
14.8
7%65
.41%
19.7
2%23
.50%
67.4
3%9.
07%
Pane
lB.R
esul
tsfr
omR
egre
ssin
gth
eC
umul
ativ
eP
rice
Cha
nge
for
Siz
eii
nIn
terv
alt
onD
umm
yV
aria
bles
Cap
turi
ngIn
trad
ayT
ime
Inte
rval
s
Inte
rcep
t−4
.109
4∗∗∗
0.27
88−0
.305
8−0
.228
3−0
.229
7−0
.197
0−0
.439
3−0
.378
10.
6942
(−7.
32)
(0.5
6)(−
1.28
)(−
0.62
)(−
0.37
)(−
0.83
)(−
1.40
)(−
0.90
)(3
.42)
Tim
e1
−0.8
613∗∗
∗−0
.631
4∗∗∗
0.14
37∗∗
−0.8
353∗∗
∗0.
1915
0.33
41∗∗
∗−0
.357
9∗∗∗
0.56
85∗∗
∗0.
1538
∗∗∗
(−5.
64)
(−4.
65)
(2.2
1)(−
8.38
)(1
.12)
(5.1
6)(−
4.21
)(5
.00)
(2.7
8)Ti
me
2−0
.224
90.
3926
∗∗∗
−0.0
788
−0.1
179
−0.0
318
0.01
660.
1234
0.00
60−0
.029
3(−
1.47
)(2
.89)
(−1.
21)
(−1.
18)
(−0.
19)
(0.2
6)(1
.45)
(0.0
5)(−
0.53
)Ti
me
30.
5529
∗∗∗
0.18
74−0
.051
80.
2706
∗∗∗
0.26
50−0
.056
60.
1340
−0.2
965∗∗
∗−0
.053
0(3
.62)
(1.3
8)(−
0.80
)(2
.71)
(1.5
5)(−
0.87
)(1
.57)
(−2.
61)
(−0.
96)
Tim
e5
0.31
83∗∗
0.10
27−0
.027
80.
1368
−0.3
135∗
−0.1
184∗
0.22
03∗∗
∗0.
0647
−0.0
243
(2.0
8)(0
.76)
(−0.
43)
(1.3
7)(−
1.84
)(−
1.67
)(2
.59)
(0.5
7)(−
0.44
)Ti
me
60.
0944
0.21
530.
0303
−0.1
613
0.12
43−0
.045
30.
1521
−0.1
284
−0.0
130
(0.6
2)(1
.59)
(0.4
7)(−
1.62
)(0
.73)
(−0.
70)
(1.7
9)(−
1.13
)(−
0.24
)Ti
me
7−0
.627
9∗∗∗
0.18
840.
2394
∗∗∗
0.30
01∗∗
∗0.
7512
∗∗∗
0.35
76∗∗
∗0.
0634
0.07
540.
1913
∗∗∗
(−4.
11)
(1.3
9)(3
.68)
(3.0
1)(4
.40)
(5.5
2)(0
.74)
(0.6
6)(3
.46)
Adj
.R2
0.60
170.
2943
0.10
980.
7247
0.40
850.
4228
0.65
620.
4170
0.51
44Fi
xed
effe
cts
Yes
Yes
Yes
Yes
Yes
Yes
Yes
Yes
Yes
Not
e:T
hepe
rcen
tage
ofcu
mul
ativ
epr
ice
chan
geis
calc
ulat
edfo
llow
ing
Bar
clay
and
War
ner
(199
3)an
dC
hakr
avar
ty(2
001)
.Pan
elB
repo
rts
the
resu
lts
from
regr
essi
ngth
efo
llow
ing
equa
tion
:Cum
ulat
ive
pric
ech
ange
i,t=
β0
+β
1Ti
me
1+
β2Ti
me
2+
β3Ti
me
3+
β4Ti
me
5+
β5Ti
me
6+
β6Ti
me
7+
εi,t
.A
Hau
sman
test
reje
cts
the
pres
ence
ofra
ndom
effe
cts;
how
ever
,an
F-t
est
sugg
ests
that
ther
ear
eob
serv
edcr
oss-
sect
iona
ldi
ffer
ence
s.T
here
fore
,th
ere
sult
sfr
oma
fixe
d-ef
fect
sre
gres
sion
are
repo
rted
inPa
nelB
.
∗∗∗ S
igni
fica
ntat
the
1%le
vel.
∗∗S
igni
fica
ntat
the
5%le
vel.
∗ Sig
nifi
cant
atth
e10
%le
vel.
12 The Journal of Financial Research
The dependent variable is the WPC for stock i in interval t. The independentvariables are six dummy variables that capture the first three and last three hours ofthe trading day. We estimate equation (1) for each of the different trade sizes andanticipate that the WPC for smaller trades will exhibit a reverse U-shaped intradaypattern and the WPC for larger trades will exhibit the familiar U-shaped pattern.A Hausman test rejects the presence of random effects, although we find observeddifferences across stocks. Therefore, we use a fixed-effects regression.
Table 3, Panel B reports the results from estimating equation (1). We findfrom the regression that small trades exhibit a significant reverse U-shaped intradaypattern (column 1). We find that large trades (column 3) drive the familiar U-shapedpattern in returns. In 1998 and 1995, we also find that price changes from largetrades (columns 6 and 9) exhibit the familiar U-shaped pattern, which is consistentwith our expectation. In 1998 and 1995, we find that the estimate for β1 is significantand negative, suggesting that in the first hour of trading, price changes from smalltrades are significantly less than the omitted interval (12:30–1:00 pm). The resultsin Table 3 offer evidence for our expectation. That is, we find that large tradestypically follow a U-shaped intraday pattern of returns. We also find, in our 2005sample, that small trades move prices less in the first and last hours of trading thanduring the middle of the day, which suggests that larger trade sizes move pricesmore during the first and last hours of trading.
To provide a better test of our hypothesis using the data from 1995 and 1998,we use finer medium-sized categories. We expect that the distribution of informedtrades shift from smaller medium-sized trades to larger medium-sized trades at thebeginning and end of the day. Focusing on columns 4 through 9 of Table 4, Panel A,we do not find a clear pattern using the univariate WPC measures. Panel B providesthe results of estimating equation (1) for the different medium-sized trades. Incolumns 1 through 3 of Panel B, we find that smaller medium-sized trades exhibita reverse U-shaped pattern in price changes and a weak U-shaped pattern in pricechanges for larger medium-sized trades. Consistent with our hypothesis, for 1998,we find that larger medium-sized trades drive the U-shaped intraday pattern in pricechanges. In 1995, we find that medium–mid trades exhibit a U-shaped intradaypattern in price changes and medium–low trades exhibit a weak reverse U-shapedpattern in price changes. Tables 3 and 4 show that larger trades drive the familiarU-shaped pattern in intraday price changes.
Following Chakravarty (2001), we examine the average price changes fordifferent trade sizes during the intraday. We scale the price change (in cents) by theunit volume for each trade to control for the endogeniety between price changesand trade size. Our expectations for the analysis using the average price changesare the same as before. Table 5 reports the analysis using Chakravarty’s measure ofaverage price change. Panel A examines the difference between the average pricechange in each interval and the intraday average price change. Consistent withour expectations, small-trade price changes exhibit a reverse U-shaped pattern and

Intraday Stealth Trading 13
TA
BL
E4.
Intr
aday
Stea
lth
Tra
ding
for
Med
ium
-Siz
edT
rade
s.
Pane
lA.I
ntra
day
Perc
enta
geof
the
Cum
ulat
ive
Pri
ceC
hang
e
Perc
enta
geof
Cum
ulat
ive
Pri
ceC
hang
e(w
itho
utfi
rstt
rade
ofth
eda
y)
Sam
ple
ofS
tock
s,20
05S
ampl
eof
Sto
cks,
1998
Sam
ple
ofS
tock
s,19
95
Inte
rval
Med
–Lo
Med
–Mid
Med
–Hi
Med
–Lo
Med
–Mid
Med
–Hi
Med
–Lo
Med
–Mid
Med
–Hi
9:30
–10:
3033
.26%
0.84
%−1
.17%
44.4
8%25
.34%
5.57
%25
.40%
38.1
7%7.
67%
10:3
0–11
:30
26.1
0%−7
.70%
−2.6
0%15
.34%
41.7
7%7.
50%
20.7
1%12
.49%
8.49
%11
:30–
12:3
022
.97%
−2.5
8%−0
.23%
40.9
7%25
.99%
7.80
%29
.24%
28.9
3%6.
37%
12:3
0–1:
0021
.47%
−2.7
6%−1
.10%
46.4
9%23
.55%
4.23
%32
.46%
24.6
4%1.
01%
1:00
–2:0
021
.73%
−2.6
0%−0
.41%
36.5
1%32
.61%
2.04
%28
.15%
30.6
9%7.
69%
2:00
–3:0
023
.29%
−3.3
1%−0
.60%
40.7
0%22
.32%
2.83
%31
.93%
26.2
0%7.
53%
3:00
–4:0
026
.93%
−5.5
0%−2
.73%
34.6
2%26
.35%
4.44
%28
.37%
30.5
2%9.
07%
Pane
lB.D
iffe
renc
ebe
twee
nth
ePe
rcen
tage
ofth
eC
umul
ativ
eP
rice
Cha
nge
and
the
Intr
aday
Mea
n
Inte
rcep
t0.
0288
0.13
410.
1160
0.31
82−0
.482
4−0
.065
5−0
.204
7−0
.080
3−0
.093
1(0
.07)
(0.4
7)(1
.18)
(0.6
8)(−
1.28
)(−
0.43
)(−
0.63
)(−
0.30
)(−
0.85
)Ti
me
1−0
.629
0∗∗∗
0.02
59−0
.028
4−0
.327
5∗∗0.
3794
∗∗∗
0.13
96∗∗
∗0.
0171
0.50
93∗
0.04
21(−
5.90
)(0
.33)
(−1.
06)
(−2.
56)
(3.7
1)(3
.37)
(0.1
9)(6
.91)
(1.4
1)Ti
me
20.
1667
0.17
89∗∗
0.04
70∗
0.01
92−0
.034
9−0
.016
20.
0328
−0.0
682
0.04
14(1
.56)
(2.2
8)(1
.75)
(0.1
5)(−
0.34
)(−
0.39
)(0
.37)
(−0.
93)
(1.3
9)Ti
me
30.
2837
∗∗∗
−0.0
617
−0.0
347
0.31
88∗∗
−0.0
251
−0.0
287
−0.0
297
−0.2
638∗
−0.0
030
(2.6
6)(−
0.79
)(−
1.29
)(2
.49)
(−0.
25)
(−0.
69)
(−0.
34)
(−3.
59)
(−0.
10)
Tim
e5
0.22
66∗∗
−0.0
915
−0.0
324
−0.0
606
−0.2
403
−0.0
127
0.19
46∗∗
−0.1
826∗∗
0.05
27∗
(2.1
3)(−
1.17
)(−
1.21
)(−
0.47
)(−
2.35
)∗∗(−
0.31
)(2
.21)
(−2.
48)
(1.7
7)Ti
me
60.
1923
∗0.
0484
−0.0
253
0.09
27−0
.030
50.
0621
−0.0
309
−0.1
182
0.02
08(1
.80)
(0.6
2)(−
0.94
)(0
.72)
(−0.
30)
(1.5
0)(−
0.35
)(−
1.60
)(0
.70)
Tim
e7
−0.1
842∗
0.24
68∗∗
∗0.
1259
∗∗∗
0.32
10∗∗
0.34
77∗∗
∗0.
0825
∗∗−0
.028
60.
0418
0.05
64∗
(−1.
73)
(3.1
5)(4
.70)
(2.5
1)(3
.40)
(1.9
9)(−
0.26
)(0
.57)
(1.9
0)A
dj.R
20.
3032
0.22
690.
1435
0.32
860.
4469
0.23
360.
3250
0.43
760.
2367
Fixe
def
fect
sY
esY
esY
esY
esY
esY
esY
esY
esY
es
Not
e:T
hecu
mul
ativ
epr
ice
chan
geis
calc
ulat
edfo
llow
ing
Bar
clay
and
War
ner
(199
3)an
dC
hakr
avar
ty(2
001)
.Med
–lo
cons
ists
oftr
ades
that
rang
efr
om50
0to
1,99
9an
dm
ed–m
id(m
ed–h
i)co
nsis
tsof
trad
esth
atra
nge
from
2,00
0to
5,99
9(6
,000
to9,
999)
.AH
ausm
ante
stre
ject
sth
epr
esen
ceof
rand
omef
fect
s;ho
wev
er,a
nF
-tes
tsug
gest
sth
atth
ere
are
obse
rved
cros
s-se
ctio
nald
iffe
renc
es.T
here
fore
,the
resu
lts
from
afi
xed-
effe
cts
regr
essi
onar
ere
port
edin
Pane
lB.
∗∗∗ S
igni
fica
ntat
the
1%le
vel.
∗∗S
igni
fica
ntat
the
5%le
vel.
∗ Sig
nifi
cant
atth
e10
%le
vel.

14 The Journal of Financial Research
TA
BL
E5.
Intr
aday
Pri
ceC
hang
es.
Pane
lA.I
ntra
day
Ave
rage
Pri
ceC
hang
e
Ave
rage
Pri
ceC
hang
e(w
itho
utfi
rstt
rade
ofth
eda
y)
Sam
ple
ofS
tock
s,20
05S
ampl
eof
Sto
cks,
1998
Sam
ple
ofS
tock
s,19
95In
trad
ayIn
terv
alS
mal
lM
ediu
mL
arge
Sm
all
Med
ium
Lar
geS
mal
lM
ediu
mL
arge
9:30
–10:
30−0
.008
0∗−0
.001
0∗0.
0006
∗∗−0
.038
0∗−0
.003
0∗0.
0014
∗−0
.065
0∗−0
.005
0∗−0
.000
610
:30–
1:30
0.00
020.
0005
0.00
02−0
.011
0∗∗∗
0.00
25∗
0.00
020.
0073
−0.0
020
−0.0
040∗∗
11:3
0–12
:30
0.00
34∗
−0.0
003
−0.0
005∗∗
0.01
51∗
−0.0
010∗∗
∗−0
.000
40.
0060
−0.0
010
0.00
31∗∗
∗
12:3
0–1:
000.
0045
∗0.
0010
∗0.
0000
0.00
30−0
.000
4−0
.000
8−0
.008
00.
0075
∗∗−0
.002
01:
00–2
:00
0.00
14∗∗
0.00
02−0
.001
0∗∗0.
0040
0.00
07−0
.001
0∗∗0.
0363
∗∗0.
0039
0.00
142:
00–3
:00
−0.0
064
−0.0
025
0.00
010.
0061
0.00
07−0
.000
10.
0127
0.00
160.
0016
3:00
–4:0
0−0
.003
80.
0004
∗∗0.
0003
∗∗∗
0.02
02∗
0.00
16∗∗
0.00
050.
0102
−0.0
040∗∗
∗0.
0004
Pane
lB.R
esul
tsfr
omR
egre
ssin
gth
eP
rice
Cha
nge
for
Siz
eii
nIn
terv
alt
onD
umm
yV
aria
bles
Cap
turi
ngIn
trad
ayT
ime
Inte
rval
s
Inte
rcep
t−0
.003
2∗∗∗
−0.0
002
−0.0
030
−0.0
068∗∗
0.00
31−0
.005
0∗∗−0
.010
30.
0011
0.00
03(−
6.85
)(−
0.15
)(−
1.45
)(−
2.23
)(0
.73)
(−1.
97)
(−1.
55)
(0.1
2)(0
.04)
Tim
e1
−0.0
010∗∗
∗−0
.001
0∗∗∗
0.00
01∗
−0.0
050∗∗
∗−0
.003
0∗∗∗
0.00
22∗∗
∗−0
.008
6∗∗∗
−0.0
080∗∗
∗0.
0011
(−10
.60)
(−5.
10)
(1.7
7)(−
7.76
)(−
3.30
)(3
.90)
(−6.
12)
(−4.
15)
(0.5
6)Ti
me
2−0
.000
2∗∗0.
0001
∗0.
0001
∗∗−0
.002
2∗∗∗
0.00
25∗∗
∗0.
0010
∗−0
.002
0−0
.007
0∗∗∗
−0.0
030
(−2.
06)
(1.9
0)(2
.14)
(−3.
33)
(2.7
3)(1
.75)
(−1.
41)
(−3.
86)
(−1.
57)
Tim
e6
−0.0
004∗∗
∗−0
.000
10.
0001
−0.0
011∗
0.00
060.
0002
−0.0
007
−0.0
007
0.00
25(−
3.69
)(−
0.27
)(1
.65)
(−1.
69)
(0.7
0)(0
.41)
(−0.
52)
(−0.
37)
(1.2
5)Ti
me
7−0
.000
3∗∗∗
0.00
030.
0001
∗0.
0004
0.00
18∗∗
0.00
13∗∗
−0.0
012
−0.0
070∗∗
∗0.
0014
(−3.
48)
(1.1
8)(1
.73)
(0.6
8)(2
.04)
(2.3
3)(−
0.83
)(−
3.59
)(0
.67)
Adj
.R2
0.62
650.
2346
0.33
490.
6980
0.28
240.
1653
0.48
100.
2166
0.09
36Fi
xed
effe
cts
Yes
Yes
Yes
Yes
Yes
Yes
Yes
Yes
Yes
Not
e:T
heav
erag
epr
ice
chan
gepe
run
itvo
lum
e(i
nce
nts)
isca
lcul
ated
foll
owin
gC
hakr
avar
ty(2
001)
.AH
ausm
ante
stre
ject
sth
epr
esen
ceof
rand
omef
fect
s;ho
wev
er,a
nF
-tes
tsug
gest
sth
atth
ere
are
obse
rved
cros
s-se
ctio
nald
iffe
renc
es.T
here
fore
,the
resu
lts
from
afi
xed-
effe
cts
regr
essi
onar
ere
port
edin
Pane
lB.
∗∗∗ S
igni
fica
ntat
the
1%le
vel.
∗∗S
igni
fica
ntat
the
5%le
vel.
∗ Sig
nifi
cant
atth
e10
%le
vel.
Intraday Stealth Trading 15
large-trade price changes have a significant U-shaped pattern for the 2005 sample.The results are generally robust to the 1998 subsample, as large-trade price changesare U-shaped. We also note that medium-trade price changes exhibit a reverse U-shaped pattern, suggesting that stealth trading in medium sizes occurs less duringthe beginning and end of the trading day.
We also estimate the following equation using a fixed-effects regressionsimilar to equation (1).
ave price changei,t = β0 + β1Time 1 + β2Time 2 + β3Time 6
+ β4T ime 7 + εi ,t . (2)
The dependent variable is the average price change (in cents) per unit volume forstock i in interval t. The independent variables are four dummy variables that capturethe first two and last two hours of the trading day.
Panel B in Table 5 shows that large-trade price changes exhibit the familiarU-shaped intraday pattern for the 2005 and 1998 samples. Furthermore, small-and medium-trade price changes are significantly less at the beginning of the day,suggesting that stealth trading occurs less during the beginning of the day. Althoughwe do not document a U-shaped pattern in large-trade price changes for the 1995sample, we report a reverse U-shaped pattern in the medium-trade price changes,which is consistent with the univariate results and suggests that stealth trading inmedium-sized trades occurs less at the beginning and the end of the day.
Table 6 reports the results for the different medium-sized categories. Inthe 1998 sample, we document that price changes from larger medium-sized tradesexhibit the U-shaped intraday pattern. In the 1995 sample, we find that price changesfrom smaller medium-sized trades exhibit the reverse U-shaped intraday pattern.We do not find evidence of our expectation in larger medium-sized trades for the1995 sample; however, in Table 1, we report that volume from large medium-sizedtrades is not U-shaped, which likely affects informed trading in different tradesizes.
Evidence of the positive relation between price changes and volume isimportant when examining the intraday patterns of returns and trading activity.Karpoff (1987) shows that positive price changes are directly related to volume.Thus far, we have shown that price changes from larger trades typically drive theU-shaped pattern in returns documented in Wood, McInish, and Ord (1985) andHarris (1986). We interpret our results to be consistent with the argument thatinformed traders will choose to stealth trade less during periods of high volume atthe beginning and end of the day. We further test our conjecture by examining therelation between price changes and volume in each trade size.
To examine the relation between price changes and volume, we estimatethe following equation:

16 The Journal of Financial Research
TA
BL
E6.
Intr
aday
Stea
lth
Tra
ding
for
Med
ium
-Siz
edT
rade
s.
Pane
lA.I
ntra
day
Ave
rage
Pri
ceC
hang
e
Ave
rage
Pri
ceC
hang
e(w
itho
utfi
rstt
rade
ofth
eda
y)
Sam
ple
ofS
tock
s,20
05S
ampl
eof
Sto
cks,
1998
Sam
ple
ofS
tock
s,19
95In
trad
ayIn
terv
alM
ed–L
oM
ed–M
idM
ed–H
iM
ed–L
oM
ed–M
idM
ed–H
iM
ed–L
oM
ed–M
idM
ed–H
i
9:30
–10:
30−0
.002
0∗−0
.000
2−0
.000
0−0
.007
0∗0.
0025
∗0.
0012
∗−0
.007
0∗0.
0016
−0.0
000
10:3
0–11
:30
0.00
060.
0005
∗∗∗
0.00
030.
0031
∗0.
0016
∗∗0.
0003
−0.0
030
−0.0
030∗
0.00
1211
:30–
12:3
0−0
.000
1−0
.000
4−0
.000
6−0
.001
0−0
.001
0∗∗∗
−0.0
010∗∗
−0.0
010
0.00
09−0
.000
112
:30–
1:00
0.00
12∗
0.00
020.
0008
0.00
05−0
.002
0∗∗−0
.002
0∗0.
0104
∗∗0.
0032
∗∗∗
−0.0
020
1:00
–2:0
00.
0002
−0.0
003
−0.0
006
0.00
02−0
.000
60.
0011
∗∗∗
0.00
79∗∗
0.00
010.
0020
∗∗
2:00
–3:0
0−0
.000
20.
0002
−0.0
003
0.00
20∗∗
∗−0
.000
9−0
.000
30.
0015
0.00
18−0
.001
03:
00–4
:00
0.00
04−0
.000
20.
0003
0.00
23∗∗
0.00
060.
0002
−0.0
040
−0.0
040∗
−0.0
010
Pane
lB.D
iffe
renc
ebe
twee
nth
ePe
rcen
tage
ofth
eC
umul
ativ
eP
rice
Cha
nge
and
the
Intr
aday
Mea
n
Inte
rcep
t−0
.000
20.
0008
0.00
220.
0125
∗∗−0
.007
0∗−0
.002
00.
0004
−0.0
040
−0.0
030
(−0.
16)
(0.6
9)(0
.95)
(1.9
7)(−
2.65
)(−
0.72
)(0
.26)
(−0.
81)
(−0.
50)
Tim
e1
−0.0
020∗∗
∗0.
0000
0.00
08−0
.006
0∗∗∗
0.00
25∗∗
∗0.
0019
∗∗∗
−0.0
014∗∗
∗0.
0008
0.00
01(−
6.90
)(0
.09)
(1.5
1)(−
4.47
)(4
.12)
(2.8
4)(−
4.49
)(0
.63)
(0.1
0)Ti
me
20.
0003
0.00
06∗∗
0.00
13∗∗
∗0.
0026
∗0.
0024
∗∗∗
0.00
04−0
.001
1∗∗∗
−0.0
040∗∗
∗0.
0014
(0.8
6)(2
.47)
(2.6
9)(1
.90)
(3.9
3)(0
.67)
(−3.
55)
(−3.
26)
(1.3
3)Ti
me
6−0
.000
20.
0001
−0.0
019
0.00
120.
0001
0.00
01−0
.000
20.
0013
0.00
03(−
0.54
)(0
.58)
(−0.
37)
(0.8
8)(0
.13)
(0.1
8)(−
0.72
)(1
.07)
(0.2
6)Ti
me
70.
0001
−0.0
001
0.00
330.
0023
∗0.
0014
∗∗0.
0007
−0.0
009∗∗
∗−0
.003
0∗∗∗
−0.0
003
(0.4
1)(−
0.26
)(0
.66)
(1.6
7)(2
.27)
(1.0
0)(−
2.98
)(−
2.95
)(−
0.25
)A
dj.R
20.
2453
0.37
240.
0887
0.26
550.
3216
0.18
180.
2015
0.30
430.
1735
Fixe
def
fect
sY
esY
esY
esY
esY
esY
esY
esY
esY
es
Not
e:T
heav
erag
epr
ice
chan
gepe
run
itvo
lum
e(i
nce
nts)
isca
lcul
ated
foll
owin
gC
hakr
avar
ty(2
001)
.AH
ausm
ante
stre
ject
sth
epr
esen
ceof
rand
omef
fect
s;ho
wev
er,a
nF
-tes
tsug
gest
sth
atth
ere
are
obse
rved
cros
s-se
ctio
nald
iffe
renc
es.T
here
fore
,the
resu
lts
from
afi
xed-
effe
cts
regr
essi
onar
ere
port
edin
Pane
lB.
∗∗∗ S
igni
fica
ntat
the
1%le
vel.
∗∗S
igni
fica
ntat
the
5%le
vel.
∗ Sig
nifi
cant
atth
e10
%le
vel.
Intraday Stealth Trading 17
TABLE 7. Regression Results of Cumulative Price Change on Volume.
Panel A. Sample of Stocks, 2005
Small Medium Large Med–Lo Med–Mid Med–HiTrades Trades Trades Trades Trades Trades
Intercept −2.5302∗∗∗ −3.7754∗∗∗ −3.5756∗∗∗ −0.8109∗∗∗ −1.0661∗∗∗ −1.8983∗∗∗
(−10.16) (−6.51) (−13.77) (−7.50) (−3.96) (−6.53)ln(volume) 0.1539∗∗∗ 0.2252∗∗∗ 2.1539∗∗∗ 0.0495∗∗∗ 0.0632∗∗∗ 0.1125∗∗∗
(11.23) (7.05) (15.06) (8.32) (4.26) (7.03)Adj R2 0.1886 0.1580 0.2088 0.1671 0.1488 0.1566Fixed effects Yes Yes Yes Yes Yes Yes
Panel B. Sample of Stocks, 1998
Intercept −0.0127 −0.3362 −2.7714 −0.0306 −0.0997 −0.2058(−3.92) (−6.76) (−14.16) (−4.08) (−4.93) (−7.23)
ln(volume) 0.0008 0.0262 0.1805 0.0028 0.0092 0.0143(4.26) (8.98) (15.68) (6.28) (7.70) (8.56)
Adj R2 0.1705 0.1689 0.2250 0.1533 0.1601 0.1597Fixed effects Yes Yes Yes Yes Yes Yes
Panel C. Sample of Stocks, 1995
Intercept −0.0119 −0.9121 −2.5679 −0.0863 −0.4144 −0.4114(−2.17) (−10.77) (−15.09) (−5.90) (−9.27) (−11.82)
ln(volume) 0.0008 0.0587 0.1657 0.0056 0.0267 0.0265(2.39) (11.77) (16.55) (6.47) (10.14) (12.92)
Adj R2 0.1473 0.1907 0.2508 0.1554 0.1779 0.2047Fixed effects Yes Yes Yes Yes Yes Yes
Note: The table reports the results of regressing the cumulative price change on the natural log of volumefor each trade size: cumulative price changei,t = γ 0 + γ 1volumei,t + εi,t. A Hausman test rejects thepresence of the random effects, and an F-test suggests that there are observed differences across stocks.We report the fixed-effects estimates.
∗∗∗Significant at the 1% level.
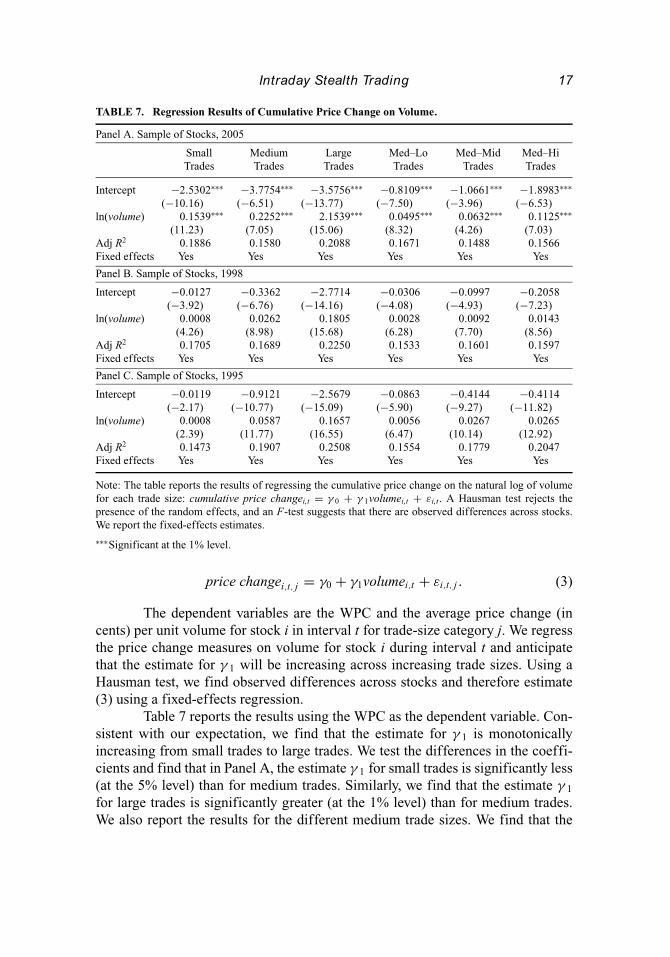
price changei,t , j = γ0 + γ1volumei,t + εi ,t , j . (3)
The dependent variables are the WPC and the average price change (incents) per unit volume for stock i in interval t for trade-size category j. We regressthe price change measures on volume for stock i during interval t and anticipatethat the estimate for γ 1 will be increasing across increasing trade sizes. Using aHausman test, we find observed differences across stocks and therefore estimate(3) using a fixed-effects regression.
Table 7 reports the results using the WPC as the dependent variable. Con-sistent with our expectation, we find that the estimate for γ 1 is monotonicallyincreasing from small trades to large trades. We test the differences in the coeffi-cients and find that in Panel A, the estimate γ 1 for small trades is significantly less(at the 5% level) than for medium trades. Similarly, we find that the estimate γ 1
for large trades is significantly greater (at the 1% level) than for medium trades.We also report the results for the different medium trade sizes. We find that the
18 The Journal of Financial Research
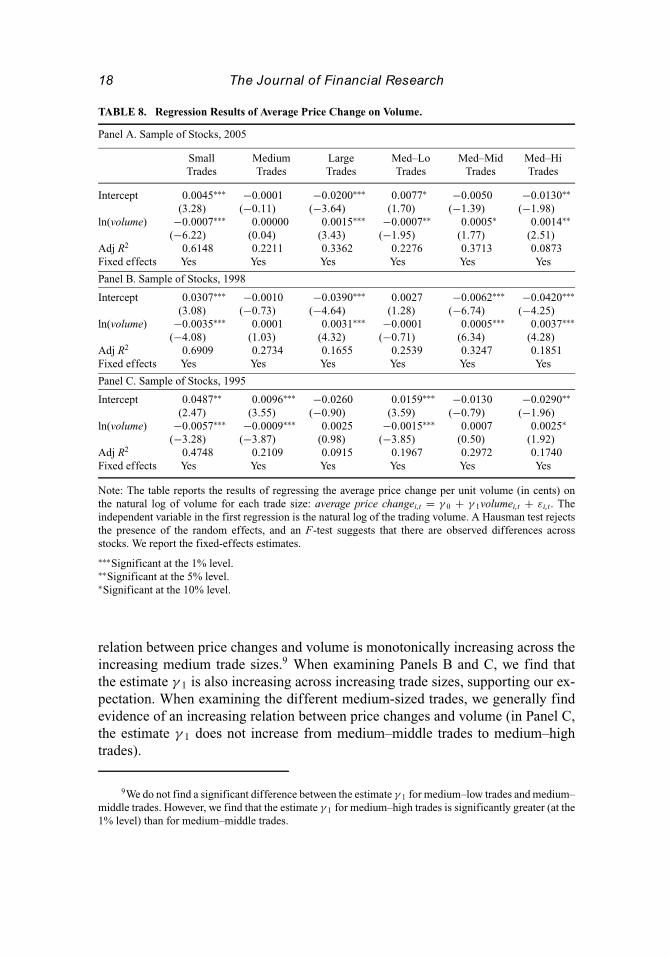
TABLE 8. Regression Results of Average Price Change on Volume.
Panel A. Sample of Stocks, 2005
Small Medium Large Med–Lo Med–Mid Med–HiTrades Trades Trades Trades Trades Trades
Intercept 0.0045∗∗∗ −0.0001 −0.0200∗∗∗ 0.0077∗ −0.0050 −0.0130∗∗
(3.28) (−0.11) (−3.64) (1.70) (−1.39) (−1.98)ln(volume) −0.0007∗∗∗ 0.00000 0.0015∗∗∗ −0.0007∗∗ 0.0005∗ 0.0014∗∗
(−6.22) (0.04) (3.43) (−1.95) (1.77) (2.51)Adj R2 0.6148 0.2211 0.3362 0.2276 0.3713 0.0873Fixed effects Yes Yes Yes Yes Yes Yes
Panel B. Sample of Stocks, 1998
Intercept 0.0307∗∗∗ −0.0010 −0.0390∗∗∗ 0.0027 −0.0062∗∗∗ −0.0420∗∗∗
(3.08) (−0.73) (−4.64) (1.28) (−6.74) (−4.25)ln(volume) −0.0035∗∗∗ 0.0001 0.0031∗∗∗ −0.0001 0.0005∗∗∗ 0.0037∗∗∗
(−4.08) (1.03) (4.32) (−0.71) (6.34) (4.28)Adj R2 0.6909 0.2734 0.1655 0.2539 0.3247 0.1851Fixed effects Yes Yes Yes Yes Yes Yes
Panel C. Sample of Stocks, 1995
Intercept 0.0487∗∗ 0.0096∗∗∗ −0.0260 0.0159∗∗∗ −0.0130 −0.0290∗∗
(2.47) (3.55) (−0.90) (3.59) (−0.79) (−1.96)ln(volume) −0.0057∗∗∗ −0.0009∗∗∗ 0.0025 −0.0015∗∗∗ 0.0007 0.0025∗
(−3.28) (−3.87) (0.98) (−3.85) (0.50) (1.92)Adj R2 0.4748 0.2109 0.0915 0.1967 0.2972 0.1740Fixed effects Yes Yes Yes Yes Yes Yes
Note: The table reports the results of regressing the average price change per unit volume (in cents) onthe natural log of volume for each trade size: average price changei,t = γ 0 + γ 1volumei,t + εi,t. Theindependent variable in the first regression is the natural log of the trading volume. A Hausman test rejectsthe presence of the random effects, and an F-test suggests that there are observed differences acrossstocks. We report the fixed-effects estimates.
∗∗∗Significant at the 1% level.∗∗Significant at the 5% level.∗Significant at the 10% level.
relation between price changes and volume is monotonically increasing across theincreasing medium trade sizes.9 When examining Panels B and C, we find thatthe estimate γ 1 is also increasing across increasing trade sizes, supporting our ex-pectation. When examining the different medium-sized trades, we generally findevidence of an increasing relation between price changes and volume (in Panel C,the estimate γ 1 does not increase from medium–middle trades to medium–hightrades).
9We do not find a significant difference between the estimate γ 1 for medium–low trades and medium–middle trades. However, we find that the estimate γ 1 for medium–high trades is significantly greater (at the1% level) than for medium–middle trades.

Intraday Stealth Trading 19
Table 8 reports the results from estimating equation (3) using the averageprice change as the dependent variable. Similar to the findings in Table 7, we findthat the estimate γ 1 is monotonically increasing across trade sizes. Panel A reportsan inverse relation between price changes and volume for small trades, no significantrelation for medium trades, and a positive relation for large trades. The results arealso apparent in Panel B. In Panel C we find that small-trade price changes andmedium-trade price changes are negatively related to volume. However, the relationis significantly more negative for small trades (at the 1% level). We do not find thatlarge-trade price changes are statistically different from zero, though the estimateis positive. When examining the different medium-sized trades, we find that therelation between price changes and volume is monotonically increasing acrossincreasing medium trade sizes.
The results in Table 8 confirm the findings in Table 7 and support the notionthat stealth trading occurs less during periods of high volume. To our knowledge,we are the first to document that large trades drive the positive relation betweenprice changes and volume. Furthermore, the familiar U-shaped pattern in returns isapparent in large trades. We argue that ex ante theory predicts that informed traders,who do not wish to reveal their information to the market, will spread trades acrosstime (Kyle 1985) as well as concentrate their trading during periods of high volume(Admati and Pfleiderer 1988). Therefore, the distribution of informed trading willshift from smaller trades to larger trades during periods of high volume.
V. Conclusion
We determine which trades drive the familiar U-shaped pattern in intraday pricechanges documented by Wood, McInish, and Ord (1985) and Harris (1986). Afterinvestigating stocks in the different tick-size environments, we document that largetrades drive the U-shaped pattern in intraday returns as price changes from larger(smaller) trades are higher (lower) at the beginning and end of the day. The resultsare consistent with ex ante literature that predicts (1) that informed traders willexecute trades during periods of high volume to camouflage their trades (Admatiand Pfleiderer 1988) and (2) that profit-maximizing informed traders will optimizetheir trading strategy, dynamically spreading their trades over time to capitalize ontheir private information (Kyle 1985; Barclay and Warner 1993). Although someinformed traders are likely breaking up trades into smaller sizes so as to not revealtheir information, informed traders are less inclined to execute smaller trades duringperiods of high volume. Therefore, we document that the distribution of informedtrades shifts from smaller trades to larger trades during high beginning- and end-of-day volume.
The literature documents a persistent, positive relation between pricechanges and volume. We find that the relation between price changes and volume

20 The Journal of Financial Research
is increasing across trade sizes. Price changes from smaller trades are negativelyrelated to volume whereas price changes from larger trades are positively related tovolume, findings consistent with our predictions. We believe the data offer supportfor the hypothesis that profit-maximizing investors stealth trade less frequently dur-ing periods of high volume because volume provides a sufficient camouflage for theinvestor’s information. That is, informed investors use large trades when marketsare thick; however, it appears that informed investors stealth trade during periods oflow volume (Barclay and Warner 1993; Kyle 1985; Admati and Pfleiderer 1988).
References
Admati, A. and P. Pfleiderer, 1988, A theory of intraday patterns: Volume and price variability, Review ofFinancial Studies 1, 3–40.
Alexander, G. J. and M. A. Peterson, 2007, An analysis of trade-size clustering and its relation to stealthtrading, Journal of Financial Economics 84, 435–71.
Back, K. and H. Pedersen, 1998, Long-lived information and intraday patterns, Journal of Financial Markets1, 385–402.
Barclay, M. and T. Hendershott, 2003, Price discovery and trading after hours, Review of Financial Studies16, 1041–73.
Barclay, M. and J. B. Warner, 1993, Stealth trading and volatility: Which trades move prices? Journal ofFinancial Economics 34, 281–306.
Blau, B., B. Van Ness, and R. Van Ness, 2008, The optimal trade-size choice of short sellers: Theory andevidence, Working paper, Brigham Young University.
Cao, C., E. Ghysels, and F. Hatheway, 2000, Price discovery without trading: Evidence from the Nasdaqpreopening, Journal of Finance 55, 1339–65.
Chakravarty, S., 2001, Stealth trading: Which trader’s trades move prices? Journal of Financial Economics61, 289–307.
Chakravarty, S. and J. McConnell, 1997, An analysis of prices, bid/ask spreads and did/ask depths sur-rounding Ivan Boesky’s illegal trading in Carnation’s stock, Financial Management 26, 18–34.
Chakravarty, S. and J. McConnell, 1999, Does insider trading really move stock prices? Journal of Financialand Quantitative Analysis 34, 191–209.
Chan, K., W. Christie, and P. Schultz, 1995, Market structure and the intraday pattern of bid-ask spreads forNASDAQ securities, Journal of Business 68, 35–60.
Chung, K., B. Van Ness, and R. Van Ness, 1999, Limit orders and the bid-ask spread, Journal of FinancialEconomics 53, 255–87.
Copeland, T., 1976, A model of asset trading under the assumption of sequential information arrival, Journalof Finance 31, 1149–68.
Copeland, T., 1977, A probability model of asset trading, Journal of Financial and Quantitative Analysis12, 563–78.
Cornell, B. and E. Sirri, 1992, The reaction of investors and stock prices to insider trading, Journal ofFinance 47, 1031–59.
Foster, F., and S. Viswanathan, 1993, Variations in trading volume, return volatility, and trading costs:Evidence on recent price formation models, Journal of Finance 48, 187–211.
Gonzalo, J. and C. Granger, 1995, Estimation of common long-memory components in cointegrated systems,Journal of Business and Economic Statistics 13, 27–36.
Hansch, O. and H. Choe, 2007, Which trades move stock prices? Stealth trading revisited, Working paper,Pennsylvania State University.
Harris, L., 1986, A transaction data study of weekly and intradaily patterns of stock returns, Journal ofFinancial Economics 16, 99–118.

Intraday Stealth Trading 21
Hasbrouck, J., 1988, Trades, quotes, inventories and information, Journal of Financial Economics 22,229–52.
Hasbrouck, J., 1995, One security, many markets: Determining the contributions to price discovery, Journalof Finance 50, 1175–99.
Huang, R., 2002, The quality of ECN and NASDAQ market maker quotes, Journal of Finance 57, 1285–1319.
Hvidkjaer, S., 2006, Small trades and the cross-section of stock returns, Working paper, University ofMaryland.
Jain, P. and G. Joh, 1988, The dependence between hourly prices and trading volume, Journal of Financialand Quantitative Analysis 23, 269–83.
Karpoff, J., 1987, The relation between price changes and trading volume: A survey, Journal of Financialand Quantitative Analysis 22, 109–26.
Kyle, A., 1985, Continuous auctions and insider trading, Econometrica 53, 1315–35.Lo, A. and A. MacKinlay, 1990, When are contrarian profits due to stock market overreaction? Review of
Financial Studies 3, 175–206.Wood, R., T. McInish, and J. Ord, 1985, An investigation of transaction data for NYSE stocks, Journal of
Finance 40, 723–40.