Efficient and scalable graph view maintenance for deductive graph ...
Upload
hoangxuyenCategory
view
250download
1
ShareScope User Guide Page 1 of 13
Chapter 9 - Intraday Graph View
NOTE: For instructions on how to connect to ShareScope’s intraday feed, how to choose which feeds you want to receive, and how to backfill data for days that you have missed, make sure you read Chapter 3 – Receiving Data. We also recommend that you read Chapter 5 – Settings before this section.
What you will learn in this chapter:
How to read the Intraday Graph view.
How to change the style and time frame of the Intraday Graph view.
How to add technical analysis tools to help you try and predict future price
movement and trend changes.
How to add lines, shapes and text to a graph.
How to save up to 12 intraday chart configurations – called Graph Settings.
Chapter 9 – Intraday Graph
ShareScope User Guide Page 2 of 13
Intraday Graph View
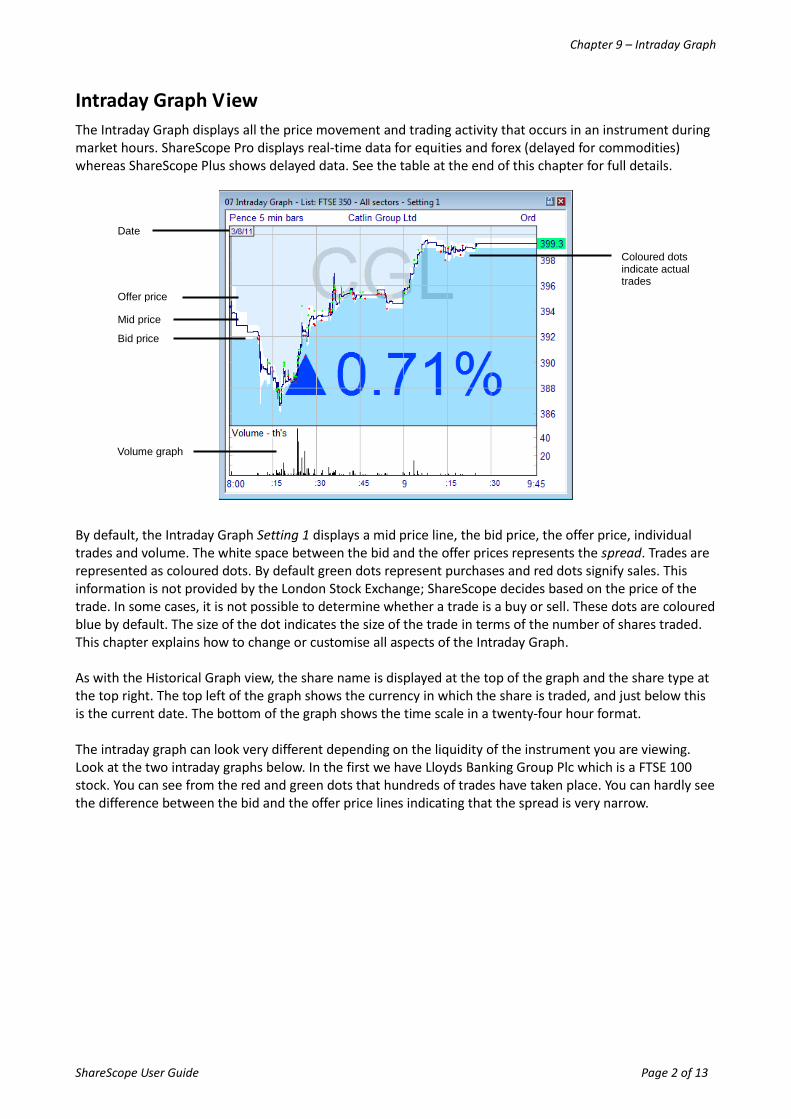
The Intraday Graph displays all the price movement and trading activity that occurs in an instrument during market hours. ShareScope Pro displays real-time data for equities and forex (delayed for commodities) whereas ShareScope Plus shows delayed data. See the table at the end of this chapter for full details.
By default, the Intraday Graph Setting 1 displays a mid price line, the bid price, the offer price, individual trades and volume. The white space between the bid and the offer prices represents the spread. Trades are represented as coloured dots. By default green dots represent purchases and red dots signify sales. This information is not provided by the London Stock Exchange; ShareScope decides based on the price of the trade. In some cases, it is not possible to determine whether a trade is a buy or sell. These dots are coloured blue by default. The size of the dot indicates the size of the trade in terms of the number of shares traded. This chapter explains how to change or customise all aspects of the Intraday Graph. As with the Historical Graph view, the share name is displayed at the top of the graph and the share type at the top right. The top left of the graph shows the currency in which the share is traded, and just below this is the current date. The bottom of the graph shows the time scale in a twenty-four hour format. The intraday graph can look very different depending on the liquidity of the instrument you are viewing. Look at the two intraday graphs below. In the first we have Lloyds Banking Group Plc which is a FTSE 100 stock. You can see from the red and green dots that hundreds of trades have taken place. You can hardly see the difference between the bid and the offer price lines indicating that the spread is very narrow.
Offer price
Mid price
Bid price
Volume graph
Coloured dots indicate actual trades
Date

Chapter 9 – Intraday Graph
ShareScope User Guide Page 3 of 13
LLOY
+6.76%
35.765
16:308:00
Lloyds Banking Group PLCPence 15 min bars Ord
15/9/11
36.0
35.6
35.2
34.8
34.4
34.0
33.6
9 12 15
ScopeShareChart (c) www.sharescope.co.uk Now look at the intraday graph for Alterian Plc below. This is a much less liquid stock: there are hardly any trades (dots) and consequently the price has changed only sporadically during the day (mostly market makers changing their quotes). You can also see that the spread is much wider and can vary significantly during the day.
ALN
+2.96%
82.625
16:308:00
Alterian PLCPence 15 min bars Ord
15/9/11 85
84
83
82
81
80
79
78
9 12 15
ScopeShareChart (c) www.sharescope.co.uk
Just like the Historical Graph view, you can customise all aspects of the Intraday Graph. See the Lloyds graph below now with candlesticks and MACD indicator – still using intraday price data.

Chapter 9 – Intraday Graph
ShareScope User Guide Page 4 of 13
LLOY
+7.19%
35.91
17:307:45
Lloyds Banking Group PLCPence 15 min bars Ord
15/9/11
35.5
35.0
34.5
34.0
33.5
0.3
0.2
0.1
9 12 15
13, 26 MACD (9 sig)
ScopeShareChart (c) www.sharescope.co.uk
You can add a wide range of technical analysis tools as well as your own lines, shapes and text. There are 12 Intraday Graph Settings for you to save your favourite configurations.
Displaying Multiple Days
By default, the Intraday Graph will display just the current day’s data but it is possible to display multiple days. You set the number of days to be displayed via the Graph design option on the context menu which is described in the next section. You can use your 12 Settings to save configurations with different numbers of days. The intraday graph below shows the last ten days trading history for Lloyds using 1 hour candlesticks.
35.9115/9/1114/9/1113/9/1112/9/119/9/118/9/117/9/11
17:307:45
6/9/11
Lloyds Banking Group PLC
7:45
5/9/11
7:45 7:45 7:45 7:45 7:45 7:45 7:45 7:45
Pence 1 hour bars Ord
2/9/11
35
34
33
32
31
30
29
0.8
0.4
0.0
-0.4
-0.8
13, 26 MACD (9 sig)
ScopeShareChart (c) www.sharescope.co.uk
IMPORTANT: The number of days you can display on an intraday graph, and the resolution of the data, depends on whether you are using tick-by-tick data or on demand data. You will need to choose which mode you wish to use.
Chapter 9 – Intraday Graph
ShareScope User Guide Page 5 of 13
Local tick database - uses data downloaded and saved on your PC via the intraday feed. This data includes tick-by-tick prices and including individual trades, but has a display limit of 10 days. Additionally, you will need a complete intraday data history for the period you want to display. If you have not been connected to the intraday feed for part of this period you will need to backfill the missing data.
On demand bar data (default mode) - this mode allows you display up to 120 days intraday history - including mid, bid, offer and trade volume. It downloads bar data on demand from our servers so you don't need a complete intraday data history saved on your PC. Note that the current day will ALWAYS use the local tick data even when On demand mode is enabled. See the shaded panel below for more information about On demand mode.
To choose which mode to use, right-click in the intraday graph and select Graph design. These options are in the top left of the dialog box.
Note: The Trades and quotes view, intraday alarms and sharescripts can only access local tick data.
On demand bar data On demand data is packaged into 30-second or 30-minute bars. ShareScope will decide which resolution to use based on your fixed period length (i.e. how much data needs to be downloaded). The fixed period length can be set from one minute to four hours. There may be a short delay whilst data is loaded.
Bar charts and analytics using on demand bar data On an intraday bar or candle graph, the main parameters are your fixed period length and your time period. For example, you might choose to display 1 hour candles (fixed period = 1 hour) over 60 days (time period = 60 days). The smaller your fixed period length and the longer your time period, the more bars are required to draw the graph.
If your fixed period length is 30 minutes or more then you can display up to 120 days.
If your fixed period length is less than 30 minutes you can only select a time period of 30 days or less. If you select a time period of more than 30 days, your fixed period length will be changed to 30 minutes. A message will be displayed when this happens.
Essentially, on charts with more than 30 days, 30-minute bar data will be used; otherwise 30-second bar data will be used. Each 30-second or 30-minute bar includes a mid open, mid high, mid low and mid close price. Bar data is aggregated to form bars of a longer fixed period length (e.g. two 30-second bars will be used to create a 1-minute bar).
Mid price charts using on demand bar data With these types of chart, the fixed period length is irrelevant. ShareScopeAlpha Terminal will simply choose whether to use high resolution or low resolution bars based on how many days are displayed on your chart. If you have 30 days or less, high resolution data will be displayed, otherwise low resolution data. Zooming into the chart will also switch between the two levels of data.
Bid/offer and trades using on demand data You can add bid/offer lines and trade data to on demand intraday charts. On demand data provides opening bid/offers and closing bid/offers for each bar. For charts using 30-second bar data, you will therefore see bid/offer prices for every 15 second period. For charts using 30-minute bar data, you will see bid/offer prices for every 15 minute period.
Trade volume is aggregated for each bar. Trade dots (if selected) are displayed at the volume-weighted average price (VWAP) for the period. If you choose to display OHLC bars or candles based on trade prices, the open, high, low and close will be based upon these VWAP prices.

Chapter 9 – Intraday Graph
ShareScope User Guide Page 6 of 13
You can also increase or decrease the number of days displayed on an ad hoc basis.
To add an extra day to the graph, hold down the SHIFT key and press the left arrow key. Repeat to add more days. Currently you can display a maximum of ten days.
To remove a day (the oldest), hold down the SHIFT key and press the right arrow key.
You can also scroll through the intraday history day by day by pressing the left and right arrow keys (to move backwards and forwards respectively). You can do this irrespective of how many days are displayed on the window.
NOTE: these keyboard shortcuts are provided so you can make temporary changes to the intraday graph. The changes will not affect other graphs using the same Setting and will not be saved. Additionally, if you view cycle to a different view and then return to the Intraday Graph the changes will not have been retained.
Customising the Intraday Graph
As with all of ShareScope views, the options available for customising the Intraday Graph can be found on the context menu. Right-click over the Intraday Graph to display the context menu. Alternatively, you’ll find it is the fourth item on the menu bar when an Intraday Graph is the active window.
Most of the charting tools on this menu have been described in Chapter 8 - Historical Graph View. For the remainder of this chapter we will concentrate on the Graph design dialog which is significantly different to that of the Historical Graph view.
The context menu options for Intraday graph

Chapter 9 – Intraday Graph
ShareScope User Guide Page 7 of 13
Graph Design
By selecting Graph design from the context menu, the following dialog box appears:
In the top left of the dialog you can see the options for the two intraday data modes described in the previous section.
The Dark default and Light default buttons allow you to display your intraday graph window with a white or black background and associated line colours. You can still modify individual colours once you have selected either of these options.
The Preview button will let you view any changes that you have made to the graph before exiting the graph design dialog box.
The Library facility allows you to save and restore individual graph settings which can be easily exchanged with other ShareScope users. To save a graph setting, click on the Library button and select Add current settings to library. You can then name and save this setting in your Library folder or save to another location. To restore a graph setting at a later date, click on the Library tab and select from the list or choose Open library folder.
Price Tab
This tab determines how price data is displayed on your graph. As we have seen in the introduction to this chapter, Intraday Graph Setting 1 displays the Mid, Bid and Offer price lines.
There are a number of different methods you can use for displaying the price action: Mid line, Close line, OHLC (open, high, low, close) bars, Candlestick, Point & Figure etc. If you only want to see the bid and offer, or trades, on the chart, select None. For the Close, OHLC and Candlestick-based options, you will also need to choose the period length on the Time tab. Use the Price colour button to choose the colour scheme for the option you have selected. For most chart types, you can choose to use the Mid price or Trade prices as your data source. When you select Point & Figure, the data source options change. If you select Mid price, the graph will follow the mid price. If you select OHLC (mid) or OHLC (trades) then the graph will draw Xs up to the high and Os down to the low for the period but will not draw price movements in between these levels once they have been achieved. Note that the time period is set on the Time tab.
The Graph Design dialog box

Chapter 9 – Intraday Graph
ShareScope User Guide Page 8 of 13
The Mid line and Close line can be displayed in two formats. If the Stepped line option is ticked, the mid and close price levels remain constant until a new price is received. Once the new price is received, the graph will step up or down to reflect this. If this option is not ticked then the line will move directly between each price. When you select Candlestick, the Stepped line option will change to Fill rising Candlesticks – a colour scheme preferred by some. Stepped: Not stepped:
36.975
9:158:00
Lloyds Banking Group PLC Ord
16/9/11
37.4
37.2
36.8
ScopeShareChart (c) www.sharescope.co.uk
36.975
9:158:00
Lloyds Banking Group PLC Ord
16/9/11
37.4
37.2
36.8
ScopeShareChart (c) www.sharescope.co.uk
You can add or remove the Offer and Bid prices by ticking/unticking the relevant boxes. To the right of these choices you have the option to change the line colour and style. You can also turn the background shading option on or off and choose the colours.
Previous day’s high/low/close will overlay the previous day’s high, low or closing price as a horizontal line on each day of the intraday chart. ShareScope will get prices from the historical price database. If this is not available (e.g. the historical data has not been updated or is not available for that share), then your intraday data will be used as a source instead. If the necessary data is not available from either source, the line will not be shown.
The Show opening price option will display the day’s opening price on the left-hand vertical axis of the graph. The Show latest option if ticked will display the latest mid price on the right-hand vertical axis of the graph. These options require you to have the left- and right-hand scales respectively displayed on the graph. These options are found on the Lines & Text tab. You can choose the highlight colour.
36.32
9:308:00
Lloyds Banking Group PLC Ord
37
16/9/11
37.2
36.8
36.4
37.2
36.8
ScopeShareChart (c) www.sharescope.co.uk

Chapter 9 – Intraday Graph
ShareScope User Guide Page 9 of 13
Trades Tab
This tab allows you to choose whether or not to display individual trades on the graph. Trades can be displayed as either a Line or Dots. If Line is selected then a line will be drawn joining the price of each trade. If you want to display separate lines for buys and sells, make sure the Buy/sell option is ticked. Trades that cannot be classified as buys or sells are displayed as dots.
Use the buttons to the right of these options to choose the dot size and colour. You can also tick the Show size option so that the size of each trade dot will correspond to the volume of that specific trade.
You can select whether to display All trades, automatic trades (ATs only) or only off-book trades (Non-ATs).
The Volume histogram can be displayed below the graph in two ways:
Trade based, which will add a volume figure for each individual trade as it happens.
Period based Bars, where the volume will be broken down into Fixed period lengths (which are selected on the Time tab).
If you have selected Bars a Volume signal line can be added to the display. This will add a moving average to the volume histogram based on the number of periods you enter in the periods box. You can choose which Method of moving average is used and you can change the colour and style of the line. By default, the volume bars are coloured black whether they are greater or lower than the previous traded volume, but you can change the colour to suit your preference. You can also tick the box to Colour by price movement.
In the bottom part of this tab, you can choose whether to show volume as the number of shares traded or the value of shares traded (number * price).
The Graph Design Trades tab
Chapter 9 – Intraday Graph
ShareScope User Guide Page 10 of 13
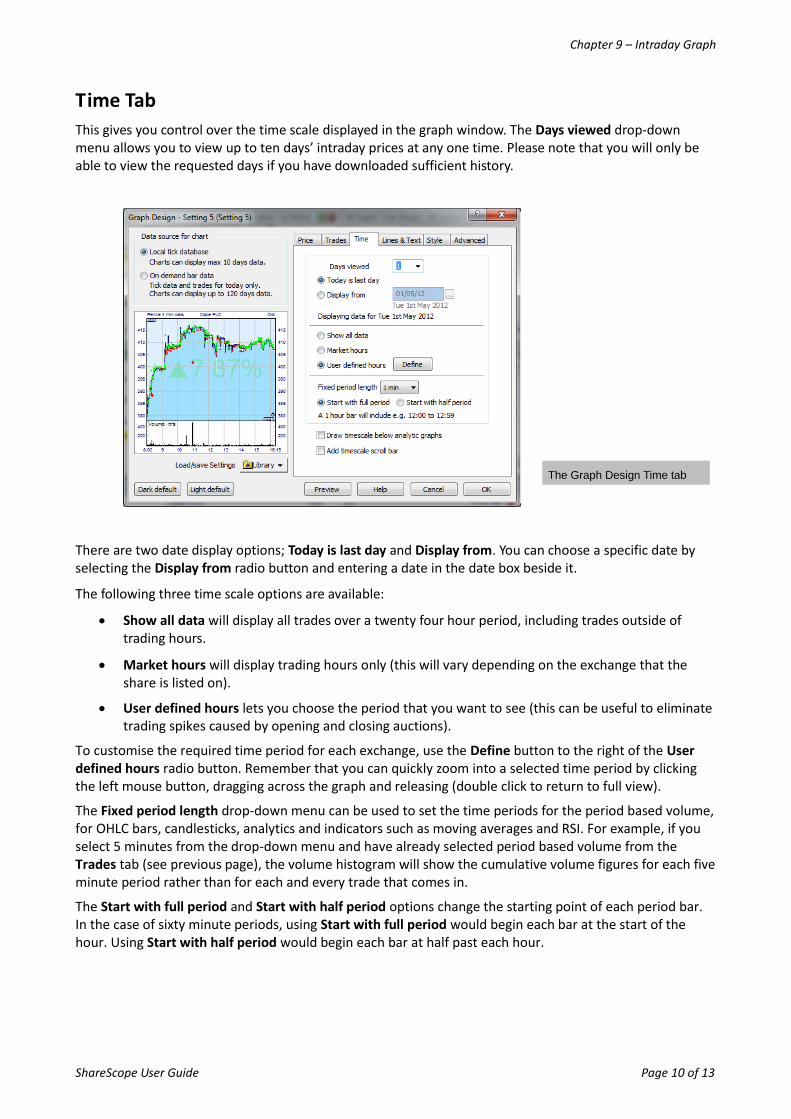
Time Tab
This gives you control over the time scale displayed in the graph window. The Days viewed drop-down menu allows you to view up to ten days’ intraday prices at any one time. Please note that you will only be able to view the requested days if you have downloaded sufficient history.
There are two date display options; Today is last day and Display from. You can choose a specific date by selecting the Display from radio button and entering a date in the date box beside it.
The following three time scale options are available:
Show all data will display all trades over a twenty four hour period, including trades outside of trading hours.
Market hours will display trading hours only (this will vary depending on the exchange that the share is listed on).
User defined hours lets you choose the period that you want to see (this can be useful to eliminate trading spikes caused by opening and closing auctions).
To customise the required time period for each exchange, use the Define button to the right of the User defined hours radio button. Remember that you can quickly zoom into a selected time period by clicking the left mouse button, dragging across the graph and releasing (double click to return to full view).
The Fixed period length drop-down menu can be used to set the time periods for the period based volume, for OHLC bars, candlesticks, analytics and indicators such as moving averages and RSI. For example, if you select 5 minutes from the drop-down menu and have already selected period based volume from the Trades tab (see previous page), the volume histogram will show the cumulative volume figures for each five minute period rather than for each and every trade that comes in.
The Start with full period and Start with half period options change the starting point of each period bar. In the case of sixty minute periods, using Start with full period would begin each bar at the start of the hour. Using Start with half period would begin each bar at half past each hour.
The Graph Design Time tab

Chapter 9 – Intraday Graph
ShareScope User Guide Page 11 of 13
Lines & Text Tab
This tab allows you to edit all the colours, text and lines in the graph window. Settings for the vertical axis can also be adjusted.
Use the Horizontal lines and Vertical lines sliders to adjust the size of the grid overlaying the graph. Use the White space slider to adjust the space between the graph and the window frame. As different stock exchanges operate on different time zones the Time Zone Label can be used to identify the time zone for a specific share. The label will display a code for the time zone and then the time difference in relation to Greenwich Mean Time (GMT).
The Day Separator option allows you to choose how data is displayed for multiple days (where more than one day’s data has been backfilled).
Style Tab
This tab allows you to change the background colour and add, remove and style the watermark. Watermarks that can be added include Epic Code, Last mid price, Mid price, Bid/Offer price etc.
Advanced Tab
This tab controls how analytics are displayed on the intraday graph.
The Graph Design Lines & Text tab

Chapter 9 – Intraday Graph
ShareScope User Guide Page 12 of 13
If you select the Use all data radio button, this will use all available data for each day. This includes price movements outside of normal market hours. If the Use Graph time radio button has been selected, the Analytics will be calculated using trading hours only. To define your own set period, select the User defined radio button and specify the required times from the adjacent boxes.
In the lower half of the Advanced tab you can choose to have the analytic indicators flow between days, if more than one day is displayed. For example, if you have two days of intraday prices displayed with a moving average, you may wish to see the moving average calculated continuously across day 1 and day 2, so that at the start of day 2 the moving average will still be using prices from the end of day 1. This will affect all the intraday indicators available in ShareScope Plus and Pro including moving averages, Bollinger bands, RSI and MACD indicators.
Other options include: No gap between analytic graphs and Show title on analytic graphs. These options are also available for historical graphs and are detailed in Chapter 5 of the ShareScope User Guide.
From time to time rogue trades will appear in the form of an unusually high or low price. This is often an error from a broker mis-entering a trade on their screen. The De-spike facility prevents this giving a false impression of the day’s trading. If you set the slider to “-” (by moving the slider to the far left) then ShareScope will not de-spike the graph at all and all trades will be shown. If you set the slider between “-” and “+”, ShareScope will remove from some to most of the rogue trades for you, although you will not get a ‘warts and all’ picture of the day’s trading.
Lines and Text (and Shapes)
You can add lines to the intraday graph window by selecting Lines & Text from the context menu, or by using the Shift key on the keyboard:
ACTION EFFECT
Press SHIFT key then click and drag the mouse on the graph.
A line is drawn in whichever direction you move your mouse.
Press the left SHIFT key and click on the graph. A horizontal line is drawn across the graph.
Press the right SHIFT key and click on the graph. A horizontal line is drawn starting from where the cursor is.
Lines you draw can be used to trigger an alarm. Right-click on a line and select Alarm on line. See the chapter on Alarms for more details on the types of alarms you can set.
The Graph Design Analytics tab
Chapter 9 – Intraday Graph
ShareScope User Guide Page 13 of 13
Under the Lines and Text sub menu there is also a choice of line studies available. These include Fibonacci Arc, Fibonacci Fan, Fibonacci Retracement, Gann Angles and Speed Resistance Lines.
Line studies and manually added lines can be drawn across more than one day.
You can add Shapes (circles, diamond shapes, arrows etc) to intraday graphs to mark or highlight areas of interest. To add a shape, right click on the graph screen, select Lines and Text and then Draw a Shape. Your cursor will then turn into a crosshair. Click on the graph where you want the shape to start and drag the mouse to position and size your shape.
To edit the shape or its settings right click inside the body of the shape and select Colour, style and settings.
To display a shape on more than one graph setting, right click on the shape and go to Select Display. You can choose to apply a shape to All Settings, Current setting only or Selected settings.
Add or Share Intraday Data
Each day’s intraday price history is stored in a unique file. You can archive these files and retrieve them when required to save on disk space. Files are stored in ShareScope’s /Data/RT directory and use the naming convention: histyymmdd.dat (e.g. hist110308.dat will include the intraday history for 8 March 2011). Simply drag and drop these files into your archive media. Note that intraday files will only include data for the periods when you were connected to the intraday feed. For whole days that you have backfilled, the file will be complete including the open and close values.
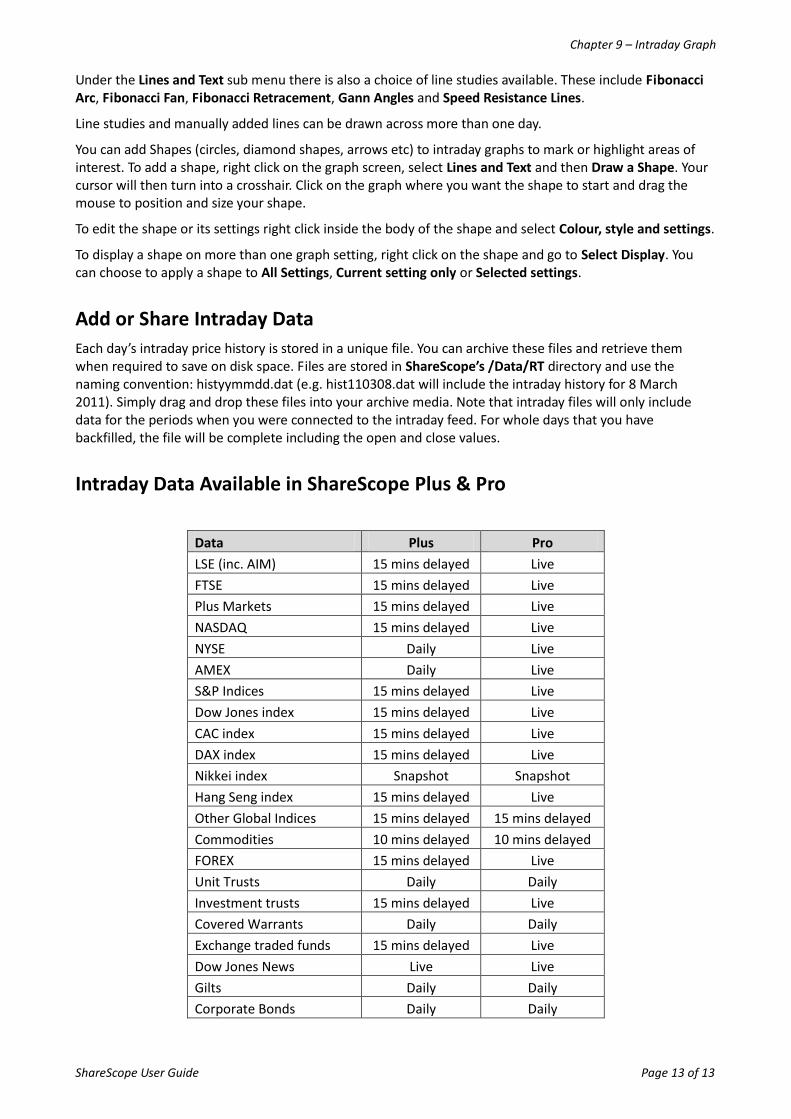
Intraday Data Available in ShareScope Plus & Pro
Data Plus Pro
LSE (inc. AIM) 15 mins delayed Live
FTSE 15 mins delayed Live
Plus Markets 15 mins delayed Live
NASDAQ 15 mins delayed Live
NYSE Daily Live
AMEX Daily Live
S&P Indices 15 mins delayed Live
Dow Jones index 15 mins delayed Live
CAC index 15 mins delayed Live
DAX index 15 mins delayed Live
Nikkei index Snapshot Snapshot
Hang Seng index 15 mins delayed Live
Other Global Indices 15 mins delayed 15 mins delayed
Commodities 10 mins delayed 10 mins delayed
FOREX 15 mins delayed Live
Unit Trusts Daily Daily
Investment trusts 15 mins delayed Live
Covered Warrants Daily Daily
Exchange traded funds 15 mins delayed Live
Dow Jones News Live Live
Gilts Daily Daily
Corporate Bonds Daily Daily