Intracellular potassium (K+) concentration decrease is not
15
Intracellular potassium (K + ) concentration decrease is not obligatory for apoptosis Sara I. Börjesson, Ulrika H. Englund, Muhammad H. Asif, Magnus Willander and Fredrik Elinder Linköping University Post Print N.B.: When citing this work, cite the original article. Original Publication: Sara I. Börjesson, Ulrika H. Englund, Muhammad H. Asif, Magnus Willander and Fredrik Elinder, Intracellular potassium (K + ) concentration decrease is not obligatory for apoptosis, 2011, Journal of Biological Chemistry, (286), 46, 39823-39828. http://dx.doi.org/10.1074/jbc.M111.262725 Copyright: American Society for Biochemistry and Molecular Biology http://www.asbmb.org/ Postprint available at: Linköping University Electronic Press http://urn.kb.se/resolve?urn=urn:nbn:se:liu:diva-68853
Transcript of Intracellular potassium (K+) concentration decrease is not

Intracellular potassium (K+) concentration
decrease is not obligatory for apoptosis
Sara I. Börjesson, Ulrika H. Englund, Muhammad H. Asif,
Magnus Willander and Fredrik Elinder
Linköping University Post Print
N.B.: When citing this work, cite the original article.
Original Publication:
Sara I. Börjesson, Ulrika H. Englund, Muhammad H. Asif, Magnus Willander and Fredrik
Elinder, Intracellular potassium (K+) concentration decrease is not obligatory for apoptosis,
2011, Journal of Biological Chemistry, (286), 46, 39823-39828.
http://dx.doi.org/10.1074/jbc.M111.262725
Copyright: American Society for Biochemistry and Molecular Biology
http://www.asbmb.org/
Postprint available at: Linköping University Electronic Press
http://urn.kb.se/resolve?urn=urn:nbn:se:liu:diva-68853
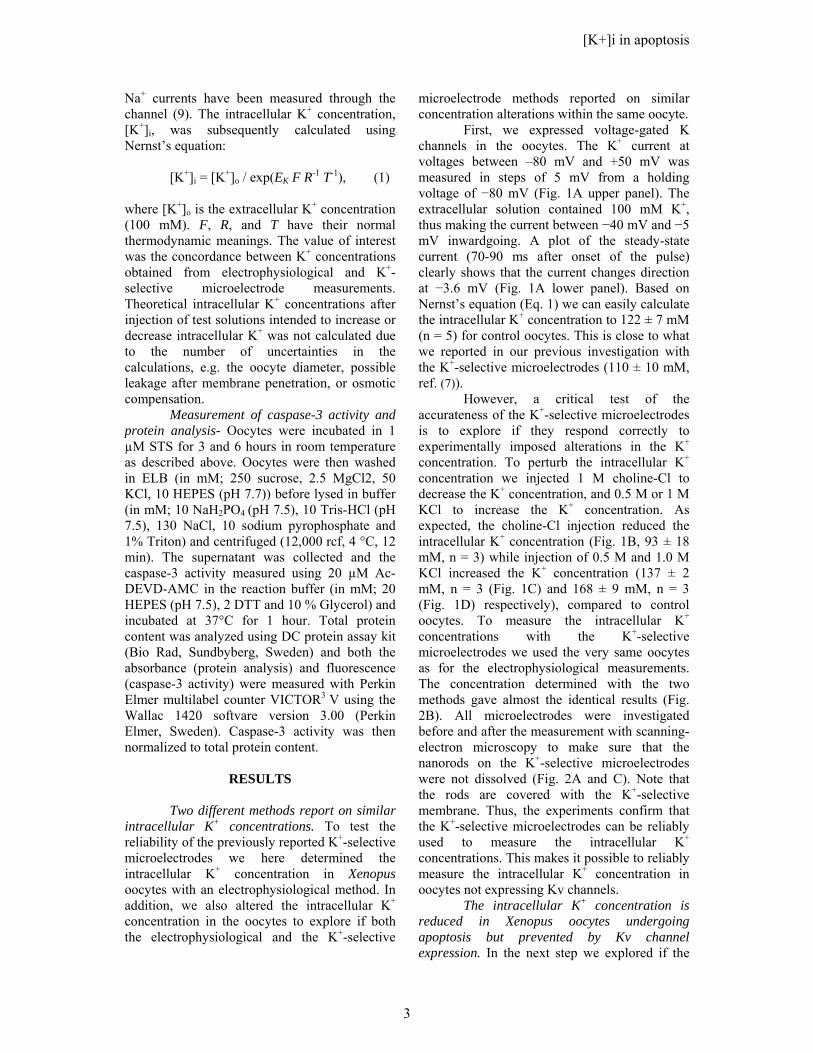
Intracellular K+ Concentration Decrease is not Obligatory for Apoptosis
Sara I. Börjesson1*, Ulrika H. Englund1*, Muhammad H. Asif2*, Magnus Willander2, Fredrik Elinder1
From Department of Clinical and Experimental Medicine, Division of Cell Biology1,
Department of Science and Technology, Campus Norrköping2, Linköping University, Linköping, Sweden.
* These authors contributed equally to this work
*Running title: [K+]i in apoptosis
Address correspondence to: Fredrik Elinder, Department of Clinical and Experimental Medicine, Division of Cell Biology, Linköping University, SE-581 85 Linköping, Sweden; Telephone: +46-
101038945; FAX: +46-101033192; E-mail: [email protected]
Keywords: Caspase-3 activation, Electrophysiology, Intracellular K+ concentrations, K+-selective microelectrode, Xenopus laevis oocytes
Background: Decrease in intracellular K+ is an early event during apoptosis. Results: Prevention of intracellular K+ decrease did not prevent activation of caspase-3. Conclusion: A decrease of K+ is not obligatory for cell death in Xenopus oocytes. Significance: The role of monovalent ions is important for understanding the mechanisms behind cell death. SUMMARY K+ efflux is observed as an early event in the apoptotic process in various cell types. Loss of intracellular K+ and subsequent reduction in ionic strength is suggested to release the inhibition of proapoptotic caspases. In this work, a new K+-specific microelectrode was used to study possible alterations in intracellular K+ in Xenopus laevis oocytes during chemically induced apoptosis. The accuracy of the microelectrode to detect changes in intracellular K+ was verified with parallel electrophysiological measurements. In concordance with previous studies on other cell types, apoptotic stimuli reduced the intracellular K+ concentration in Xenopus oocytes and increased caspase-3 activity. The reduction in intracellular K+ was prevented by dense expression of voltage-gated K (Kv) channels. Despite this, the caspase-3 activity was increased similarly in Kv-channel expressing oocytes as in oocytes not expressing Kv channels. Thus, in Xenopus oocytes caspase-3 activity is not dependent on the intracellular concentration of K+.
For many biological systems including the nervous system and muscle tissue, K+ plays an important role in setting the resting membrane potential (1). The intracellular K+ concentration is also important in programmed cell death (apoptosis), where altered intracellular ionic concentrations and subsequent cell shrinkage are early events (2). In Jurkat cells (3, 4) and lymphocytes (5), K+ efflux and a reduced intracellular K+ concentration release caspase inhibition, resulting in DNA degradation and eventually cell death (5). The activation of caspases is prevented by high extracellular K+ concentrations preventing K+ efflux (3). However, although K+ efflux is an early apoptotic event in several cell types, an alteration in intracellular ionic strength rather than the specific loss of K+ ions is suggested to be important (6).
We have previously designed a K+-selective ZnO-nanorod-covered microelectrode and reported on its stability when measuring intracellular K+ concentrations (7). The significant physiological role of altered intracellular K+, however, makes it important also to be able to detect changes in intracellular K+. The physical dimensions, biocompatibility, short response times, sensitivity, and ease of use of the microelectrode configuration make it potentially useful to study intracellular K+ alterations. The first aim of this work was therefore to study the possibility of using the K+-selective microelectrode to detect alterations in intracellular K+ concentrations in Xenopus oocytes following injection of various test solutions. Measurements were done in parallel
[K+]i in apoptosis
1

with electrophysiological measurements to verify the accuracy of detected concentrations. To explore if the K+ efflux reported during apoptosis in other cell systems is a general early apoptotic event also present in Xenopus oocytes, the second aim was to monitor changes in intracellular K+ during chemically induced apoptosis. A major finding was that a reduced intracellular K+ concentration was not obligatory for apoptosis.
EXPERIMENTAL PROCEDURES
Fabrication of K+-selective
microelectrodes- The K+-selective microelectrodes were fabricated as previously described (7). Briefly, ZnO nanorods were chemically grown on the tip of a borosilicate glass capillary in an aqueous solution of Zn(NO3)2
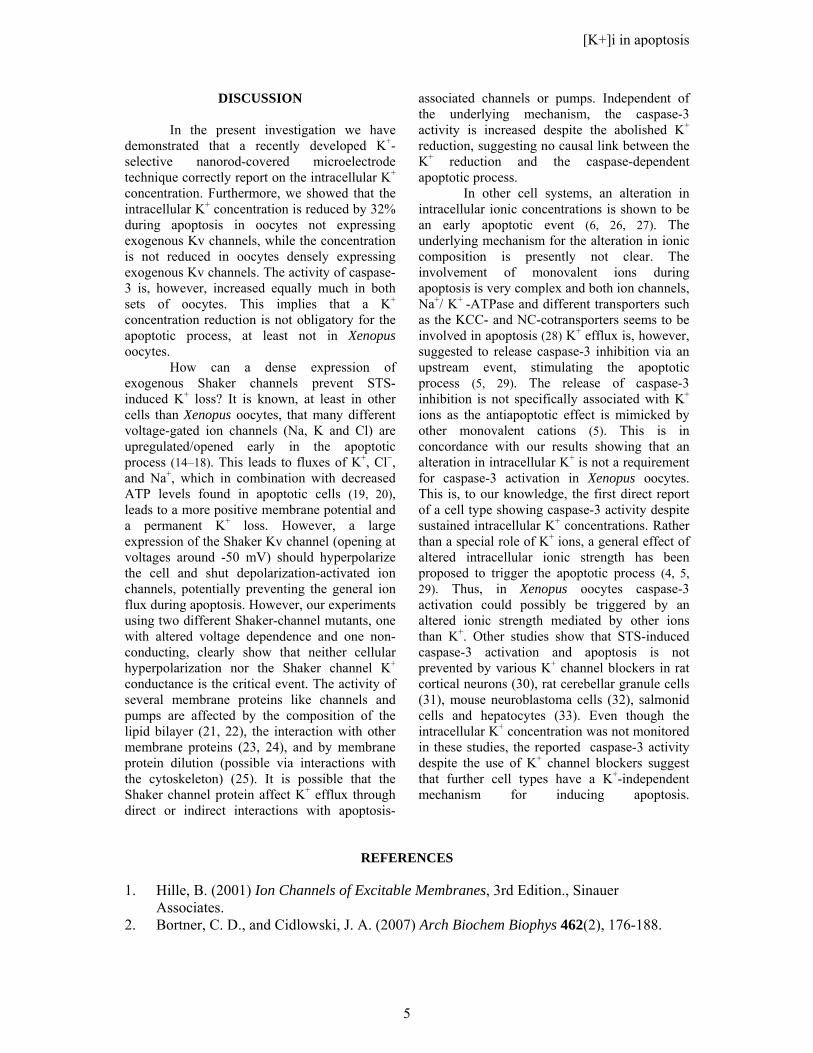
. 6H2O. Successful growth of ZnO nanorods was verified by field emission scanning-electron microscope as shown in Figure 2A. Subsequently, the glass tip was coated by a thin ionophore-containing polyvinyl-chloride membrane. The ionophore used was Valinomycin.
Preparation of Xenopus laevis oocytes- Xenopus laevis oocytes were dissected and stored as previously described (7, 8) For combined electrophysiological and K+-selective microelectrode measurements on the same cell, oocytes expressing cloned voltage-gated K (Kv) channels were used. cRNAs for the Shaker Kv channel with fast inactivation removed and for the R365C and W434F mutants were injected as described previously (8) and cRNA injected cells incubated for 3-6 days at 11ºC in an antibiotics supplemented modified Barth’s solution (7, 8) before measurements.
Chemical induction of apoptosis- To chemically induce apoptosis, native oocytes and oocytes expressing Shaker Kv channels were incubated at room temperature in antibiotics-supplemented modified Barth’s solution containing 1 µM staurosporine (STS). For electrophysiological measurements, oocytes were incubated in 1 µM STS for 1, 2, 3 and 6 hours. For measurements with K+-selective microelectrodes, the oocytes were incubated for 6 hours, and for caspase-3 measurements for 3 and 6 hours. For visual inspection of apoptotic signs, oocytes were incubated in 20 µM STS.
Combined electrophysiological and K+-selective microelectrode measurements- To evaluate the accuracy of the K+-selective
microelectrode data, the intracellular K+ concentration, [K+]i, was measured with both electrophysiological and K+-selective microelectrode techniques in the same oocyte. Oocytes expressing Shaker Kv channels were injected with 50 nL of either 1 M choline-Cl, 0.5 M KCl, or 1 M KCl using a Nanoject injector (Drummond Scientific Co., Broomall, PA). Each oocyte was then transferred to the electrophysiological setup and bathed in a high-K+ extracellular solution referred to as 100K (in mM: 89 KCl, 15 HEPES, 0.8 MgCl2, 0.4 CaCl2. pH set to 7.4 with KOH yielding a final K concentration of ~100 mM). The 100K solution was continuously added to the bath using a gravity-driven perfusion system. Two-electrode voltage clamp measurements of K+ currents were performed as previously described (8). The holding potential was set to −80 mV and currents achieved by stepping to potentials between −80 and +50 mV for 100 ms in 5 mV increments. The amplifiers capacitance and leakage compensation was used. Following the electrophysiological recordings the oocytes were then transferred to the K+-selective microelectrode setup (oocyte bathed in 100K) and the intracellular K+ concentration was determined by the potentiometric method utilising two electrodes: a ZnO nanorod K+-selective microelectrode as the working electrode and an Ag/AgCl microelectrode as the reference microelectrode. The electrochemical response of the K+ ions was measured with a Metrohm pH meter model 827 (Metrohm Nordic, Sweden). The electromotive force is related to the concentration of K+ ions in the intracellular electrolyte determined via a calibration procedure (as described previously, ref (7)). All oocytes were measured both electrophysiologically and with K+-selective microelectrodes within 25 minutes after test solution injection. The [K+]i was tested electrophysiologically to be stable for at least 25 minutes after 1 M KCl injection.
Analysis of electrophysiological data- The steady-state current at the end of the pulse (70-90 ms after onset of the pulse) was plotted versus the membrane voltage, generating a current versus voltage, I(V), curve. The K+ equilibrium potential (EK), assumed to be equal to the reversal potential for each oocyte, was determined as the voltage at which the direction of the current is reversed. This assumption is reasonable because the Shaker K channel is highly selective for K+ ions and no detectable
[K+]i in apoptosis
2
Na+ currents have been measured through the channel (9). The intracellular K+ concentration, [K+]i, was subsequently calculated using Nernst’s equation:
[K+]i = [K+]o / exp(EK F R-1 T-1), (1) where [K+]o is the extracellular K+ concentration (100 mM). F, R, and T have their normal thermodynamic meanings. The value of interest was the concordance between K+ concentrations obtained from electrophysiological and K+-selective microelectrode measurements. Theoretical intracellular K+ concentrations after injection of test solutions intended to increase or decrease intracellular K+ was not calculated due to the number of uncertainties in the calculations, e.g. the oocyte diameter, possible leakage after membrane penetration, or osmotic compensation.
Measurement of caspase-3 activity and protein analysis- Oocytes were incubated in 1 µM STS for 3 and 6 hours in room temperature as described above. Oocytes were then washed in ELB (in mM; 250 sucrose, 2.5 MgCl2, 50 KCl, 10 HEPES (pH 7.7)) before lysed in buffer (in mM; 10 NaH2PO4 (pH 7.5), 10 Tris-HCl (pH 7.5), 130 NaCl, 10 sodium pyrophosphate and 1% Triton) and centrifuged (12,000 rcf, 4 °C, 12 min). The supernatant was collected and the caspase-3 activity measured using 20 µM Ac-DEVD-AMC in the reaction buffer (in mM; 20 HEPES (pH 7.5), 2 DTT and 10 % Glycerol) and incubated at 37°C for 1 hour. Total protein content was analyzed using DC protein assay kit (Bio Rad, Sundbyberg, Sweden) and both the absorbance (protein analysis) and fluorescence (caspase-3 activity) were measured with Perkin Elmer multilabel counter VICTOR3 V using the Wallac 1420 softvare version 3.00 (Perkin Elmer, Sweden). Caspase-3 activity was then normalized to total protein content.
RESULTS
Two different methods report on similar intracellular K+ concentrations. To test the reliability of the previously reported K+-selective microelectrodes we here determined the intracellular K+ concentration in Xenopus oocytes with an electrophysiological method. In addition, we also altered the intracellular K+ concentration in the oocytes to explore if both the electrophysiological and the K+-selective
microelectrode methods reported on similar concentration alterations within the same oocyte.
First, we expressed voltage-gated K channels in the oocytes. The K+ current at voltages between –80 mV and +50 mV was measured in steps of 5 mV from a holding voltage of −80 mV (Fig. 1A upper panel). The extracellular solution contained 100 mM K+, thus making the current between −40 mV and −5 mV inwardgoing. A plot of the steady-state current (70-90 ms after onset of the pulse) clearly shows that the current changes direction at −3.6 mV (Fig. 1A lower panel). Based on Nernst’s equation (Eq. 1) we can easily calculate the intracellular K+ concentration to 122 ± 7 mM (n = 5) for control oocytes. This is close to what we reported in our previous investigation with the K+-selective microelectrodes (110 ± 10 mM, ref. (7)).
However, a critical test of the accurateness of the K+-selective microelectrodes is to explore if they respond correctly to experimentally imposed alterations in the K+ concentration. To perturb the intracellular K+ concentration we injected 1 M choline-Cl to decrease the K+ concentration, and 0.5 M or 1 M KCl to increase the K+ concentration. As expected, the choline-Cl injection reduced the intracellular K+ concentration (Fig. 1B, 93 ± 18 mM, n = 3) while injection of 0.5 M and 1.0 M KCl increased the K+ concentration (137 ± 2 mM, n = 3 (Fig. 1C) and 168 ± 9 mM, n = 3 (Fig. 1D) respectively), compared to control oocytes. To measure the intracellular K+ concentrations with the K+-selective microelectrodes we used the very same oocytes as for the electrophysiological measurements. The concentration determined with the two methods gave almost the identical results (Fig. 2B). All microelectrodes were investigated before and after the measurement with scanning-electron microscopy to make sure that the nanorods on the K+-selective microelectrodes were not dissolved (Fig. 2A and C). Note that the rods are covered with the K+-selective membrane. Thus, the experiments confirm that the K+-selective microelectrodes can be reliably used to measure the intracellular K+ concentrations. This makes it possible to reliably measure the intracellular K+ concentration in oocytes not expressing Kv channels.
The intracellular K+ concentration is reduced in Xenopus oocytes undergoing apoptosis but prevented by Kv channel expression. In the next step we explored if the
[K+]i in apoptosis
3
intracellular K+ concentration decreases in Xenopus oocytes during apoptosis, something that has been reported for other cells. Frog oocytes undergoing apoptosis show similar biochemical signs as other cells (10). Also in our hands, oocytes incubated for 2-3 hours in 20 µM of the apoptosis-inducing agent STS display the apoptotic sign of blurring of the otherwise sharp distinction between the animal and the vegetal pole upon visual inspection (data not shown). To obtain a better resolution of the early events in the apoptotic process, a lower STS concentration (1 µM) was used for subsequent experiments. This concentration does not induce as clear visual signs of apoptosis. Therefore, to objectively establish that apoptosis is induced, caspase-3 activity in oocytes after different exposure times of 1 µM STS was measured. Caspase-3 is a proapoptotic protein activated by both extrinsic and intrinsic apoptosis stimuli (11), and therefore a common reporter on cellular apoptosis. After 3 hours there was a doubling in caspase-3 activity and after 6 hours almost a 3-fold increase (Fig. 3). Thus, 3 hours exposure to 1 µM STS is enough to induce apoptosis in our experimental setting.
To measure the intracellular K+ concentration during apoptosis with the two different methods, we used oocytes densely expressing Shaker Kv channels. To our surprise, no alteration in the intracellular K+ concentration was detected with neither of the methods. After 6 hours in 1 µM STS the mean K+ concentrations were 118 ± 7 mM (n = 5) and 119 ± 3 mM (n = 5) for the K+-selective microelectrodes and for the electrophysiological measurements, respectively (Fig. 4A). No alteration occurred over time as detected electrophysiologically (Fig. 4B). Thus, either the oocytes behave differently from other cells previously reported to reduce the intracellular K+ concentration during apoptosis, or the dense Kv channel expression affects apoptosis making them less suitable for apoptosis studies. To explore this we used the K+-selective microelectrode technique to investigate if the intracellular K+ concentration is reduced in oocytes not expressing Kv channels. This revealed a robust 32% decrease in intracellular K+ (to 81 ± 8 mM, n = 5) after 6 hours in 1 µM STS (Fig. 4A).
A decrease in intracellular K+ concentration is not necessary for caspase-3 activation. Thus, we have shown that oocytes not expressing exogenous Kv channels increase
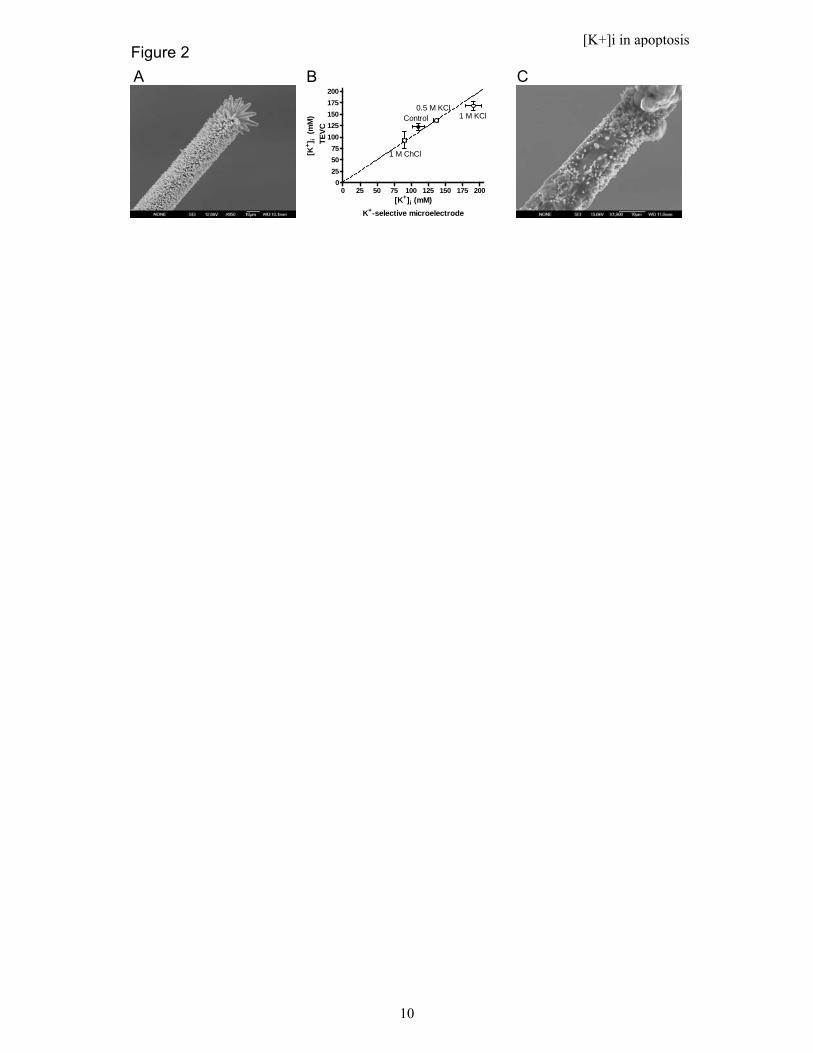
their caspase-3 activity 3-fold while decreasing the intracellular K+ concentration with 32%. Such a K+ concentration reduction has been suggested to trigger the caspase-3 activity (5). However, oocytes densely expressing Kv channels do not alter their intracellular K+ concentration during exposure to STS. There are two possible explanations for these differences: Either apoptosis is prevented by the dense Kv channel expression, or the K+ concentration reduction is not obligatory for the caspase-3 activation. To select between these two hypotheses we investigated the caspase-3 activity upon STS exposure in oocytes expressing Kv channels. The caspase-3 activation increased equally much in the two populations of oocytes (Fig. 5), suggesting that the intracellular K+ concentration reduction is not obligatory for the apoptotic process in Xenopus oocytes but rather an epiphenomenon.
Prevention of K+ loss is not dependent on active Kv channels. Why is the intracellular K+ concentration not reduced during apoptosis in oocytes expressing Shaker Kv channels? The resting voltage for control cells expressing Shaker Kv channels was -49 ± 3 mV (n = 6) compared to -7 ± 1 mV (n = 10) in cells not expressing heterogeneous Kv channels. One possibility is that the cellular hyperpolarization prevents K+ loss by keeping apoptosis-associated K+ channels activated by depolarization closed. We repeated the Kv channel experiments using a channel mutant opening at more positive voltages; Shaker R365C is activated at about 40 mV more positive voltages than Shaker WT (12). Expression of this mutant did not alter the resting membrane potential in the oocytes (−5 ± 1 mV (n = 5)) but still prevented STS-induced reduction in intracellular K+ (Fig. 6). The mean K+ concentration was 117 ± 4 mM (n = 6) before and 115 ± 4 mM (n = 8) after STS treatment.
To test if overexpression of active, K+ conducting, Kv channels, via another mechanism than hyperpolarization, is the key behind protection from K+ loss, we also expressed a non-conducting Shaker channel, Shaker W434F (13). Equimolar concentrations of this mutant as previously used for the conducting Shaker channel effectively prevented loss of intracellular K+ during apoptosis (Fig. 6). The mean K+ concentration was 122 ± 1 mM (n = 7) before and 121 ± 1 mM (n = 7) after STS treatment. Thus, the Shaker Kv channel does not require a K+-conducting pore to abolish K+ escape during apoptosis.
[K+]i in apoptosis
4
DISCUSSION
In the present investigation we have demonstrated that a recently developed K+-selective nanorod-covered microelectrode technique correctly report on the intracellular K+ concentration. Furthermore, we showed that the intracellular K+ concentration is reduced by 32% during apoptosis in oocytes not expressing exogenous Kv channels, while the concentration is not reduced in oocytes densely expressing exogenous Kv channels. The activity of caspase-3 is, however, increased equally much in both sets of oocytes. This implies that a K+ concentration reduction is not obligatory for the apoptotic process, at least not in Xenopus oocytes.
How can a dense expression of exogenous Shaker channels prevent STS-induced K+ loss? It is known, at least in other cells than Xenopus oocytes, that many different voltage-gated ion channels (Na, K and Cl) are upregulated/opened early in the apoptotic process (14–18). This leads to fluxes of K+, Cl−, and Na+, which in combination with decreased ATP levels found in apoptotic cells (19, 20), leads to a more positive membrane potential and a permanent K+ loss. However, a large expression of the Shaker Kv channel (opening at voltages around -50 mV) should hyperpolarize the cell and shut depolarization-activated ion channels, potentially preventing the general ion flux during apoptosis. However, our experiments using two different Shaker-channel mutants, one with altered voltage dependence and one non-conducting, clearly show that neither cellular hyperpolarization nor the Shaker channel K+ conductance is the critical event. The activity of several membrane proteins like channels and pumps are affected by the composition of the lipid bilayer (21, 22), the interaction with other membrane proteins (23, 24), and by membrane protein dilution (possible via interactions with the cytoskeleton) (25). It is possible that the Shaker channel protein affect K+ efflux through direct or indirect interactions with apoptosis-
associated channels or pumps. Independent of the underlying mechanism, the caspase-3 activity is increased despite the abolished K+ reduction, suggesting no causal link between the K+ reduction and the caspase-dependent apoptotic process.
In other cell systems, an alteration in intracellular ionic concentrations is shown to be an early apoptotic event (6, 26, 27). The underlying mechanism for the alteration in ionic composition is presently not clear. The involvement of monovalent ions during apoptosis is very complex and both ion channels, Na+/ K+ -ATPase and different transporters such as the KCC- and NC-cotransporters seems to be involved in apoptosis (28) K+ efflux is, however, suggested to release caspase-3 inhibition via an upstream event, stimulating the apoptotic process (5, 29). The release of caspase-3 inhibition is not specifically associated with K+ ions as the antiapoptotic effect is mimicked by other monovalent cations (5). This is in concordance with our results showing that an alteration in intracellular K+ is not a requirement for caspase-3 activation in Xenopus oocytes. This is, to our knowledge, the first direct report of a cell type showing caspase-3 activity despite sustained intracellular K+ concentrations. Rather than a special role of K+ ions, a general effect of altered intracellular ionic strength has been proposed to trigger the apoptotic process (4, 5, 29). Thus, in Xenopus oocytes caspase-3 activation could possibly be triggered by an altered ionic strength mediated by other ions than K+. Other studies show that STS-induced caspase-3 activation and apoptosis is not prevented by various K+ channel blockers in rat cortical neurons (30), rat cerebellar granule cells (31), mouse neuroblastoma cells (32), salmonid cells and hepatocytes (33). Even though the intracellular K+ concentration was not monitored in these studies, the reported caspase-3 activity despite the use of K+ channel blockers suggest that further cell types have a K+-independent mechanism for inducing apoptosis.
REFERENCES 1. Hille, B. (2001) Ion Channels of Excitable Membranes, 3rd Edition., Sinauer
Associates. 2. Bortner, C. D., and Cidlowski, J. A. (2007) Arch Biochem Biophys 462(2), 176-188.
[K+]i in apoptosis
5

3. Thompson, G. J., Langlais, C., Cain, K., Conley, E. C., and Cohen, G. M. (2001) Biochem J 357(Pt 1), 137-145.
4. Bortner, C. D., Sifre, M. I., and Cidlowski, J. A. (2008) J Biol Chem 283(11), 7219-7229.
5. Hughes, F. M., Bortner, C. D., Purdy, G. D., and Cidlowski, J. A. (1997) J Biol Chem 272(48), 30567-30576.
6. Arrebola, F., Cañizares, J., Cubero, M. A., Crespo, P. V., Warley, A., and Fernández-Segura, E. (2005) Apoptosis 10(6), 1317-1331.
7. Ali, S., Asif, M.H., Fulati, A., Nur, O., Willander, M., Brännmark, C., Strålfors, P., Englund, U., Elinder, F., and Danielsson, B. (2010) Nanotechnology, IEEE Transactions on PP(99), 1.
8. Börjesson, S. I., Parkkari, T., Hammarström, S., and Elinder, F. (2010) Biophys J 98(3), 396-403.
9. Heginbotham, L., and MacKinnon, R. (1993) Biophys J 65(5), 2089-2096. 10. Johnson, C. E., Freel, C. D., and Kornbluth, S. (2010) Cell Death Differ 17(1), 170-179. 11. Grütter, M. G. (2000) Curr Opin Struct Biol 10(6), 649-655. 12. Baker, O. S., Larsson, H. P., Mannuzzu, L. M., and Isacoff, E. Y. (1998) Neuron 20(6),
1283-1294. 13. Perozo, E., MacKinnon, R., Bezanilla, F., and Stefani, E. (1993) Neuron 11(2), 353-358. 14. Elinder, F., Akanda, N., Tofighi, R., Shimizu, S., Tsujimoto, Y., Orrenius, S., and
Ceccatelli, S. (2005) Cell Death Differ 12(8), 1134-1140. 15. Yu, S. P., Yeh, C. H., Sensi, S. L., Gwag, B. J., Canzoniero, L. M., Farhangrazi, Z. S.,
Ying, H. S., Tian, M., Dugan, L. L., and Choi, D. W. (1997) Science 278(5335), 114-117.
16. Akanda, N., Tofighi, R., Brask, J., Tamm, C., Elinder, F., and Ceccatelli, S. (2008) Cell Cycle 7(20), 3225-3234.
17. Dallas, M. L., Boyle, J. P., Milligan, C. J., Sayer, R., Kerrigan, T. L., McKinstry, C., Lu, P., Mankouri, J., Harris, M., Scragg, J. L., Pearson, H. A., and Peers, C. (2011) FASEB J 25(5), 1519-1530.
18. Wang, L., Xu, D., Dai, W., and Lu, L. (1999) J Biol Chem 274(6), 3678-3685. 19. Leist, M., Single, B., Castoldi, A. F., Kühnle, S., and Nicotera, P. (1997) J Exp Med
185(8), 1481-1486. 20. Izyumov, D. S., Avetisyan, A. V., Pletjushkina, O. Y., Sakharov, D. V., Wirtz, K. W.,
Chernyak, B. V., and Skulachev, V. P. (2004) Biochim Biophys Acta 1658(1-2), 141-147.
21. Börjesson, S. I., and Elinder, F. (2008) Cell Biochem. Biophys. 52(3), 149-174. 22. Colina, C., Cervino, V., and Benaim, G. (2002) Biochem. J. 362(Pt 1), 247-251. 23. Geering, K. (2006) Am. J. Physiol. Renal Physiol. 290(2), F241-250. 24. Vacher, H., Mohapatra, D. P., and Trimmer, J. S. (2008) Physiol. Rev. 88(4), 1407-
1447. 25. Vanagas, L., Rossi, R. C., Caride, A. J., Filoteo, A. G., Strehler, E. E., and Rossi, J. P. F.
C. (2007) Biochim. Biophys. Acta 1768(6), 1641-1649. 26. Bortner, C. D., Gómez-Angelats, M., and Cidlowski, J. A. (2001) J Biol Chem 276 (6),
4304-4314. 27. Barbiero, G., Duranti, F., Bonelli, G., Amenta, J. S., and Baccino, F. M. (1995) Exp Cell
Res 217(2), 410-418. 28. Yurinskaya, V. E., Rubashkin, A. A., and Vereninov, A. A. (2011) J. Physiol. (Lond.)
589(Pt 9), 2197-2211. 29. Cain, K., Langlais, C., Sun, X. M., Brown, D. G., and Cohen, G. M. (2001) J Biol Chem
276(45), 41985-41990.
[K+]i in apoptosis
6

30. Small, D. L., Tauskela, J., and Xia, Z. (2002) Neuroscience Letters 334(2), 95-98. 31. Hernández-Enríquez, B., Arellano, R. O., and Morán, J. (2010) Neuroscience 167(2),
298-311. 32. O’Reilly, N., Xia, Z., Fiander, H., Tauskela, J., and Small, D. L. (2002) Brain Res.
943(2), 245-256. 33. Krumschnabel, G., Maehr, T., Nawaz, M., Schwarzbaum, P. J., and Manzl, C. (2007)
Apoptosis 12(10), 1755-1768.
FOOTNOTES
This work was supported by the Swedish Research Council, the Swedish Heart-Lung Foundation, the Swedish Brain Foundation, the County Council of Östergötland, King Gustaf V and Queen Victoria´s Freemasons Foundation and the Swedish Society for Medical Research. Abbreviations: Kv channels, voltage gated K channels; STS, staurosporine; EK, K+ equilibrium potential; TEVC, two-electrode voltage-clamp.
FIGURE LEGENDS
Figure 1. Representative K+ current recordings (upper panels) and corresponding I(V) curves (lower panels) measured electrophysiologically in Kv channel-expressing Xenopus oocytes. A) Data for control oocytes and B-D) data for oocytes injected with indicated test solutions. The holding potential was set to −80 mV and test pulses ranging from −80 to + 50 mV. The current generated by stepping to 0 mV is marked in red in each recording.
Figure 2. Electrophysiological recordings and the K+-selective microelectrodes report similar intracellular K+ concentrations. A) Scanning-electrode image of the K+-selective microelectrode before intracellular measurements. B) Intracellular K+ concentrations in Kv channel-expressing Xenopus oocytes measured with electrophysiological (TEVC) and K+-selective microelectrode techniques. Data are expressed as mean values for control oocytes and oocytes injected with 50 nL of indicated test solutions. Error bars show SE. n = 3-5. C) Scanning-electrode image of the K+-selective microelectrode after intracellular measurements.
Figure 3. Caspase-3 activity in oocytes not expressing Kv channels. Measurements in control solution (n = 4), and after 3 (n = 4) and 6 hours (n = 3) exposure to 1 µM STS. The fluorescence after caspase-3 cleavage of Ac-DEVD-AMC was measured with photospectrometry and corrected with total protein level. Data show mean values ± SE.
Figure 4. Intracellular K+ concentrations in apoptotic Xenopus oocytes with and without dense expression of Kv channels. A) Intracellular concentration of K+ after 6 hours incubation in STS. Mean values for oocytes densely expressing Kv channels (RNA injected) measured with electrophysiological method (TEVC; n = 5) or K+-selective microelectrode method (n = 5). Intracellular K+ concentration in oocytes not expressing Kv channels (Not RNA injected) measured with the K+-selective microelectrode (n = 5). Data expressed as mean values ± SE. B) Intracellular K+ concentrations measured with electrophysiological method. Measurements made in control solution (n = 5), and after 1 (n = 3), 2 (n = 3), 3 (n = 3) and 6 hours (n = 5) of 1 µM STS exposure.
Figure 5. Caspase-3 activity in apoptotic oocytes expressing (RNA injected) or not expressing (Not RNA injected) Kv channels. The fluorescence after caspase-3 cleavage of Ac-DEVD-AMC was measured with photospectrometry and corrected with total protein level. Data show mean values ± SE.
[K+]i in apoptosis
7

Figure 6. Intracellular K+ concentrations in control and apoptotic Xenopus oocytes with dense expression of mutant Shaker Kv channels. R365C was measured with the electrophysiological method (TEVC) and the non-conducting W434F mutant with the K+-selective microelectrode method. STS treated cells were incubated for 6 hours in 1 µM STS. Data expressed as mean values ± SE.
[K+]i in apoptosis
8

[K+]i in apoptosis
9
0 25 50 75 100 125 150 175 2000
255075
100125150175200
1 M KCl0.5 M KCl
Control
1 M ChCl
[K+]i (mM)K+-selective microelectrode
[K+ ] i
(mM
)+ TE
VC
[K+]i in apoptosis
10

[K+]i in apoptosis
11

Control
STS 1h
STS 2h
STS 3h
STS 6h
0
50
100
150
[K+ ] i
(mM
)
0
50
100
150
RNA injected RNA injected Not RNA injected
K+-selective microelectrodeTEVC
[K+ ] i
(mM
)
WT WT
[K+]i in apoptosis
12
Control STS 3h STS 6h0
10000
20000
30000
40000
RNA injectedNot RNA injected
AMC
cou
nt
[K+]i in apoptosis
13

[K+ ] i
(mM
)
0
50
100
150
RNA injectedR365CTEVC?
RNA injectedW434F
K+-selectivemicroelectrode
ControlSTS treated
[K+]i in apoptosis
14