Intra-Pulse Rotational Spectroscopy for Pulsed-Nanosecond Discharges
16
Intra-Pulse Rotational Spectroscopy for Pulsed-Nanosecond Discharges B. T. Yee, J. E. Foster University of Michigan, Ann Arbor, MI 48109 S. J. Schneider, I. M. Blankson NASA Glenn Research Center, Cleveland, OH 44135
Transcript of Intra-Pulse Rotational Spectroscopy for Pulsed-Nanosecond Discharges

Intra-Pulse Rotational Spectroscopy for Pulsed-Nanosecond Discharges
B. T. Yee, J. E. Foster University of Michigan, Ann Arbor, MI 48109
S. J. Schneider, I. M. Blankson NASA Glenn Research Center, Cleveland, OH 44135

I. Abstract
• Measured 0-0 transition of the nitrogen second positive system in pulsed-nanosecond discharge (PND)
• Wrote computer program that: – Generated corrected spectra from ICCD images based on user input
– Simulated emissions for a given rotational temperature
– Conducted an automatic search for the correct rotational temperature of an input spectrum
• Measured the current and voltage characteristics for PND – Calculated energy transfer to plasma
– Estimated ion-pair cost
Figure 1 Hypersonic MHD energy bypass engine [1].
II. Motivation
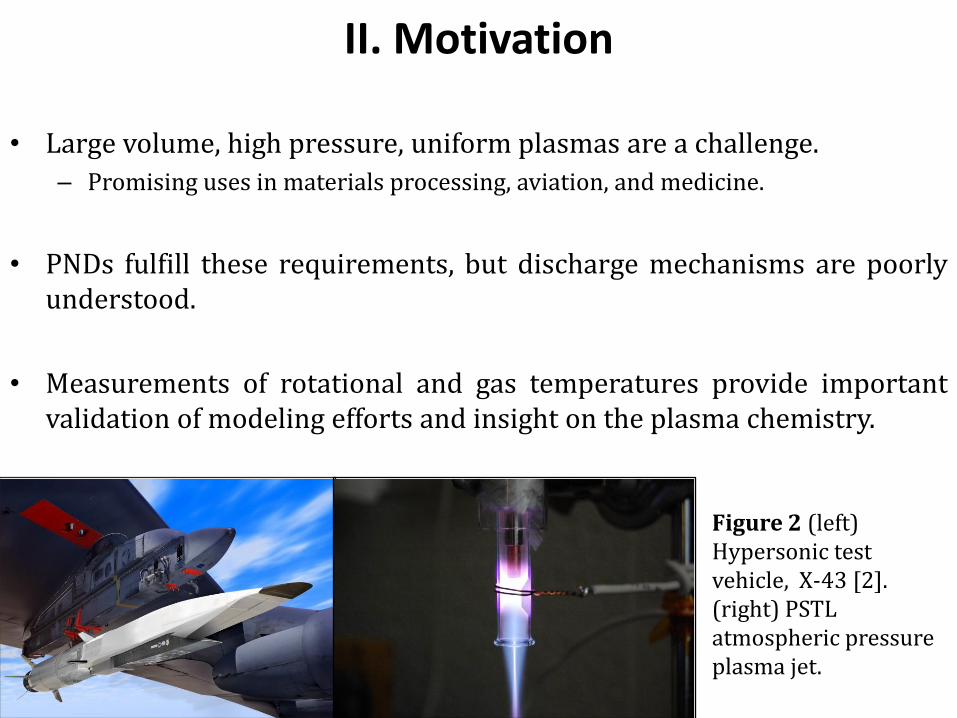
• Large volume, high pressure, uniform plasmas are a challenge.
– Promising uses in materials processing, aviation, and medicine.
• PNDs fulfill these requirements, but discharge mechanisms are poorly understood.
• Measurements of rotational and gas temperatures provide important validation of modeling efforts and insight on the plasma chemistry.
Figure 2 (left) Hypersonic test vehicle, X-43 [2]. (right) PSTL atmospheric pressure plasma jet.

III. Molecular Spectra
• Many degrees of freedom in comparison to atoms – Electric, vibrational, rotational
• Vibrational and rotational transitions occur in mid-infrared
• Coupled to electronic transitions yield manifolds or bands
• Band shapes reflect rotation energy distribution
Figure 3 Energy level diagram of the nitrogen molecule as illustrated by Herzberg [3].

IV. Second Positive System
• Transition from C3Πu -> B3Πg
– Initial state populated from X1Σu
• Assumed that rotational energy distribution is preserved in excitation
• Features three branches: P, Q and R
• Commonly used for estimation of neutral gas temperature [4] Figure 4 (top) ICCD image of nitrogen’s
second positive system. (bottom) Collapsed version of spectra, processed for background.

V. Previous Work
• High resolution (FWHM 0.05 nm) spectroscopy of first negative system in nitrogen [5]
• Required long acquisition times, > 30 minutes
• Time-averaged rotational temperature of 900 K
Figure 5 Previous measurements of nitrogen’s first negative system using a photomultiplier tube [5].

VI. Line Shifts
• Term values obtained from semi-empirical formula, first suggested by Budó [6] and later Herzberg,
• Represent spin coupling, transition from Hund’s case (a) to (b)
• Updated constants obtained from Laher and Gilmore [7]
J
Wavelength (m)
Figure 6 Fortrate diagram of the second positive system of nitrogen.
421;2
4
2;1
4
21;0
2321
2141
2121
JDZZJJBF
JDZJJBF
JDZZJJBF
vvJ
vvJ
vvJ
129
413
1
143
44
1
2
1
JJYYZ
Z
JJYYZ
vv
vv

VII. Intensities
• Intensity distribution determined from input temperature
• Boltzmann distribution assumed for population of states
• Honl-London factors used to scale individual branches [3]
Inte
nsi
ty (
a.u
.)
Wavelength (nm)
Figure 7 (left) Unbroadened intensities of the 0-0 transition for the second positive system. (right) Spectrum broadened by a Gaussian slit function.
Wavelength (nm)
Inte
nsi
ty (
a.u
.)

VIII. Temperature Matching
• Program searches predefined range for a given interval
• Surface error at each temperature used as measure of match similar to program developed by Chelouah [8]
• Zero crossing of a quintic fit used to determine “correct” temperature
Wavelength (nm) Temperature (K)
Surf
ace
Err
or
(a.u
.)
Inte
nsi
ty (
a.u
.)
Figure 8 (left) Surface errors for various simulated rotational temperature profiles. (right) Comparison of simulated spectrum to actual spectrum.

IX. Experimental Setup
• Pulses of 8.6 kVpp (FWHM 5 ns) at 20 + 0.005 kHz
• 21.3 – 21.5 Torr of air (equivalent to 75,000 ft above sea level)
• Spex 500M monochromator with 2400 g/mm grating (300 nm blaze) coupled to LaVision Picostar HR ICCD
Figure 9 (left) Image of the discharge in operation. (right) Test setup with ICCD, monochromator and vacuum chamber.

X. Intra-Pulse Rotational Temperatures
• Rise in temperature essentially a step function
• Significant uncertainty after 25 ns, mostly due to decreasing signal
• Temperature saturates at approximately 900 K
• Apparent decline in rotational temperature after 35 ns
Tem
per
atu
re (
K)
Time (s)
Figure 10 Best match for rotational temperature (gray) and a smoothed curve using a Hanning window (red).
XI. Current and Voltage
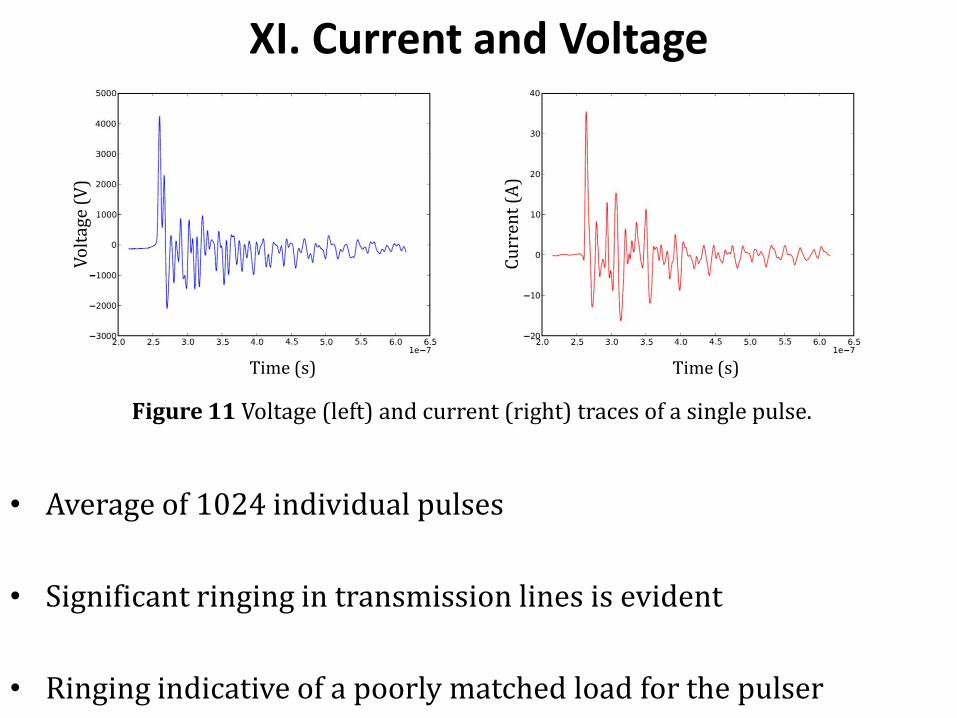
• Average of 1024 individual pulses
• Significant ringing in transmission lines is evident
• Ringing indicative of a poorly matched load for the pulser
Time (s) Time (s)
Cu
rren
t (A
)
Vo
ltag
e (V
)
Figure 11 Voltage (left) and current (right) traces of a single pulse.

XII. Energy Transfer
• Energy transferred to plasma equal to time integral of the current and voltage multiplied
• Estimated energy transferred per pulse: 0.6 mJ – Low amount compared to pulser specifications: 5 – 10 mJ
• Previous measurements of electron density, 2 x 1011 cm-3
– Ion-pair energy cost of 305 eV
– Ionization energy of air approximately 34 eV
Distance from Cathode (m)
Vel
oci
ty (
m/s
) Figure 12 Particle-in-cell simulation of PND in nitrogen showing large collisionality.

XIII. Conclusions
• Verified previous rotational temperature measurements
• Almost immediate rise in rotational temperature
• Measured relatively large energy cost per ion-pair (lower efficiency)
• Created flexible framework for interpretation of rotational spectra

XIV. Future Work
• Improve calibration of spectroscopy system
• Optimize collection optics for spatially resolved measurements
• Adjust monochromator for vibrational spectra
• Expand framework for vibrational temperature matching
• Estimate energy transferred to ro-vibrational states in PNDs
• Determine conditions for most efficient ion-pair production

XV. References
1. S. J. Schneider, H. Kamhawi and I. M. Blankson, 47th Aerospace Sciences Meeting, Orlando, FL; AIAA: Reston, 2009; 2009-1050.
2. Pratt & Whitney Rocketdyne, http://www.pwrhypersonics.com/, accessed: Oct. 3, 2010.
3. G. Herzberg, J.W.T. Spinks, Molecular Spectra and Molecular Structure Vol. I, Malabar, FL: Krieger Publishing, 1989.
4. C.O. Laux, T. Spence, C. Kruger, et al., “Optical diagnostics of atmospheric pressure plasmas,” Plasma Sources Sci. and Tech. 12, 2003.
5. B.T. Yee, J.E. Foster, S.J. Schneider and I.M. Blankson, “New Diagnostic Capabilities for NASA’s Pulsed Nanosecond Discharge,” Ann Arbor, MI, 1st Annual MIPSE Symposium, Sept. 29, 2010.
6. A. Budó, Zeeman Verh. (1935), 135. 7. R. Laher and F. Gilmore, “Improved Fits for the Vibrational and Rotational
Constants of Many States of Nitrogen and Oxygen,” Alexandria, VA: Defense Nuclear Agency, 1990.
8. A. Chelouah, E. Marode, G. Hartmann, et al., “A new method for temperature evaluation in a nitrogen discharge,” J. of Phys. D: Appl. Phys. 27, 1994.
Acknowledgements: This project is supported by the NASA GSRP Training grant, #NNX-09AK95H.