INTOSAI WORKING GROUP ON IT AUDIT Guideline on Key ... No. 11 WGITA/KPI Audit... · Guideline on ....
71
INTOSAI WORKING GROUP ON IT AUDIT Guideline on Key Performance Indicators Methodology for Auditing IT Programs February 2013 1
Transcript of INTOSAI WORKING GROUP ON IT AUDIT Guideline on Key ... No. 11 WGITA/KPI Audit... · Guideline on ....

INTOSAI WORKING GROUP ON IT AUDIT
Guideline on Key Performance Indicators Methodology
for Auditing IT Programs
February 2013
1

2
Table of Content
PART 1 PREFACE................................................................................................................................ 1
1.1 Background ............................................................................................................................... 1 1.2 Introduction............................................................................................................................... 2
PART 2 AUDIT PLAN.......................................................................................................................... 5 2.1 Understand the audited entity by collecting the background information................................. 5 2.2 Identify IT programs to be audited............................................................................................ 6 2.3 Define audit objectives and scope............................................................................................. 7 2.4 Prepare audit program by selecting appropriate and relevant Key Performance Indicators to assess............................................................................................................................................... 8 2.5 The audit structure and method to utilize the selected Key Performance Indicators. ............. 11
PART 3 AUDIT IMPLEMENTATION ............................................................................................. 13 3.1 Decision .................................................................................................................................. 13
3.1.1 Compliance with the Laws........................................................................................... 13 3.1.2 Feasibility Study........................................................................................................... 14 3.1.3 Participation in Decision .............................................................................................. 15
3.2 Requirement Analysis ............................................................................................................. 16 3.2.1 Organization target ....................................................................................................... 16 3.2.2 Core business coverage ................................................................................................ 17 3.2.3 Response/change .......................................................................................................... 17
3.3 Design / Planning .................................................................................................................... 18 3.3.1 Requirement coverage.................................................................................................. 18 3.3.2 Time Limit.................................................................................................................... 19 3.3.3 Capacity Planning and Resource Provisioning ............................................................ 20 3.3.4 Cost Estimation ............................................................................................................ 22 3.3.5 IT risks ......................................................................................................................... 24
3.4 Procurement ............................................................................................................................ 26 3.4.1 Selection for partner or supplier................................................................................... 26 3.4.2 Cost control .................................................................................................................. 27 3.4.3 Process Control ............................................................................................................ 28 3.4.4 Code control ................................................................................................................. 29 3.4.5 Outsourcing.................................................................................................................. 29 3.4.6 Quality Control............................................................................................................. 30 3.4.7 Testing .......................................................................................................................... 31 3.4.8 Training ........................................................................................................................ 32 3.4.9 Upgrading..................................................................................................................... 33
3.5 Product .................................................................................................................................... 33 3.5.1 User satisfaction ........................................................................................................... 33 3.5.2 Price ............................................................................................................................. 34 3.5.3 Delivery........................................................................................................................ 34 3.5.4 Performance ................................................................................................................. 35
3

4
3.5.5 Integration .................................................................................................................... 36 3.5.6 Technology applicability .............................................................................................. 37
3.6 Maintenance ............................................................................................................................ 38 3.6.1 Follow the management rules ...................................................................................... 38 3.6.2 Incident management ................................................................................................... 39 3.6.3 System Usability .......................................................................................................... 42 3.6.4 Availability ................................................................................................................... 43 3.6.5 Maintenance cost.......................................................................................................... 45 3.6.6 Website ......................................................................................................................... 46 3.6.7 Monitoring ................................................................................................................... 48 3.6.8 Change Management.................................................................................................... 49 3.6.9 Data Center................................................................................................................... 52
3.7 Security ................................................................................................................................... 53 3.8 Backup .................................................................................................................................... 55 3.9 Service..................................................................................................................................... 56
3.9.1 Service request ............................................................................................................. 56 3.9.2 Service response........................................................................................................... 57 3.9.3 Service satisfaction....................................................................................................... 59
3.10 Effectiveness ......................................................................................................................... 60 3.10.1 Coverage of the core business.................................................................................... 60 3.10.2 Benefit ........................................................................................................................ 62 3.10.3 Internal Management optimizing ............................................................................... 63 3.10.4 Public Service............................................................................................................. 64
3.11 Others .................................................................................................................................... 64 PART 4 AUDIT REPORT .................................................................................................................. 66
4.1 Form and content .................................................................................................................... 66 4.2 Conclusion .............................................................................................................................. 67

PART 1 PREFACE 1.1 Background The project “Key Performance Indicators Methodology for Auditing IT Programs” was approved in the 19th meeting of the INTOSAI Working Group on IT Audit (WGITA) in April 2010. SAI China volunteered to be the team leader of the project. SAI Bhutan, Ecuador, Japan, Kuwait, Malaysia, Pakistan, Poland, Russia and USA are team members. During the 19th meeting of the INTOSAI WGITA in April 2010, Chair SAI India organized the discussion for the future projects. The project of 'Development of IT Performance Indicators' was proposed by SAI Bhutan and volunteered by SAI Bhutan, India, Japan and Pakistan. The project of 'Performance measures of IT solutions implemented in government organizations' was proposed by SAI Pakistan and volunteered by SAI Japan, Lithuania, Oman, Pakistan and South Africa. The project of 'Index System about IT Performance Audit' was proposed by SAI China and volunteered by SAI China. Finally INTOSAI WGITA approved the above three projects into one. Project team decided a new name for the project, 'Key Performance Indicators Methodology for Auditing IT Programs'. SAI China volunteered to be the team leader of the new project. In February 2011, the team prepared the beta KPI database with 392 indicators in the 20th meeting of the INTOSAI WGITA. In February 2012, the team delivered the KPI database with 712 indicators in the 21st meeting of the INTOSAI WGITA. In December 2012, SAI China made the draft guideline and mailed to other team members for comments. In March 2013, SAI China delivered the modified guideline to Chair India for comments among the team members of WGITA. In April 2013, the final guideline and the KPI database were submitted for approval in the 22nd meeting. When drafting the guideline, the team made reference on supplementary materials from sources such as INTOSAI training materials, ISACA, COBIT, ITIL and others. To avoid ambiguity and confusion to newcomers, the guideline was drafted with simplicity and conciseness.
Similar to other guidelines issued by INTOSAI WGITA, this guideline is also a living document. Continuous efforts should be made to update its contents to keep in pace with the technological and environmental change to maintain its relevancy and acceptability.
The guideline was composed by Osama A. Al-Fares from SAI Kuwait, Mr. WANG Zhiyu, Mr. YANG Yunyi, Ms. YANG Li, Mr. ZHENG Wei, Mr. FENG Guofu, Mr. YU Xiaobing, Mr. LV Tianyang from SAI China. Based on the comments from Mr. Tomohiro Shinozaki (SAI Japan), Mr. Osama A. Al-Fares (SAI Kuwait) and Mr. Madhav Panwar (SAI USA), the team revised the guideline. The team would also like to express its thanks to the INTOSAI Working Group on IT Audit for giving the opportunity to carry out this project.
1

1.2 Introduction Performance audit or performance measurements is an audit type that is concerned in understanding or seeing the extent of meeting the auditee’s goals through its IT investments that are put in the form of programs, infrastructure, systems and services. This type of audit can be applied to multiple levels within the structure of an organization to capture different type of information relevant to the area being measured. Additionally, such type of audit can not only be applied once but can be a benchmarking tool for continuous measurement, assurance and alignment. The benefits of performance audit is essential to identify areas in an IT investment that have potential for improvement along with understanding how well an investment is assisting an organization in achieving its goals. With this type of knowledge, fund allocation to IT becomes much more efficient and optimized. Additionally, performance audit also aids IT management to continuously improve an IT investment from the technical point of view to make it more efficient and effective in meeting its desired goals. As IT programs have some characteristics such as huge investment, long term for construction, and contact with the public, high failure rate etc. So they have been noted by all SAIs and become the target of performance audit. When auditors face an IT program to assess its economy, efficiency and effectiveness, they should consider determine and select indicators to evaluate its performance. Traditionally, performance auditing of information technology only focused on program management and system controls. There was not a guideline for auditors to follow. Without the guideline auditors would feel harder to do the performance audit of IT programs. It is the reason why we would like to participant this project. Actually the Key Performance Indicators could be collected from the auditors' practical experience, practice of professional consultant and academic research on the performance for IT programs. Content overview The guideline comprises of four parts, Part 1 on preface, Part 2 on Audit Plan, Part 3 on Audit Implementation and Part 4 on Audit Report. In the first part, the guideline gives the brief information of the background, the objectives and the progress. In the second part, the guideline introduces that audit plan could be comprise of four steps. Auditors should understand the audited entity by collecting background information firstly, and then identify IT programs to be audited, and then define audit objectives and scope, finally prepare audit program. During the whole process, auditors could select the appropriate and relevant Key Performance Indicators to make the assessment.
2

In the third part, the guideline introduces that audit implementation could involve several phrases. These phrases involve decision making process, requirement analysis process, design or planning process, procurement or development process, product, maintenance process, security management, backup and disaster recovery process, service and effectiveness. In the fourth part, the guideline introduces the form, content, conclusion of the audit report. The characteristic of SAI's performance auditing of IT programs Nowadays, SAI auditors could have different understanding in the course of evaluating the performance of IT programs. The main characteristics are as follows. 1. Audit work could be performed before the implementation, during the implementation and after the implementation of IT programs. According to the implementation cycle of IT programs, the audit before the implementation of an IT program mainly aims at judging whether it should be invested. The audit during the implementation is to judge whether the implementing process completes as planned. The audit after the implementation focuses on judging whether the whole program succeeds or not. Due to the limitation of factors as human resource, time and assigned duties, SAI's auditors often perform audit after the implementation of IT programs. 2. Performance audit approach can vary in the way it is designed, positioned and continuously practiced in each organization according to many factors. The most important factor is that performance audit is advocated by top management which sets the extent of carrying out the audit to a broader set of layers in the organization. Other elements those should be taken into consideration are issues surrounding the importance of an IT investment, value of IT to the organization and the availability of resources to support such type of audit. 3. Measuring the contribution or impact of IT on the general organizational performance is better approached in a gradual manner. Thus it is seen more appropriate to implement performance measurement as a continuous maturing process within the organization. Fundamentally, this requires commitment from the management backed up with the needed technical experience in building the measurements and developing them. Naturally, this means that strong IT abilities are a key factor in providing quality services and products in order to identify the IT body within the organization as being capable and credible enough to contribute to the more strategic measurements or performance audits. The common practice is that performance measurement is started by being implemented to measure existing internal IT services and operations with the focus on areas like Compliance with standards, design and cost estimation, Achieving satisfactory product performance and user satisfaction, Maintaining infrastructure availability, continuity and security. As the measurement process develops, it will then cover more
3

areas as well as being developed to link to higher level goals and measurements in the business layer and strategic level. Requirement of Indicators' selection Evaluating indicators can embody the purpose of evaluation and reflect the problems which an estimator wants to find. Owing to the characteristics of performance evaluation of IT programs based on the auditing perspective, auditors have certain demands on the selection of evaluating indicators. 1. Evaluating indicators should be widely accepted. Because evaluating results are required to withstand the queries of audited entity, the selected evaluating indicators should be widely accepted by all sides and should not be debatable. This is easily done by making sure that the selected indicators clearly demonstrate cause and effect. 2. The data source of evaluating indicators should be accessible. Because evaluating results need to withstand queries of audited entity, data in the audit report should origin from the direct evidence or auditors' own analysis results. The indicators need to be accessible and analyzable. 3. The calculational methods of evaluating indicators should be realistic and relatively simple. Simple calculational methods of evaluating indicators are basic to their acceptability and operability. Too complicated indicators may tend to arouse the disputes between auditors and the audited entity.
4. The indicators need to be indicative to assist in reflecting the extent of success or failure of an IT investment. The indicators need to show the improvement towards targets by making it easy to compare the current measurement against the historical and the planned goal.
5. In the case of performance auditing of high level goals, the indicators need to be linked to the IT investment’s business in order to clarify the benefits. This will make the result of the performance audit more related to strategy.
6. The indicators used in a performance audit project should be selected to reflect a general image of the organizational performance. Although this guideline provides hundreds of Key Performance Indicators for auditing IT programs, Auditors still need to select the related indicators according to audit objectives in the practice.
4

PART 2 AUDIT PLAN When SAI auditors start auditing IT programs, auditors should prepare an audit plan firstly. Planning is the first phase of an audit. A good plan will be a well beginning. When planning an audit, auditors must have an understanding of the overall environment under review. This should include a general understanding of the various business practices and functions relating to the audit objectives, as well as the types of information systems and technology supporting the activity. Auditors should be familiar with the regulatory environment in which the business operates. Because IT program involves many aspects, there are a lot of indicators that could reflect the performance of IT program. When auditors begin to plan audit work, auditors need to understand the audited entity firstly, and then identify the IT programs to be audited, and then define the audit objectives and scope, and finally prepare audit program by selecting appropriate and relevant Key Performance Indicators to assess.
2.1 Understand the audited entity by collecting the background information Any IT investment being a collection of activities and resources, should ideally originate with the purpose to support IT processes which link to IT goals that are derived from the organizational business and strategic goals. This also means that measuring the performance of an IT investment should give an understanding of how well such goals are achieved and what is driving the performance. The process of determining the subject matter and the criteria involves that auditors should obtain an understanding of the audited entity and the circumstances surrounding the audit. This understanding provides auditors with a frame of reference to be used in applying professional judgment throughout the entire auditing process. An understanding of the entity, its environment and relevant program areas is especially important as it will be used in determining materiality and in assessing risks. To put this in a more structured manner, a set of following information needs to be collected from the audited entity: 1. Understand and define the organizational goals and objects that are supported by the measured IT investment. 2. Understand and define the goals and desired outcomes that the organization hopes to achieve through an IT investment in serving its beneficiaries or customers. 3. Identify IT processes and activities that are the products of the IT investment. Such processes and activities are seen as the key factors influencing the performance of organizational, business and customer desired goals. 4. Locate and identify IT resources that support the previously identified processes and activities. This includes all software, hardware, services and human resources that take part in carrying out a process or performing an activity.
5

Auditors could understand the background information of audited entity through steps as follows: 1. Touring key facilities. 2. Reading background documentation including industry publications, annual reports and independent financial analysis reports. 3. Review long-term strategic plans. 4. Interview key staff to understand business issues and internal auditor. 5. Review prior audit reports. Following is the performance audit categories corresponding to the previous background information: 1. Overall and strategic performance audit of the organization. 2. Publicly offered products and customer service oriented performance audit. 3. Performance audit of the internal processes and activities provided by the IT. 4. Low-level technical performance audit of the IT resources. 2.2 Identify IT programs to be audited Normally, auditors need to make a comprehensive study about the IT programs and the relationship of various systems. It can include the following: 1. Understand the information system of audited entity which provides the function of business content, business process and information flow; 2. Understand the general framework, technology architecture, network structure, security protection structure, and data running process; 3. Understand the project management, investment management and performance evaluation of audited entity's information construction; 4. Review the documentation of audited entity's information construction. Performance audit of IT programs is more prevalent to carry out a performance audit targeting an IT program or investment. This is different from a full organization performance audit being done in one project or as a maturing process. When performing the audit on a specific IT program/investment, the audit approach is comprehensive of the previously discussed four categories. This is also reflected when gathering background information as the only necessary information is what is related to the IT program/investment being audited. Consequently, organization and business goals, IT processes, activities and resources should be narrowed down to what is relevant to the audited program/investment. Typically, gaining the knowledge of the audited entity’s IT program will include gathering information on several aspects. This knowledge will allow auditors to make an assessment of the complexity of the systems to be reviewed. This will in turn have an impact on the skills and resources required to carry out the review. After auditors understand the audited entity, they also need to identify the IT programs to be audited. The audited IT programs mainly involved the following aspects:
6

1. Identify the IT resources that makeup the infrastructure of IT program. 2. Identify the processes and activities that are a product of the IT program. 3. Identify the business objectives and outcomes that target beneficiaries/customers and are supported by the IT program. 4. Identify the organizational goals and objectives that are supported by the IT program. 2.3 Define audit objectives and scope SAI gets the authority from Government or Law to review and assess Government departments' operations. The audit objectives are to ensure that IT programs could successfully meet law and regulations. From audit work, auditors get conclusion and issue reports about:
Compliance with applicable laws and regulations. Effectiveness and efficiency of operations,
Auditors should make it clear about:
The objectives of the review, Scope of the review in terms of stages to be covered by the review, Type of review –whether it is a pre-implementation review, a parallel/concurrent
review as the stages are being executed, or a post-implementation review; The timeframe of the review—the start dates and the end dates; Process for reporting the observations and recommendations; Process for following up on the agreed actions.
Additionally, the auditors must take into account the high level goals and objectives of the audited entity when defining the objectives and scope of the performance audit. Also, any previous performance reports of the organization need to be reviewed to assist the auditors in defining the objective and scope. When the performance audit targets towards an IT program/investment, the objectives and scope need to reflect alignment to the business related to the program/investment. Particularly, the objectives and scope should be reflective to measure the program/investment’s business justification and the desired goals and benefits. The main objective in such audit is to verify that those benefits are realized. Typical audit objectives when auditing the performance of an IT Program can be: 1. Asset safeguard. The information system assets of audited entity include hardware, software, facilities, people (knowledge), data files, system documents, and supplies. Like all assets, they must be protected by a system of internal control; 2. Data integrity. Data has attributes of completeness, soundness, purity and veracity. If data integrity is not maintained, audited entity no longer has a true representation of itself or of events; 3. System effectiveness. An effective information system accomplishes its objectives. Evaluating effectiveness implies knowledge of user needs; 4. System efficiency. An efficient information system uses minimum resources to achieve
7

its required objectives. Only after auditors clearly define audit objectives and scope, auditors could then prepare the audit program and select the appropriate performance indicators. Looking back at the previously discussed categories of background information, we see that a good objective and scope should be comprehensive by covering all four categories. This is especially important in the case of auditing a specific IT program/investment. The objective should include creating a comprehensive set of performance measures that are logically linked across all four categories with the aim to provide a thorough understanding of the performance cause and effect. In order to demonstrate the cause and affect of the previous four categories, they need to be logically linked in a fashion that treats each category as an input variable to the one that precedes it which is then considered an output. This will generally result in the following for all performance audits: • IT resources that include the infrastructure and human resources are always inputs. • The products of the IT resources in terms of process and activities are an output of the IT resources and inputs to the satisfaction of beneficiaries, customers and organizational goals. Customer satisfaction and overall strategic performance are always outputs. Understanding the previous relationship of cause and affect assists the auditors in the forming the audit scope of work. This will also provide the guideline to identify which parts of the program/investment are measurable and provide an understandable quantitative performance view. Some of the questions that the auditors could ask when formulating the cause and effect relationship are as follows. • What are the related IT resources including IT infrastructure and human resources? And how are they reflected in the processes and activities that are products of the IT? • What are the IT products and services in terms of processes and activities? And how do they affect the beneficiaries or customers as per the business objectives? • What defines a beneficiary or a customer? And how are they affected by the provided IT products? • What are the high-level organizational goals and objectives of the organization? And how are they affected by the provided IT products? Once the cause and effect relationships have been established well enough to cover all possible aspects of the of IT program/investment, IT auditors could then start to look for the measurable areas in order to provide meaningful performance measurements. 2.4 Prepare audit program by selecting appropriate and relevant Key Performance Indicators to assess.
8

In Part 3 of this document, performance indicators for auditing IT programs are classified as below.
Decision making process: review whether decision making is complied with laws, feasible study is taken and stakeholders take part in the decision properly;
Requirement analysis process: review whether IT program is suitable for organization target, IT program is effective for the core business, and response and change is considered;
Design or planning process: review whether business requirements are covered, process is on time, capacity planning and resource provisioning is considered and cost estimation is reasonable;
Procurement or development process: review whether selection for partner or supplier is rational, cost control, process control, code control and quality control are effective and testing, training, upgrading is considered adequately;
Product: review whether users are satisfied, price, delivery and performance is suitable, and integration and technology applicability is considered;
Maintenance process: review several aspects, such as following the management rules, incident management system usability, availability, IT continuity, maintenance cost, website, monitoring, change management and data center;
Security management process: review security plan, identity management, user account management, security testing monitoring, security incident definition, malicious software prevention and network security;
Backup and disaster recovery process,: review backup plan, recovery plan, backup operation management and recovery operation management;
Service: review whether response of service is in time and effective, is widely used by user, and is satisfied by users;
Effectiveness: review coverage of the core business, output, benefit, internal management optimizing and leaning and growth capability for the organization;
Others need to be considered. All above indicators are involved in various aspects of IT program. Auditors need to select the appropriate and relevant Key Performance Indicators to assess when they prepare the audit program. For example, if audit objectives are determined to focus on security management of IT program, auditors should select indicators related to security management process. If the audit objectives are comprehensive, auditors should select the main indicators in each process to evaluate the performance of IT program comprehensively. Going back to the characteristics of performance measurements that were discussed in Part 1 of the document, it is highly desirable that performance measurements or KPIs to be sensible and not debatable, feasible with the needed data, easy to calculate, meaningful and not vague, relevant to the business, integral of the whole measurement set. The audit must take into account that performance measures will be different according
9

the state of the program/investment in terms of its project progress. It could be under feasibility study, in the process of acquiring or being development; and this is when measurement will be more related to areas such as Decision making process, Requirement analysis process, Design or planning process and Procurement or development process. But when a program/investment goes live then measurement will target areas like delivered product performance, maintenance processes, security issues, business continuity, service levels and effectiveness. According to the cause and effect relationships observed when defining the objectives and scope, individual measurements can be chosen from Part 3 of this document. It must be noted that the listed measurements are provided as common and generally practiced in the performance audit but of course they can be utilized as a reference to formulate measures specific to the case of the IT program/investment at hand. Added to the previous, the previous categorization of the four layers of performance audit explained in Part 2.1 need to be subcategorized in order to relate them to the cause and effect relationship in order to assist the audit in the KPI selection or formulating process. In the lower level there is the IT resources category/layer, and in this layer the performance measures reflect how well IT resources did as inputs, contributed to the success of a program/investment. In order to select/formulate measures from this category, it’s good to understand the following possible areas to know what kind of information is suggested for the program/investment IT resources. IT resources for possible areas of performance measures can be related with direct financial issues, Quality, Efficiency, Effectiveness, Reliability, Availability, Information and Data. For example; the auditor can look for the efficiency and quality of the inputs and how that reflects to the outputs or desired results in the IT-provided processes and activities. The second category/layer is related to the processes and activities provided by the IT and in this layer the measures reflect the success to the provided outputs. Possible areas of performance measures for the processes and activities can be related to financial issues, productivity, efficiency, quality, security, privacy, management, innovation and timeliness. For example, the auditor could look for the efficiency and quality of outputs and how that reflects the productivity of processes and activities as a result. The third category/layer is related to the publicly offered products and customer service and this layer measures the performance of the desired results and benefits of a program/system in relation to the customer offered products/services. Possible areas of performance measures for this layer are customer benefit, service
10

coverage, service quality, timeliness, responsiveness and service accessibility. For example, the auditor could look for the contribution of a program/investment as a service for the beneficiary or customer. The fourth and highest category/layer is the one related to the organizational goals and objectives which focus on the investment/program and measure the extent of its alignment to the organization goals and objectives. Possible areas of performance measures for the layer are organization purpose, organization responsibility and management of government resources. For example, the auditor could look for the contribution of a program/investment in achieving a business oriented objectives seen as an organizational responsibility. 2.5 The audit structure and method to utilize the selected Key Performance Indicators. Key Performance Indicators or performance measures are not constructed of the measure itself only. It must be noted that the types of data related to the measure is of equal importance. It calls for the important practice of standardizing the structure or format for the performance measurement should adhere to in order to facilitate easy data collection, reporting and accuracy. The first part of the standard is, what has already been discussed, the performance measure itself. But here, the performance measure as part of a standardized model is defined as the description of what is being measured. Also part of the description is a definition of what data is being gathered. Additionally in this part, any directions as to how to use the measure and how to use the data is included. The second part of the standard is the starting point and this is basically the initial reading when conducting a performance measure for the first time. In other words, this is the current performance of what is being measured and acts as the starting point for further performance improvement. The third part or element in the standard is the performance target which represents the desired performance for a specific performance measure. Performance target not only assures the program/investment’s performance against what is planned but also guarantees the program/investment planning is being carried out in a realistic manner. The fourth part is the performance audit which is basically the actual reading of a performance measure at the time of the audit. According to the previously proposed standardized structure, a method of the audit is derived that handles the structure accordingly. The method begins to be applicable after the phase of selecting and defining the appropriate measures for the IT program/investment.
11

Out of the nature of the performance audit using Key Performance Indicators/measures (KPIs), it is obvious that the most time consuming and important phase is data collection and this is where the method is applicable. Data collection or performance data gathering seeks to establish the starting point, set down the performance target, then measure the actual performance whenever it is needed. Establishing a starting point performance measure is basically setting a reference point in order to derive and quantify performance improvement. Initially, the starting point is the first time a performance measure is applied. Afterwards, the starting point can be reset to be the last approved performance measurement. Typically, the starting point is reset to be last year’s performance measurement. Sometimes the starting point is not only established by measuring it but also it could be derived by studying the industry standard, similar organizations or competition. Looking at the starting point in this manner can also serve as a way to set it as a performance requirement for a new program/investment. After establishing a starting performance point, a performance target is needed for each performance measure to be measured against. The performance target can be seen as the anticipated for a specific performance measure after a specific time. Without a performance target, it is difficult for an organization to set a plan in order to improve the performance towards the desired performance target. For a program/investment, the targets are seen as the standards of effectiveness and efficiency to preserve. Just like the starting point can serve as a performance requirement for a new program/investment, the performance targets can be considered as the requirements for the established and operational projects. This is also where services level agreements are usually derived from. Other information that assists in setting the performance targets are issues related to the organizational goals, objectives or the institutional purposes and responsibilities. In addition, the feedback of the beneficiaries regarding the provided products and services are an important factor in reassessing and adjusting the performance targets. And just like the starting point, the performance target can be established by comparing to other organizations or similar products and services provided by other bodies. When setting performance targets, it is important that they are done in a cooperative manner between the business/organizational side and the technical side. This helps in aligning the performance of the program/investment with the desired business results while considering the technical feasibility of such targets. When setting reasonable targets/goals, it makes it more likely to be achieved as there will be willingness to claim ownership and work towards improvement.
12

PART 3 AUDIT IMPLEMENTATION
3.1 Decision 3.1.1 Compliance with the Laws Objective To determine whether IT projects are in compliance with relevant laws, regulations, policies and standards. Background It is important to ensure that the IT systems comply with the laws and regulations. There are many laws and regulations applying to IT systems. It is also important to trace and react to the new relevant laws and regulations timely. Generally there are four types of non-compliance events.
Breaches of legal obligations, e.g., privacy act, copyright law or patent right; Breaches of contractual obligations with other parties; Non-compliance with the rules, regulations and policies formulated by the company
itself; and Non-compliance with some necessary national or international standards/norms.
Procedures
Review the regulatory or legal non-compliance events, and non-compliance issues reported.
Review the events of contract dispute and examine whether procurements are in compliance with standing policies and procedures.
Review the violations of defined IT policies identified by self-assessment or audit. This action should be done either quarterly or annually.
Examine the average time lag between the new regulation and the initiation of review, and check the frequency of compliance reviews. It is necessary to establish and persist in some rules to trace and respond quickly to the new regulations.
Indicators
KPI Description
Frequency of compliance reviews Frequency of compliance reviews.
Number of regulatory or legal non-compliance events
Number of regulatory or legal noncompliance events.
Number of incidents of non-compliance with laws due to storage issue
Number of incidents of non-compliance with laws due to storage management issues.
Average time lag between new regulation and initiation of review
Average time lag between publication of a new law or regulation and initiation of compliance review.
Number of non-compliance issues reported Number of non-compliance issues reported to the board or causing public comment or
13

embarrassment.
% of violations of IT laws and regulations identified by self-assessment or audit.
It could be measured either quarterly or annually. It is aimed to be minimized in order to keep compliant with the laws.
3.1.2 Feasibility Study Objective To determine whether the audited entity carried out proper, reasonable and sufficient analysis during feasibility study of IT projects. Background Feasibility study is usually conducted before IT project started. Its purpose is to determine whether the project is necessary, technology for the project is feasible and the return on investment is reasonable with the comprehensive analysis on the related factors affecting the project. Feasibility study is fundamental to the following work, and also is the baseline to examine and evaluate the project. The auditing intention is to assess whether audited entity conducted proper and adequate feasibility study. Procedures
Check whether the audited entity carried out necessary feasibility study before IT projects started.
Investigate whether the audited entity carried out adequate feasibility study, including the percentage of stakeholders who were satisfied with feasibility study, and the percentage of feasibility studies signed off on by the business process owner.
Survey the adverse consequences aroused by the incorrect or improper feasibility study, i.e., the percentage of delivered projects where stated benefits were not achieved due to incorrect feasibility assumptions.
Examine whether the feasibility studies were carried out on such predetermined plans as time and budget.
Indicators
KPI Description
% of stakeholders satisfied with the accuracy of the feasibility study
Feasibility study aims to objectively and rationally uncover the strengths and weaknesses of a proposed project. It is important to make the stakeholders satisfied.
% of feasibility study carried out. If percentage of the feasibility study carried out is maximized, it indicates that the auditee fully evaluated the possibility whether the IT programs could be implemented smoothly.
% of delivered projects with incorrect feasibility assumptions
Percentage of delivered projects where stated benefits were not achieved due to incorrect feasibility assumptions.
14

% of feasibility studies signed off on by the business
If percentage of feasibility studies signed off on by the business process owner is maximized, it indicates that the project or business process is essentially feasible.
% of feasibility studies delivered on time and budget
It is important that the feasibility studies are delivered on time and on budget, so that the project can move forward smoothly. This percentage helps managers to make a good schedule for the project.
3.1.3 Participation in Decision Objective To determine whether all the stakeholders play the proper and adequate roles in IT projects. Background User participation is considered as a core element in the development of usable information technology. One of the characteristics is the active and continuous participation and involvement of the clients throughout the project. Clients are responsible for providing information and making business decisions during a project, including priority of the requirements according to their value for the client’s business. It is necessary to attain higher customer satisfaction, to create value fast and early in the project, and to build the product clients really want. Procedures
Survey the degree that the participants took part in and understood the IT projects, e.g., how many stakeholders understood the defined IT policies, how much the stakeholders understood the IT policies.
Survey the functions of IT projects in the business, e.g., the percentage of IT actions or projects championed by business owners, the percentage of current initiatives or projects driven by IT and non-IT respectively.
Indicators
KPI Description
% of stakeholders that understand IT policyPercent of stakeholder that understand the defined IT policy. This KPI can be measured by surveying the business stakeholders.
% of current initiatives/projects driven by IT
Percentage of business initiatives that are considered innovations that are driven by IT, i.e., the idea originates within the IT function or IT leadership or from a group in which IT plays a dominant role.
% of initiatives/projects driven by the business
Percentage of business initiatives that are considered innovations that are driven by the business, i.e., the idea originates within the business functions i.e. not within IT.
15

% of IT risk management action plans approved for implementation
Percent of IT risk management action plans approved for implementation.
3.2 Requirement Analysis 3.2.1 Organization target Objective To determine whether IT goals match with the business objectives by analyzing organizational goals, the coverage of the core business, the response to changes, and finally figure out the risks. Background IT goals need to be consistent with the business objectives. However, the reality often cannot be reached. It is a serious source of risks that IT goals mismatch with the business needs of the audited entity. Auditors need to identify business demands and determine whether IT goals are consistent with business goals. Procedures Auditors should independently determine the extent that IT matches audited entity targets by surveying the IT control framework and governance framework. Such events as following are often checked:
the frequency of the IT governance is mentioned in the memories of the IT Steering Committee
the frequency of IT report submitted to the Board of Directors the frequency checking IT infrastructure the frequency reviewing the assessment of physical risks the frequency reviewing management of IT risks the frequency reviewing IT cost allocation
Indicators
KPI Description
Frequency of IT control framework review/update
Frequency of audited entity IT control framework review/update.
Frequency of IT governance as an agenda item
Frequency of IT governance as an agenda item in the IT steering/strategy meetings.
Frequency of reporting from IT to the board
Frequency of reporting from IT to the Board of Directors.
Frequency of reviews of the existing infrastructure
Frequency of reviews of the existing infrastructure against the defined technology standards.
Frequency of steering/strategy committee meetings
Frequency of strategy and steering committee meetings.
Frequency of risk assessment and reviews
Frequency of risk assessment and reviews.
16

Frequency of review of the IT risk management process
Frequency of review of the IT risk management process.
3.2.2 Core business coverage Objective To determine whether the requirements on core business are covered by IT programs. Background The successful IT strategy should support organizational strategy. IT should support the core business and the IT requirements. It shows that the core businesses are not covered by the IT strategy when the core business processes are not supported by IT. Procedures To distinguish the core business and investigate its actual requirements, and determine whether the core businesses are covered by IT. Indicators
KPI Description
% of core business covered by IT [The number of core business covered by IT]/[The number of all core business]
3.2.3 Response/change Objective To determine whether the audited entity can response timely when the user requirement changes. Background The term of response reflects the ability of audited entity to respond to changes of user requirements. The uncontrolled changes are the common cause for disordered project and poor-quality software. The project group should ensure to response timely and effectively with change of requirement. Procedures
Survey whether the IT plan is in line with the changes of IT strategy. Survey the ratio of project change. Survey the proportion of requirement changes in a certain time period. Survey how many requirements are met. Survey the integrity of the requirement change records.
Indicators
KPI Description
Delay in updates of IT plan after Delay in time between updates of business
17

business strategic updates strategic/tactical plans and updates of IT plan
Ratio of project change approval The number of project change approval/the total number of project change
% of requirement change The number of changed requirement/The number of final requirement
% of achievement of requirements list
The number of achieved requirements/The number of requirements
% of records of requirement change The number of recorded requirement change /The number of all requirement change
3.3 Design / Planning During the design stage, audited entity needs to resolve the problem of 'how to do'. That is how to realize the IT system. From the view of effectiveness, auditors should consider whether the design conforms to the requirement description. From the view of efficiency, auditors should evaluate the rationality of required resources. From the view of security, auditors should evaluate the dependability of system control. In addition, auditors should also consider the budget, schedule and IT risk plan. 3.3.1 Requirement coverage Objective To determine whether system design conforms to the business requirement description. Background The coverage of requirements is a fundamental need throughout the whole IT project. Project managers always try their best to ensure that the project meets the expected requirements during design, coding and testing stage. Requirement coverage is the number of requirements passed in proportion to total number of requirements. Requirement coverage is the foundation to monitor and manage IT project. So it is important to determine how IT design is in compliance with requirements. Auditors can calculate the percentages of the services covered by SLA, which reflects the extent that the provided services meet business demands. If the ratio is small, it reflects that the provided service demand has high risk. Procedures
Evaluate the validity and reliability of the requirements coverage according to the SLA coverage.
Check the requirement gap through the calculation of requirement coverage, and consider requirement the design conforms to the requirement description based on users’ response.
Check the risk problems aroused by the weak consideration of requirement coverage design. If the requirement descriptions on key business processes are unclear or incomplete, e.g., a critical business process is not covered by the defined service availability plan. It will inevitably lead to risk problems on business validity or
18

reliability. Evaluate whether the system requirement plan conforms to the requirement
description according to system perspective plan. Evaluate the effects of final features in terms of requested features or planed features,
e.g., the ratio of achieved features to planned features or requested features by users. Indicators
KPI Description
% of projects with pre-defined Return on Investment (ROI)
Percent of projects with the benefit defined up front.
% of RFPs needed to be modified based on users' responses
Percentage of Request for Proposals (RFP) that needed to be modified based on users' responses.
% of services covered by SLA Number of deployed services that are related to one or more SLAs relative to all services deployed within the IT service domain.
% of critical business processes not covered by a defined service availability plan
Percentage of critical business processes not covered by a defined service availability plan.
% of user requested features Number of user requested features compared to the total number of features (for a release). This KPI is to indicate that how the development is customer-driven.
% of requirement coverage percentage
((Number of requirement Captured – Number of requirement wrongly captured)/(Number of requirement Captured + Number of Requirements identified as missing during review)
% of requirement gap percentage ((Number of requirements coming from business not referred during requirement capture)/(Number of requirement Captured + Number of requirements coming from business not referred during requirement capture))
3.3.2 Time Limit Objective To determine whether the project time and schedule is managed properly. Background Schedule reflects implementation progress. It runs through the whole information system lifecycle. The project schedule is a series of time arrangements and restrictions to the project and each of its activities based on the work decomposition structure. It regulates the whole project and the various stages. A reasonable schedule plan can both guarantee the predetermined time, and make the project completed qualitatively and quantitatively. In most cases, the time spending on the system design stage is longer than others. So auditors need to consider rationality and validity of the time plan and management,
19

especially the flexibility of time allocation in design stage. It is important to guarantee the successful completion of the program schedule. Procedures
Evaluate whether the system developers or project managers constitute effective measures for time management and conduct proper time management during the design/planning stage.
Check whether the project developers and managers adopt new tools and technology to shorten the design and development. If true, the rearrangement of schedule for the new situation should be considered.
Indicators
KPI Description
Ratio of actual design time to planned design time
It shows whether design stage is delayed
Ration of design time to development time
It shows whether the design time is reasonable compared with the development time.
3.3.3 Capacity Planning and Resource Provisioning Objective To determine capacity planning and resource provisioning is rational. To determine whether it is sufficient for user’ requirements. To determine whether the audited entity made effective capacity management plan and methods applying to the current and future identified needs of the business. Background Capacity planning is the process to determine how much capacity (and when) is needed in order to provide good products or service. A number of factors can affect capacity, such as the number of employees, ability of employees, waste, scrap, defects, errors, productivity, government regulations, and preventive maintenance. It is very common for an IT organization to manage system performance in a reactionary fashion, analyzing and correcting performance problems as users report them. When problems occur, hopefully system administrators have necessary tools to quickly analyse and solve the problem. In a perfect world, administrators prepare in advance in order to avoid performance bottlenecks, using capacity planning tools to predict how servers should be configured to adequately handle future workloads. Capacity planning is the process of determining the production capacity needed by an organization to meet changing requirements for its products. The goal of capacity planning is to provide satisfactory service levels to users in a cost-effective manner. The delivered performance decreases quickly if capacity is insufficient. However, excess capacity can be costly and unnecessary. The inability to manage capacity properly can be a barrier to the achievement of maximum performance. It is important to audit the implementation of capacity planning and resource configuration since capacity is a factor determining the
20

technology choice of an organization to ensure reasonable resource provisioning. Procedures
Check whether there are capability planning and resource provisioning. if true, determine whether it is valid.
Evaluate current capability planning and resource provisioning, such as average interval to update capability planning, maximum system storage capability, and network bandwidth capability, meet the normal demands.
Evaluate the rationality and effectiveness of capability planning from the cost-effective view.
Check the ratio of system administrators to servers, and determine whether system management is sufficient.
Review the frequency of unexpected incidents due to the insufficient capability planning.
Check the basis of the future capacity planning and determine whether the plan meets future requirements.
Calculate the percentage of deviation between predicted demand and actual demand, and determine whether the capability planning and resource provisioning is reasonable and valid.
Consider how much cost has been increased due to poor capacity planning and how much caused by unplanned purchases due to poor performance.
Evaluate the rationality and effectiveness of the capacity management through accident problems. In addition, auditors should consider the accident frequency and the validity of the solution method.
Indicators
KPI Description
Average time between updates of capacity plan
Average time (e.g. in days) between updates of capacity plan.
Minimum bandwidth guarantee The minimum bandwidth guarantee, at a given time, on a circuit, or per application basis.
Ratio of system administrators to servers
It shows whether system management is sufficient
% of core development personnel on the job
Number of days that project core developers are on-the-job /Total number of days
% of time when Capacity resources are being used below expectation
Time when resources weren’t used or were used below a minimum demand value [underused]: Example: % HW Time working below normal levels % Time when licensees are not being used or they’re needed. % Time when staff have no service tasks assigned (No calls, no incidents …)
Number of times when Demand Number of times when Demand Management
21

Management successfully triggered the Capacity Management process
successfully triggered the Capacity Management process
% of CIs with under-capacity Percentage of Configuration Items (CIs) with under-capacity, relative to all CIs used to deliver services to end-customers.
% of unplanned purchases due to poor performance
Percentage of unplanned purchases due to poor performance.
cost associated to unplanned purchases to resolve poor performance
cost associated to unplanned purchases to resolve poor performance.
% of deviation between predicted requirement and actual requirement
% Deviation between predicted requirement and actual requirement to analyse the root causes in case of a big deviation improve accuracy in future decisions.
Number of incidents based on capacity problems related to requirement management
Number of incidents based on capacity problems related to requirement management (market changes, unattended customer needs…)
Number of incidents caused by inadequate capacity
How many incidents have been logged with the Service Desk that were caused by a clearly defined lack of capacity?
3.3.4 Cost Estimation Objective To determine whether cost control is effective. To determine whether forecast expenditure in capacity planning and continuous business planning is accurate. To determine whether the growth rate of cost budget is reasonable. Background IT project process necessarily involves the cost consumption. The audited entity should estimate the project cost according to activity, activity duration, and resources for activities. Cost estimation typically requires the following steps:
To define what kinds of resource and how much resource is required for business. To decide the cost of every kind of resource. To calculate the cost of each activity. To configure the project resource to guarantee reasonable expenditure on every
resource. In addition, it needs to estimate the indirect cost, such as indirect human resources, materials, and reserve funds. Accurate cost estimation is the basis for good cost management, and leads to more reasonable project budget. It is a key factor for successful IT project. It needs to audit IT cost estimation and cost controls, which is one of the key factors to promote the success of IT project. IT cost estimation is an important part of the project management. The cost may be over
22

estimated or wasteful during every stage of IT project such as IT project planning, design, implementation, maintenance, and so on. Procedures
Check whether the project cost is clearly defined. Check whether the cost is associated with the defined activities. Review whether the risks are considered during cost estimation and how to control
the risks. Review whether some cost estimation processes are established, and whether it is
consistent with accounting processes. Check whether the reasonable application processes of procurement or expenditure
are defined. Evaluate the rationality of cost budget for IT management processes. Check the cost budget for every activity and determine whether they are over
estimated or wasteful. Check whether the budgets have strong and reasonable basis for all the activities
such as initial investment of hardware, development cost of system software and application software, hardware maintenance and upgrade cost, system network management cost, and so on.
Check the rationality of the cost budget for IT service, IT delivery and IT maintenance.
Evaluate whether cost budget for information security meets the demand of information security control.
Check whether some processes are defined for cost controls and who is responsible for cost control.
Review whether the project expenditure is double checked and controlled. Review whether the factors resulting in budget changes are identified. Check how to control the personnel cost, including accounting check of the overtime
wage. Check how to control the supplementary money during IT investment and how to
control the staff cost and daily operation cost. Check the cost controls on documentation, training, testing, and so on. Check the validity of cost controls on IT service.
Indicators
KPI Description
Cost of producing/maintaining user documentation and training material
Cost of producing/maintaining user documentation, operational procedures and training materials.
Cost of handling a software code branch
Cost of handling a software code branch.
Cost of producing a software build/release
Cost of producing a software build/release.
23

% of growth of IT budget Percentage of growth of the IT budget relative to the previous measurement period.
Deviation between budget and expenditure
The deviation of the budget (cost) is the difference in cost between the planned baseline against the actual expenditure.
Ratio of IT staff to total Employees Ratio between IT staff in Full Time Equivalent (FTE) and all staff in FTEs.
% of expenditures on new IT developments/investments
Percentage of expenditures on new IT developments (investments) relative to the total IT expenditures
% of cost/benefit assessment Percent of the number of project with cost/benefit assessment to the number of whole projects. .
% of software licenses in use Percentage of software licenses in use to the total purchased software licenses.
% of IT budget spent on risk management
Percent of IT budget spent on risk management (assessment and mitigation) activities.
% of IT budget Percentage of IT budget to total revenues. % of IT investment Percentage of IT investment to total investment. Unit cost of IT service Unit cost of IT service within measurement period. Software supporting cost Supporting cost of all software based on the supporting
contracts. IT expenditure per employee Average IT expenditure per employee. Ratio of physical servers to virtual servers
Number of servers that are physical (subject to higher cost) / virtual servers.
% of information security investment in total investment
Information security investment/ total investment
% of hardware investment in total investment
Hardware investment/ total investment
% of software investment in total investment
Software investment/ total investment
% of maintenance cost in total cost Maintenance cost/ Total investment 3.3.5 IT risks Objective To determine whether IT risk control and assessment is rational, valid and reliable. Background IT risk refers to the failures of information technology which result in the negative effects on business. IT may bring risks on business and may result in extensive influence on users and society due to insufficient management of information technology. IT risk may exist in every stage of IT system such as planning, design, implementation, service and maintenance. In order to reduce the loss because of IT risks, audited entity must manage IT risks and establish plans to avoid IT risks. The auditing on IT risks could promote the management mechanism of IT risks, decrease the negative influence from IT risks, and
24

control the IT risks within a tolerable range. According to different risks, IT department should have following abilities.
On project risk, IT department have the ability of project management, software engineering, IT procurement and IT implementation.
On risks of IT service continuity, IT department has the capabilities of incident and problem management, customer support, information technology service management, business continuity management and disaster recovery.
On risks of Information assets, IT department has the capabilities of security management and information management.
On risks from service supplier, IT department has the capabilities of supplier management, outsourcing and contract management.
On risks of IT application, IT department has the capabilities of maintenance, safeguard, integration, testing, version management, configuration management, system management, problem management, and other capabilities associated with software engineering.
On risks of Infrastructures, IT department has the capabilities of system management, system monitoring and capacity management.
Procedures
Evaluate the rationality, validity and reliability of the monitoring and assessment mechanisms on IT risks, prevention and management measures on IT risks.
Review the frequency of risk identification in the project life cycle and evaluate whether the risks are controlled completely.
Review which assessment technologies are used to measure risk priority, and controlling, recording the identified risks.
Check whether the risks which impact schedule and budget, are distinguished and treated.
Check whether the contingency or contingency plans are included in project plans. Check whether the project risks are involved in project progress report. Calculate the ratio of projects with risk assessment to all projects. Review the serious incidents caused by unidentified risks. Check whether the audited entity pays attention to IT risks that may cause critical
potential impact on business. Evaluate whether the funds planed and resources for IT risk management is sufficient,
and how they are used for IT risk management activities. Indicators
KPI Description
% of risk assessment carried out [number of projects under risk assessments] / [total number of projects]
% of identified IT events that have been assessed.
[number of identified IT events that have been assessed] / [number of all identified critical IT
25

events] Number of identified IT risks Due to an increasing awareness of information
security, identifying IT risks become a necessary part in an IT project.
Number of critical incidents Effective risk assessment process can minimize the number of critical incidents.
3.4 Procurement 3.4.1 Selection for partner or supplier Objective To determine whether the project partner/supplier selection program is effective and the most suitable partner or supplier is selected. Background Selection for partner/supplier is an important factor to the success of the project. Only the qualified supplier could provide the necessary technology, personnel and other service guarantee for the project, otherwise it could lead to project delays or ineffective service. Selection for supplier mainly considers the following factors:
Supplier’s qualification and successful completion of similar projects. Supplier’s financial capacity to provide a guarantee for the success of the project as
well as the level of service. Supplier’s personnel structure to meet the demands of the project. Supplier’s project management to meet the requirements of the service level
agreement. Procedures
Check whether audited entity reviews the supplier’s rank of capacity of partner/supplier and the pass rate of the project implementation.
Check whether audited entity review the supplier’s registered capital, and the financial position in recent three years, ensure the financial capability of the supplier can support project continued to complete.
Check whether audited entity calculate the percentage of personnel changes of project and the number of qualified technical personnel to ensure that suppliers could provide sufficient personnel for the project.
Indicators
KPI Description
Rank of capability of partner/supplier It shows whether partner/supplier has strong capability to achieve requirement. E.g. Rank of Capability Maturity Model for Software (CMM).
Acceptance pass rate of the project implementation
Acceptance number of IT projects by the partner or supplier/The number of all IT projects by the partner or supplier
26

Ratio of registered capital to total amount
Registered capital/total amount
The financial position in recent three years
It monitors the financial position in recent three years.
The number of qualified technical personnel
It indicates the work competence of technical personnel
The number of replacement of the partner/supplier
It could reflect whether the selected partner/supplier is suitable.
% of personnel changes of project The number of core technical staff change/Total number of technical staff
The number of similar cases led by project manager
It is a measurement of the similar project experiment of the partners or suppliers that are under selection.
3.4.2 Cost control Objective To determine whether the projects have complete budget and cost control and the project's actual cost comply with laws, regulations, and project plans. Background The project budget could be determined by cost estimation. Project team control the deviation of budget and actual cost, and manage the bills in the management of project implementation, ensure effective cost control according to business needs and the progress of the project. Auditing should focus on cost control as following aspects:
Control of the project budget, to determine a reasonable project budget according to the objectives of the project, to develop the budget implementation plan.
Control of the actual cost of the project to comply with the budget and implementation plan, provide invoice management in project implementation, deal with the duplicate cost and ultra budget cost.
Procedures
Review the budget control, to examine percentage of projects within budget, percentage of projects on time and on budget and percentage of fully funded;
Review the actual cost control, to examine the budget deviation relative to total budget.
Indicators
KPI Description
% of projects within budget Number of projects that are executed within the budget/ The total number of all projects..
% of budget deviation relative to total budget
Percent of budget deviation value compared to the total budget.
Ratio of actual expenditure to budget The actual expenditure relative to the budget of an project.
27
Ratio of workload variance Actual workload plus remaining workload compared to the total original estimate.
Cost of duplication Cost repeat with other project/The total cost of IT project
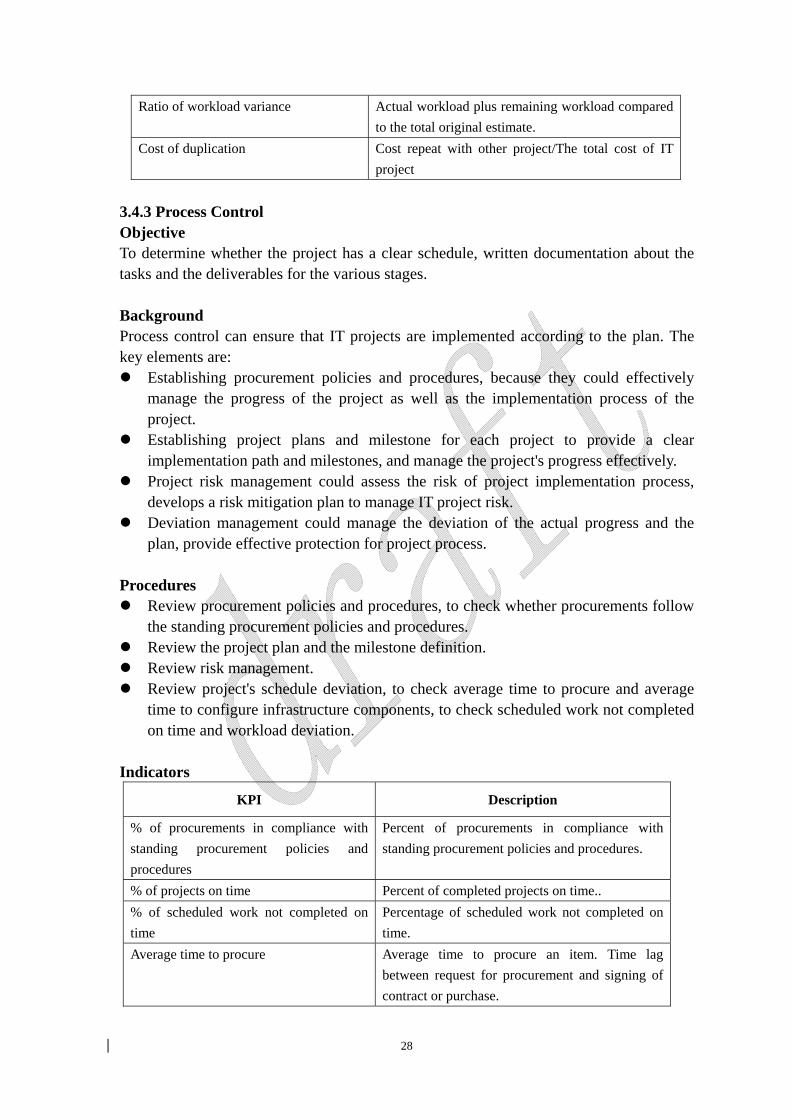
3.4.3 Process Control Objective To determine whether the project has a clear schedule, written documentation about the tasks and the deliverables for the various stages. Background Process control can ensure that IT projects are implemented according to the plan. The key elements are:
Establishing procurement policies and procedures, because they could effectively manage the progress of the project as well as the implementation process of the project.
Establishing project plans and milestone for each project to provide a clear implementation path and milestones, and manage the project's progress effectively.
Project risk management could assess the risk of project implementation process, develops a risk mitigation plan to manage IT project risk.
Deviation management could manage the deviation of the actual progress and the plan, provide effective protection for project process.
Procedures
Review procurement policies and procedures, to check whether procurements follow the standing procurement policies and procedures.
Review the project plan and the milestone definition. Review risk management. Review project's schedule deviation, to check average time to procure and average
time to configure infrastructure components, to check scheduled work not completed on time and workload deviation.
Indicators
KPI Description
% of procurements in compliance with standing procurement policies and procedures
Percent of procurements in compliance with standing procurement policies and procedures.
% of projects on time Percent of completed projects on time.. % of scheduled work not completed on time
Percentage of scheduled work not completed on time.
Average time to procure Average time to procure an item. Time lag between request for procurement and signing of contract or purchase.
28

% of IT risk management structures and activities set up vs. planned
Percentage of IT risk management structures and activities set up versus planned.
% of risk mitigation plans executed on time
Percentage of risk mitigation plans executed on time (per management’s decision, set date).
% of workload deviation (The actual workload - Planned workload)/Planned workload
3.4.4 Code control Objective To determine whether the source code control is valid. Background Code control is an important control that manages project progress and change. The validity, integrity of the source code and the project completed on time are needed to be focused on. Procedures
Review code loss. To check percentage of time lost re-developing applications as a result of source code loss, This KPI measures amount of time lost by application developers in redesigning applications as a result of no control over source codes.
Review coding efficiency. To check Lines of code per day, in the period of coding in an IT project, the number of lines of code written by all coding staff per day could help the managers control the coding schedule well, and ensure the project be finished on time.
Indicators
KPI Description
% of time lost re-developing applications as a result of source code loss
This measures amount of time lost by application developers in redesigning applications as a result of no control over source codes.
The number of software coding version It shows that source code of software is under control.
3.4.5 Outsourcing Objective To determine whether the outsourcing of IT projects meets the audited entity's strategy and the outsourcing project have adequate control to meet the audited entity's business objectives and requirements. Background Outsourcing is a way to reduce IT cost and improves service levels. Auditors should concern whether IT outsourcing meet the audited entity's business objectives and requirements, and whether it supports audited entity's cost / benefit goals.
29

Procedures
Review the proportion of outsourcing projects. To examine percentage of application development work outsourced.
Review the cost-effectiveness of outsourcing. To examine percentage of IT outsourced human resources and percentage of IT outsourced projects.
Indicators
KPI Description
% of application development work outsourced
Percentage of application / software development work outsourced.
% of IT outsourced human resources Percentage of IT human resources (e.g. in FTE) that is outsourced.
% of outsourced IT project The number of outsourced IT projects/Total number of IT projects;
3.4.6 Quality Control Objective To determine whether the audited entity establish quality control standards, and run an effective quality management to ensure the quality of IT projects in line with the business requirements. Background The goal of quality control is to set up an effective quality assurance management in IT projects, to establish a quality assurance standards and evaluation criteria. It has dedicated quality assurance personnel to evaluate the project, check the key indicators of software quality, to ensure the application meet the performance, availability, reliability, security, modifiability and function. Without proper quality control, IT projects may not be able to meet the business requirement. In order to reduce this risk, auditors should focus on that whether the IT project has an effective quality management, and the dedicated quality assurance staff performs quality assurance in accordance with the quality control standards. Procedures
Review software quality documents to determine whether software quality is satisfied to stakeholders' requirement.
Review quality assurance management to determine whether projects are received quality assurance effectively.
Indicators
KPI Description
30

% of the number of Quality Assurance (QA) personnel
[Number of QA personnel] / [number of application developers]
% of the number of projects receiving QA review
[projects receiving QA review] / [number of total projects]
% of stakeholders satisfied with IT quality
Percent of stakeholders satisfied with IT quality
% of software code check-ins without comment
Percentage of software code check-ins without comment.
Number of identified software defects
Number of bugs or software defects of applications.
% of reported bugs that have been fixed when going live
Percentage of total bugs that have been found while testing and are fixed when a new software release is going live
Percentage of bugs found in-house during development
Percentage of bugs found in-house compared to bugs found by users.
3.4.7 Testing Objective To determine whether IT project could be tested to find and resolve the errors or problems. Background Testing is an important method to ensure the quality of IT projects and meet business requirement. Procurement should establish the test plan and test programs to check IT project performance, function, security, reliability, and determine whether it meets the requirements. Without testing, the deliverable can not meet the business or security needs. Following elements should be focused on.
Written test plan and test program; Testing indicators; Testing results.
Procedures
Check the testing plan to determine whether projects have been tested before brought into operation.
Check the testing coverage to determine whether test requirements all are accomplished.
Indicators
KPI Description
% of projects with a testing plan Percentage of projects with a documented and approved testing plan.
31

Time consuming of testing How long the test takes for a software application. % of test coverage [The number of designed test requirements]
/[The number of total requirements] Pass rate of test execution [The number of cases passing through the test]/[The
total number of test cases] % of stakeholders who are satisfied with the testing
Testing is an investigation conducted to provide stakeholders with information about the quality of the product or service under test.
% of application downtime. The KPI shows whether the application is robust to support daily operation.
3.4.8 Training Objective To determine whether employees could properly perform their duties with IT and have a good sense of security. Background Training is an important part of the IT service delivery, it should be carried out. The audited entity should have a formal training program that includes training time, participants and training content. Training content include IT operations, security awareness and IT risk management. Lack of training may result that staff could not use IT effectively to achieve business goals, and will bring more IT security event, Therefore auditors should concern:
Training plan and program development. The audited entity should have a reasonable training plan according to the principles of cost and benefit. The plan should cover all users of IT systems, to provide sufficient time to meet the training requirements. The training should include IT risks and security management.
Training management. The audited entity should adopt effective training to enhance employees' level of understanding of the system. Training management also can reduce help desk calls and the occurrence of security incidents.
Procedures
Review training programs to determine whether IT staff and employee have been trained in suitable days.
Review the effectiveness of training to determine the training achieves the goals. Indicators
KPI Description
Average number of training days per IT staff
Number of training days per IT staff.(e.g. year).
Average number of training days per Total number of training days divided by the number
32

employee of employees (in FTE). IT Investment to IT Staff Training Ratio between annual IT Investment (not operational
cost) and annual spending on IT staff training Average training cost per employee Cost of training per employee (in FTE) divided by
the number of employees (in FTE) % of Training satisfaction [The number of results as "good" in training
feedback form]/[The number of all results in training feedback form]
The proportion of staff training [The number of persons receiving project training]/[Total number of staff]
% of hours devoted to train the technical staff in IT security
% of hours devoted to train technical staff in IT security, compared with the total IT staff
% of IT staff with IT related certification Percentage of IT staff with IT related certification. (e.g. ITIL, COBIT etc.)
% of staff trained in critical risk management techniques
Percentage of staff trained in critical risk management techniques (e.g., standard risk analysis techniques, crisis management, project management, skills of people to detect when something is amiss).
3.4.9 Upgrading Objective To determine whether the software upgrading is compliant with the relevant requirement. Background The software upgrade provides service continuity for IT procurement. Due to business process reengineering, technological innovation, and changes in IT risk, the system needs to be updated to adapt to the new business and security needs. Auditors should focus on software upgrade. Procedures Check percentage of successful software upgrades, assess the compliance and effectiveness of software upgrades, and determine whether it could make the software reliable. Indicators
KPI Description
% of successful software upgrading [The number of successful software upgrading]/[The number of total software upgrading] .
3.5 Product 3.5.1 User satisfaction Objective To determine whether users are satisfied with the quality of product.
33

Background User satisfaction is the degree of customer experience to her/his expectations. It is used not only for the project implementation, but also for project evaluation. Procedure
To review the overall expectations and comprehensive satisfactions of stakeholders to the application produced by the project.
Indicators
KPI Description
% of projects meeting stakeholder expectations
Percent of projects meeting stakeholder expectations.
3.5.2 Price Objective To determine whether the audited entity took effective measures to conduct price control and determine whether the product reached the goals of cost management. Background Price control is a series of management behaviors including setting goals of cost management and taking measures to reach the goals. The managers should identify and control the factors affecting cost. Procedures Review the actual cost and effects such as cost of service delivery and service desk, and determine whether the project conducted effective price control to attain the expected goals. Indicators
KPI Description
Cost of service delivery Cost of service delivery as defined in Service Level Agreement (SLA) based on a set period such as month or quarter.
Cost of call center/service desk Cost of a call center/service desk, usually for a specific period such as month or quarter.
3.5.3 Delivery Objective To determine whether the delivered product is consistent with the agreements, whether the delivered outcomes such as software and documents meet the expected requirements of users.
34

Background IT delivery is an important aspect of information system for the business. The final delivery of an application to the user involves the correct functions of a large number of components. The complexity of information system usually introduces malfunctions and bugs to accomplish objectives. These needs must be addressed since IT is an effective tool for the business goals. IT delivery is the aspect of information technology, where IT exists for the business and its end users. IT is useful and beneficial only if the end user has a good experience in accomplishing tasks with a little more ease and an increase in productivity. IT delivery can also be evaluated through some mechanisms, such as end-user satisfaction surveys and suggestion schemes. Procedures The inspection of project delivery includes:
Check whether the delivered products are in compliance with the agreement; if not, whether the explanation is acceptable.
Check whether the way of delivery and the time of delivery are in compliance with the requirements.
Check whether the documents are archived.. Indicators
KPI Description
% of automatic release distribution [The number of new releases could be distributed automatically]/[The number of total new releases]
% of services not delivered according to SLA
[The number of services not delivered according to SLA]/[The number of total services]
% of with achieved documents [The number of archived documents]/[The number of documents need to be archived]
3.5.4 Performance Objective To determine whether IT system has the capability to meet the required performance, such as response time, transaction processing capacity, reliability, and so on. Background Auditors review the delivered IT system whether the IT system has the required performance capability. Procedure Review the IT system with a checklist. Main aspects are as follows.
System Throughput Response Time
35

Equipment Utilization Concurrent Users Success Rate Time between Failures
Indicators
KPI Description
% of system transactions executed within response time threshold
Percentage of system transactions that executed within the defined response time threshold.
% of failed system transactions Percentage of failed transactions relative to all transactions within measurement period.
% of network packet loss Percentage of packets transmitted over the network that did not reach their intended destination. A 0 percent package loss indicates no packets were lost in transmission.
Average % of CPU utilization Average percentage of utilization of CPU of system during the measurement period.
Average % of memory utilization Average percentage of utilization of memory capacity of system within measurement period.
Average storage/disk read time Average storage/disk read time. Average storage/disk seek time Average storage/disk seek time. Average storage/disk transfer rate Average storage/disk transfer rate. Average storage/disk write time Average storage/disk write time. Maximum CPU usage Maximum CPU usage within measurement period. Maximum memory usage Maximum memory usage within measurement period.Maximum response time of transactions
Maximum response time of transactions within measurement period.
Mean-time between failure (MTBF)
The average time between equipment failures over a given period i.e. the average time a device will function before failing. It is the reliability rating indicating the expected failure rate of equipment.
Vacancy rate of equipment It could reflect equipment assets investment returns and the utilization. Value of Idle equipment assets/Value of all equipment assets
Disk capacity utilization It could reflect whether device could be operated safely and do not be overestimated during procurement.
Database utilization It could reflect whether database could be operated safely and do not be overestimated during procurement.
3.5.5 Integration Objective
36

To determine whether the integration followed a standard process and whether the process was well documented. To determine whether the integrated system meets the requirement. Background The term integration broadly means the activities that bring decomposed parts together. The goal of integration is to find unforeseen problems as early as possible to solve them in time. Problems can also be unforeseen due to invalid assumptions, consequences of uncertainties, or the limited intellectual capabilities. Procedures
Review whether the integration has a clear plan. Check whether the integration process was well documented. Check whether the integrated system could meet the functional and performance
requirements. Indicators
KPI Description
Integration degree in IT-Infrastructure How well is a Cloud Service integrated in my IT-Infrastructure.
3.5.6 Technology applicability Objective To determine whether the technologies in IT system comply with the technology standards. Background The adoption of new technology usually experiences a process. It is obvious that using obsolete and unsuitable technologies are unreasonable. Procedures
Check list of the systems and devices used in IT system Determine whether the technologies are applicable by consulting with experts or
going through documents Indicators
KPI Description
% of systems not complying to technology standards
Percent of systems that do not comply with the defined technology standards.
Number of critical business processes supported by obsolete infrastructure
Number of critical business processes supported by obsolete (or soon-to-be obsolete) infrastructure
Number of infrastructure components that are no longer supportable
Number of infrastructure components that are no longer supportable (or will not be in the near future).
37

3.6 Maintenance 3.6.1 Follow the management rules Objective To determine whether maintenance of the information system comply with relevant policy and management rules requirements. Background Maintenance of the information system requires to follow certain rules. Maintenance can guarantee daily operation of the system, and make sure the effectiveness of system maintenance and management controls. Therefore, the audited entity develops management rules which reflects operational control of information systems and defines required relevant resources. The compliance of management rules should be reviewed periodically according to business changes and environmental changes. Procedures
Review the related IT policy and management rules regularly, and evaluates their adequacy and rationality;
Evaluate the level of service management practices, to determine whether the service level agreements is clearly defined, and cover the relevant information resources within the audited entity, and operation and maintenance management activities, whether SLAs meet the requirements of audited entity's goals.
Assess whether the SLAs have been followed and updated regularly; Check the relevant records and documentation, such as exception reports of
automatic generation, the report of the operator, the console log, assess whether related maintenance and management activities have followed the necessary rules, and whether service objectives and requirements defined in SLAs are met;
Assess the relevant operational procedures and business procedures control regularly. to determine whether it is consistent with the current business environment and management control objectives;
Check the quantity and type of issues which violates the SLAs required regularly, to determine the compliance of SLAs and the effectiveness of internal control.
Indicators:
KPI Description
% of applications not comply with technology standards
Percent of software applications that do not comply with the defined technology standards.
% of roles with documented position descriptions
Percent of roles with documented position and authority descriptions.
Frequency of updates to operational procedures
Frequency (e.g. in days) of updates to operational procedures.
Number of critical non-compliance issues Number of critical non-compliance issues
38

identified identified, within measurement period.
Number of major internal control breaches Number of major internal control breaches, within measurement period.
% of reviewed SLAs Number of Service Level Agreements (SLAs) that are being reviewed relative to all active SLAs.
% of SLA reviews conducted on-time Percentage of Service Level Agreement (SLA) reviews that have been conducted on-time (within their plan date), relative to all SLA reviews within the measurement period.
Average delay in SLAs review Average delay (e.g. in days) in Service Level Agreements (SLAs) review of all active SLAs.
% of SLAs with an assigned account manager
Number of Service Level Agreements (SLAs) with an assigned account manager relative to the total number of managed SLAs.
% of accepted IT risks with complete set of documentation
Percentage of accepted IT risks with a complete set of supporting documentation.
Frequency of updates to the technology standards
Frequency (e.g. in days) of updates to the technology standards.
3.6.2 Incident management Objective To determine whether incident management procedure is effective. To determine whether the incident management events and issues have been recorded, analyzed and solved timely. Background As one of the key elements of IT service management, incident management always provides a unified formal procedure to process the related incidents, including the incident recognition and classification, the diagnoses of the incident cause, and incident resolution and service recovery. By establishing a formal incident management mechanism, it could ensure the continuity of information system services. Procedures
Review the documentation about incident management, to determine whether the audited entity has established formal incident management mechanism, whether the incident handling process has been defines in the related program documentation clearly, and estimate the adequacy of related process .
Assess the incident management process and maintenance practices, determine whether the assessment proceeds regularly, and updates the relevant documentation in time.
39

Check SLAs to assess whether the objectives of incident management were clearly defined.
Evaluate the number of incidents found within a certain time period, the number of incidents monitored by different terminals and different applications, and the rate of new incidents. to determine whether the related applications are adequately covered by the incident management program, and whether the program is valid.
Evaluate mean time to solve incidents, number of unresolved incidents, and incidents not solved in-time. to determine whether the related events could be solved in time.
Evaluate incident management practices and review incident reason analysis, incident impact analysis, the classification of incidents, the solution of incidents, and other indicators. to determine whether a full incident impact analysis and incident follow-up management have been proceeded.
Check error reports, log files and working procedures of help desk to determine whether the relevant events have been recorded and tracked.
Check organizational incident response plan to determine whether strict incident report mechanism has been established, to ensure that the incident could be reported and solved timely.
Indicators
KPI Description
% of overdue incidents Number of overdue incidents (not closed and not solved within the established time frame) relative to the number of open (not closed) incidents.
% of incidents resolved within the required time period
Percentage of problems resolved within the required time period.
% of incidents with a root cause analysis Percentage of problems for which the root cause analysis was undertaken.
% of repeated incidents Percentage of incidents that can be classified as a repeated incident, relative to all reported incidents within the measurement period. A repeated incident is an incident that has already occurred (multiple times) in the measurement period. It indicates the efficiency of problem management in incident analysis.
Average incident response time The average amount of time (e.g. in minutes) between the detection of an incident and the first action taken to repair the incident.
Average incident closure duration Average amount of time (e.g. in days) between the registration of incidents and their closure.
% of Incidents submitted via automated monitoring
[Number of Incidents submitted by automated monitoring] / [Number of total Incidents submitted]
% of same incidents reported more than Percentage of same incidents reported more than
40

once by users once by users % of incidents reported by users Percentage of incidents reported by users (i.e. not
detected internally first). Number of incidents per developed application
Total number of recorded incidents per developed application in a given time frame.
% of incidents solved within SLA time Total number of incidents resolved within SLA time divided by the total number of incidents
Average number of incidents solved by FLM
Average number of incidents solved by FLM (first level maintenance) relative to all open incidents.
Mean Time To Detect (MTTD) MTTD would be the difference between the onset of any event that is deemed revenue impacting and its actual detection by the technician who then initiates some specific action to recover the event back to its original state. This would not be the same as starting the “Mean Time To Repair” (MTTR) clock. (i.e. once the technician receives a trouble ticket). The onset of any revenue impacting event almost always is recorded at some specific time by some specific equipment. The key element would be to bring the detection tool into the technician’s environment and then measure the difference between the events time stamp and the tech’s first action indicating recognition of the event (MTTD).
% of incidents fixed before users notice Percentage of incidents fixed before users notice. % of incidents resolved remotely Percentage of incidents resolved remotely. % of incidents solved within deadline/target Number of incidents closed within the allowed
duration time-frame, relative to the number of all incidents closed in a given time period. A duration time-frame is applied to each incident when it is received, and sets a limit on the amount of time available to resolve the incident. The applied duration time-frame is derived from the agreements made with the customer about resolving incidents.
% of overdue incidents Number of overdue incidents (not closed and not solved within the established time frame) relative to the number of open incidents (not closed but still within the established time frame).
41

% of reopened incidents Number of incidents closed that were re-opened relative to the number of all incidents closed in a given time period. Of course, It is only meaningful if it is allowed to re-open calls in your Incident Management process.
Incident backlog Total number of incidents still opened. Mean Time to Repair (MTTR) Average time (e.g. in hours) between the
occurrence of an incident and its resolution. Old incident backlog Number of open incidents older than 28 days (or
any other given time frame) relative to all open incidents.
Number of Incidents first month This KPI is to measure the number of incidents opened in the first month of the new IT service being in production. Knowing this information is extremely important for decisions making. Things like: better User training or better Incident management can be planned accordingly.
Number of incidents caused by deficient user training
Number of incidents caused by deficient user and operational documentation and training.
% of incidents reported and logged An incident report is a form that is filled out in order to record details of an unusual event that occurs at the facility
Number of unresolved incidents It reflects how many incidents have not yet been resolved.
3.6.3 System Usability Objective To determine whether the IT system is easy to use. Background Information systems usability is a concentrated expression of the adaptability of the human-computer interaction, functionality and effectiveness. Usually it indicates that the system should be understood, learned, used. The usability is a key factor whether the software could be deployed easily and successfully. With the mature of usability and the needs of universal application, relevant organizations have developed a series of usability evaluation standards. From the view of users, the usability is divided into efficiency, ease of learning, easy memory, fault tolerance, and satisfaction. Reference to the relevant standard, auditors need to evaluate the system usability to determine whether the system is able to provide related services in accordance with the organizational goals. Procedures
Test the usability indicators, according to the relevant assessment standards, to check
42

whether search navigation is provided, whether the operation is convenient. Review the system user feedback records, e.g. user complaint, to evaluate the
usability of the information system. Indicators
KPI Description
Easy maintenance Average evaluation of system maintenance by IT staff
Search function A search function should be provided to make the software application interactive and give users more control over their browsing experience.
Easy navigation Easy navigation should be provided to make the users easily find what they need.
Number of complaints received from users regarding easy to use
It indicates the number of complaints from the users who can use the software application easily.
3.6.4 Availability Objective To determine whether the IT system is available and the organizational availability management activities are valid. Background IT system availability is the ability of an information system and plays its proper function normally. High availability means that IT systems could fully provide IT services, or could be rapidly recovered from abnormal situation. High availability means that the customer service provided by IT systems is continuously available. Audited entity’s business operations are increasingly dependent on the IT stability, Therefore, IT system availability should be continued to support the realization of business goals. Procedures
Review related management reports of availability, to determine IT environment and maintenance management activities on the influence of system service availability, such as physical environment incidents, incidents caused by violating operational procedure or power failure.
Review the use of the system resource, to ensure that the usability level could be evaluated and measured, and improved continuously when necessary.
Indicators
KPI Description
43

Availability The general formula for availability is: Availability = [MTBF/(MTBF+MTTR)] x 100 Availability is a function of the total service time, the mean time between failure (MTBF), and the mean time to repair (MTTR).
Downtime The formula derives the percentage of the time service is available. The inverse is the amount of downtime.
Amount of downtime arising from physical environment incidents
Amount of downtime arising from physical environment incidents.
Downtime caused by deviation from operations procedures
Downtime caused by deviation from operations procedures.
Downtime caused by inadequate procedures
Downtime caused by inadequate procedures.
Number of application problems causing downtime
Number of application problems (per application) causing downtime
% of availability SLAs met Percentage of availability Service Level Agreements (SLAs) met.
Number of business disruptions caused by problems
Number of business disruptions caused by (operational) problems.
% of service desk availability Calculation of the service desk availability over the reporting period.
% of outage due to incidents (unplanned unavailability)
Percentage of outage (unavailability) due to incidents in the IT environment, relative to the service hours.
% of outage due to changes (planned unavailability)
Percentage of outage (unavailability) due to implementation of planned changes, relative to the service hours.
% of unplanned outage/unavailability due to changes
Percentage of unplanned outage (unavailability) due to the implementation of changes into the infrastructure. Unplanned means that the outage (or part of the outage) was not planned before implementation of the change.
Critical-time failures Number of failures of IT services during so-called critical times. Critical time is the time that a service /must/ be available, for example for financial systems during closing of the books (at the end of month, or end of quarter).
% of downtime due to security incidents Percentage of downtime due to security incidents.
Number of security exposures arising from physical environment incidents
It indicates the number of security exposures arising from physical environment incidents. It is
44

aimed to be minimized in order to keep IT Security quality.
Number of incidents of unauthorized access to computer facilities
It indicates the number of incidents of unauthorized access to computer facilities. It is aimed to be minimized in order to keep availability quality.
3.6.5 Maintenance cost Objective To determine whether the IT system’s maintenance activities are in accordance with the principles of cost-effectiveness. Background With the expansion of the scale of information system maintenance, the maintenance cost is also increasing. Maintenance cost management aims at reducing the unnecessary cost by cost quantification which reduces the risk of cost overrun to ensure the IT maintenance service is in accordance with cost-effectiveness principle. Procedures
Check the IT maintenance plan and budget. Check the expenditures in the activities of application maintenance and development,
to determine whether the related maintenance activities are in accordance with the cost plan.
Check the expenditures in incidents solution, system changes and configuration management activities, to determine whether the related activities are in accordance with the principle of cost-effectiveness.
Check the additional cost, to determine whether the related maintenance work is strictly in accordance with the maintenance procedures.
Indicators
KPI Description
Number of different technology platforms It shows that the more expenditure may be used due to too many technology platforms.
% of IT cost associated to IT maintenance Percentage of cost associated to IT maintenance (instead of IT investment in new initiatives) relative to all IT cost within the measurement period.
% of Energy-related cost to overall data center expenditure
Energy-related cost as a percentage of overall data center expenditures.
Average cost to solve a problem Average cost to solve a problem calculated by time registration per work performed for problems and applying a cost factor to the work.
45

Average cost to solve an incident Average cost to solve an incident calculated by fixed and variable cost of the incident management process divided by the total number of incidents received in the measurement period. Other route of calculation is time registration per work performed for incidents and applying a cost factor to the work. However this may lead to too much registration in the incident management process.
Average cost of change implementation Average cost of changes closed in measurement period. Cost can be determined by time registration or by applying a cost factor for example per change category.
Cost of cleanup of virus/spy ware incidents Sum of cost of cleanup of virus and/or spy ware incidents within measurement period.
% of qualified personnel who operate and maintain information system
Number of personnel who operate and maintain information system/Total number of personnel who use information system
3.6.6 Website Objective To determine whether website application is available and reliable. To determine whether utilization of website application is effective. Background Internet-based e-commerce/e-government system is an important application for many organizations, especially banks, commercial enterprises, and government agencies. Their businesses rely more and more on the Internet. Audited entities need reliable and sustained available website to achieve their business objectives. In addition, the audited entities should reorganize business processes, improve the utilization rate of the website, reduce cost and increase value. Procedures
Check the website availability, to ensure the applications can meet the needs of the business, dealing with incidents timely, to provide business continuity and customer satisfaction.
Check website security, to ensure that the application of effective control could provide confidentiality, integrity and authenticity.
Check website utilization, to evaluate whether proposed improvements has been implemented on the website to promote the reorganization of business processes, and increase organizational value.
Indicators
46

KPI Description
% of e-resources descriptions and links up to date
Percentage of e-resources descriptions and links up to date.
% of new visitors Percentage of new visitors relative to all visitors within measurement period (typically per day).
Shopping cart abandonment rate Percent of sessions where item was added to cart but the order was not completed.
% of returning visitors Percentage of returning visitors relative to all visitors within measurement period (typically per day).
Number of returning visitors Number of returning visitors within measurement period (typically per day).
Number of visitors Number of visitors within measurement period (typically per day). A visitor is not necessarily a unique visitor.
Alexa Traffic Rank ™ A measurement of traffic to a website drawn from data provided to the search company Alexa from tracking software embedded in the Alexa Tool bar.
Google PageRank ™ Google’s patented method for measuring page importance on a scale from 0 – 10, where 10 is the highest. The PageRank algorithm analyzes the quality and quantity of links that point to a page.
Average days to purchase Average number of days from first website interaction to purchase.
Average number of page request per visitor
Average number of page requests per visitor within measurement period (typically per day).
Average time spent on web site per visitor Average time spent on web site per visitors within measurement period.
Average time spent on web site per member
Average time spent on web site per member measured within time period (typically per day).
Number of indexed pages Number of indexed pages (e.g. in primary index in case of Google)
Number of newly registered users of web site
Number of newly registered users of web site within measurement period (typically per day). A registered user is typically an individual who registered his/her email address, and received a login/password.
Number of people that provided feedback Number of people that provided feedback. % of Order session Percentage of sessions in which users completed
an order.
47

Total time spent on web site by members The total time spent on the web site by members measured within the time period (typically per day).
Number of ads clicked per visit Number of ads clicked per visit.
Ad click-through ratio (CTR) Click-through ratio (CTR) is the ratio of the number of times and ad is clicked divided by the number of times an ad is viewed.
Average revenue per ad served Average revenue earned per ad served within measurement period.
Revenue from on-line ads The amount of revenue generated by traffic from on-line advertisements. Measures the total revenue combining all outstanding advertisements, and measures the revenue per specific ad source. This helps to gain insight in the return on advertisement investments.
Revenue per visit Revenue from e-commerce divided by the number of visits. The aim is to increase the revenue given the current number of visits.
User liveness Daily on-line activity liveness 3.6.7 Monitoring Objective To determine whether the practices of monitoring the IT resource usage and system operation is effective. Background The monitoring of IT operation process is the main faculty of the operation management of information system. By monitoring the operation deviations, it could be determined whether the system provides related services in accordance with the established objectives. Usually, the organization should build a full performance monitoring plan, with monitoring the system performance and resources utility by the techniques of capability management and performance monitoring, it can achieve the best use of information system resources. Meanwhile, it monitors the operation environment to ensure the confidentiality, integrity and availability of data. The IT staffs are responsible for the monitoring and measurement of the efficiency and effects about the information system operation, in order to ensure the effective use of resources and the continued improvement of processes. Procedures
Review the performance monitoring plan, to check whether the audited entity has monitored the resource usage and operation processes. The performance monitoring
48

plan should be approved and be updated regularly. Evaluate the efficiency of performance monitoring through performance monitoring
report, performance monitoring tools and techniques. Indicators
KPI Description
Number of improvement actions driven by monitoring activities
Number of improvement actions driven by monitoring activities.
% of CIs monitored for performance Percentage of Configuration Item (CIs) that are monitored for performance with systems monitoring tools, relative to CIs that are used to provide services to end-users.
% of disk space used Percentage of disk space used. % of email spam messages stopped/detected
Percentage of email spam messages stopped within measurement period.
% of email spam messages unstopped/undetected
Percentage of email spam messages unstopped within measurement period.
% of monitoring coverage % of servers, networks and applications monitored using monitoring tools
Risk Level Matrix Risk Level Matrix – Measures various risks and their likelihood. The Probability assigned for each threat likelihood level is 1.0 for High, 0.5 for Medium, 0.1 for Low.
% of spam false positives Percentage of spam false positives within measurement period.
% of email addresses that does not exist Percentage of email addresses that does not exist any longer (any longer).
% of resolved calls that have not been closed
Calculation of Resolved calls that have not been closed. This shows the percentage of calls for which user confirmation has not been obtained.
Number of alerts on exceeding system capacity thresholds
Number of alerts/events on exceeding system capacity thresholds. For example, when CPU or memory utilization thresholds on systems are exceeding the set warning limits. Increasing number of alerts may indicate that system capacity nears its maximum.
% of critical IT assets covered by monitoring activities
Percentage of critical IT assets covered by monitoring activities (delectability).
3.6.8 Change Management Objective
49

To determine whether the changes of the information system are controlled and recorded. Background Change management is one of the main manage processes of information system maintenance practices. Usually changes of environment would cause the requirement changes, so the audited entity should have an effective change control. The change process should be authorized properly and tested, and the related activities are controlled. In order to reduce the negative effects caused by changes, the audited entity should build standardized change processes. The standardized change processes can effectively control change requirement, change authorization, change test and change implement. The lack of well change management may bring about the risk of unauthorized. Procedures
Check whether the audited entity builds a formal change management program, analyses the impacts caused by the changes, and builds a rollback program of change failure.
Spot-check a sample of program changes and trace to the maintenance form, to determine whether the change is authorized and the change request is verified and approved.
Check the process of application changes, to determine whether the access to the program library is limited through necessary methods, and whether a test is done to make sure that no new risk is introduced before the formal implement of the changes.
Check application programs changes, to determine whether the system migration process is proper authorized and controlled, whether all the related files are updated timely after system changes deployment, and whether the related staffs are informed about the changes timely.
Review the emergency change program and the incident rate of emergency changes, to check the process quality and the performance of change management.
Indicators
KPI Description
Time lag between changes and updates of documentation and training material
Time lag between changes and updates of training, procedures and documentation materials.
% of backlogged/neglected change requests Percentage of backlogged change requests. Backlogged change requests are change requests that should have been implemented but due to for example time/cost constraints are still outstanding.
50

% of unauthorized implemented changes Number of unauthorized implemented changes relative to all implemented changes within a given time period. An unauthorized change can be detected. A change in infrastructure for which there is not a change registered is considered as unauthorized.
% of urgent changes Number of opened, urgent changes relative to the total number of changes opened in a given time period. This KPI reflects the size of the potential risk of urgent changes on the quality and performance of the change management process.
Number of urgent releases Number of urgent releases.
Mean time (days) Request for Change approval
Is the time that the organization needs between the capture of the demand from the business side (management, key users) till the decision in the IT part to do it. It’s applicable usually to small enhancements in the applications, but is also applicable to infrastructures.
% of planned vs unplanned changes can be calculated using Urgent or Last minute changes added to the schedule
% of refused changes by management Percentage of refused changes by management.
Lead Time to change execution Measures the amount of lead time from the point a change is submitted to the point at which execution will occur. It is a measurement of an organizations ability to plan vs. being reactive.
% of routine changes Percentage of routine changes indicates the maturity level of the process.
% of changes that cause incidents Number of implemented changes that have caused incidents, relative to all implemented changes within a certain time-period. Prerequisite for measuring This KPI indicates that incidents are correlated to changes.
% of implemented changes without impact analysis
Percentage of changes (that required an impact analysis) that were implemented without an Impact Analysis.
51

% of overdue changes Number of overdue changes (not closed and not solved within the established time frame) relative to the number of open changes (not closed but still within the established time frame).
% of changes closed before deadline Percentage of changes closed before deadline.
Number of untested releases Number of untested releases i.e. not tested and signed-off.
Number of changes not formally tracked, reported or authorized
This is the number of changes not formally tracked, reported or authorized. This KPI gives insight in the effectiveness of change management.
Number of backlogged change requests Backlogged change requests are change requests that should have been implemented but due to for example time/cost constraints are still outstanding.
3.6.9 Data Center Objective To determine whether its operation of data center could satisfy the objectives of the audited entity. Background Data center is a complex set of facilities. It contains not only computer systems, but also data communication connection, environmental control equipment, monitoring equipment and security equipments. Usually, data center is the most important asset of the audited entity. Procedures
Check the type and quantity of equipment. Check the operation status and evaluate the availability of data center.
Verify the utilization of major equipment and facilities, and evaluate the cost-effective of IT investments.
Collect data and evaluate the effectiveness of data center to save resources and protect the environment.
Indicators
KPI Description
% of energy used from renewable sources Percentage of energy used from renewable sources (“green energy”).
% of "dead" servers Percentage of “dead” servers i.e. servers that are not used.
52

% of servers located in data centers Centralizing servers in a data center maximizes the efficiency of infrastructure.
Average rack utilization Percentage of rack space in use. % of floor usage Percentage of floor space utilization
Data Center Infrastructure Efficiency (DCiE)
In data centers, the DCiE shows the percentage of electrical power that is used by IT. Then 100% – DCiE is the amount that is used by all other equipment, for example cooling and lighting.
Power usage effectiveness (PUE) PUE is calculated by dividing the total power usage of a data center by the power usage of IT equipment (computer, storage, and network equipment as well as switches, monitors, and workstations to control the data center).
Maximum age of hardware assets Maximum age of hardware assets. Average age of hardware assets Average age of hardware assets.
3.7 Security Objective To determine whether security management conforms to the desirable criteria. Background The chief objective of information security management is to implement the appropriate measurements to eliminate or minimize the impact that various security related threats and vulnerabilities might have on an organization. The ideal information security management enables the desirable services (i.e. availability of services, preservation of data confidentiality and integrity etc.). Procedures
Clarify the security policies and controls. Collect the occurred security events. Assess the risks and its security policies, as well as the security management.
Indicators
KPI Description
Number of detected network attacks Number of detected (successful and unsuccessful) network attacks.
% of personnel trained in safety, security and facilities measures
Percentage of personnel trained in safety, security and facilities measures.
% of systems where security requirements are not met
Percentage of systems where security requirements are not met.
Number of incidents due to physical security breaches or failures
Number of incidents due to physical security breaches or failures.
53

Number of incidents of unauthorized access to computer facilities
Number of incidents of unauthorized access to computer facilities.
Number of incidents where sensitive data were retrieved after media were disposed
Number of incidents where sensitive data were retrieved after media were disposed.
% of backup/archive data that are encrypted
Percentage of backup/archive data that are encrypted.
% of systems covered by antivirus/antispyware software
Percentage of systems (workstations, laptops, servers) covered by antivirus/antispyware software.
% of systems with latest antivirus/antispyware signatures
Percentage of systems (workstations, laptops, servers) with latest antivirus/antispyware signatures.
% of virus incidents requiring manual cleanup
Percentage of virus incidents requiring manual cleanup relative to all virus incidents within measurement period.
% of viruses & spy ware detected in email
Percentage of viruses & spy ware detected in email relative to all viruses & spy ware detected.
Frequency of IT security audits Frequency of IT security audits Number of outgoing viruses/spy ware caught
Number of outgoing viruses/spy ware caught.
% of incidents classified as security related
Security if a major concern to all service provider organizations. International standards call for a special procedure and protocols for all security related issues. This is an important measure that may imply the organization is vulnerable to security related incidents and as is often the case this measure is helped by further analysis as to what communities, technologies or locations are involved in any such incidents.
% of security-related service calls Percentage of security-related service calls.
Cost of security incidents Cost of security incidents due to unauthorized access to systems
Time lag between detection, reporting and acting upon security incidents
Time lag between detection, reporting and acting upon security incidents.
Security audit log coverage The number of equipment security audit log are saved/The number of all equipment should save audit log
% of complex password settings The number of equipment do not have strong password/The number of equipment should have strong password
Time to grant, change and remove access privileges
It records the time to grant, change and remove access privileges.
54

Number of violation in segregation of duties
Segregation of Duties is the separation of incompatible duties that could allow one person to commit and conceal fraud that may result in financial loss or misstatement to the company.
Number of obsolete accounts An obsolete account means the account which is no longer going to be used.
Number of unauthorized IP addresses, ports and traffic types denied
Measuring, monitoring and reporting on information security processes ensure that organizational objectives are achieved, and This KPI can be considered as an example metric.
Number and type of malicious code prevented
Malicious code is a broad category that encompasses a number of threats to cyber-security. This KPI monitors the number and type of malicious code prevented
Number of weaknesses identified by external qualification and certification reports
Number of weaknesses identified by external qualification and certification reports.
Percentage of applications that is not capable of meeting password policy.
Percentage of applications that is not capable of meeting password policy.
3.8 Backup Objective To determine whether the backup plan disaster recovery could make business continued. Background Backup is the process of copying and archiving data to roll back to defined situation if data is lost. Backups have two distinct purposes. Although backup commonly is considered a simple form of and a part of disaster recovery backup should not alone be considered the same as disaster recovery. Organization could only restore data from backup and do not recover the whole system. Procedures Auditors should pay more attention to the following issues:
Success rate of backup operations, data restorations. Average time for data restoration, restore backup, restore off-site backup. Frequency of testing of backup media, Average time between tests of backup. Age of backup. Backup equipment utilization. The capability to recover data critical to business process.
Indicators
KPI Description
55

Frequency of review of IT continuity plan
Time between reviews of IT continuity plan.
% of Business Processes with Continuity Agreements
Percentage of business processes which are covered by explicit service continuity targets.
% of services not covered in Continuity Plan
Percentage of IT services that are not covered in the Continuity Plan
Average time between updates of Continuity Plan
Average time (e.g. in days) between updates of Continuity Plan.
Number of business-critical processes relying on IT not covered by IT continuity plan
It measures the control over the IT process of ensuring continuous service.
% of backup operations that are successful
Percentage of backup operations that are successful.
% of successful data restorations Percentage of successful data restorations.
Frequency of testing of backup media Frequency (in days) of testing of backup media
% of test backup restores that are successful
Percentage of test backup restores that are successful.
Age of backup Age (e.g. in days or hours) of backup.
Average time between tests of backup Average time between tests of backup. The test makes sure that the backup can indeed be restored.
Business Impact Analysis (BIA) Coverage
Percentage of areas covered by a BIA evaluation within the organization. The aim is to check if all critical areas where evaluated in order to establish adequate contingency solutions
Backup equipment utilization It could reflect whether backup equipment is over estimated during procurement.
Number of occurrences of an inability to recover critical data to business process
Sometimes serious file-system or hard disk drive problems may occur. This KPI records the times when critical data cannot be recovered after some serious storage problems.
3.9 Service 3.9.1 Service request Objective To determine whether IT service requests are effectively accepted. Background IT programs provide the platform for business by a variety of services. The quality of IT services represent the performance of IT programs. Users could send request to improve the service or solve the problem met.
56

Procedures Check overdue requests to determine whether requests are accepted timely for
handling. Review the request backlog and analyze the reason to determine whether requests
could be handled effectively. Indicators
KPI Description % of escalated service requests Percentage of closed service requests that have been
escalated to management, relative to all closed service requests within measurement period.
% of incorrectly assigned service requests
Percentage of closed service requests that were incorrectly assigned relative to all closed service requests within measurement period. Incorrectly assigned service requests could be automatically determined, for example, by looking at the number of time a service request was assigned. A request that is assigned more than x times might be considered as incorrectly assigned since it is re-assigned more than average.
% of overdue service requests Number of overdue service requests (not closed and not solved within the established time frame) relative to the number of open (not closed) service requests.
% of reopened service requests Percentage of closed service requests that have been reopened (and therefore initially not resolved according to the customer), relative to closed service requests within a given time period.
Average number of calls/service request per handler
Average number of calls/service requests per employee of call center/service desk within measurement period.
Service request backlog Number of open service requests older than 28 days (or any other given time frame) relative to all open service requests.
% of service requests due to poor performance
Percentage of service requests due to poor performance of services provided to end users.
% of service requests posted via web (self-help)
Percentage of service requests posted via web (self-help) relative to all received service requests.
3.9.2 Service response Objective To determine whether IT service requests are responded and handled timely.
57

Background The response speed of service is important to determine the effect of service and satisfaction. Audit should focus on the handling process of service application, and the proportion of problem-solving. Procedures
Check the handling process of service application; evaluate the reliability and rationality of the process.
Check the response speed; determine whether it satisfies the service request. Check the response effect of service request, evaluate the services effectiveness. Check the number and proportion of unresolved issues; analyse the reasons and
improvement method. Indicators
KPI Description
% of first-line resolution of service requests
Percentage of service requests that were solved by the first-line without assistance of second and/or third-line support relative to all service requests received within the measurement period. This reflects the skills and knowledge of the service desk personnel.
% of response-time SLAs not met Percentage of response-time SLAs not. % of service requests resolved within an agreed-upon period of time
Percentage of service requests resolved within an agreed-upon/acceptable period of time.
% of job vacancies Number of job vacancies (in FTE) relative to the total number of employees (in FTE) in call center. High vacancies indicated slow response.
% of calls answered within set timeframe
Percentage of telephone calls answered within a definite timeframe, e.g. 80% in 20 seconds.
Abandon rate of incoming phone calls Percentage of telephone calls abandoned by the caller while waiting to be answered.
Average speed to answer phone call Average time (usually in seconds) it takes for a telephone call to be answered.
% of dropped telephone calls (DCR) Percentage of telephone calls that were not regular ended due to technical failure, relative to all telephone calls within the measurement period.
Time to fix connectivity problems Average time, in hours, in your corporation to fix network connectivity problems
Time to implement a MAC Average time to do a Move Add or Change for an User
% of system transactions executed within response time threshold during
Percentage of system transactions executed within defined response time threshold during
58

peak-time peak-time. Peak-time is defined as the time frame in which most transactions are performed.
Average service request closure duration
Average amount of time between the registration of service request and their closure within the measurement timeframe.
First-call resolution rate Percentage of customer issues that were solved by the first phone call.
% of service requests closed before deadline
Percentage of service requests closed before deadline.
Total/Mean Time in Queue Calculated in seconds, minutes or hours, the total or average amount of time the support ticket is not being “actively” worked on.
Total/Mean Time to Action (TTTA/MTTA)
Calculated in seconds, minutes or hours, the total or average time it takes from the creation of a support ticket to the first action taken to resolve it.
Total/Mean Time to Escalation (TTTE/MTTE)
Calculated in seconds, minutes or hours, the total or average amount of time the support ticket has been escalated through the support tiers.
Total/Mean Time to Ticket (TTTT/MTTT)
Calculated in seconds, minutes or hours, the total or average time it takes from the reporting of an incident to the generation of the support ticket.
3.9.3 Service satisfaction Objective To determine whether IT service supports business and satisfies users. Background Satisfaction includes multiple factors, including employee satisfaction, customer satisfaction and stakeholder satisfaction. The number of complaints is an important indicator to analyse IT services effectiveness. Auditors could assess whether the IT service meet the business requirement by evaluating the level of satisfaction. Procedures
Check the services satisfaction of employees, customers, and stakeholders through questionnaires, to determine whether the IT function meet business needs.
Check IT service complaints and resolution. Check response time by sampling. Check IT incidents such as spam, computer viruses, to evaluate their impact on users
and business. Indicators
KPI Description
59

% of users satisfied with the delivered function
Percent of users satisfied with the delivered function. Measured based on survey.
% of user complaints due to contracted services
Percentage of user complaints on contracted services as a percentage of all user complaints.
Email abuse complaint rate Percentage of recipients complaining about abuse. Number of complaints Number of complaints received within the
measurement period. Number of compliments Number of compliments received within the
measurement period. Customer satisfaction rate Total score of satisfaction questionnaire/The
number of questionnaires 3.10 Effectiveness 3.10.1 Coverage of the core business Objective To assess the alignment between IT functions and business to make sure that IT can support the business strategy effectively. Background One of the greatest challenges facing organization today is how the investments in IT are integrated within their overall business strategies. Auditors should pay attention to the importance of IT strategic planning, and how management control practices are considered especially the core business is handled automatically by IT. Procedures
Compare the business strategic plans with IT strategic plans to determine whether IT strategic plans are synchronized with the business strategy.
Review all business function. Review IT capabilities, including the IT infrastructure resources, IT supporting resources, the existing system’s or applications’ portfolio. Then auditors can match the IT capabilities to the business functions supported and assess how IT supports these businesses. If there are some IT projects being implemented, then the projects’ documents are also needed to be reviewed to get the information about function list and IT resources deployed to assess which businesses are supported by these projects.
Check the range of IT support business. Examine the percentage of IT functions connected to the business, the percentage of IT objectives that support business objectives, ensure the core business is handled automatically by the computer system.
Assess applications by reviewing application documents (such as plans, development or technical documents, user manual, etc.) and interviewing the key users to get the information about number of user groups, functional fit, cost, risk, data quality, level of systems infrastructure, user friendliness.
Indicators
60

KPI Description
% of IT projects' coverage Business functions achieved by IT project/Business functions involved in all areas
% of IT objectives that support business objectives
Percent of IT objectives in the IT strategic plan that support the strategic business plan
% of core business activities with dependency linkage to IT resources
Percentage of core business activities with a dependency linkage to supporting IT resources and IT infrastructure resources.
Business Value (BV) of application(s) Level of business process support of applications. Calculated by scoring (0=bad, 1=medium, 2=good) the following parameters with weighting: * A- Number of user groups * B- Organizational risk * C- Support to management of organization * D- Strategic coherence * E- Importance for other systems * F- Dependencies on other systems * G- Functional coverage * H- Image * I- Data quality * J- User documentation * K – Functional knowledge
Technical Value (TV) of application(s) Level of efficient and effective technical business process adaptability of applications. Calculated by scoring (0=bad, 1=medium, 2=good) the following parameters with weighting: * A- Continuity of delivery organization * B- Quality of organization, processes, people and procedures * C- Response times to changing business goals * D- Quality of functional structure * E- Amount of corrective maintenance * F- Level of systems infrastructure based on standards * G- Level of deficiencies of ICT components * H- User friendliness * I- Quality of meta definitions * J- Quality of technical documentation * K- Level of technical skills
61

3.10.2 Benefit Objective To determine whether IT benefits audited entity in functional areas. Background IT-related outcomes obviously are not the only intermediate benefit required to achieve audited entity goals. All other functional areas in an organization, such as finance and marketing, also contribute to the achievement of audited entity goals. Auditors should not only pay attention to the direct influence of IT to business processes (such as time saving, cost saving, customer satisfaction, human resource saving and so on), but also refer to financial and marketing reports to assess the indirect influence of IT. The indirect influence may emerge after a long period of the implementation of IT projects. Procedures
Review the financial reports, marketing reports to get the data about budget, revenue and cost, such as ROI, ARPU, MRR, IT budget, advertising revenue, and so on.
Review the transaction logs of reports of business application (such logs or reports may be generated automatically by the applications) to get the workload data, such as number of transactions and the frequency of transactions, etc.
Indicators
KPI Description
Monthly Recurring Revenue (MRR) The sum the monthly contract values. If you are contract value is per year, the MRR for that contract is contract value divided by 12 months.
Average monthly revenue per user (ARPU) Monthly recurring revenue (MRR) divided by the number of total users.
Ratio of % growth of IT budget versus % growth of revenues
Measures the ratio of IT growth to business growth. When IT growth is less than business growth it can indicate economies of scale, improved efficiencies or underinvestment.
Ad revenue per 1000 visits Ad revenue per 1000 visits. Advertising revenue Advertising revenue earned within the
measurement period. Return on Investment (ROI) Return on invested capital: the amount,
expressed as a percentage, that is earned on a capital calculated by dividing the total capital into earnings before interest, taxes, or dividends are paid.
62

Business time savings ratio 1-(The average time of a business process after project is completed)/(The average time of a business process before project begin to implement))
Cost savings ratio 1-(The average cost of a business process after project is completed)/(The average cost of a business process before project begin to implement))
human resource savings ratio 1-(The average human resource cost of a business process after project is completed)/(The average human resource cost of a business process before project begin to implement))
3.10.3 Internal Management optimizing Objective To assess the effectiveness and efficiency of controls and the continuity of improvements.. Background The environment which the audited entity confronted is more and more complex. The effective and continuously optimized internal management includes:
Continuously monitor and evaluate the control environment which enables management to identify control deficiencies and inefficiencies and to initiate improvement actions.
Ensure that the audited entity’s risk appetite and tolerance are understood, articulated and communicated, and that risk to audited entity value related to the use of IT is identified and managed.
Procedures
Check the results of internal controls monitoring and reviews to assess the effective and efficiency of internal controls. Review the improvement plan of internal controls to determine whether the internal controls are improved continuously.
Review the definition of roles and responsibilities to ensure role and responsibility descriptions adherence to management policies and procedures, the code of ethics, and professional practices. Review the document about roles and responsibility allocation (such as segregation of duties control matrix, organization/functional charts, job description, processing control reports and so on) to make sure that there is a clear segregation of duties and the allocated roles and responsibilities are based on approved job descriptions and allocated business process activities.
Indicators
KPI Description
63

Number of control improvement initiatives Number of control improvement initiatives, within measurement period.
Number of conflicting responsibilities in segregation of duties
Number of conflicting responsibilities in the view of segregation of duties.
3.10.4 Public Service Objective To determine whether public service meets the public requirement. Background Electronic government (e-government) is now a mainstream for transforming the public sector so that it makes effective and efficient use of information and communication technologies to achieves its political objectives and provide services to the public. At the same time, public organizations have increasingly limited resources, so new investments have to be made carefully. Procedures
Review the documents that have been publicly disclosed to ensure that the public have been informed enough.
Review the work conducted through on-line systems to check the support level of on-line systems to the daily work of government.
Review public satisfaction management, such as feedbacks, complaints, and so on to ensure there is an objective score mechanism for public satisfaction.
Indicators
KPI Description
% of Information disclosure via Internet
[The number of documents have been publicly disclosed via Internet]/[The number of all documents to be disclosed]
% of on-line work [The number of issues conducted through on-line]/[The number of all issues conducted]
The degree of public satisfaction It reflect the degree that public are satisfy with the public service provided.
3.11 Others Objective To assess and ensure human resources are effectively and efficiently managed, ensure effective communication and reporting among the audited entity, and check other matters to ensure the achievement of project objectives. Background There are many factors that affect the success of IT projects. Human Resource Management of IT projects can provide adequate and reliable human resources to support
64

the project. It is necessary to ensure the effectiveness of the human resource management through the audit. Effective communication channels and a reasonable reporting mechanism are also the necessary conditions to ensure the success of the project. Procedures
Review staffing requirements and plans (such as the approved human resource plans, personnel sourcing plans) and inventory of business and IT human resources on a regular basis or upon major changes to the audited entity or operational or IT environments to ensure that the audited entity has sufficient human resources to support audited entity goals and objectives. Staffing includes both internal and external resources.
Review the Reporting and communication principles or strategies to ensure the establishment of effective communication and reporting among important groups such as board, stakeholders and IT department. Review the meeting schedule and meeting reports to evaluate the compliance with the principles.
Review the post-project review documents to assess how many projects undergo post-project review. In the post-project review, auditors should perform the following functions:
Check the usage of printer papers to evaluate the recycled percentage of printer papers.
Indicators
KPI Description
% of projects with post-project review Percent of projects with a post-project review. Frequency of board reporting on IT to stakeholders
Frequency (e.g. in days) of board reporting on IT to stakeholders.
Staff / Personnel turnover Number of employee departures (in FTE) divided by the average number of staff members (in FTE) employed.
% of recycled printer paper Percentage of recycled printer paper.
65

PART 4 AUDIT REPORT
Reporting is an essential part of auditing work and involves reporting deviations and violations so that corrective actions may be taken, and so that those accountable may be held responsible for their actions. To this end, a written report, setting out findings in an appropriate form, should be prepared at the end of each audit. The principles of completeness, objectivity and timeliness are important in reporting on audits. Auditors take care to ensure that reports are factually correct, and that findings are presented in the proper perspective and in a balanced manner. This involves applying the principle of contradiction which involves checking facts with the audited entity and incorporating responses from responsible officials as appropriate.
4.1 Form and content The form of the written report may depend on the circumstances. However, some consistency in the auditor's report may help users of the report to understand the audit work done and conclusions reached, and to identify unusual circumstances when they arise. The factors that may influence the form of the compliance audit report are numerous. These factors include, but are not limited to, the mandate of the SAI, applicable legislation or regulation, the objectives of the particular compliance audit, customary reporting practice and the complexity of the reported issues. Furthermore, the form of the report may depend on the needs of the intended users, including whether the report is to be submitted to the legislature or to other third parties such as donor organizations, international or regional bodies, or financial institutions. A standardized format for writing audit report should at least include the following sections: 1. Executive Summary: Restate conclusion(s) for each audit objective and summarize significant findings and recommendations. 2. Background: Provide background information about the purpose/mission of the area audited. Indicate whether or not this is a follow-up on a previous audit. 3. Audit Objectives: List all audit objectives. 4. Scope & Methodology: Identify audited activities, time period audited, and nature and extent of audit tests performed. 5. Audit Results: This section should be restricted to documented factual statements, which can be substantiated. Statements of opinion, assumption, and conclusion should be avoided. Each recommendation should be preceded with a discussion of the finding and followed by management's response to the recommendation. If management's response is too lengthy to include in the body of the report, a summary of the response should be included in the report with the complete response attached to the report (i.e., Appendices).
66
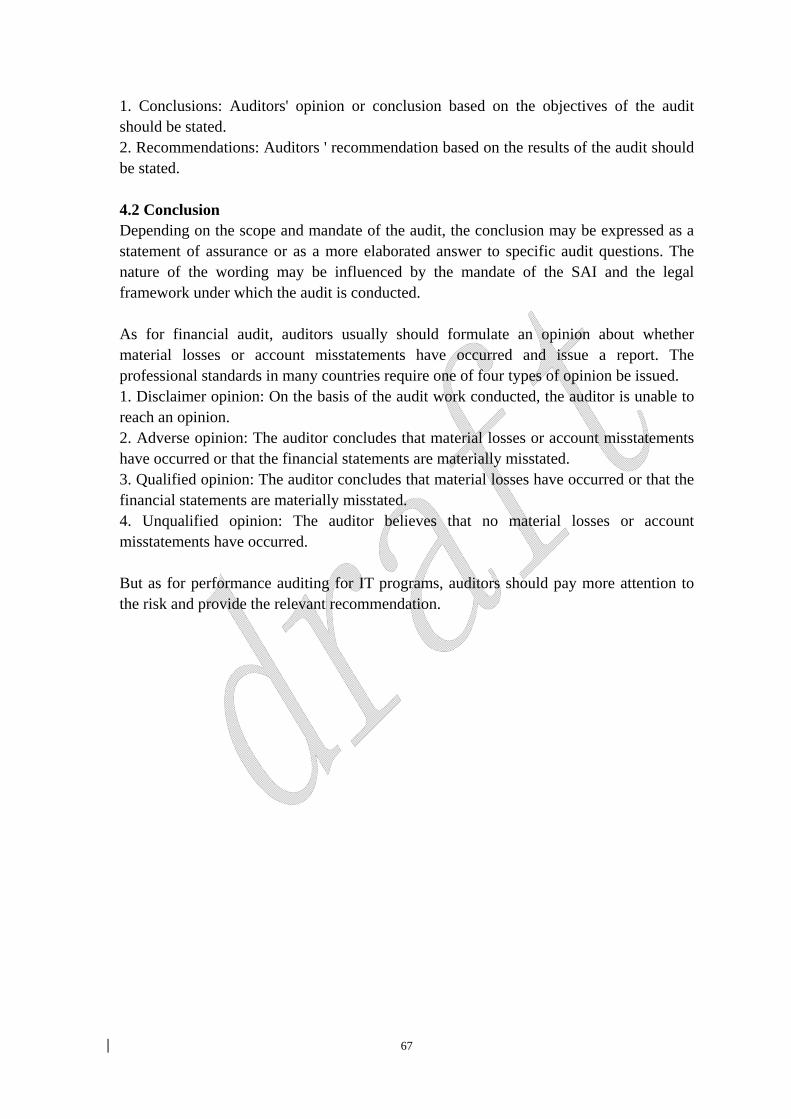
67
1. Conclusions: Auditors' opinion or conclusion based on the objectives of the audit should be stated. 2. Recommendations: Auditors ' recommendation based on the results of the audit should be stated. 4.2 Conclusion Depending on the scope and mandate of the audit, the conclusion may be expressed as a statement of assurance or as a more elaborated answer to specific audit questions. The nature of the wording may be influenced by the mandate of the SAI and the legal framework under which the audit is conducted. As for financial audit, auditors usually should formulate an opinion about whether material losses or account misstatements have occurred and issue a report. The professional standards in many countries require one of four types of opinion be issued. 1. Disclaimer opinion: On the basis of the audit work conducted, the auditor is unable to reach an opinion. 2. Adverse opinion: The auditor concludes that material losses or account misstatements have occurred or that the financial statements are materially misstated. 3. Qualified opinion: The auditor concludes that material losses have occurred or that the financial statements are materially misstated. 4. Unqualified opinion: The auditor believes that no material losses or account misstatements have occurred. But as for performance auditing for IT programs, auditors should pay more attention to the risk and provide the relevant recommendation.