
Infrared Spectroscopy Stuart Ryder Anglo-Australian Observatory [email protected]

INTERSTELLAR ICE: THE INFRARED SPACE OBSERVATORY LEGACY
E. L. Gibb1,2
Department of Physics, University of Notre Dame, Notre Dame, IN 46556
D. C. B. Whittet1
Department of Physics, Applied Physics and Astronomy, Rensselaer Polytechnic Institute, Troy, NY 12180
A. C. A. Boogert
Astronomy Department, California Institute of Technology, Pasadena, CA 91125
and
A. G. G. M. Tielens3
Kapteyn Institute, P.O. Box 800, 9700 AV Groningen, Netherlands
Received 2003 August 22; accepted 2003 November 4
ABSTRACT
We present 2.5–30 �m spectra from the Short-Wavelength Spectrometer of the Infrared Space Observatory for atotal of 23 sources. The sources include embedded young stellar objects spanning a wide range of mass andluminosity, together with field stars sampling quiescent dark clouds and the diffuse interstellar medium. Expandingon results of previous studies, we use these spectra to investigate ice composition as a function of environment. Thespectra reveal an extremely rich set of absorption features attributed to simple molecules in the ices. We discuss theobserved properties of these absorption features and review their assignments. Among the species securelyidentified are H2O, CO, CO2, CH3OH, and CH4. Likely identified species include OCS, H2CO, and HCOOH. Thereis also evidence for NH3 and OCN� ice features, but these identifications are more controversial.
Features that continue to defy identification include the 3.3–3.7 �m ‘‘ice band wing’’ and the bulk of the6.8 �m feature. In addition, we find evidence for excess absorption at 6.0 �m that cannot be attributed to H2O ice.We examine the degree of intercorrelation of the 6.8 �m, 4.62 �m (‘‘XCN’’) and 6.0 �m (excess) features. Ourresults are consistent with the interpretation of the 6.8 and 4.62 �m features as due to NHþ
4 and OCN� ions,respectively, though alternative explanations cannot currently be ruled out. We find that the optical depthcorrelations are dependent on the profile of the 6.8 �m feature but not on the mass of the YSO nor the icetemperature along the line of sight. We discuss the implications for our current understanding of ice processing.We briefly discuss the composition, origin, and evolution of interstellar ices.
Subject headings: dust, extinction — infrared: ISM — ISM: abundances — ISM: molecules — line: profiles
1. INTRODUCTION
Dramatic progress in understanding the nature and evolu-tion of solids in the interstellar medium has been made sincethe 1995 launch of the Infrared Space Observatory (ISO). TheShort-Wavelength Spectrometer (SWS) instrument on-boardISO covered the entire 2.4–45 �m spectral range of interestfor studying vibrational modes of solid state molecules, atresolving powers sufficient to extract the information con-tained within the profiles. Regions of the infrared spectrum notaccessible from the ground because of telluric absorption wereexplored for the first time.
The 2.4–45 �m spectra of sources hidden at visible wave-lengths by large columns of dust contain absorption featuresattributed to refractory solids (principally the Si—O stretchingand O—Si—O bending modes of silicates at 9.7 and 18 �m,respectively), upon which are superposed absorptions of mo-lecular ices when the line of sight intersects a dense molecular
cloud (e.g., Willner et al. 1982; Whittet 2003). The dominantice constituent is H2O, which displays a strong O—H stretchingmode at 3.05 �m together with weaker bending and combi-nation modes at 6.0 and 4.5 �m, respectively, and a librationmode blended with the silicate features near 13 �m. WhilstH2O appears to account for 60%–70% of the ice in most linesof sight (e.g., Whittet 2003), other species detected spectro-scopically include CO, CO2,
13CO2, OCS, CH3OH, CH4,‘‘XCN’’ (a C�N stretch possibly due to OCN�), and possiblyNH3. There are also several features that remain largely un-identified, such as the 6.8 �m feature attributed to C-H de-formation modes and/or NHþ
4 . The excess absorption in thelong-wavelength wing of the 3 �m water feature has also notbeen satisfactorily explained.
Star formation is associated with regions of dense molecularcloud material, and observations of species in the condensedphase provide insight into chemical and physical processes insuch regions. Deep within these protected clouds temperaturescan drop as low as 10 K. At such temperatures, atoms andmolecules will collide with and stick to a grain surface,forming an ice mantle coating. Subsequently, several pro-cesses may act to modify the mantle. Atoms can thermally hopfrom site to site over the ice matrix or undergo quantummechanical tunneling, eventually reacting with another atomor molecule. Water and methanol are believed to form by this
1 New York Center for Studies on the Origins of Life, RensselaerPolytechnic Institute, Troy, NY 12180.
2 Department of Physics, Applied Physics and Astronomy, RensselaerPolytechnic Institute, Troy, NY 12180.
3 SRON, National Institute for Space Research, P.O. Box 800, 9700 AVGroningen, Netherlands.
35
The Astrophysical Journal Supplement Series, 151:35–73, 2004 March
# 2004. The American Astronomical Society. All rights reserved. Printed in U.S.A.

route, adding H atoms to an O atom and CO molecule on thegrain surface, respectively. Gas phase observations of mole-cules such as HDO indicate enhanced abundances, whichcannot be explained by gas phase reactions and also indicateice mantle modification. Close to a forming protostar, in-creasing temperatures and a higher flux of ultraviolet or X-rayphotons lead to high-energy processing of the ice mantle andevaporation of the more volatile species. Studies of laboratoryanalogs have shown that energetic processing of simple icesleads to formation of more complex species such as OCN�,NH2CHO, and C2H5OH (e.g., Bernstein et al. 1995) and or-ganic refractory matter (ORM) (Greenberg et al. 1995) spec-trally similar to an acid-dissolved residue (kerogen) fromMurchison and other carbonaceous meteorites (Cronin &Pizzarello 1990).
Investigating how the composition and structure of icemantles varies as a function of physical environment is vital tounderstanding chemical evolution in the envelopes of youngstars, protoplanetary disks, and comets. Thus far, most studieshave concentrated on a single species (i.e., Gerakines et al.1999; Whittet et al. 2001) or a single spectral feature (i.e.,Chiar et al. 1995; Schutte et al. 1998), while others haveconcentrated on many features in a single source (i.e., vanDishoeck et al. 1998; Gibb et al. 2000). To date, no compre-hensive look at the entire 2.4–45 �m spectral region in a largenumber of sources has been undertaken. With the ISO data-base in the public domain, such a comprehensive study istimely and much needed.
Observations and data reduction are discussed in x 2 and thelaboratory fits in x 3. The nature of each source in our study isbriefly reviewed in x 4. Results are discussed in x 5, and ourconclusions are summarized in x 6.
2. OBSERVATIONS AND DATA REDUCTION
The data used in this paper consist primarily of completegrating scans from 2.4 to 45.2 �m in AOT mode S01 (speed 3or 4) at a resolving power of �R/4 and �R/2, respectively(where R, the full grating resolving power of the SWS, rangesfrom 1000 to 2000). AOT mode S06 scans, which coverlimited spectral ranges with the full resolving power of theSWS, were used when available. A detailed description of theSWS and its mode of operation is given by de Graauw et al.(1996). The observations used in this study are listed in Table 1.They were chosen by searching the ISO SWS database forspectra with S01 speed 3 or higher resolution exhibiting iceabsorption features. The highly reddened hypergiant Cyg OB2No.12 is also included as representative of sight lines thatsample the diffuse ISM (defined here as those in which nosignificant ice is detected).
Data reduction was performed at the Space Research Or-ganization of the Netherlands (SRON) in Groningen, TheNetherlands, using the standard SWS interactive analysispackage and pipeline processing version OLP9.0. Instrumentalfringing can be a problem, particularly longward of about8 �m. We removed fringes when necessary by using theRESP_INTER and FRINGES software routines. The ISOspacecraft records spectra with a grating that scans from low tohigh wavelengths and then from high to low wavelengths,resulting in two scans (the ‘‘up’’ and ‘‘down’’ scans). Thesescans were reduced separately. When flat-fielding, we made areference flat with the down scan, which is less affected bymemory effects, and applied this to the up scan. The final upand down spectra were usually found to agree well in shape
and flux level and the final step was to average the two. Whenmultiple observations in the same grating mode of a singlesource were available, an average was made. In cases of sat-urated absorption features, as occurs at both 3 and 9 �m inW33 A and AFGL 7009S, we applied a filter to the data. Pointswith signal-to-noise ratio of less than 3 or flux density of lessthan 0.1 Jy were removed (see Gibb et al. 2000 for details).For each source, we fit a polynomial to the continuum
regions and used this to derive an optical depth plot. Regionschosen to represent the continuum vary slightly from source tosource to avoid emission features that are present in somelines of sight but not others. Typical regions are shortward of2.7 �m, 4.1–4.15 �m, and 5.1–5.5 �m. To these we fit aleast-�2 polynomial of up to fourth order. This method fordetermining optical depth is inadequate for extracting the6–8 �m ice features since there are no reliable continuumpoints between 5.5 and 30 �m. For this reason, we used acombination of a blackbody fit through the short-wavelengthside (5–5.5 �m) and a polynomial to the relatively smooth30–45 �m region, as discussed in Keane et al. (2001c). Thelack of a continuum region until longward of the 18 �msilicate feature that can be used to constrain a polynomialnecessitates this approach.Once an optical depth spectrum was derived, we calculated
the column density from
N ¼Z
�d�=A; ð1Þ
where A is the band strength (in molecules cm�2) as measuredin the laboratory, N is the column density in cm�2, and � is theoptical depth. Table 2 lists the positions, approximate widths(FWHM), identifications, and band strengths for identified orexpected vibrational modes. We note that the precise positionand width for most species is a function of environment.While many ISO sources in this study have been the subject ofprevious investigations involving fits based on laboratoryanalogs (Chiar et al. 1998; Whittet et al. 1998; Gerakines et al.1999; Boogert et al. 2000; Gibb et al. 2000), several othershave not previously been studied in this way. In these cases,we made a least-squares fit to the feature using both apolar andpolar laboratory spectra from the Leiden Molecular Astro-physics database4 as described in Nummelin et al. (2001). Forother features such as those at 3.46 and 9.75 �m that aresuperposed on a prominent absorption feature, we fitted apolynomial along the wing of the deeper feature to extract theweaker one as discussed in such works as Brooke, Sellgren, &Geballe (1999) and Allamandola et al. (1992). The opticaldepths, FWHM, and column densities derived for each speciesare given on a source-by-source basis in Tables 2–24.
3. FITS WITH LABORATORY ICES
Laboratories designed for studies of interstellar ice analogshave been well documented in the literature (Gerakines et al.1995; Allamandola, Sandford, & Valero 1988; Sandford &Allamandola 1990; Hudson & Moore 1995). The absorbancespectra obtained from these investigations were used to fit thespectra of sources in our study. For several sources with high-quality spectra, we attempted to fit laboratory spectra of allknown ice constituents to the optical depth plots in Figure 1.The ice mixtures used in the fits are given in Table 3.
4 See http://www.strw.leidenuniv.nl/�lab.
GIBB ET AL.36

TABLE 1
Summary of Observations
Position (J2000)
Source R.A. Decl. AOT UTC Date
tint(s) File
W3 IRS 5....................... 02 25 40.5 62 05 51.3 1.3 1997 Jan 17 3434 42701302
6 1997 Jan 17 5668 42701224
AFGL 490...................... 03 27 38.7 58 47 01.1 1.3 1997 Aug 17 3434 64001804
6 1997 Jul 31 6704 62301701
6 1997 Aug 14 1872 63702402
6 1998 Mar 27 11234 82301033
Elias 1 ............................ 04 18 40.7 28 19 16.0 1.3 1997 Sep 19 3434 67301306
Elias 16 .......................... 04 39 38.8 26 11 26.8 6 1997 Oct 01 8682 68600538
Orion BN ....................... 05 35 14.2 �05 22 23.6 6 1997 Oct 12 7598 69602521
Orion IRc2 ..................... 05 35 14.3 �05 22 31.6 6 1997 Sep 06 7654 66002132
Mon R2 IRS 2 ............... 06 07 45.7 �06 22 50.0 1.1 1997 Oct 27 1140 71102004
Mon R2 IRS 3 ............... 06 07 47.8 �06 22 56.8 1.3 1997 Oct 27 3454 71101712
06 07 48.2 �06 22 54.8 6 1997 Oct 27 4098 71101802
AFGL 989...................... 06 41 10.1 09 29 35.8 1.3 1997 Oct 31 3454 72602619
AFGL 2136.................... 11 22 26.2 �13 30 08.3 1.3 1996 Oct 11 3454 33000222
6 1996 Mar 16 2994 12000925
6 1996 Mar 18 1012 12200841
6 1996 Mar 19 1244 12301305
6 1996 Mar 24 3732 12800302
6 1996 Sep 23 4391 31101023
6 1997 Apr 15 6324 51601403
6 1998 Apr 05 648 87200946
Elias 29 .......................... 16 27 09.3 �24 37 21.1 1.3 1996 Aug 09 3454 26700814
6 1995 Aug 03 5668 29200615
Sgr A*............................ 17 45 40.0 �29 00 28.6 1.4 1996 Feb 19 6528 09401801
6 1997 Feb 21 13114 46301102
6 1997 Feb 21 6716 46301201
6 1997 Feb 27 8486 46901903
6 1997 Mar 15 1086 48401630
6 1997 Mar 29 1808 49801104
GCS 3I ........................... 17 46 14.8 �28 49 34.0 1.3 1996 Aug 29 3454 28701246
6 1996 Oct 08 3226 32701543
GCS 4 ............................ 17 46 15.7 �28 49 47.0 1.3 1996 Sep 09 3454 29702147
W33 A............................ 18 14 39.4 �17 52 01.4 1.4 1996 Oct 10 6538 32900920
6 1996 Oct 14 7620 33201806
18 14 39.0 �17 52 04.0 6 1997 Feb 25 7506 46700801
18 14 39.4 �17 52 01.4 6 1997 Apr 17 3328 51501601
AFGL 7009S.................. 18 34 20.6 �05 59 45.2 1.3 1996 Apr 17 3462 15201140
18 34 20.6 �05 59 45.0 6 1996 Mar 24 10802 12800406
6 1996 Sep 02 9559 29001801
6 1997 Mar 02 4910 47201201
R CrA IRS 2.................. 19 01 41.5 �36 58 28.5 1.4 1997 Apr 22 6538 52301201
19 01 41.4 �36 58 31.0 6 1997 Mar 25 6090 49500409
R CrA IRS 1.................. 19 01 50.7 �36 58 9.9 1.4 1997 Apr 22 6538 52301106
AFGL 2591.................... 20 29 24.6 40 11 19.1 1.3 1996 Nov 07 3454 35700734
20 29 24.7 40 11 19.0 6 1995 Dec 15 1972 02800582
20 29 24.5 40 11 19.0 6 1996 Apr 07 2908 14200503
Cyg OB2 12................... 20 32 41.0 41 14 28.3 1.3 1997 Oct 17 3454 33504130
S140 ............................... 22 19 18.2 63 18 47.6 1.4 1996 Jun 24 6538 22002135
22 19 18.2 63 18 47.2 6 1996 Jul 06 5270 26301731
NGC 7538 IRS 1........... 23 13 45.3 61 28 09.9 1.1 1996 Feb 16 916 09102647
1.3 1996 Dec 05 3454 38501842
6 1996 Aug 25 4102 28301235
6 1996 Dec 13 6484 38501937
NGC 7538 IRS 9........... 23 14 01.6 61 27 20.4 1.1 1996 Feb 28 916 09801532
6 1996 Feb 23 6894 09801533
6 1996 Sep 09 1802 28301334
6 1996 Dec 11 4502 39002336
6 1997 Jan 22 3136 43305704
6 1997 Jun 06 3328 56801802
6 1997 Dec 06 6264 75101049
6 1998 Mar 16 2435 85200455
Note.—Units of right ascension are hours, minutes, and seconds, and units of declination are degrees, arcminutes, andarcseconds.

Laboratory fits for CO2 are from Gerakines et al. (1999) orNummelin et al. (2001). Those forCO are fromChiar,Adamson,& Whittet (1996). When published fits were not available, wefollowed the procedures outlined in these and other paperswhereby least-squares fits of laboratory spectra from the LeidenMolecular Database and Hudgins et al. (1993) were made.
There are no appropriate laboratory spectra for the largenumber of molecules present in most sources in this paper.Most laboratory spectra are for mixtures of three or fewercomponents. The ice mixture is known to strongly influencethe shape and position of many features, so a combination ofpure ice spectra is not a reliable way to simulate a mixture. Forexample, the umbrella mode of pure NH3 is at 9.3 �m but shiftsto 9.0 �m when the NH3 is a minor constituent in a polarmantle. Also, interactions of NH3 with the H2O-ice matrix giverise to a broad ammonium hydrate absorption near 3.5 �m.This is obviously not present when a spectrum of pure am-monia is used. Similarly, most CO2 and CO features are con-sistent with two components: polar and apolar ice mixtures.
For this reason, we extracted the ice features for a specificmantle component by, for example, subtracting the waterfeatures from a water/ammonia or water/methanol mixture andscaling the resulting 2–45 �m NH3 or CH3OH spectrum to theappropriate optical depth for that source. Then each ice con-
stituent is added together to build a laboratory spectrum tai-lored to the source in question. This is not a rigorous method offitting a spectrum but serves the purpose of giving a generalpicture of the degree to which current laboratory spectra ac-count for measured absorption features. For ices that exhibitmultiple components, such as polar and apolar CO2, the icemixtures used are those found by fitting routines discussed byGerakines et al. (1999), Chiar et al. (1998), Schutte et al.(1996), Palumbo, Geballe, & Tielens (1997), Gibb et al.(2000), and Gibb, Whittet, & Chiar (2001). In addition to theices, we added an organic refractory component fromGreenberget al. (1995) to sources with excess 6 �m absorption as dis-cussed in Gibb & Whittet (2002).Fits of the optical depth spectra were attempted for selected
sources with deep ice features and good signal-to-noise ratio.The selected sources are W33A, AFGL 7009S, Elias 29,AFGL 2136, AFGL 2591, AFGL 989, NGC 7538 IRS 9, MonR2 IRS 3, S140, and W3 IRS 5. Results are shown in Figure 1.
4. THE SOURCES
4.1. W3 IRS 5
W3 IRS 5 is a doubly peaked, luminous (Ladd et al. 1993,1:7� 105 L�) infrared source in the W3 H ii /molecular cloud
TABLE 2
Some Solid State Transitions Observed in the Infrared
Molecule
k(�m)
��
(cm�1) Vibration Mode
A
(10�17 cm molecule�1) Reference
NH3 ...................... 2.96 45 –N–H stretch 1.1 1
H2O ...................... 3.05 335 O–H stretch 20 1, 2
–CH2–, –CH3...... 3.47 � 10 C–H stretch � 0.1–0.4 1
CH3OH................. 3.53 30 C–H stretch 0.76 1
CH3OH................. 3.95 115.3 C–H stretch 0.51 1
H2S ....................... 3.95 45 S–H stretch 2.9 3
CO2....................... 4.27 18 C–O stretch 7.6 213CO2.................... 4.38 12.9 13C–O stretch 7.8 2
H2O ...................... 4.5 700 3�L and/or �2 þ �L 1.0 2
‘‘XCN’’................. 4.62 29.1 CN stretch � 5 4
CO........................ 4.67 9.71 12CO stretch 1.1 213CO ..................... 4.78 13CO stretch 1.3 2
OCS...................... 4.91 19.6 C–S stretch 17 5
H2CO.................... 5.81 21 C=O stretch 0.96 6
HCOOH ............... 5.85 65 C=O stretch 6.7 7
CH3HCO .............. 5.83 C=O stretch 1.3 7
H2O ...................... 6.02 160 H–O–H bend 0.84 1
HCOO� ................ 6.33 C–O stretch 10 7
Organics ............... 6.82 90 O–H bend, C-H deformation 1 1
HCOOH ............... 7.25 16.8 C–H deformation 0.26 7
HCOO� ................ 7.25 19.8 C–O stretch 0.80 7
HCONH2.............. 7.22 C–H deformation 0.32 7
HCOO� ................ 7.41 17.8 C–O stretch 1.7 7
CH3HCO .............. 7.41 10.6 C–H deformation 0.15 7
SO2 ....................... 7.58 10–30 S–O (�3) asymmetric stretch 3.4 8
CH4....................... 7.70 8 C–H (�4) deformation 0.73 8
CH3OH................. 8.9 34 C–H3 rock 0.13 1
NH3 ...................... 9.35 68 Umbrella 1.3 9
Silicate.................. 9.7 100 Si–O stretch
CH3OH................. 9.75 29 C–O stretch 1.8 1
H2O ...................... 13.3 240 Libration 2.8 5
CO2....................... 15.3 18 O–C–O bend 1.1 2
Silicate.................. 18 O–Si–O bend
References.—(1) d’Hendecourt & Allamandola 1986; (2) Gerakines et al. 1995; (3) Salama et al. 1990; (4) Schutte &Greenberg 1997; (5) Hudgins et al. 1993; (6) Schutte et al. 1993; (7) Schutte et al. 1999; (8) Boogert et al. 1997; (9) Kerkhofet al. 1999.
GIBB ET AL.38
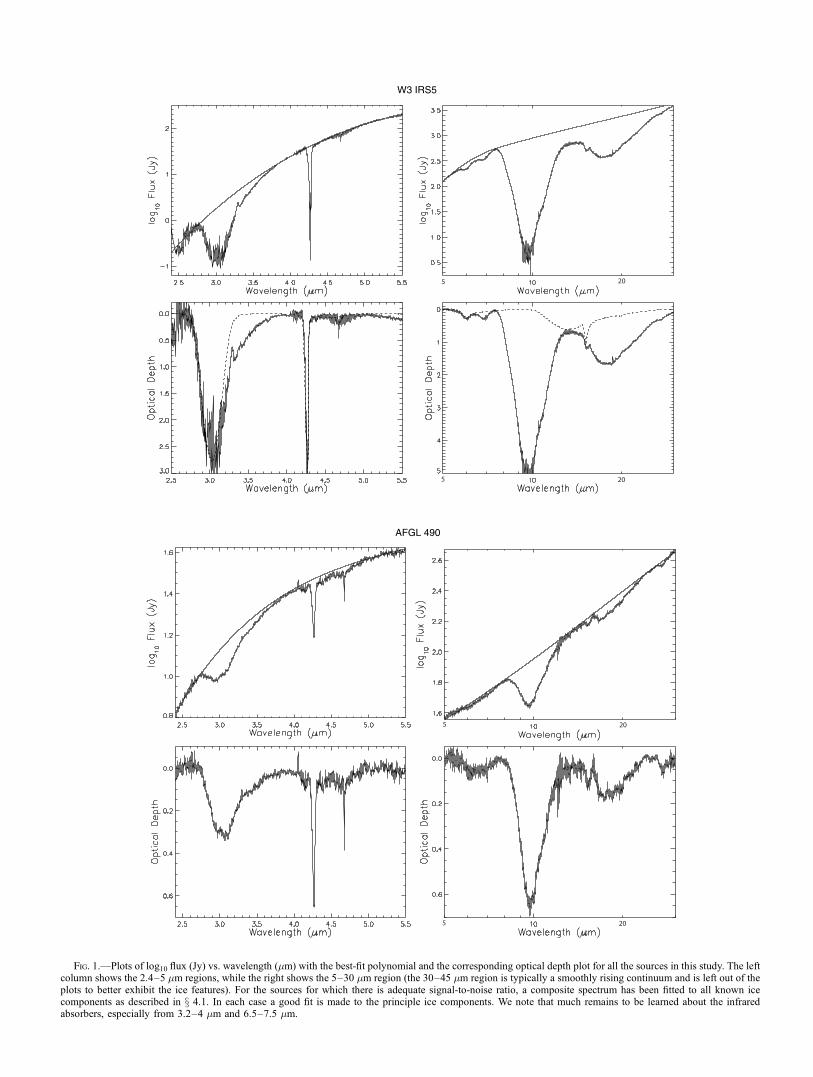
Fig. 1.—Plots of log10 flux (Jy) vs. wavelength (�m) with the best-fit polynomial and the corresponding optical depth plot for all the sources in this study. The leftcolumn shows the 2.4–5 �m regions, while the right shows the 5–30 �m region (the 30–45 �m region is typically a smoothly rising continuum and is left out of theplots to better exhibit the ice features). For the sources for which there is adequate signal-to-noise ratio, a composite spectrum has been fitted to all known icecomponents as described in x 4.1. In each case a good fit is made to the principle ice components. We note that much remains to be learned about the infraredabsorbers, especially from 3.2–4 �m and 6.5–7.5 �m.

Fig. 1.—Continued
40

Fig. 1.—Continued
41

Fig. 1.—Continued
42

Fig. 1.—Continued
43

Fig. 1.—Continued
44

Fig. 1.—Continued
45

Fig. 1.—Continued
46

Fig. 1.—Continued
47

Fig. 1.—Continued
48

Fig. 1.—Continued
49

complex located in the Perseus arm, 2.3 kpc away (Georgelin &Georgelin 1976). Ongoing star formation is indicated byintense OH and H2O maser emission and outflows. Tieftrunket al. (1997) estimated that if each hypercompact continuumsource is being ionized by a single stellar object, then they areof ZAMS spectral type B1–B3. The infrared spectrum ex-hibits emission features due to Ne iii, S iii, and Si ii, as wellas the 3.3 �m PAH emission. In addition to this, gas phaseabsorption lines attributed to warm (Tex � 400–500 K) C2H2,HCN, CO, and H2O are present (Lahuis & van Dishoeck2000; Boonman et al. 2003). Molecular abundances of gasphase species toward this source are unusually low, except forsulfur-bearing species (Lahuis & van Dishoeck 2000). TheISO spectrum shows strong H2O and CO2 features, but the COice feature is weak. Absorptions associated with CH-bearingmolecules are present at 3.46 and 6.8 �m, but other specieshave only upper limits.
4.2. AFGL 490
AFGL 490 is a �2200 L� YSO (Mozurkewich, Schwartz,& Smith 1986) in an isolated star-forming region about 1 kpcaway (Snell et al. 1984), lying behind 17–50 mag of visualextinction (Rieke & Lebofsky 1985). Radio observationsshow evidence of outflows of stellar wind (Mitchell et al.1995). The ISO spectrum of this source shows a low columndensity of ice species along this line of sight along with nu-merous H i emission lines. Most upper limits are not wellconstrained because of the low ice column density. Both COand CO2 are well fit by purely polar mixtures, whereas mosthigh-mass star formation regions have a significant apolarcomponent.
4.3. Elias 1
Elias 1 is classified as a Herbig Ae star (Elias 1978) locatedbehind �10.5 mag of extinction (Teixeira & Emerson 1999)in the Taurus-Auriga complex. The ISO spectrum exhibitssilicate and PAH emission features in addition to absorptionfeatures of H2O, CO, and CO2. The silicate emissivity isbroader than the Trapezium emissivity traditionally used torepresent molecular cloud material and is also different fromthat found in comets, peaking at a longer wavelength anddiffering in overall shape. Hanner, Brooke, & Tokunaga(1994) found that the silicate emissivity can be fit by opticallythin 1.5 �m grains, indicating grain growth, though they donot rule out the possibility of a different silicate compositionto account for the variation. Emission features at 11.06 and11.22 �m are seen in both ISO and ground-based spectra andmay be attributable to crystalline silicates and aromatichydrocarbons, respectively. There is no evidence in the ISOspectrum of the 11.6 and 11.76 �m features tentatively iden-tified in ground-based spectra by Hanner et al. (1994).
4.4. Elias 16
Elias 16 is a K1 III giant located behind the Taurus Mo-lecular Cloud and about 23.5 mag of visual extinction (Teixeira& Emerson 1999). The ices in the line of sight are believedto be free from the influence of massive star formation andmay therefore represent material unmodified by energeticprocessing. Because of the intrinsic faintness of this source,SWS only obtained useful data in limited spectral regionsbetween 2.5 and 5 �m. Ground-based data, which matchwell in flux level, have been used to fill in some regions not
Fig. 1.—Continued
GIBB ET AL.50
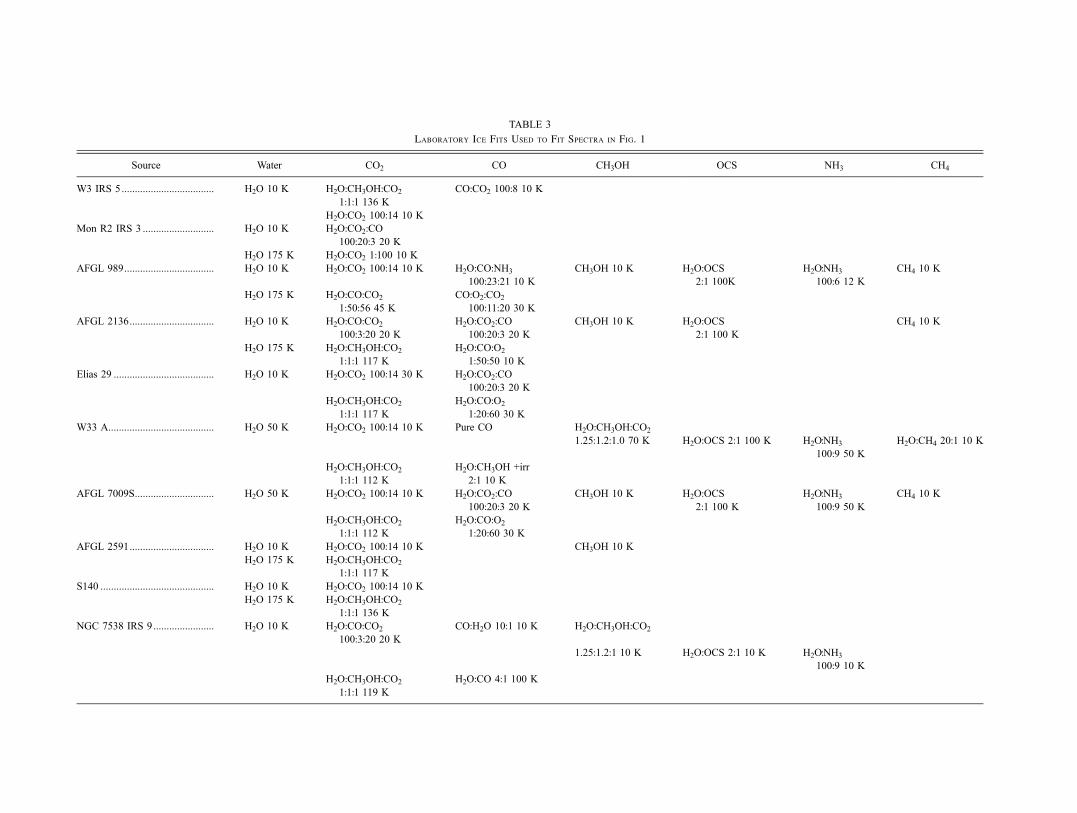
TABLE 3
Laboratory Ice Fits Used to Fit Spectra in Fig. 1
Source Water CO2 CO CH3OH OCS NH3 CH4
W3 IRS 5................................... H2O 10 K H2O:CH3OH:CO2
1:1:1 136 K
CO:CO2 100:8 10 K
H2O:CO2 100:14 10 K
Mon R2 IRS 3 ........................... H2O 10 K H2O:CO2:CO
100:20:3 20 K
H2O 175 K H2O:CO2 1:100 10 K
AFGL 989.................................. H2O 10 K H2O:CO2 100:14 10 K H2O:CO:NH3
100:23:21 10 K
CH3OH 10 K H2O:OCS2:1 100K
H2O:NH3
100:6 12 K
CH4 10 K
H2O 175 K H2O:CO:CO2
1:50:56 45 K
CO:O2:CO2
100:11:20 30 K
AFGL 2136................................ H2O 10 K H2O:CO:CO2
100:3:20 20 K
H2O:CO2:CO
100:20:3 20 K
CH3OH 10 K H2O:OCS
2:1 100 K
CH4 10 K
H2O 175 K H2O:CH3OH:CO2
1:1:1 117 K
H2O:CO:O2
1:50:50 10 K
Elias 29 ...................................... H2O 10 K H2O:CO2 100:14 30 K H2O:CO2:CO
100:20:3 20 K
H2O:CH3OH:CO2
1:1:1 117 K
H2O:CO:O2
1:20:60 30 K
W33 A........................................ H2O 50 K H2O:CO2 100:14 10 K Pure CO H2O:CH3OH:CO2
1.25:1.2:1.0 70 K H2O:OCS 2:1 100 K H2O:NH3
100:9 50 K
H2O:CH4 20:1 10 K
H2O:CH3OH:CO2
1:1:1 112 K
H2O:CH3OH +irr
2:1 10 K
AFGL 7009S.............................. H2O 50 K H2O:CO2 100:14 10 K H2O:CO2:CO
100:20:3 20 K
CH3OH 10 K H2O:OCS
2:1 100 K
H2O:NH3
100:9 50 K
CH4 10 K
H2O:CH3OH:CO2
1:1:1 112 K
H2O:CO:O2
1:20:60 30 K
AFGL 2591................................ H2O 10 K H2O:CO2 100:14 10 K CH3OH 10 K
H2O 175 K H2O:CH3OH:CO2
1:1:1 117 K
S140 ........................................... H2O 10 K H2O:CO2 100:14 10 K
H2O 175 K H2O:CH3OH:CO2
1:1:1 136 K
NGC 7538 IRS 9....................... H2O 10 K H2O:CO:CO2
100:3:20 20 K
CO:H2O 10:1 10 K H2O:CH3OH:CO2
1.25:1.2:1 10 K H2O:OCS 2:1 10 K H2O:NH3
100:9 10 K
H2O:CH3OH:CO2
1:1:1 119 K
H2O:CO 4:1 100 K

covered by SWS. The spectrum shows deep absorption at-tributed to H2O, CO2, and CO (Whittet et al. 1998) as wellas a weak feature at 3.47 �m attributed to hydrocarbons(Chiar et al. 1996). Stellar photospheric absorption lines ofCO and OH are also present. There are low upper limits ofCH3OH (2.9%), XCN (1.5%), and OCS (0.27%) relative toH2O. This supports the theory that CH3OH and XCN areformed by thermal or UV processing in the protostellarenvironments where they are found to be more abundant.
4.5. Orion BN
BN is a luminous infrared source (�2500 L�) in the OrionMolecular Cloud complex suffering from �17 mag of visualextinction (Gezari, Backman, & Werner 1998). It is locatedabout 450 pc away and is probably illuminated by a B3–B4star (Gezari et al. 1998), though there are many other sourcespresent in the 1400 � 2000 ISO SWS beam, including OrionIRc2, which is �800 away. Its infrared spectrum is rich in bothice absorption and emission features caused by PAHs, H2 andH i, and atomic fine structure lines from the foreground pho-todissociation region (PDR) and H ii region (van Dishoeck et al.1998). The 3.1 �m water-ice feature exhibits narrow spectralstructure, indicative of warm temperatures and annealing.
4.6. Orion Irc2
Orion Irc2 is another luminous (�1000 L�) object located inthe OMC complex behind about 60 mag of visual extinction(Gezari et al. 1998). There are at least four sources within theSWS beam (van Dishoeck et al. 1998). This region is one ofthe best studied massive star formation regions to date. Theenvironment is complex with powerful, disrupting outflowsand intense UV radiation that gives rise to atomic fine struc-ture lines. PAH emission features are present at 3.3, 6.2, 8.6,and 11.3 �m and may originate on the front side of the pho-ton-dominated region (Tielens et al. 1993). In addition to theseare ice absorption features due to H2O, CO2, and other minorconstituents and gas phase absorption features due to CO,C2H2, HCN, and CO2. There are also over a dozen rotationallines of H2O in absorption in the 25–45 �m region and OHlines at 28.94 and 34.6 �m, which probably originate in theshocked plateau (van Dishoeck et al. 1998).
4.7. Mon R2 IRS 2
Mon R2 is a massive star formation region located 950 pcfrom the Sun. Most of the infrared cluster, including IRS 2,appears to be on the far side of the molecular cloud (Choi et al.2000). IRS 2 is located within a hole in the molecular
TABLE 4
W3 IRS 5 Spectral Features
k(�m)
FWHM
(cm�1) � Species
N
(1017 cm�2)
N/N(H2O)
*100 Reference
3.0....................... 335 2.78(0.19) H2O 51(3.5) 100 1
3.29..................... 37 PAH 2
3.461................... 95 0.133(0.019) HAC . . . . . . 3
3.54..................... 30 <0.04 CH3OH <1.7 <3.3 2
3.95..................... 115.3 <0.012 CH3OH <2.8 <5.6 2
4.27..................... 20 >3 CO2 7.1(1.8) 13.9(3.5) 4
4.38..................... 8.9 0.073(0.012) 13CO2 0.063(0.013) 0.12(0.025) 5
4.5a ..................... 700 [0.069] H2O [51] [100] 2
4.62b ................... 28 <0.02 XCN <0.12 <0.23 2
4.67b ................... 6.0 0.24(0.02) CO 1.6(0.29) 3.1(0.57) 2
0.07 (Polar) 0.70 1.4 2
0.17 (Nonpolar) 0.99 1.9 2
4.91..................... 20 <0.04 OCS <0.05 <0.1 2
5.83..................... 21 <0.05 H2CO <0.59 <1.2 2
5.85..................... 65 <0.05 HCOOH <0.62 <1.2 2
6.02..................... 157 0.26(0.02) H2O 51(4) 100(8) 6
6.0....................... <0.03 Organic residue 2
6.2....................... <0.02 PAH? . . . . . . 6
6.85..................... 99 0.22(0.02) Organics/NHþ4 . . . . . . 6
7.243................... 16.8 � 0.028 SO2 gas 0.5(0.08) . . . 7
7.414................... 17.8 <0.054 SO2 gas . . . . . . 7
7.676................... 10 <0.046 CH4 <0.67 <1.3 2
9.0....................... 68 <0.055 NH3 <2.9 <5.7 1
9.7....................... 218 � 5.8 Silicate . . . . . . 2
9.75..................... 30 <0.36 CH3OH <6.4 <12.5 2
13.3a ................... 240 [1.30] H2O [51] [100] 2
15.2..................... 24.6 0.37(0.01) CO2 7.1(1.8) 13.9(3.5) 4
(Polar) 6.2 12.2 4
(Nonpolar) 0.9 1.8 4
18........................ 201 1.29 Silicate . . . . . . 2
Notes.—The up and down scans in the aot1 spectrum do not match between 6.5 and 8 �m. The down scan matches the aot6 spectrum, sowe used that instead. There are emission lines at 15.55 �m (Ne iii
3P13P2), 18.71 �m (S iii
3P23P1), 33.48 �m (S iii
3P13P0), and
34.81 �m (Si ii 2P3=22P1=2).
a Calculated from 3 �m feature.b Gas phase CO.References.—(1) Gibb et al. 2001; (2) this work; (3) Brooke et al. 1996; (4) Gerakines et al. 1999; (5) Boogert et al. 2000; (6) Gibb &
Whittet 2002; (7) Keane et al. 2001c.
GIBB ET AL.52 Vol. 151

emission and coincident with an H ii region (IRS 1), greatestmolecular densities occurring just beyond the boundaries ofthe H ii region. The infrared spectrum shows strong PAHemission features along with atomic fine structure emission.H2O and CO2 are the principle ice components, though XCN,CH3OH, and CO are also present.
4.8. Mon R2 IRS 3
Mon R2 IRS 3, one of the brightest thermal infrared sourcesin the galaxy, is another massive star-forming region in theMon R2 core. It is associated with the brightest and mosthighly variable OH 4765 MHz maser in the sky as well as thestrongest H2O and CH3OH masers in the Mon R2 region(Smits, Cohen, & Hutawaradorn 1998). There is evidence of amolecular outflow associated with the maser and circumstellardisk (Koresko et al. 1993). IRS 3 is the most active center ofstar formation in Mon R2 and unlike the other sources in theinfrared cluster, IRS 3 appears to be on the nearside of a denseclump of molecular material (Choi et al. 2000). The peak ofits 3 �m H2O feature is narrow and shifted, indicating thatmost of the ice along the line of sight is warm (�80 K) andhas undergone annealing. This spectrum is unusual in thatit has very deep excess absorption on both short- and long-wavelength wings of the water feature (Smith, Sellgren,& Tokunaga 1989) with a profile that is not matched by anyother known sources. This excess has yet to be explained but
may be caused by a combination scattering and absorption byCH-bearing molecules. Most of the CO in this source has beenevaporated, which is not surprising given the high watertemperatures. Keane et al. (2001b) reported gas phase SO2 inabsorption toward this and other YSOs.
4.9. AFGL 989
AFGL 989 is an intermediate-mass YSO surrounded byembedded low-mass stars (Schreyer et al. 1997) located in theNGC 2264 molecular cloud complex near the apex of theCone Nebula at a distance of 800 pc (Wynn-Williams 1982). Itis also known as NGC 2264 IRS 1 and Allen’s source. Theluminosity (Henning, Pfau, & Altenhoff 1990, 3:3� 103 L�)is consistent with a 9.5 M� B2 zero-age main-sequence star(Allen 1972) with 20–30 mag of visual extinction (Thompsonet al. 1998). This source has an unusually high abundance ofCO2, �34%, (Nummelin et al. 2001) about twice the averagefound by Gerakines et al. (1999) in a variety of sources fromhigh-mass YSOs to background field stars.
4.10. AFGL 2136
AFGL 2136 is a luminous, 7� 104 L� source at a distanceof about 2 kpc. This source is associated with a bipolar re-flection nebula that suggests the presence of a circumstellardisk as well as intense H2O maser emission (Minchin et al.1991). Low abundances of apolar ice species (Sandford et al.
TABLE 5
AFGL 490 Spectral Features
k(�m)
FWHM
(cm�1) � Species
N
(1017 cm�2)
N/N(H2O)
*100 Reference
3.0....................... 432 0.32(0.01) H2O 6.2(0.3) 100 1
3.46..................... 121 0.03 HAC . . . . . . 2
3.54..................... 30 <0.015 CH3OH <1.25 <20 2
3.95..................... 115 <0.004 CH3OH <1.26 <20 2
4.27..................... 21.3 0.46(0.05) CO2 1.7(0.3) 27(5) 3
4.38..................... 12.9 <0.056 13CO2 <0.099 <1.6 2
4.5a ..................... 700 [0.009] H2O [6.2] [100] 2
4.62b ................... 29 <0.025 XCN <0.077 <1.2 2
4.67..................... 4.15 0.34(0.03) CO 1.56(0.13) 25.1(2.4) 2
<0.02 (Polar) <0.25 <4 2
0.33 (Nonpolar) 1.53 24.6 2
4.91..................... 20 <0.02 OCS <0.026 <0.42 4
6.02a ................... 185 [0.034] H2O [6.2] [100]
6.0....................... 0.04(0.02) Organic residue . . . . . . 2
6.85..................... 88 0.05(0.02) Organics/NHþ4 . . . . . . 2
7.25..................... 16.8 <0.018 HCOOH <1.2 <19 2
7.414................... 17.8 <0.018 HCOO� <0.20 <3.2 2
10.6 <0.018 CH3HCO <1.3 <21 2
7.676................... 7.70 <0.013 CH4 <0.15 <2.4 2
8.90..................... 34 [�0.003] CH3OH [�0.69] [11] 2
9.0....................... 68 <0.02 NH3 <1.0 <16 1
9.7....................... 211 0.64(0.02) Silicate . . . . . . 2
9.75..................... 30 0.039(0.014) CH3OH 0.69(0.25) 11(4) 2
13.3a ................... 240 [0.082] H2O [6.2] [100] 2
15.2..................... 22.2 0.08(0.02) CO2 1.7(0.3) 27(5) 3
(Polar) 1.7 27 3
(Nonpolar) <0.1 <1.6 3
18........................ 122 0.16(0.01) Silicate . . . . . . 2
Note.—There are emission lines at 2.626 �m (Br�), 4.052 �m (Br� ), 2.675 �m (Pf�), 2.7572 �m (Pf�) 2.8719 �m (Pf),3.037 �m (Pf), and 3.296 �m (Pf�).
a Calculated from 3 �m feature.b Gas phase CO.References.—(1) Gibb et al. 2001; (2) this work; (3) Gerakines et al. 1999; (4) Palumbo et al. 1997.
INTERSTELLAR ICE 53No. 1, 2004

1988; Schutte et al. 1996) and modeling of submillimeterflux densities (van der Tak et al. 1999) indicate that dust andgas temperatures of �30 K dominate along most of the lineof sight. This is consistent with the shape of the 3 �m waterprofile as well as the 9.75 �m CH3OH feature, which isbest fitted by a pure 50 K methanol laboratory spectrum.Mitchell et al. (1990) find that while most of the CO gas ishot (�580 K), there is also a substantial cold (�17 K) compo-nent. Likewise, Boonman et al. (2003) and Lahuis & vanDishoeck (2000) find substantial column densities of hot
(500–800K)H2O,C2H2, andHCNgaswithonlya small coldgascomponent.
4.11. Elias 29
Elias 29 is a low-mass (36 L�) class I protostar locatedbehind �47.8 mag of visual extinction (Teixeira & Emerson1999) in the � Oph molecular cloud at a distance of �160 pc.This source is ideal for studying processes in low-mass starformation regions as it is one of the most luminous protostarsin the � Oph cloud (Chen et al. 1995). The full 2.3–190 �m
TABLE 6
Elias 1 Spectral Features
k(�m)
FWHM
(cm�1) � Species
N
(1017 cm�2)
N/N(H2O)
*100 Reference
3.0....................... 358 0.51(0.04) H2O 9.2(1.4) 100 1, 2
3.29..................... 44.6 . . . PAH emission . . . . . . 1
3.42..................... 34 �0.24(0.02) HAC . . . . . . 3
3.54..................... 24 �0.40(0.02) ? . . . . . . 3
4.27..................... 12.5 1.5(0.5) CO2 4.8(1.6) 52(19) 1
4.38..................... 10 <0.15 13CO2 <0.20 <2.2 1
4.5a ..................... 700 [0.013] H2O [9.5] [100] 1
4.62..................... 28 <0.16 XCN <0.95 <10 1
4.674................... 9.48 0.14 CO 0.8(0.2) 8.7(2.4) 4
0.04(0.03) (Polar) 0.3(0.2) 3.3(2.4) 4
0.10(0.03) (Apolar) 0.5(0.2) 5.4(2.4) 4
4.91..................... 20 <0.13 OCS <0.16 <1.7 1
6.02b ................... 185 . . . H2O . . . . . .
6.23..................... 65 . . . PAH emission . . . . . . 3
6.85b ................... 88 . . . Organics . . . . . .
7.74..................... 79 . . . PAH emission . . . . . . 1
8.61..................... 35.7 . . . PAH emission . . . . . . 1
9.7....................... 324 �1.0(0.05) Silicate . . . . . . 1
11.3..................... . . . PAH emission . . . . . . 3
13.3a ................... 240 [0.086] H2O [9.5] [100] 1
15.2..................... 22 0.14(0.02) CO2 3.0(0.9) 33(11) 1
Note.—There is an emission line at 4.05 �m (Br� ).a Calculated from 3 �m feature.b Poor S/N, PAH emission.References.—(1) This work; (2) Whittet et al. 1983; (3) Hanner et al. 1994; (4) Chiar et al. 1995.
TABLE 7
Elias 16 Spectral Features
k(�m)
FWHM
(cm�1) � Species
N
(1017 cm�2)
N/N(H2O)
*100 Reference
2.96..................... NH3 <10 1
3.0....................... 335 1.36(0.03) H2O 25(0.6) 100 1,2
3.25..................... <0.029 C-H stretch . . . . . . 3
3.47..................... 60 0.032(0.002) HAC . . . . . . 2
3.54..................... 30 <0.02 CH3OH <0.72 <2.9 2
4.27..................... 19.6 1.8(+0.5, �0.2) CO2 4.6(+1.3, �0.6) 24.2(6.8, �3.2) 4
(Polar) 4.6 24.2 4
(Apolar) <0.2 <0.8 4
4.38..................... 8.5 0.060(0.017) 13CO2 0.047(0.015) 0.19(0.08) 5
4.5a ..................... 700 [0.036] H2O [25] [100] 1
4.62..................... 28 <0.05 XCN <0.28 <1.5 6
4.67..................... 4.75 1.31(0.03) CO 6.5(0.3) 25 7
0.11(0.03) (Polar) 0.8(0.2)
1.22(0.03) (Apolar) 5.6(0.1)
4.91..................... 20 <0.04 OCS <0.052 <0.27 8
a Calculated from 3 �m feature.References.—(1) Gibb et al. 2001; (2) Chiar et al. 1996; (3) Sellgren et al. 1994; (4) Gerakines et al. 1999; (5) Boogert et al. 2000;
(6) Whittet et al. 2001; (7) Chiar et al. 1995; (8) Palumbo et al. 1997.
GIBB ET AL.54 Vol. 151

spectrum was studied in detail by Boogert et al. (2000). Thissource has a somewhat unusual spectral energy distributionthat is very flat up to �100 �m. While hot (�500 K) H2O andCO gas have been observed, the ices do not show signs ofthermal processing. There is also evidence of PAH materialwith absorptions at 3.25, 3.49, and possibly 6.2 �m.
4.12. Sgr A*
Sgr A* is a Galactic center (GC) source suffering �30 magof visual extinction (Lutz et al. 1996), which arises from bothdiffuse and dense regions of the ISM (Chiar et al. 2002). The1400 � 2000 SWS beam included H ii regions, M giants, andsupergiants. The infrared spectrum has a strong absorptionfeature at 2.96 �m, suggestive of the N-H stretch feature inNH3, but whose true nature is unknown (Chiar et al. 2000;Gibb et al. 2001). Other features include prominent H2O, CO2,and CH4-ice absorption, and HAC absorption features at 3.4,6.2, 6.8, and 7.25 �m (Chiar et al. 2000). Moneti, Cernicharo,& Pardo (2001) find that most of the water along the line ofsight is in the solid phase, originating in dense molecularclouds, and that most of the H2O that is in the gas phase is cold,
consistent with the conclusion of Gerakines et al. (1999) thatmost of the CO2 along the line of sight is colder than 50 K.
4.13. GCS 3I and GCS 4
GCS 3I and GCS 4 are in a region located approximately40 pc from the Galactic center near the GC Radio Arc. Thesesources are believed to lie behind �29 mag of visual extinctionand are in a region known as the Infrared Quintuplet, containingseveral bright and many faint IR sources whose nature is stillunknown (Chiar et al. 2000). Both spectra exhibit atomic finestructure lines. As with Sgr A*, these lines of sight interceptboth dense clouds and diffuse-ISM dust. Ices in the dense-cloudcomponent are represented by features of H2O, CO2, and CO,whilst hydrocarbon features at 3.28, 3.4, 6.2 and 6.8 �m arise ineither diffuse-ISM or circumstellar material. The GC sourcesalso show excess absorption near 2.95 �m that might be in-dicative of NH3 along the line of sight (Chiar et al. 2000).
4.14. W33 A
W33 A is a massive, luminous (1:1� 105 L�) YSO located�4 kpc from the Sun in the W33 H ii molecular cloud
TABLE 8
Orion BN Spectral Features
k(�m)
FWHM
(cm�1) � Species
N
(1017 cm�2)
N/N(H2O)
*100 Reference
3.0....................... 353 1.44(0.04) H2O 25(0.7) 100 1
3.3....................... . . . PAH emission . . . . . .
3.459................... 78 0.034 HAC . . . . . . 2
3.53..................... 29 <0.02 CH3OH <0.9 <4 3
3.95..................... 115.3 <0.03 CH3OH <6.8 <27 3
4.27..................... 21.6 0.96(0.04) CO2 2.9(0.1) 11.6(0.5) 3
(Polar) 0.97 3.9 3
(Nonpolar) 1.93 7.7 3
4.38..................... 9.5 <0.021 13CO2 <0.037 <0.15 3
4.5a ..................... 700 [0.034] H2O [25] [100]
4.62b ................... 28 <0.04 XCN <0.24 <0.95 3
4.67b ................... . . . . . . CO . . . . . .
4.91..................... 19.6 <0.016 OCS <0.02 <0.08 3
6.02a ................... 172 [0.073] H2O [25] [100]
6.0....................... 0.17(0.01) Organic residue . . . . . . 3
6.2....................... 60 . . . PAH emission . . . . . .
6.85..................... 79 0.28(0.02) Organics/NHþ4 . . . . . . 3
7.243................... 16.9 0.04(0.01) HCOOH 2.4(0.6) 9.4(2.4) 3
HCOO� 0.77(0.2) 3.1(0.8) 3
7.414................... 17.8 <0.052 HCOO� <0.58 <2.3 3
10.6 CH3HCO <3.9 <16 3
7.676................... 10.4 <0.028 CH4 <0.42 <1.7 3
9.0....................... 68 <0.05 NH3 <2.5 <10 1
9.7....................... 304 1.59(0.02) Silicate . . . . . . 3
13.3a ................... 240 [0.22] H2O [25] [100]
13.7..................... C2H2 gas . . . . . .
14........................ HCN gas
15.24c ................. 27.4 0.07(0.02) CO2 1.9(0.5) 7.6(2.2) 3
18........................ 160 0.45(0.02) Silicate . . . . . . 3
Note.—There are emission features at 2.4065 �m (H2? 1–0), 2.4137 �m, 2.4238 �m (H2 1–0 Q(3)), 2.4377 �m, 2.4548 �m,2.4758 �m, 2.5004 �m, 2.625 �m (Br�), 2.676 �m, 2.803 �m, 2.873 �m (Pf), 2.974 �m, 3.004 �m, 3.038 �m (Pf), 3.235 �m(H2 1–0 O(5)), 3.296 �m (Pf�), 3.501 �m, 3.739 �m (Pf ), 3.808 �m, 3.847 �m, 3.908 �m, 4.051 �m (Br� ), 4.652 �m (Pf�),4.695 �m, 5.052 �m, 5.512 �m (H2 S(7)), 6.488, 6.523, 6.573, 6.594, 6.636 �m (Ni ii 2D3=2
2D5=2?), 6.676, 6.709, 6.724,6.794, 6.829, 6.865, 6.911, 6.985 �m (Ar ii 2P1=2
2P3=2), 7.05, 7.348 �m (SO2), 7.461 (H i 6–5), 7.66 �m (CH4), 8.991 �m(Ar iii 3P1
3P2), 9.665 (H2?), 10.510 �m (S iv2P3=2
2P1=2), 12.814 �m (Ne ii2P1=2
2P3=2), 15.555 �m (Ne iii3P1
3P2),18.713 �m (S iii
3P23P1), 25.249 �m (SI 3P1
3P2), 33.48 �m (S iii3P1
3P0), and 34.819 �m (Si ii 2P3=22P1=2).
a Calculated from 3 �m feature.b Gas phase CO.c Affected by fringing.References.—(1) Gibb et al. 2001; (2) Brooke et al. 1996; (3) this work.
INTERSTELLAR ICE 55No. 1, 2004

complex and hidden by 50–150 mag of visual extinction(Capps, Gillett, &Knacke 1978; Goss,Matthews, &Winneberg1978; Mitchell et al. 1990). The infrared spectrum of W33 Ais particularly rich, being dominated by deep absorptionfeatures attributed to solid H2O and silicates with detectionsof sulfur-bearing species (OCS, SO2), CO, CO2,
13CO2, CH4,NH3, and one of the highest abundances of CH3OH reportedto date (Gibb et al. 2000; Dartois et al. 1999). The spectrumalso has the deepest 4.62 �m (XCN) and 6.8 �m organicfeatures reported to date as well as a very deep wing longwardof the 3.1 �m H2O feature. Most of the ice along the lineof sight is dominated by a cold component, though warmerregions (�120 K) are also evidenced by a high abundanceof CO in the gas phase (Mitchell, Allen, & Maillard 1988;Mitchell et al. 1990), the relative weakness of the pureCO component, and annealing of the 15.2 �m CO2 feature(Gerakines et al. 1999). Evidence for energetic processing isprovided by the presence of abundant CH3OH and XCN. Inaddition, W33 A has the deepest excess absorption at 6 �m,which Gibb & Whittet (2002) attribute to an organic refractorycomponent, also formed by energetic processing of icy mantlematerial. Lahuis & van Dishoeck (2000) report a detectionof cold C2H2 (10 K) and HCN (80 K) gas.
4.15. AFGL 7009S
AFGL 7009S is classified as an ultracompact H ii regionand is one of the most massive YSOs studied to date, on a par
with W33 A. It is a class I YSO, either of late O or early Btype. The ISO spectrum is similar in many respects to that ofW33 Awith deep 4.62 and 6.8 �m features. It is also saturatedthroughout the 3 �m H2O-ice feature. The H2O column den-sity was estimated by d’Hendecourt et al. (1996) using boththe 6 and 13 �m features. Gibb & Whittet (2002) also reportexcess absorption at 6 �m attributable to an organic residue,consistent with UV processing of the mantle material.
4.16. R CrA IRS 2
The Corona Australis molecular cloud complex is one ofthe nearest star-forming regions at a distance of �130 pc(Marraco & Rydgren 1981). Wilking, Taylor, & Storey (1986)identified IRS 2 as one of the protostellar regions based on itsspectral energy distribution. It has a bolometric luminosity of�10 L� and lies behind �32 mag of extinction. Longward of5 �m, the SWS spectrum of this source has a high amountof scatter and was not included in the analysis with the ex-ception of an AOT6 observation of the 15.2 �m CO2 feature.
4.17. R CrA IRS 1
R CrA IRS 1, also known as HH100–IR, is an intermediate-mass, pre–main-sequence Herbig Ae star obscured by about25 mag of visual extinction (Whittet et al. 1996). It is highlyvariable in the near-infrared and a strong far-infrared source.The profiles of the H2O and CO ice features are consistentwith domination by cold ices, and the lack of a 4.62 �m
TABLE 9
Orion IRc2 Spectral Features
k(�m)
FWHM
(cm�1) � Species
N
(1017 cm�2)
N/N(H2O)
*100 Reference
3.0....................... 335 1.48(0.02) H2O 24.5(0.3) 100 1
3.3....................... . . . PAH emission . . . . . .
3.53a ................... 29 0.06(0.02) CH3OH 2.5(0.8) 10(3) 1
4.27a ................... 19.6 0.9(0.1) CO2 2.6(0.3) 10.6(1.2) 1
(Polar) 0.7 2.9 1
(Nonpolar) 1.9 7.8 1
4.38..................... 9.5 0.06(0.01) 13CO2 0.078(0.013) 0.32(0.05) 1
4.5b ..................... 700 [0.03] H2O [24.5] [100]
4.62..................... 28 � 0.08 XCN 0.48 2.0 1
4.67c ................... 7.64 . . . CO . . . . . .4.91..................... 23 <0.03 OCS <0.04 <0.2 1
6.02b ................... 172 [0.07] H2O [24.5] [100]
6.0....................... 0.17(0.02) Organic residue . . . . . . 1
6.2....................... 60 . . . PAH emission . . . . . .6.85..................... 79 0.32(0.02) Organics/NHþ
4 . . . . . . 1
7.676d ................. 10.4 . . . CH4 . . . . . .
9.7....................... 297 1.87(0.05) Silicate . . . . . . 1
13.3b ................... 240 [0.22] H2O [24.5] [100]
15.24e ................. 27.4 CO2
18........................ 213 0.75(0.02) Silicate . . . . . . 1
Note.—There are emission features at 2.4065 �m (H2? 1–0), 2.4137 �m, 2.4238 �m (H2 1–0 Q(3)), 2.4377 �m, 2.4548 �m,2.4758 �m, 2.5004 �m, 2.625�m (Br�), 2.676�m, 2.803�m, 2.873�m (Pf), 2.974 �m, 3.004�m, 3.038 �m (Pf), 3.235�m (H2 1–0 O(5)), 3.296 �m (Pf�), 3.501 �m, 3.739 �m (Pf ), 3.808 �m, 3.847 �m, 3.908 �m, 4.051 �m (Br� ), 4.652 �m (Pf�), 4.695 �m,5.052 �m, 5.512 �m (H2 S(7)), 6.488, 6.523, 6.573, 6.594, 6.636 �m (Ni ii 2D3=2
2D5=2?), 6.676, 6.709, 6.724, 6.794, 6.829, 6.865,6.911, 6.985 �m (Ar ii 2P1=2
2P3=2), 7.05, 7.348 �m (SO2), 7.461 (H i 6–5), 7.66 �m (CH4), 8.991 �m (Ar iii 3P13P2), 9.665
(H2?), 10.510 �m (S iv2P3=2
2P1=2), 12.814 �m (Ne ii2P1=2
2P3=2), 15.555 �m (Ne iii3P1
3P2), 18.713 �m (S iii3P2
3P1),25.249 �m (S i
3P13P2), 33.48 �m (S iii
3P13P0), and 34.819 �m (Si ii 2P3=2
2P1=2).a Gase phase lines?b Calculated from 3 �m feature.c Gas phase CO.d Gas phase CH4 emission.e Gas phase CO2.References.—(1) This work.
GIBB ET AL.56 Vol. 151

feature is consistent with low levels of energetic processingalong most of the line of sight. The 5–30 �m spectral regionhas been smoothed to a resolving power of 750.
4.18. AFGL 2591
AFGL 2591 is a luminous (2� 104 L�), massive (10 M�)YSO approximately 1 kpc away behind 70 mag of visualextinction (Carr et al. 1995). This source exhibits the presenceof an 11.2 �m polarization feature (Aitken et al. 1988), whichmay indicate an annealed silicate grain component. This isunusual in dark molecular clouds where the silicate is pri-marily amorphous in form and requires high temperatures(exceeding 1000 K) to anneal. Mitchell et al. (1990) found thatvirtually all the CO in this line of sight is in the gas phase witha significant portion at very high temperatures (�1010 K).Hot H2O and CO2 gas absorption lines are also present(Boonman et al. 2003) with temperatures of 450 and 500 K,respectively. In addition to this, Lahuis & van Dishoeck(2000) find very hot (up to �900 K) C2H2 and �600 K HCNgas phase absorption lines. The 3 �m H2O-ice feature showsevidence of annealing. However, there is no evidence of anorganic refractory mantle component at 6 �m or the 4.62 �mXCN feature thought to indicate processing by UV radiation.Either no such processing has taken place or the processedspecies have evaporated.
4.19. Cyg OB2 12
Cyg OB2 12 is a member of the Cyg OB2 association lo-cated �1.7 kpc away (Torres-Dodgen et al. 1991). This typeB5 Ia+ star, one of the most luminous in the Galaxy, is morereddened than any other member of the association, sufferingfrom 10.2 mag of visual extinction (Humphreys 1978). The
obscuring dust appears to be typical of the diffuse ISM(Whittet et al. 1997), and the spectrum of this source is con-sistent with a stellar photosphere modified by reddening.There are no ices evident in the spectrum, but an absorptionfeature of silicates at 9.7 �m is present, as well as evidenceof hydrocarbons near 3.4 �m. There is no evidence of XCN inthis source (Whittet et al. 2001), which indicates that thismaterial is volatile and does not survive diffuse ISM conditions.
4.20. S140
S140 is a �2000 L� H ii region located 0.9 kpc awaybehind �23 mag of visual extinction (Evans et al. 1989). Thisregion is currently undergoing both high- and low-mass starformation (van der Tak et al. 1999). The infrared spectrumexhibits ice features due to H2O, CO2,
13CO2, and CH4. Nearlyall the CO is in the gas phase, with both cold (28 K) and warm(390 K) components (Mitchell et al. 1990). Upper limits of afew percent or less were placed on several other species. Theshape of the 3.1 �m H2O peak is indicative of a substantialwarm ice component. Only upper limits of gas phase C2H2,HCN, CO2, and H2O are reported (Lahuis & van Dishoeck2000; Boonman et al. 2003) with column densities at least anorder of magnitude less than those found toward AFGL 2591and AFGL 2136. The H2O-ice column densities, on the otherhand, are comparable for the three sources (to within about afactor of 3).
4.21. NGC 7538 IRS 1
NGC 7538 IRS 1 appears to be the youngest and mostluminous (1:3� 105 L�) pre–main-sequence object in the H ii
regions and molecular clouds that make up the NGC 7538
TABLE 10
Mon R2 IRS 2 Spectral Features
k(�m)
FWHM
(cm�1) � Species
N
(1017 cm�2)
N/N(H2O)
*100 Reference
3.0....................... 335 1.77(0.32) H2O 35.6(6.4) 100 1
3.3....................... . . . PAH emission . . . . . .
3.46..................... 86.1 0.083(0.013) HAC . . . . . . 2
3.54..................... 29 0.033(0.010) CH3OH 1.3(0.4) 3.7(1.1) 2
4.27..................... 17.7 2.22(0.13) CO2 6.02(0.11) 16.9(0.31) 1
4.38..................... 12.9 0.15(0.03) 13CO2 0.26(0.05) 0.73(0.14) 1
4.5a ..................... 700 [0.048] H2O [35.6] [100] 1
4.62..................... 23.5 0.05 XCN 0.14 0.39 3, 4
4.67..................... 6.73 0.47(0.02) CO 2.7(0.2) 7.6(0.6) 5
0.16(0.02) (Polar) 1.2(0.2) 3.3(0.6) 5
0.37(0.02) (Nonpolar) 1.6(0.1) 4.5(0.3) 5
4.91..................... 23 0.015 OCS 0.013 0.037 6
6.02a ................... 150 [0.13] H2O [35.6] [100] 1
6.0....................... 150 �0.29 Organic residue . . . . . . 1
6.2....................... 30 . . . PAH emission . . . . . . 1
6.85..................... 152 0.47(0.04) Organics/NHþ4 . . . . . . 1
7.7....................... . . . PAH emission . . . . . .
9.7....................... 280 2.54(0.1) Silicate . . . . . . 1
11.2..................... 13 . . . PAH emission . . . . . . 1
13.3a ................... 240 [0.38] H2O [35.6] [100] 1
15.2..................... 21.0 0.29(0.02) CO2 7.8(0.6) 4.6(1.7) 1
18z...................... �1.0 Silicate . . . . . . 1
Note.—There are emission features at 4.051 �m (Br� ), 4.652 �m (Pf�), 6.985 (Ar ii2P1=2
2P3=2), 12.814 �m (Ne ii
2P1=22P3=2), 18.713 �m (S iii
3P23P1), 33.48 �m (S iii
3P13P0), and 34.819 �m (Si ii 2P3=2
2P1=2).a Calculated based on 3 �m feature.References.—(1) This work; (2) Brooke et al. 1999; (3) Whittet et al. 2001; (4) Demyk et al. 1998; (5) Chiar et al. 1998;
(6) Palumbo et al. 1997.
INTERSTELLAR ICE 57No. 1, 2004

complex (Strazzulla et al. 1998). It is 2.8 kpc away in thePerseus arm of the galaxy. The SWS spectrum of this source isvery rich with PAH, hydrogen, and metal ion emission inaddition to absorption features of solid state H2O, CO2, CO,and organics and gas phase CO. There are weak emissionfeatures present at 3.46, 3.39, and 3.54 �m that may be due toC-H stretch features in hydrogenated amorphous carbon(HAC) molecules as discussed in Grishko & Duley (2000) oraliphatic sidegroups on PAHs as discussed by de Muizon,d’Hendecourt, & Geballe (1990).
4.22. NGC 7538 IRS 9
NGC 7538 IRS 9 is a highly embedded, compact, luminous(4� 104 L�) infrared source located 2.7 kpc away (Werneret al. 1979). CO J ¼ 1 0 and J ¼ 3 2 studies indicate dis-continuous and distinct outflow events, including a bipolarhigh-velocity outflow and a more recent extremely high-velocity outflow (Mitchell & Hasegawa 1991). The infraredspectrum exhibits strong absorptions of H2O-ice. It has a4.62 �m XCN feature weaker than that found in W33 A orRAFGL 7009S but stronger than in other sources, as wellas the first detection and one of the highest abundances ofNH3-ice found to date (Lacy et al. 1998).
5. DISCUSSION
Much has been learned in the past several years about in-terstellar ices, as a direct result of the ISO mission, but manyquestions still remain. Our fits of laboratory data to observedspectra provide illustration of this. The fits include all ices
with positive identifications and well-constrained abundances.We added contributions of H2O, CH3OH, CH4, OCS, CO2,13CO2, CO, XCN, SO2, and NH3 in abundances appropriatefor each source, as discussed in x 3. It is immediately obviousfrom inspection of the relevant spectra in Figure 1 that thereare regions in which the fit is satisfactory, but also regionscontaining absorptions that are unaccounted for. Note that be-yond 8 �m the spectra are generally dominated by the 9.7 and19 �m silicate features (not included in our fits), upon whichweaker ice features (H2O, CO2, CH3OH, etc.) are superposed.
5.1. Interstellar Ices
Here we give a brief overview of the principal componentsof interstellar ices with firm or probable identifications in ourspectra. The column densities and mixing ratios (or upperlimits where appropriate) for each molecule is given for eachsource in Tables 4–26. Parentheses indicate the uncertainties,while values given in square brackets indicate that the valuewas derived from another feature within the spectrum. Forexample, the optical depth of the 13 �m libration mode ofwater was determined from the fit to the 3 �m feature. See thetable notes for details.
5.1.1. Water
Water is the most abundant and least volatile of the commonice species along lines of sight through dark molecular cloudmaterial. The SWS covered the 3.05 �m O—H stretch mode,4.5 �m combination mode, 6.0 �m H—O—H bending mode,and the 13�m librationmode, the latter blendedwith the 9.7 �msilicate feature. In addition, the 45 �m transverse optical
TABLE 11
Mon R2 IRS 3 Spectral Features
k(�m)
FWHM
(cm�1) � Species
N
(1017 cm�2)
N/N(H2O)
*100 Reference
3.0.......................... 335 1.12(0.01) H2O 19 100 1
3.249...................... 74 0.049(0.007) PAH, C-H stretch . . . . . . 2, 3
3.482...................... 76 0.036(0.005) HAC . . . . . . 3
3.54........................ 30 <0.022 CH3OH <0.92 <4.9 3
4.27........................ 20 0.51(0.03) CO2 1.6(0.1) 8.6(0.53) 4
4.38........................ 12.9 <0.018 13CO2 <0.32 <0.17 4
4.5a ........................ 700 [0.026] H2O [19] [100] 4
4.62b ...................... 29 . . . XCN . . . . . .
4.67b ...................... 7.64 <0.05 CO . . . . . .
4.91........................ 23 <0.01 OCS <0.013 <0.068 5
5.81........................ 21 <0.04 H2CO <1.1 <6 4
5.85........................ 65 <0.04 HCOOH <0.6 <3 4
6.02........................ 141 0.07(0.02) H2O 19(5.4) 100(29) 1
6.0.......................... 420 0.15(0.02) Organic residue . . . . . . 1
6.85........................ 71 0.32(0.02) Organics/NHþ4 . . . . . . 1
7.287...................... 11.45 0.04 SO2 gas 0.4(0.008) . . . 6
7.414...................... 15 0.03 SO2 gas 0.4(0.008) . . . 6
7.676...................... 10.4 <0.016 CH4 <2.4 <12.8 4
9.0.......................... 68 <0.0094 NH3 <0.49 <2.6 7
9.7.......................... 280 2.55(0.09) Silicate . . . . . . 4
9.75........................ 30 <0.03 CH3OH <0.53 <2.8 4
11.2........................ 22 0.037 PAH, C-H bend . . . . . . 8
13.3a ...................... 240 [0.23] H2O [19] [100] 4
15.2........................ 27.4 0.044(0.003) CO2 1.3(0.3) 6.8(1.3) 4
18........................... 217 0.68(0.02) Silicate . . . . . . 4
a Calculated based on 3 �m feature.b Gas phase CO.References.—(1) Gibb &Whittet 2002; (2) Brooke et al. 1999; (3) Sellgren et al. 1994; (4) this work; (5) Palumbo et al. 1997; (6) Keane
et al. 2001c; (7) Gibb et al. 2001; (8) Bregman et al. 2000.
GIBB ET AL.58 Vol. 151

vibrational band of water has been detected in SWS/LWSspectra of several sources (Dartois et al. 1998). Our laboratoryfits over- or underestimated the strength of the 13 �m feature insome lines of sight by up to 20%; we attribute this to uncer-tainty in the continuum since there are no true continuum pointsbetween 5.5 and 30 �m. The 3 and 6 �m features give dis-crepant column densities in several sources, with the 6 �mvalue systematically higher by a factor of up to 4 compared withthat derived using the 3 �m feature (Keane et al. 2001c; Gibbet al. 2000). We argue (x 5.2.2 below) that this is most likelycaused by blending with the absorption of another species. Notethat a good understanding of the 6 �m feature will be of vitalimportance for interpretation of SIRTF data, where the 3 �mregion will be unavailable.
5.1.2. CO and CO2
CO absorbs via its 4.67 �m fundamental vibrational band.The profile consists of a broad (polar) component peaking at4.682 �m and a narrow (nonpolar) component peaking at4.673 �m (Chiar et al. 1995, 1998). Typically, quiescentregions are dominated by pure CO or CO in a nonpolarmixture (Chiar et al. 1994, 1995). YSOs show evidence forwarm ices or irradiation, and in exceptionally warm environ-
ments, the CO is found primarily in the gas phase. In addition,Boogert, Blake, & Tielens (2002) have reported a detection ofthe 13CO ice feature at 4.78 �m in NGC 7538 IRS 9.
CO2 has two strong bands: the �3 4.27 �m asymmetricstretching mode and the 15.2 �m �2 bending mode in additionto the weaker CO2 overtone/combination band (reported inS140 by Keane et al. 2001a). CO2 was first detected via the15.2 �m feature using IRAS LRS (low-resolution spectro-graph) by d’Hendecourt & Muizon (1989). These featureswere studied in detail in high-mass YSOs by Gerakines et al.(1999) and in low- or intermediate-mass YSOs by Nummelinet al. (2001). They found that generally CO2/H2O �17 � 3%with the exception of two unusual sources, AFGL 989 andElias 18, which exhibit very high (34%–37%) CO2 concen-trations. We also see evidence of comparably high concen-trations of CO2 in RCrA IRS 1 and RCrA IRS 2 and possiblyElias 1, though the signal-to-noise ratio for the latter is poor.The similarly high concentrations of CO2 relative to H2Oobserved toward field stars and low-mass YSOs indicates thatCO2 is formed efficiently without processing by an embeddedsource (Whittet et al. 1998). The 4.38 �m asymmetricstretching mode of 13CO2 was studied in low- and high-massYSOs, quiescent molecular cloud, and Galactic center sources
TABLE 12
AFGL 989 Spectral Features
k(�m)
FWHM
(cm�1) � Species
N
(1017 cm�2)
N/N(H2O
*100) Reference
3.0....................... 335 1.43(0.04) H2O 24(1) 100 1
3.25..................... 62 0.069 PAH . . . . . . 2
3.46..................... 51 0.050 HAC . . . . . . 3
115 0.069 PAH 20 . . . 2
3.54..................... 70 0.055(0.006) CH3OH 5.6(0.6) 23(2.5) 3
3.95..................... 25 0.008(0.004) CH3OH 0.4(0.2) 1.7(0.9) 3
4.27..................... 12.8 3.95 CO2 8.1(0.1) 34(3) 1
1.92 (Polar) 4.43 18.5 1
2.03 (Nonpolar) 3.73 15.5 1
4.38..................... 10 0.046(0.008) 13CO2 0.062(0.009) 0.26(0.05) 4
4.5a ..................... 700 [0.034] H2O [24] [100] 3
4.62b ................... 29 0.022 XCN 0.07 0.3
4.67..................... 7.64 0.52(0.02) CO 4.48(0.2) 18.7(0.7) 3
0.23 (Polar) 3.25 13.5 3
0.24 (Nonpolar) 1.23 5.1 3
4.91..................... 23 0.024 OCS 0.02 0.08 5
5.83..................... 32 0.06(0.02) H2CO 0.56(0.22) 2.3(1.0) 3
5.85..................... 65 HCOOH 0.16(0.22) 0.7(1.0) 3
6.02a ................... 185 [0.10] H2O [24] [100] 3
6.0....................... 400 0.07(0.02) Organic residue . . . . . . 3
6.85..................... 88 0.09(0.02) Organics/NHþ4 . . . . . . 3
7.282................... 18 0.016(0.01) HCOOH 1.2(0.8) 5(3) 3
HCOO� 0.38(0.24) 1.6(1.0) 3
7.414................... 17.8 <0.016 HCOO� <0.18 <0.7 3
10.6 <0.016 CH3HCO <1.2 <5 3
7.676................... 9 0.036(0.01) CH4 0.46(0.13) 1.9(0.5) 3
9.0....................... 68 0.021(0.007) NH3 1.1(0.32) 4.6(1.3) 6
9.7....................... 251 0.72(0.02) Silicate . . . . . . 3
9.75..................... 29 0.035 CH3OH 0.60 2.5 3
13.3a ................... 240 [0.30] H2O [24] [100] 3
15.2..................... 21.5 0.35(0.01) CO2 9.6(0.4) 40(1.7) 3
18........................ 156 0.21(0.02) Silicate . . . . . . 3
Note.—Emission lines are present at 2.626 �m (Br�), and 4.052 �m (Br� ).a Calculated from 3 �m feature.b Gas phase CO?References.—(1) Nummelin et al. 2001; (2) Bregman & Temi 2001; (3) this work; (4) Boogert et al. 2000; (5) Palumbo et al. 1997;
(6) Gibb et al. 2001.
INTERSTELLAR ICE 59No. 1, 2004

by Boogert et al. (2000) and gave consistent results with theCO2 studies.
5.1.3. CH3OH
CH3OH has features at 3.53, 3.95, 6.8, and 9.75 �m. W33A and RAFGL 7009S both have strong CH3OH absorptionsconsistent with 15% and 30%, respectively, relative to H2O(Dartois et al. 1999). In both cases the profile shape isconsistent with a combination of pure CH3OH and aH2O :CH3OH mix. In most other sources, including any low-mass star-forming regions or dark molecular clouds, methanolis found to be a minor constituent, usually consistent with 5%or less. Recently, Pontoppidan et al. (2003), in a study of 40low-mass protostars, found three sources with high (15%–25%) methanol abundances. CH3OH is thought to form viaH atom addition on a grain surface (CO!HCO!H2CO!CH3OH), but laboratory experiments to confirm this formationroute give discrepant results (Hiraoka et al. 2002; Watanabe &Kouchi 2002).
5.1.4. CH4
CH4-ice has been detected via its �4 deformation-modefeature at 7.67 �m in several sources at the 1%–2% level(Boogert et al. 1996), though AFGL 7009S is consistent with�4% (d’Hendecourt et al. 1996, this work). The position and
shape of the profile is consistent with the presence of methanein a polar matrix. The lack of a cold CH4 gas component anda low gas : solid CH4 ratio support the interpretation thatmethane formed via H atom addition to atomic carbon on thegrain surface in the cold dense cloud phase when the atomicC abundance was low (Boogert et al. 1998).
5.1.5. NH3
Ammonia has an N-H stretch at 2.96 �m, an N-H defor-mation mode at 6.15 �m, and an umbrella mode at 9.3 �m(which shifts to 9.0 �m when NH3 is a minor constituent in apolar ice). In addition to these, mixing NH3 and water pro-duces a broad feature over the long-wavelength wing of the3 �m water feature, arising from the formation of ammoniumhydrate groups. Each of the principal vibrational modes ofammonia is blended with a much stronger absorption, i.e.,with the water stretching and bending modes and the 9.7 �msilicate feature, and this greatly hinders detection and quan-titative analysis. Nonetheless, several studies have in-vestigated the 3 �m region to determine upper limits ofammonia abundance in various lines of sight (Smith et al.1989; Whittet et al. 1996; Chiar et al. 2000; Dartois &d’Hendecourt 2001; Gibb et al. 2001; Dartois et al. 2002).The 9 �m region has also been extensively studied anddetections or upper limits obtained (Lacy et al. 1998; Gibb
TABLE 13
AFGL 2136 Spectral Features
k(�m)
FWHM
(cm�1) � Species
N
(1017 cm�2)
N/N(H2O)
*100 Reference
3.0....................... 356 3.24(0.09) H2O 51 100 1
3.471................... 99.6 0.137(0.020) HAC . . . . . . 2
3.54..................... 29 0.060(0.010) CH3OH 2.6(0.4) 5.1(0.8) 2
3.95..................... 115.3 <0.02 CH3OH <4.5 <8.9 3
4.27..................... 18.5 2.40(0.08) CO2 7.8(0.3) 15.3(0.6) 4
4.38..................... 10 0.071(0.008) 13CO2 0.073(0.005) 0.14(0.01) 5
4.5a ..................... 700 [0.07] H2O [51] [100]
4.62..................... 28 0.11(0.01) XCN 0.66(0.06) 1.3(0.1) 3
4.67..................... 7.64 0.24(0.01) CO 2.68(0.25) 5.25(0.48) 3
(Polar) 2.68 5.25 3
(Nonpolar) <0.1 <0.2 3
4.91..................... 23 0.030(0.007) OCS 0.43((0.01) 0.85(0.02) 3
5.83..................... 47 0.08(0.03) H2CO 0.8(0.3) 1.6(0.6) 3
5.85..................... 65 HCOOH 0.75(0.3) 1.5(0.6) 3
6.02a ................... 136 0.23(0.04) H2O 51(9) [100]
6.0....................... <0.04 Organic residue . . . . . . 3
6.2....................... 64 0.06(0.02) ? . . . . . . 3
6.85..................... 80 0.18(0.02) Organics/NHþ4 . . . . . . 3
7.243................... 16.8 <0.04 HCOOH <2.8 <5.4 3
19.8 CH3HCO <1.1 <2.1 3
7.414................... 17.8 <0.03 HCOO� <0.33 <0.66 3
10.6 CH3HCO <2.3 <4.4 3
7.676................... 10.4 0.04(0.01) CH4 0.58(0.15) 1.1(0.3) 3
9.0....................... 68 <0.021 NH3 <1.1 <2.2 1
9.7....................... 260 2.1(0.1) Silicate . . . . . . 3
9.75..................... 25 0.20(0.05) CH3OH 3.0(0.8) 5.9(1.5) 3, 6
13.3a ................... 240 [0.46] H2O [51] [100]
15.2..................... 24.5 0.30(0.01) CO2 7.8(0.3) 15.3(0.6) 4
(Polar) 6.2 12.2 4
(Nonpolar) 1.6 3.1 4
18........................ 185 0.72 Silicate . . . . . . 3
a Calculated from 3 �m feature.References.—(1) Gibb et al. 2001; (2) Brooke et al. 1999; (3) this work; (4) Gerakines et al. 1999; (5) Boogert et al. 2000; (6) Skinner
et al. 1992.
GIBB ET AL.60 Vol. 151

et al. 2001; Gurtler et al. 2002). Further constraints have re-cently been placed by a search for a weak feature at 2.21 �m(Taban et al. 2003), shortward of the wavelength rangecovered by ISO-SWS. It is interesting and surprising that amolecule predicted, on the basis of chemical models, tobe abundant in the solid phase in cold interstellar clouds(Tielens & Hagen 1982) is found to have an upper limitof �5% in most lines of sight. This may indicate subsequentprocessing either thermally or through energetic processing(Pendleton et al. 1999). These results are nevertheless con-sistent with NH3 abundances in comets, which are typically�1% (Bockelee-Morvan et al. 2000).
5.1.6. XCN
The absorption feature at 4.62 �m is, strictly speaking,unidentified, but it is attributed with some confidence toC�N bond vibrations in an organic molecule, most probablya cyanate or the OCN� ion (Whittet et al. 2001). The carrier islinked, through laboratory work, to energetic processing of icesby UV photons or ions, and the importance of the 4.62 �mfeature is thus that it provides a diagnostic of such processing.Amongst our sources, W33 A and AFGL 7009S have thestrongest 4.62 �m features, whilst several other massiveYSOs show weaker absorption at this wavelength. The feature
is very weak or absent in low-mass YSOs, many high-massYSOs, dark clouds, and the diffuse ISM.
5.1.7. Other Minor Constituents
In addition to the species discussed above, there are addi-tional absorptions at 5.83 and 5.85 �m attributable to HCOOHand H2CO (Keane et al. 2001c). There are also weak featuresat 7.24 and 7.41 �m, which have not been uniquely identifiedbut are consistent with the CH deformation mode of formicacid and either the formate ion (HCOO�) or acetaldehyde(CH3HCO), respectively (Schutte et al. 1999). Several sources(W33 A, NGC 7538 IRS 9, Mon R2 IRS 3) exhibit ex-cess absorption at 6.0 �m (see below) that is not attribut-able to water or other known ice constituents. A weak, broadabsorption feature seen at 6.2 �m may arise from absorptionby polycyclic aromatic hydrocarbons (PAHs) (Keane et al.2001c).
5.1.8. Upper Limits on Amino Acids
Amino acids have long been discussed as a possible con-stituent of interstellar matter. Previous searches have focusedon the gas phase (see Snyder 1997 for a review), but recentwork has emphasized the possibility that they might be aminor constituent of ices that have been subjected to UV
TABLE 14
Elias 29 Spectral Features
k(�m)
FWHM
(cm�1) � Species
N
(1017 cm�2)
N/N(H2O)
*100 Reference
3.0....................... 335 1.85(0.08) H2O 34(6) 100 1
3.25..................... 74 <0.03 C-H stretch . . . . . . 2
88 0.085 PAH 21 . . . 3
3.49..................... 94.3 0.089(0.007) HAC . . . . . . 2
88 0.065 PAH 14 . . . 3
3.54..................... 30 <0.036 CH3OH <1.5 <4.4 1
3.95..................... 115.3 <0.023 CH3OH <5.3 <15.6 4
4.267................... 17.1 2.77(0.2) CO2 6.7(0.5) 19.7(1.5) 5
4.38..................... 10 0.071(0.009) 13CO2 0.083(0.005) 0.24(0.01) 1
4.5a ..................... 700 [0.046] H2O [34] [100]
4.62..................... 28 <0.01 XCN <0.067 <0.20 6
4.673................... 4.4 �0.33 CO 1.7(0.3) 5.0(0.88) 1
(Polar) � 0.2 � 0.6 1
(Nonpolar) � 1.5 � 4.4 1
4.91..................... 23 <0.01 OCS <0.015 <0.044 1
5.81..................... 21 <0.03 H2CO <0.6 <1.8 1
5.85..................... 65 <0.03 HCOOH <0.3 <0.09 1
6.02a ................... 130 [0.16] H2O [34] [100]
6.0....................... 127 0.08(0.02) Organic residue . . . . . . 4
6.85..................... 116 0.12(0.03) Organics/NHþ4 . . . . . . 4
7.243................... 16.8 <0.004 HCOOH <0.3 <0.88 1
19.8 HCOO� <0.1 <0.34 4
7.414................... 17.8 <0.03 HCOO� <0.33 <0.98 4
10.6 CH3HCO <2.3 <6.6 4
7.631................... 10 <0.02 SO2 <0.06 <0.18 4
7.676................... 11 <0.03 CH4 <0.5 <1.5 1
9.0....................... 64 <0.05 NH3 <2.5 <7.3 7
9.7....................... 242 1.32(0.06) Silicate . . . . . . 4
13.3a ................... 240 [0.31] H2O [34] [100]
15.2..................... 23.1 0.33(0.02) CO2 6.7(0.5) 19.7(1.5) 5
(Polar) 6.2 18.2 5
(Nonpolar) 0.5 1.5 5
18........................ 168 0.31(0.05) Silicate . . . . . . 4
a Calculated from 3 �m feature.References.—(1) Boogert et al. 2000; (2) Brooke et al. 1999; (3) Bregman & Temi 2001; (4) this work; (5) Gerakines et al. 1999;
(6) Whittet et al. 2001; (7) Gibb et al. 2001.
INTERSTELLAR ICE 61No. 1, 2004

photolysis (Bernstein et al. 2002; Munoz Caro et al. 2002;Woon 2002). The infrared vibrational spectra of amino acidsexhibit several features that might in principle yield detec-tions (e.g., Ehrenfreund et al. 2001), but quantitative analysisis inhibited by blending with other, far stronger, ice features ininterstellar spectra, most notably those of H2O.
The most prominent infrared feature in laboratory spectraof the simplest amino acid, glycine (NH2CH2COOH), is theC=O (carbonyl) stretch: in an Ar matrix at 12 K this iscentered at �5.62 �m, i.e., on the short-wavelength side ofthe 6.0 �m feature in astronomical spectra. Considering ourspectrum of W33A, we set an approximate upper limit of�5:62 < 0:05 on any discrete feature at this wavelength. As-suming a band strength of �3� 10�17 cm per molecule(Ehrenfreund et al. 2001) and a width �20 cm�1 (consistentwith the Ar matrix isolation spectrum), we estimate an upperlimit of 3� 1016 cm�2 on the column density of glycine inthis line of sight, which is �0.3% of the H2O column den-sity. Note that if the feature is broadened, as expected forinclusion in a water-dominated matrix, the estimated limitwill be less stringent.
5.2. Unidentified Features
5.2.1. The 3:2 3:8 �m Wing
In common with previously published results (see Smithet al. 1989), all of our sources for which fits are presented
exhibit a wing on the long-wavelength side of the 3.1 �mO—Hstretch H2O-ice profile. Whilst there are constituents in ourmixtures—NH3 (ammonium hydrate), CH3OH, and CH4—that contribute to absorption in this spectral region, theirabundance is insufficient to account for the wing. Otherpossibilities include organic residues that contribute C—Hstretching absorptions at �3.4 �m, and scattering. However,a substantial contribution by organic refractories can be ex-cluded for some sources by the weakness or absence of as-sociated absorption in the 6 �m region (see below); even incases where this is thought to be present, the implied con-tribution at 3.4 �m is generally small (Gibb & Whittet 2002).Similarly, attempts to account for the wing quantitatively interms of scattering by large core-mantle grains have met withonly limited success (see review by Whittet 2003). The long-wavelength wing continues to defy an explanation.
5.2.2. Features Overlapping the 6:0 �m H2O Bending Mode
There has been much discussion in the literature concerningthe H2O column density toward W33 A and other sources(Gibb et al. 2000; Keane et al. 2001c). We demonstrate inFigure 1o and Table 18 that one can simultaneously fit the 3,4.5, and 13 �m optical depths in W33 A with an H2O columndensity of 1:1� 1019 cm�2, whereas fitting the 6 �m bending-mode feature independently results in a much higher columndensity. This discrepancy is greatest in W33 A but also presentto a lesser extent in several other sources (Keane et al. 2001c).
TABLE 15
Sgr A* Spectral Features
k(�m)
FWHM
(cm�1) � Species
N
(1017 cm�2)
N/N(H2O)
*100 Reference
3.0....................... 335 0.50(0.01) H2O 12.4(2.5) 100 1
3.28..................... <0.02 C-H stretch . . . . . . 1
3.46..................... 80 0.21(0.01) HAC . . . . . . 1
3.54..................... 30 <0.01 CH3OH <0.5 <4 1
3.95..................... 115.3 <0.001 CH3OH <0.4 <3 1
4.27..................... 16.7 0.70(0.01) CO2 1.7(0.2) 13.7(1.6) 2
4.38..................... 7.2 <0.07 13CO2 <0.12 <1 3
4.5a ..................... 700 [0.017] H2O [12.4] [100] 3
4.62..................... 29 �0.14 XCN �0.83 �6.7 4
4.67..................... 7.64 CO <1.5 <12 1
4.91..................... 20 <0.03 OCS <0.04 <0.3 3
5.81..................... 21 H2CO <0.3 <2.4 1
6.02a ................... 185 [0.07] H2O [12.4] [100] 3
6.0....................... <0.03 Organic residue . . . . . . 3
6.2....................... 60 0.05(0.01) ? . . . . . . 1
6.85..................... 88 0.05(0.01) OrganicsNHþ4 . . . . . . 1
7.243................... 19 0.03(0.01) HCOOH 0.8(0.2) 6.5(1.6) 1
7.676................... 10.4 0.017(0.003) CH4 0.30(0.07) 2.4(0.56) 1
9.0....................... 68 <0.012 NH3 <0.61 <4.9 5
9.7....................... 176 2.31(0.02) Silicate . . . . . . 3
13.3a ................... 240 [0.11] H2O [12.4] [100] 3
15.2..................... 20.3 0.077(0.005) CO2 1.7(0.2) 13.7(1.6) 2
(Polar) 1.7 13.7 2
(Nonpolar) <0.1 <0.8 2
18........................ 140 0.57(0.01) Silicate . . . . . . 3
Note.—There are emission features at 2.62 �m (Br�), 2.75 �m (Pf�), 2.87 �m (Pf), 3.03 �m (Pf), 3.30 �m (Pf�), 3.73 �m(Pf ), 4.05 �m (Br� ), 4.65 �m (Pf�), 5.34 �m (Fe ii, 4F9=2
6D9=2?), 5.51 �m (H2?), 5.91 �m (H i 9–6), 6.64 �m (Ni ii2D3=2
2D5=2), 6.91 �m (H2?), 6.98 �m (Ar ii 2P1=22P3=2), 7.35 �m (?), 7.46 �m (Pf� ), 7.50 �m (Ni i 3F3
3F4?), 12.81 �m(Ne ii
2P1=22P3=2), 15.56 �m (Ne iii
3P13P2), 18.71 �m (S iii
3P23P1), 22.93 �m (Fe iii
5D35D4), 25.91 �m (O iv
2P3=22P1=2), 33.04 �m (Fe iii
5D25D3), 33.48 �m (S iii
3P13P0), 34.81 �m (Si ii 2P3=2
2P1=2), 35.35 �m (6D5=26D7=2),
and 36.01 �m (Ne iii3P1
3P0).a Calculated from 3 �m feature.References.—(1) Chiar et al. 2000; (2) Gerakines et al. 1999; (3) this work; (4) Moneti et al. 2001; (5) Gibb et al. 2001.
GIBB ET AL.62 Vol. 151

While it has been argued that the difference might be due toscattering, the fact that the 13 �m libration mode is alsoconsistent with the fit at 3 and 4.5 �m and not consistent witha column density more than 3 times greater argues against thisexplanation, at least in W33 A and AFGL 7009S. This lendssupport to the conclusion reached by Gibb & Whittet (2002)that a substantial amount of the 6 �m absorption can be at-tributed to some component other than water in both W33 Aand AFGL 7009S.
The residual after subtracting the water component from the6 �m profile in W33 A and AFGL 7009S is well fitted by arefractory organic residue. Examples of appropriate residuesinclude those synthesized by exposure of simple ices to UVradiation (Greenberg et al. 1995) and organic material ex-tracted from the Murchison meteorite. An organic refractorycomponent has been added to the ices for these sources inFigure 1, to illustrate the improvement in fit. Additional weakfeatures remain at 5.8 and 6.2 �m, possibly caused by an icecomponent with a C=O stretch (such as HCOOH or H2CO)and by PAH absorption, respectively. There is also evidence ofan organic refractory component in Mon R2 IRS 3 and NGC7538 IRS 9 (Gibb & Whittet 2002). Other sources, such asS140, W3 IRS 5, and Elias 29 do not require any organicresidue to account for the 6 �m feature. Even those sourcesthat do not exhibit excess absorption at 6 �m, show evidencefor other minor constituents at 5.85 and 6.2 �m.
If organic refractory matter is responsible for excess ab-sorption at 6 �m, a correlation with the 4.62 �m XCN featuremay be expected (x 5.1.6). This is indeed the case, as shown inFigure 2a. The correlation is dominated by two sources (W33 Aand AFGL 7009S) that have deep 4.62 �m absorption andrelatively deep 6 �m excesses. However, there are somesources with no measurable 6 �m excess that exhibit weakXCN absorption, and conversely, so the correspondence is not
perfect. It may be that similar conditions are needed to syn-thesize XCN and the carrier of the 6 �m excess, but they arenot one and the same.
5.2.3. The 6:8 �m Feature
Another persistent problem is the identification of the6.8 �m feature. This feature has not been satisfactorilyexplained by any available laboratory comparison spectrum. Asmall percent of the area of the feature may be filled bycontributions from ices such as CH3OH and CH3CHO, butmost of the feature cannot be explained by known ice con-stituents. Identification is complicated by the fact that the peakposition and profile change from one source to another. Keaneet al. (2001c) interpreted the absorption to be due to the su-perposition of two components, C1 and C2, with differentpeak positions. Schutte & Khanna (2003) discuss NHþ
4 as apossible candidate. This molecule is easily produced in thelaboratory by processing of interstellar ice analogs and ex-hibits an increase in peak position with increasing tempera-ture. While their spectra were not perfect matches to theinterstellar bands, the similarity is certainly suggestive andshould be further investigated.
With the larger database of sources in this study, we in-vestigated correlations of the 6.8 �m feature with water (viathe 3�mfeature), the excess absorption at 6�m, and the 4.62�mXCN feature. Figure 2 shows the results of these correla-tions. The pluses and diamonds indicate sources for which the6.8 �m feature peaks at lower and higher wavelength, re-spectively (C1 and C2 in Keane et al. 2001c, or the low- andhigh-temperature components of NHþ
4 of Schutte & Khanna2003). The circles denote sources with weak and noisy 6.8 �mfeatures. The optical depths at 6.8 �m were derived aftersubtraction of the 6 �m water wing and CH3OH whenappropriate.
TABLE 16
GCS 4 Spectral Features
k(�m)
FWHM
(cm�1) � Species
N
(1017 cm�2)
N/N(H2O)
*100 Reference
3.0....................... 335 0.16(0.01) H2O 3.0(0.3) 100 1
3.28..................... 25 <0.05 . . . . . . . . . 1
3.40..................... 80 0.15(0.01) . . . . . . . . . 1
4.27..................... 12.8 0.22(0.02) CO2 0.7(0.2) 23.3(6.7) 2
4.5a ..................... 700 [0.004] H2O [3.0] [100]
4.62..................... 28 <0.04 XCN <0.24 <8 3
4.67..................... 7.64 CO <0.9 <30 4
4.91..................... 19.6 <0.02 OCS <0.02 <0.8 3
6.02a ................... 185 [0.013] H2O [3.0] [100]
6.2....................... 60 0.08(0.02) C-C stretch . . . . . . 1
6.85..................... 88 <0.03 Organics/NHþ4 . . . . . . 1
7.243................... 19 <0.03 HCOOH <2 <67 3
7.676................... 10.4 <0.03 CH4 <0.5 <17 1
9.0....................... 68 <0.030 NH3 <1.6 <53 5
9.7....................... 197 2.8(0.3) Silicate . . . . . . 3
13.3a ................... 240 [0.033] H2O [3.0] [100]
15.2..................... 19 0.05(0.01) CO2 0.7(0.2) 23.3(6.7) 2
(Polar) 0.5 16.7 2
(Nonpolar) <0.2 <6.7 2
17.4..................... 113 0.42(0.1) Silicate . . . . . . 3
Note.—There are emission features at 4.05 �m (Br � ), 6.99 �m (Ar ii, 2P1=22P3=2), 12.81 �m (Ne ii, 2P1=2
2P3=2),15.56 �m (Ne iii, 3P1
3P2), 18.72 �m (S iii, 3P23P1), 22.94 �m (Fe iii, 5D3
5D4), 33.49 �m (S iii, 3P13P0), 34.81 �m
(Si ii, 2P3=22P1=2), and 36.03 �m (Ne iii, 3P0
3P1).a Calculated from 3 �m feature.References.—(1) Chiar et al. 2000; (2) Gerakines et al. 1999; (3) this work; (4) Chiar et al. 1998; (5) Gibb et al. 2001.
INTERSTELLAR ICE 63No. 1, 2004

Figure 2b shows the optical depth at 3 �m versus that of the6.8 �m feature. While both features increase in optical depth,there is not a single line correlation. Rather, there is a group offive objects (Mon R2 IRS 3, NGC 7538 IRS 1, Orion BN,Orion IRc2, and Mon R2 IRS 2) that have much stronger6.8 �m features (by a factor of 2 or more) than other sourcesof comparable water column density. For example, MonR2 IRS 3 and S140 have the same water column densities andsimilar profiles, both exhibiting evidence of annealing of the3 �m water band. Yet S140 has a 6.8 �m feature that is 2.6times weaker than that of Mon R2 IRS 3. Both sources peak atthe same position, with similar profiles that indicate domi-nance by the long-wavelength (or higher temperature in thecase of NHþ
4 ) component, so temperature alone cannot ap-parently account for the abundance variation. While all fivesources that have the higher 6.8 �m absorption are high-massobjects, the remaining sources are a mix of high-, low-, andintermediate-mass objects. The correlation of optical depths isalso independent of the temperature of ice along the line ofsight as indicated by annealing of the 3 �m H2O or 15.2 �mCO2 features or peak position of the 6.8 �m feature and couldindicate, for example, different starting abundances of themolecule(s) giving rise to the feature.
We also investigated the correlation of the 6.8 �m featurewith that at 4.62 �m (Fig. 2c). OCN� and NHþ
4 are both formedunder similar laboratory conditions. With the possible excep-tion of Orion IRc2 (which has gas phase CO at 4.62 �m
superposed on an underlying weak feature we attribute toXCN), all the sources dominated by the long-wavelengthcomponent (diamonds) are lacking XCN. If the XCN carrier isOCN�, which is stable in a vacuum to more than 200 K(Hudson, Moore, & Gerakines 2001), and if the long-wave-length component is due to hot NHþ
4 (180–240 K), as sug-gested by Schutte & Khanna (2003), then a weak XCN featurefor the sources represented by diamonds in Figure 2c may bean indication of temperatures exceeding �200 K in regionswhere these ions are formed. The sources with the shorterwavelength C1 component (fit by the cooler NHþ
4 spectra)generally exhibit increasing XCN with increasing optical depthof the 6.8 �m feature. Sources such as Mon R2 IRS 3 and NGC7538 IRS 9 have very similar 6.8 �m optical depths but peak atdifferent positions. NGC 7538 IRS 9 has a substantial XCNfeature, while the ‘‘warmer’’ Mon R2 IRS 3 does not. Hence,the 4.62 �m feature is not inconsistent with the interpretationof NHþ
4 as the principle carrier of the 6.8 �m feature.One concern with this interpretation is that OCN� provides
an inadequate source for negative counterions to balance thepositively charged NHþ
4 , and no other negative ions have beenconclusively identified. Schutte & Khanna (2003) discuss howthese counterions were only apparent after sublimation ofwater ice in their laboratory experiments. Nevertheless,without firm upper limits or a conclusive detection of othernegatively charged ice species, this remains a concern foridentification of the 6.8 �m absorption. Another reason for
TABLE 17
GCS 3I Spectral Features
k(�m)
FWHM
(cm�1) � Species
N
(1017 cm�2)
N/N(H2O)
*100 Reference
3.0....................... 335 0.23(0.02) H2O 4.7(0.4) 100 1
3.28..................... 25 0.026(0.005) Aromatic HC . . . . . . 1
3.40..................... 93 0.16(0.01) HAC . . . . . . 1
3.48..................... 36 0.09 HAC . . . . . . 2
3.54a ................... 30 <0.03 CH3OH <1.3 <27 2
3.95..................... 115.3 <0.01 CH3OH <2.3 <49 2
4.27..................... 15.4 0.48(0.02) CO2 1.1(0.1) 23.4(2.1) 3
(Polar) 1.1 23.4 3
(Nonpolar) <0.1 <2.1 3
4.38..................... 4 0.042(0.015) 13CO2 0.021(0.004) 0.45(0.08) 4
4.5b ..................... 700 [0.006] H2O [4.7] [100] 2
4.62c ................... 28 <0.05 XCN <0.30 <6.3 2
4.67..................... 7.64 <0.1 CO <0.9 <19 5
4.91..................... 19.6 <0.04 OCS <0.05 <1.0 2
6.02b ................... 185 [0.021] H2O [4.7] [100] 2
6.2....................... 34 0.10(0.02) C-C stretch . . . . . . 1
6.85..................... 88 0.04(0.01) Organics/NHþ4 . . . . . . 1
7.243................... 16.8 <0.03 HCOOH <2.7 <57 1
19.8 HCOO� <0.88 <19 1
7.414................... 17.8 <0.03 HCOO� <0.33 <7.1 2
10.6 CH3HCO <2.2 <48 2
7.676................... 10.4 <0.02 CH4 <0.3 <6.4 1
9.0....................... 68 <0.034 NH3 <1.8 <38 6
9.7....................... 224 2.38 Silicate . . . . . . 7
13.3b ................... 240 [0.05] H2O [4.7] [100] 2
18........................ 211 1.32(0.04) Silicate . . . . . . 2
Note.—There are emission features at 6.986 �m (Ar ii 2P1=22P3=2), 12.815 �m (Ne ii 2P1=2
2P3=2), 18.718 �m (S iii2P2
3P1),33.48 �m (S iii
3P13P0), and 34.81 �m (Si ii 2P3=2
2P1=2).a Blended with HAC.b Calculated from 3 �m feature.c Gas phase CO.References.—(1) Chiar et al. 2000; (2) this work; (3) Gerakines et al. 1999; (4) Boogert et al. 2000; (5) Chiar et al. 1998; (6) Gibb
et al. 2001; (7) Schutte et al. 1998.
GIBB ET AL.64 Vol. 151

concern is the apparent lack of NH3 in interstellar ices alongthese lines of sight. NH3 is needed in laboratory studies toproduce NHþ
4 and the work of Hudson et al. (2001) indicatesthat OCN� originates in a polar mantle from irradiation of anNH3 mixture. In most lines of sight, the NH3 abundance isinferred to be less than 5%. Analysis of the 9 �m region inW33 A and NGC 7538 IRS 9 indicates abundances of�10%–15%, in contradiction to the results of Taban et al.(2003) for W33 A, who infer an upper limit of 5%. More workmust be done to answer this question of the nitrogen com-ponent of interstellar ices. An alternative explanation is thatthe 6.8 �m feature can be attributed to two independent car-riers and that XCN is correlated with C1 but not with C2 ofthe 6.8 �m feature. We are unable to distinguish between thesetwo interpretations at the current time.
If the 6 �m excess is due at least in part to NHþ4 as sug-
gested by Schutte & Khanna (2003) then it would correlatewith the 6.8 �m feature (see Fig. 2d ). What is found is that for
sources with comparable contributions from both C1 and C2as per Keane et al. (2001c) (denoted by plus signs in Fig. 2),increasing optical depth at 6.8 �m generally corresponds to anincrease in the 6 �m excess. The sources lacking a 6 �mexcess are more problematic. It is unclear how two sourceswith very similar 6.8 �m profile shapes and optical depths,such as W3 IRS 5 and Orion BN, can have more than a factorof 4 difference in the 6 �m excess if both features are due tothe same absorber. Perhaps some fraction of the excess at 6 �mcould be due to NHþ
4 , the remainder being due to a differentspecies, such as an organic refractory component as suggestedby Gibb & Whittet (2002).
5.3. Overall Ice Composition
Previous studies (e.g., Gibb et al. 2000) have discussed anevolutionary sequence for ice mantle compositions in varyinglines of sight. In general, increased processing leads to sub-
TABLE 18
W33A Spectral Features
k(�m)
FWHM
(cm�1) � Species
N
(1017 cm�2)
N/N(H2O)
*100 Reference
3.0....................... 335 5.5(1.5) H2O 110(30) 100 1
3.477................... 80.7 0.290(0.040) HAC . . . . . . 2
3.53..................... 29 0.27(0.05) CH3OH(pure) 11.9(2.2) 10.8(2.0) 2
29 0.07(0.02) Polar 2.7(0.8) 2.5(0.7) 2
3.95..................... 115.3 0.5 CH3OH 18.5 16.8 3
4.27..................... 20 >5 CO2 14.5(1.3) 13.2(1.2) 4
(Polar) 12.3 11.2 4
(Nonpolar) 2.2 2.0 4
4.38..................... 9.5 0.225(0.015) 13CO2 0.274(0.021) 0.249(0.019) 5
4.5....................... 700 0.1(0.05) H2O 70(40) 64(36) 1
4.62..................... 24.7 1.3 XCN 6.9 6.3 6, 7
4.67..................... 7.64 1.30(0.05) CO 8.9(0.5) 8.1(0.5) 8
0.68(0.05) (Polar) 6.6(0.5) 6.0(0.5) 8
0.79(0.05) (Nonpolar) 2.3(0.2) 2.1(0.2) 8
4.78..................... 15 <0.02 13CO <0.25 <0.23 9
4.91..................... 23 0.14 OCS 0.2 0.2 10
5.81..................... 21 0.14(0.07) H2CO 3.45(1.7) 3.1(1.6) 9
5.85..................... 65 0.32(0.07) HCOOH 4.12(0.9) 3.7(0.8) 9
6.02..................... 172 0.49(0.07) H2O 110 100 11
6.0....................... 420 1.12(0.07) Organic residue . . . . . . 11
6.2....................... 60 0.22(0.07) PAH? ? ? 11
6.85..................... 79 1.07(0.07) Organics/NHþ4 . . . . . . 11
7.243................... 19 0.10(0.02) HCOOH 7.8 7.1 12
HCONH2 6.3 5.7 12
7.414................... 15 0.10(0.03) HCOO� 0.93 0.85 12
CH3HCO 10.8 9.82 12
7.631................... 27.7 0.082(0.005) SO2 1.74(0.90) 1.58(0.82) 13
7.676................... 10.4 0.120(0.005) CH4 1.7(0.2) 1.5(0.2) 13
8.90..................... 34 0.1 CH3OH 15 14 1
9.0....................... 68 0.45(0.10) NH3 17(4) 15(4) 1
9.7....................... 295 7.84(0.12) Silicate . . . . . . 14
9.75..................... 30 0.9(0.2) CH3OH 15(4) 14(4) 1
13.3a ................... 240 [1.2] H2O [110] [100] 9
15.24................... 27.4 0.58(0.01) CO2 14.5(1.3) 13.2(1.2) 4
(Polar) 12.3 11.2 4
(Nonpolar) 2.2 2.0 4
18........................ 200 1.20(0.02) Silicate . . . . . . 9
Note.—Emission features are present at 3.8195 �m (H i 16–6), 3.9075 �m (H i 15–5), and 4.0523 �m (Br� ).a Calculated based on 3 �m feature.References.—(1) Gibb et al. 2000; (2) Brooke et al. 1999; (3) Dartois et al. 1999; (4) Gerakines et al. 1999; (5) Boogert et al. 2000;
(6) Whittet et al. 2001; (7) Demyk et al. 1998; (8) Chiar et al. 1998; (9) this work; (10) Palumbo et al. 1997; (11) Gibb & Whittet 2002;(12) Schutte et al. 1999; (13) Boogert et al. 1996; (14) Willner et al. 1982.
INTERSTELLAR ICE 65No. 1, 2004

limation of more volatile species and production of morecomplex species, such as XCN and CH3OH. This sequence isfor the most part supported by the current study with someminor differences.
Table 27 gives a concise comparison of compositions invarying lines of sight, according to the gross properties of theenvironment (mass of YSOs and evidence of strong or weakprocessing). Typically, cool quiescent regions that have notundergone significant processing of the icy mantle material
start with a polar (H2O, CO2, NH3? bearing) mantle coated bya CO rich apolar mantle. Only upper limits for CH3OH, XCN,and NH3 have been determined in these regions using ISOdata. Low-mass star formation regions show a similar com-position to the quiescent dark molecular cloud medium, in-dicating that little processing has occurred along much of theline of sight. CO2 and CO are found primarily in the polar andapolar mantles, respectively, in both environments, and thistrend has been consistently observed in several lines of sight.
TABLE 19
AFGL 7009S Spectral Features
k(�m)
FWHM
(cm�1) � Species
N
(1017 cm�2)
N/N(H2O)
*100 Reference
3.0a ..................... 335 . . . H2O . . . . . .
3.95..................... 115.3 0.09 CH3OH 35.5 32.3 1
4.27a ................... 12.8 CO2
4.38..................... 7.2 13CO2 0.4 0.36 2
4.5....................... 700 [0.15] H2O [110] [100] 2
4.62..................... 32 0.65 XCN 4.2 3.8 3, 4
4.67..................... 7.64 CO 18 16.4 2
4.89..................... 27.3 0.065(0.033) OCS 0.11(0.06) 0.10(0.05) 5
5.83..................... 47 0.56(0.06) H2CO 3.3(0.61) 3.0(0.56) 6
6.02..................... 150 1.2(0.1) H2O 110 100 2
6.0....................... 0.53(0.06) Organic residue . . . . . . 6
6.2....................... 58 0.10(0.06) ? . . . . . . 6
6.85..................... 85 0.93(0.06) Organics/NHþ4 . . . . . . 6
7.243................... 12.5 0.11(0.02) HCOOH 5.2(1.1) 4.7(1.0) 5
HCOO� 1.7(0.4) 1.5(0.4) 5
7.414................... 14.1 0.09(0.02) HCOO� 0.79(0.16) 0.72(0.15) 5
CH3HCO 9.0(1.8) 8.2(1.6) 5
7.676................... 10.4 �0.3 CH4 4.3 3.9 2
9.0....................... 68 �0.5(0.2) NH3 �19(8) 17.3(7.3) 7
9.7....................... 308 4.0(0.3) Silicate . . . . . . 5
13.3..................... 240 1.2 H2O 110 100 2
15.2..................... 27.4 CO2 25 22.7 2
18........................ 184 2.3(0.1) Silicate . . . . . . 5
a Saturated.References.—(1) Dartois et al. 1999; (2) d’Hendecourt et al. 1996; (3) Whittet et al. 2001; (4) Demyk et al. 1998; (5) this work;
(6) Gibb & Whittet 2002; (7) Gibb et al. 2001.
TABLE 20
R CrA IRS 2 Spectral Features
k(�m)
FWHM
(cm�1) � Species
N
(1017 cm�2)
N/N(H2O)
*100 Reference
3.0....................... 335 1.14(0.07) H2O 22.8 100 1
3.472................... 77 0.041(0.011) HAC . . . . . . 2
3.54..................... 30 <0.19 CH3OH <8 <35 1
3.95..................... 115.3 <0.044 CH3OH <10.4 <46 1
4.27a ................... 14 [3.1] CO2 [8.3] [36] 1
4.38..................... 7 0.13(0.02) 13CO2 0.117(0.009) 0.513(0.04) 3
4.5b ..................... 700 [0.031] H2O [22.8] [100]
4.62..................... 28 <0.015 XCN <0.084 <0.37 4
4.67..................... 3.22 4(1) CO 12(3) 53(13) 5
0.01(0.01) (Polar) 0.6(0.7) 2.6(3.1) 5
4(1) (Nonpolar) 11(3) 48(13) 5
4.91..................... 23 <0.22 OCS <0.32 <1.4 1
15.2..................... 18.8 0.44(0.03) CO2 8.3(1.2) 36(5) 1
(Polar) 5.4 24 1
(Apolar) 3.2 14 1
a Saturated.b Calculated based on 3 �m feature.References.—(1) This work; (2) Brooke et al. 1999; (3) Boogert et al. 2000; (4) Whittet et al. 2001; (5) Chiar et al. 1998.
GIBB ET AL.66
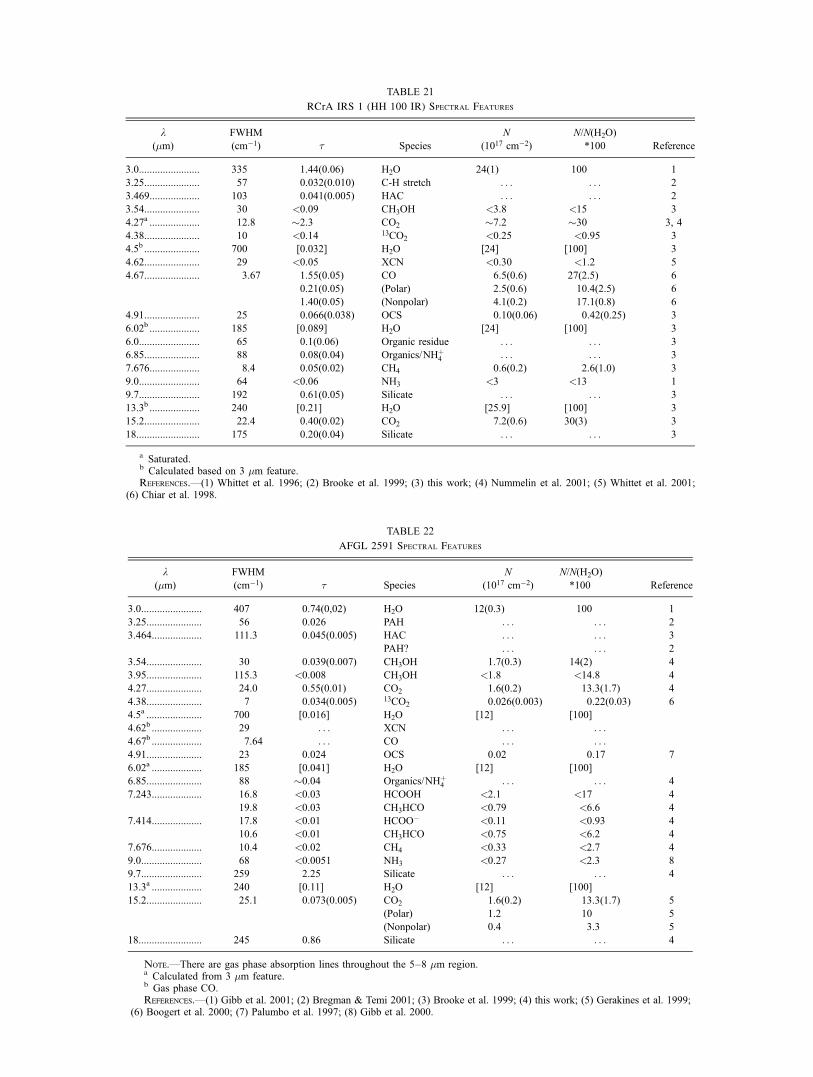
TABLE 21
RCrA IRS 1 (HH 100 IR) Spectral Features
k(�m)
FWHM
(cm�1) � Species
N
(1017 cm�2)
N/N(H2O)
*100 Reference
3.0....................... 335 1.44(0.06) H2O 24(1) 100 1
3.25..................... 57 0.032(0.010) C-H stretch . . . . . . 2
3.469................... 103 0.041(0.005) HAC . . . . . . 2
3.54..................... 30 <0.09 CH3OH <3.8 <15 3
4.27a ................... 12.8 �2.3 CO2 �7.2 �30 3, 4
4.38..................... 10 <0.14 13CO2 <0.25 <0.95 3
4.5b ..................... 700 [0.032] H2O [24] [100] 3
4.62..................... 29 <0.05 XCN <0.30 <1.2 5
4.67..................... 3.67 1.55(0.05) CO 6.5(0.6) 27(2.5) 6
0.21(0.05) (Polar) 2.5(0.6) 10.4(2.5) 6
1.40(0.05) (Nonpolar) 4.1(0.2) 17.1(0.8) 6
4.91..................... 25 0.066(0.038) OCS 0.10(0.06) 0.42(0.25) 3
6.02b ................... 185 [0.089] H2O [24] [100] 3
6.0....................... 65 0.1(0.06) Organic residue . . . . . . 3
6.85..................... 88 0.08(0.04) Organics/NHþ4 . . . . . . 3
7.676................... 8.4 0.05(0.02) CH4 0.6(0.2) 2.6(1.0) 3
9.0....................... 64 <0.06 NH3 <3 <13 1
9.7....................... 192 0.61(0.05) Silicate . . . . . . 3
13.3b ................... 240 [0.21] H2O [25.9] [100] 3
15.2..................... 22.4 0.40(0.02) CO2 7.2(0.6) 30(3) 3
18........................ 175 0.20(0.04) Silicate . . . . . . 3
a Saturated.b Calculated based on 3 �m feature.References.—(1) Whittet et al. 1996; (2) Brooke et al. 1999; (3) this work; (4) Nummelin et al. 2001; (5) Whittet et al. 2001;
(6) Chiar et al. 1998.
TABLE 22
AFGL 2591 Spectral Features
k(�m)
FWHM
(cm�1) � Species
N
(1017 cm�2)
N/N(H2O)
*100 Reference
3.0....................... 407 0.74(0,02) H2O 12(0.3) 100 1
3.25..................... 56 0.026 PAH . . . . . . 2
3.464................... 111.3 0.045(0.005) HAC . . . . . . 3
PAH? . . . . . . 2
3.54..................... 30 0.039(0.007) CH3OH 1.7(0.3) 14(2) 4
3.95..................... 115.3 <0.008 CH3OH <1.8 <14.8 4
4.27..................... 24.0 0.55(0.01) CO2 1.6(0.2) 13.3(1.7) 4
4.38..................... 7 0.034(0.005) 13CO2 0.026(0.003) 0.22(0.03) 6
4.5a ..................... 700 [0.016] H2O [12] [100]
4.62b ................... 29 . . . XCN . . . . . .
4.67b ................... 7.64 . . . CO . . . . . .
4.91..................... 23 0.024 OCS 0.02 0.17 7
6.02a ................... 185 [0.041] H2O [12] [100]
6.85..................... 88 �0.04 Organics/NHþ4 . . . . . . 4
7.243................... 16.8 <0.03 HCOOH <2.1 <17 4
19.8 <0.03 CH3HCO <0.79 <6.6 4
7.414................... 17.8 <0.01 HCOO� <0.11 <0.93 4
10.6 <0.01 CH3HCO <0.75 <6.2 4
7.676................... 10.4 <0.02 CH4 <0.33 <2.7 4
9.0....................... 68 <0.0051 NH3 <0.27 <2.3 8
9.7....................... 259 2.25 Silicate . . . . . . 4
13.3a ................... 240 [0.11] H2O [12] [100]
15.2..................... 25.1 0.073(0.005) CO2 1.6(0.2) 13.3(1.7) 5
(Polar) 1.2 10 5
(Nonpolar) 0.4 3.3 5
18........................ 245 0.86 Silicate . . . . . . 4
Note.—There are gas phase absorption lines throughout the 5–8 �m region.a Calculated from 3 �m feature.b Gas phase CO.References.—(1) Gibb et al. 2001; (2) Bregman & Temi 2001; (3) Brooke et al. 1999; (4) this work; (5) Gerakines et al. 1999;
(6) Boogert et al. 2000; (7) Palumbo et al. 1997; (8) Gibb et al. 2000.

However, a recent study by Pontoppidan et al. (2003) hasreported large (�15%) abundances of CH3OH in several low-mass YSOs, possibly indicating that the conditions requiredfor production of CH3OH are not limited to high-mass YSOs.
Conditions in intermediate-mass star formation regions(i.e., AFGL 989 and R CrA IRS 1) seem to give rise to theproduction of large amounts of CO2 relative to other regions,close to 30% as compared to the �17% found in most otherlines of sight (Gerakines et al. 1999; Nummelin et al. 2001).The reasons for this are unknown. The profiles are consistentwith significant contributions from both polar and apolarcomponents. CO is primarily in the polar component in some
sources, though others seem to have retained a significantapolar contribution, perhaps reflecting differences in temper-ature and hence evaporative loss of the apolar mantle. Modestamounts of CH3OH may be expected to form in these regions,though the ISO data result in abundances consistent with thosefound for low-mass YSOs. Further study of such intermediate-mass regions is of great interest.High-mass star formation regions can be divided into two
distinct groups: those that show significant processing of the icemantles and those that do not. Both groups have CO2 abun-dances consistent with those found for low-mass and quiescentregions and are typically dominated by a polar component,
TABLE 23
Cygnus OB2 12 Spectral Features
k(�m)
FWHM
(cm�1) � Species
N
(1017 cm�2) Reference
3.0............................ <0.02 H2O <0.40 1
3.477........................ 80.7 0.04(0.01) HAC . . . 2
4.27.......................... <0.02 CO2 <0.05 2
4.62.......................... 24.7 <0.015 XCN <0.084 3
6.2............................ 60 0.06(0.04) ? . . . 2
6.85.......................... 79 <0.034 Organics/NHþ4 . . . 4
9.7............................ 320 0.54(0.06) Silicate 15 2
10.0.......................... 20 <0.0067 HMT <0.27 1
References.—(1) Bowey et al. 1998; (2) Whittet et al. 1997; (3) Whittet et al. 2001; (4) this work.
TABLE 24
S140 IRS 1 Spectral Features
k(�m)
FWHM
(cm�1) � Species
N
(1017 cm�2)
N/N(H2O)
*100 Reference
3.0....................... 335 1.12(0.02) H2O 19(0.3) 100 1
3.25..................... 74 0.036(0.007) C-H stretch . . . . . . 2
68 0.050 PAH 9.4 . . . 3
3.46..................... 89 0.048(0.01) HAC . . . . . . 3, 4
3.54..................... 30 <0.03 CH3OH <1.5 <7.7 4
3.95..................... 115.3 <0.01 CH3OH <2.5 <13.3 4
4.27..................... 23.9 1.25(0.04) CO2 4.2(0.1) 22 5
4.38..................... 5 0.050(0.005) 13CO2 0.038(0.003) 0.16(0.02) 6
4.5a ..................... 700 [0.026] H2O [19] [100]
4.62..................... 28 � 0.024 XCN � 0.14 � 0.75 4
4.67b ................... 7.64 <0.1 CO . . . . . . 7
4.91..................... 23 <0.02 OCS <0.05 <0.3 4
6.02..................... 157 0.084(0.01) H2O 19(2) 100(11) 8
6.0....................... 124 0.02(0.01) Organic residue . . . . . . 8
6.85..................... 76 0.087(0.01) Organics/NHþ4 . . . . . . 8
7.243................... 16.8 <0.010 HCOOH <0.69 <3.6 4
19.8 CH3HCO <0.26 <1.4 4
7.414................... 17.8 <0.005 HCOO� <0.056 <0.29 4
10.6 CH3HCO <0.38 <2.0 4
7.676................... 10 0.012(0.003) CH4 0.17(0.04) 0.92(0.2) 4
9.0....................... 68 <0.013 NH3 <0.68 <3.6 1
9.7....................... 266 1.51(0.02) Silicate . . . . . . 4
13.3a ................... 240 [0.23] H2O [19] [100]
15.2..................... 16.3 0.24(0.02) CO2 4.2(0.1) 22 5
(Polar) 2.1 11 5
(Nonpolar) 2.1 11 5
18........................ 173 0.40(0.03) Silicate . . . . . . 4
a Calculated from 3 �m feature.b Gas phase CO.References.—(1) Gibb et al. 2001; (2) Brooke et al. 1999; (3) Bregman & Temi 2001; (4) this work; (5) Gerakines et al. 1999; (6) Boogert
et al. 2000; (7) Tielens et al. 1991; (8) Gibb & Whittet 2002.
GIBB ET AL.68 Vol. 151

though a significant apolar component is suggested by theprofiles of many of these objects. CO in these regions is pri-marily in the gas phase, though many sources have retained asignificant CO mantle with both polar and apolar components,probably originating in the cool envelope surrounding the YSO.The weakly processed objects are similar to lower mass YSOsin their NH3 and CH3OH abundances, though processing hasgiven rise to detectable 4.62 �m XCN features in several ofthese objects. Intensive processing, as for the regions W33 A,AFGL 7009S, and NGC 7538 IRS 9, leads to large abundancesof CH3OH (�15% or more) and the formation of significant(2%–6%) abundances of XCN. Large abundances of NH3
(�15%) may also be present along these lines of sight.
5.3.1. Carbon and Nitrogen Ice Component
In general, the principle carbon-bearing species in thepolar mantle in all lines of sight is CO2 with the possibleexceptions of those sources (W33 A and AFGL 7009S) withhigh methanol abundances. The total contribution of polarCO and CO2 is typically 10%–30% that of the dominantcomponent, water, though for the high CO2, intermediate-mass YSOs (such as R CrA IRS 1) the percentage can be ashigh as 40%. For most sources in this study, these are the
only carbon-bearing species for which firm abundances areknown. Other carbon-bearing ices (CH3OH, HCOOH, CH4,and H2CO) may contribute no more than �10% in mostlines of sight. The exceptions to this are the strongly processedmassive YSOs for which CH3OH+CH4+HCOOH+H2COmay contribute up to an additional 20%, bringing the totalcontribution of carbon-bearing ices in the polar mantle tonearly half that of water. The apolar mantle varies strongly,depending critically on the temperature profile through theline of sight.
Nitrogen, on the other hand, is apparently far less abundanton the grain surface. In most lines of sight, the total possiblecontribution from ammonia and XCN is less than 10% andfrequently less than 5%. The only exceptions to this are thestrongly processed massive YSOs for which NH3+XCN couldcontribute as much as 15%–20% relative to water. Presum-ably, most of the nitrogen in the ices is in the form of N2,which lacks infrared signatures.
5.3.2. Implications for Grain Surface Chemistry
Keane (2002) investigated grain surface chemistry in inter-stellar clouds. In particular, it was determined from five high-mass YSOs that the high abundance of solid H2O and the
TABLE 25
NGC 7538 IRS 1 Spectral Features
k(�m)
FWHM
(cm�1) � Species
N
(1017 cm�2)
N/N(H2O)
*100 Reference
3.0....................... 335 1.27 H2O 22 100 1
3.25..................... 74 0.078(0.013) C-H stretch . . . . . . 2
3.29..................... 49 . . . PAH emission . . . . . . 3
3.39..................... 16.6 . . . HAC emission . . . . . . 3
3.46..................... 80 �0.046 HAC . . . . . . 3
3.54..................... 30 <0.02 CH3OH <1 <4 3
3.95..................... 115.3 <0.01 CH3OH <2.3 <10 3
4.27..................... 16.4 2.03(0.11) CO2 5.1(0.2) 23(0.9) 4
4.38..................... 7.2 0.09 13CO2 0.11 0.5 3
4.5a ..................... 700 [0.03] H2O [22] 100 3
4.62..................... 29 <0.02 XCN <0.1 <0.5 3
4.67..................... 7.64 0.26 CO 1.8 8.2 3
0.07 (Polar) 0.99 4.5 3
0.15 (Nonpolar) 0.86 3.9 3
4.91..................... 23 <0.01? OCS <0.01? <0.05 3
6.02a ................... 185 [0.08] H2O [22] [100] 3
6.0....................... � 0.18 Organic residue? . . . . . . 3
6.22..................... . . . PAH emission . . . . . .6.85..................... 105 0.27(0.01) Organics . . . . . . 3
7.273................... 25.4 0.046(0.007) HCOOH 4.8(0.7) 22(3) 3
HCOO� 1.6(0.2) 7.3(1) 3
7.414................... 17.8 0.034(0.006) HCOO� 0.38(0.07) 1.7(0.3) 3
10.6 CH3HCO 2.6(0.5) 12(2) 3
7.676................... 10.4 0.022(0.007) CH4??? 0.33(0.1) 1.5(.5) 3
9.0....................... 68 <0.071 NH3 <3.7 <17 1
9.7....................... 307 1.98(0.06) Silicate . . . . . . 3
13.3a ................... 240 [0.30] H2O [22] 100 3
15.2..................... 24.3 0.21(0.01) CO2 5.1(0.2) 23(0.9) 4
(Polar) 4.5 20 4
(Nonpolar) 0.6 2.7 4
18........................ 230 0.62(0.02) Silicate . . . . . . 3
Note.—There are emission features at 2.626 �m (Br�), 2.757 �m (Pf�), 2.872 �m (Pf), 3.037 �m (Pf), 3.296 �m (Pf�), 3.741 �m(Pf ), 4.052 �m (Br� ), 4.653 �m (Pf�), 6.981 �m (Ar ii 2P1=2
2P3=2), 7.458 �m (Pf� ), 8.989 �m (Ar iii 3P13P2), 12.808 �m
(Ne ii2P1=22P3=2), 18.710 �m (H i 22–12, S iii
3P23P1?), 33.474 �m (Si iii 3P1
3P0?), and 34.805 �m (Si ii 2P3=22P1=2?).
a Calculated from the 3 �m feature.References.—(1) Gibb et al. 2001; (2) Brooke et al. 1999; (3) this work; (4) Gerakines et al. 1999.
INTERSTELLAR ICE 69No. 1, 2004

CO2:CO and CH3OH:CO ratios imply that both oxygenationand hydrogenation reactions are important for determining icemantle compositions. Our results are consistent with this in-terpretation. TheCO2:CO ratio is found to range from about 1–4in all our sources, including quiescent and low/intermediate-mass regions. CH3OH:CO is found to range from 0.11 or lessto �1. When compared with the model of Keane (2002)we deduce that the observed ice mantle composition in a widerange of physical environments requires a high O2 abun-dance, a conclusion reached by Keane (2002) for high-massYSOs alone.
6. CONCLUSION
Our understanding of interstellar ices has clearly come along way since the launch of the pivotal Infrared SpaceObservatory. While H2O, CO, CO2, CH3OH, and CH4 seem tobe well characterized in many lines of sight, there are stillmany mysteries regarding the nitrogen component of the grainmantle. Such features as the 4.62 �m XCN and 6.8 �morganic/NHþ
4 are thought to originate primarily via processingof NH3-bearing ices, yet there is much controversy andcontradiction in the literature concerning the abundance ofammonia in ices. The water-ice features at 3 and 6 �m contain
structure and/or blended features that are still not fully un-derstood. Clearly, much more work needs to be done tocharacterize ice composition in a variety of lines of sight, fromthe diffuse ISM to quiescent clouds and through the range ofstar formation environments. While many advances are beingaccomplished with the use of ground-based instrumentation(i.e., Dartois et al. 2002; Boogert et al. 2002; Taban et al.2003; Pontoppidan et al. 2003), another space-based missionwith high resolving power (>2000) and greater sensitivity toimprove studies of low-mass and quiescent environments isneeded to fully understand the volatile component of theinterstellar medium.
E. L. G. and D. C. B. W. gratefully acknowledge financialsupport from NASA under grants NAG5-7598 and NAG5-9148. E. L. G. also gratefully acknowledges support fromthe National Research Council under her Resident ResearchAssociateship. The data presented were analyzed with thesupport of the Dutch ISO Data Analysis Centre (DIDAC) atthe Space Research Organization Netherlands (SRON) inGroningen, the Netherlands.
TABLE 26
NGC 7538 IRS 9 Spectral Features
k(�m)
FWHM
(cm�1) � Species
N
(1017 cm�2)
N/N(H2O)
*100 Reference
3.0....................... 439 3.1(0.25) H2O 70(6) 100 1, 2
3.485................... 98.8 0.130(0.017) HAC . . . . . . 3
3.54..................... 29 0.07(0.01) CH3OH 3.0(0.4) 4.3(0.6) 3
3.95..................... 115.3 <0.012 CH3OH <2.9 <4.2 1
4.27..................... 20 >5 CO2 16.3(1.8) 23.3(2.6) 4
4.38..................... 10.4 0.15(0.01) 13CO2 0.203(0.012) 0.290(0.017) 5
4.5a ..................... 700 [0.094] H2O [70] [100] 1
4.62..................... 20 0.21 XCN 1.2 1.7 6, 7
4.67..................... 4.75 2.6(0.2) CO 12(1) 17(1) 8
0.2(0.1) (Polar) 1.4(0.8) 2.0(1.1) 8
2.5(0.2) (Nonpolar) 11(1) 16(1) 8
4.91..................... 17.6 0.05(0.01) OCS 0.055(0.044) 0.079(0.063) 1
5.83..................... 30 0.06(0.02) H2CO 1.5(0.5) 2.2(0.7) 9
5.85..................... 65 0.05(0.02) HCOOH 0.69(0.28) 0.98(0.40) 9
6.02a ................... 158 0.31(0.02) H2O 70(4.5) 100(6.4) 9
6.0....................... 0.18(0.02) Organic residue . . . . . . 9
6.85..................... 83 0.34(0.02) Organics/NHþ4 . . . . . . 9
7.243................... 16.8 <0.016 HCOOH <1.1 <1.6 1
19.8 CH3HCO <0.42 <0.60 1
7.414................... 17.8 <0.016 HCOO� <0.18 <0.26 1
10.6 CH3HCO <1.2 <1.7 1
7.58..................... 27.7 <0.06 SO2 <0.55 <0.79 10
7.674................... 10.7 0.092(0.005) CH4 1.05(0.03) 1.5(0.04) 11
8.90a ................... 34 [0.011] CH3OH [� 3.0] [� 4.3] 1
9.0....................... 68 0.20(0.04) NH3 10.5(1.9) 15(2.7) 12
9.7....................... 242 2.23 Silicate . . . . . . 1
9.75a ................... 30 [0.18] CH3OH [3.0] [4.3] 1
13.3a ................... 240 [0.63] H2O [70] [100] 1
15.2..................... 21.1 0.766(0.005) CO2 16.3(1.8) 23.3(2.6) 4
(Polar) 10.8 15.4 4
(Nonpolar) 5.5 7.9 4
18........................ 217 0.56 Silicate . . . . . . 1
a Water values calculated from 3 �m feature and CH3OH values from the 3.54 �m feature.References.—(1) This work; (2) Allamandola et al. 1992; (3) Brooke et al. 1999; (4) Gerakines et al. 1999; (5) Boogert et al. 2000;
(6) Whittet et al. 2001; (7) Demyk et al. 1998; (8) Chiar et al. 1998; (9) Gibb & Whittet 2002; (10) Boogert et al. 1997; (11) Boogertet al. 1996; (12) Gibb et al. 2001.
GIBB ET AL.70

TABLE 27
Ice Composition as a Function of Environment
Source Type H2O CO2 CO NH3 CH3OH XCN 6.0 �m Excess Sources
Quiescent environment ......................... 100 �25 �25 <10 <3 <1.5 . . . Elias 16
Low-mass YSO..................................... 100 �20 �5 <5 <5 <0.2 Intermediate Elias 29
Intermediate-mass YSO ........................ 100 �30–35 18–50 <5 <5 �0.3 Intermediate AFGL 989, R CrA IRS 1, R CrA IRS 2
High-mass YSO, weak processing ....... 100 �7–22 �3–8 <5 <5–10 0.3–2 Weak to strong W3 IRS 5, AFGL 490, Orion BN, Orion IrC2,
Mon R2 IRS 2, Mon R2 IRS 3, AFGL 2136,
AFGL 2591, S140, NGC 7538 IRS 1,
NGC 7538 IRS 9
High-mass YSO, strong processing ..... 100 �13–23 8–17 �15 �15–30 2–6 Strong W33A, AFGL 7009S
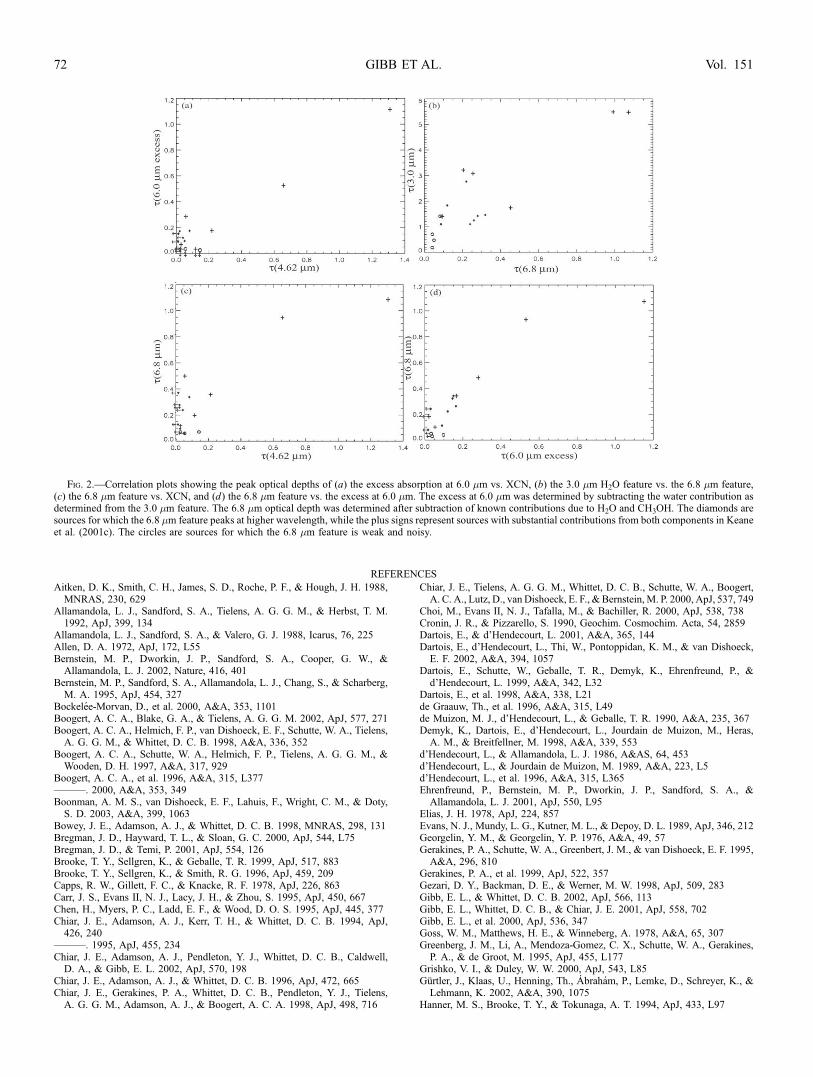
REFERENCES
Aitken, D. K., Smith, C. H., James, S. D., Roche, P. F., & Hough, J. H. 1988,MNRAS, 230, 629
Allamandola, L. J., Sandford, S. A., Tielens, A. G. G. M., & Herbst, T. M.1992, ApJ, 399, 134
Allamandola, L. J., Sandford, S. A., & Valero, G. J. 1988, Icarus, 76, 225Allen, D. A. 1972, ApJ, 172, L55Bernstein, M. P., Dworkin, J. P., Sandford, S. A., Cooper, G. W., &Allamandola, L. J. 2002, Nature, 416, 401
Bernstein, M. P., Sandford, S. A., Allamandola, L. J., Chang, S., & Scharberg,M. A. 1995, ApJ, 454, 327
Bockelee-Morvan, D., et al. 2000, A&A, 353, 1101Boogert, A. C. A., Blake, G. A., & Tielens, A. G. G. M. 2002, ApJ, 577, 271Boogert, A. C. A., Helmich, F. P., van Dishoeck, E. F., Schutte, W. A., Tielens,A. G. G. M., & Whittet, D. C. B. 1998, A&A, 336, 352
Boogert, A. C. A., Schutte, W. A., Helmich, F. P., Tielens, A. G. G. M., &Wooden, D. H. 1997, A&A, 317, 929
Boogert, A. C. A., et al. 1996, A&A, 315, L377———. 2000, A&A, 353, 349Boonman, A. M. S., van Dishoeck, E. F., Lahuis, F., Wright, C. M., & Doty,S. D. 2003, A&A, 399, 1063
Bowey, J. E., Adamson, A. J., & Whittet, D. C. B. 1998, MNRAS, 298, 131Bregman, J. D., Hayward, T. L., & Sloan, G. C. 2000, ApJ, 544, L75Bregman, J. D., & Temi, P. 2001, ApJ, 554, 126Brooke, T. Y., Sellgren, K., & Geballe, T. R. 1999, ApJ, 517, 883Brooke, T. Y., Sellgren, K., & Smith, R. G. 1996, ApJ, 459, 209Capps, R. W., Gillett, F. C., & Knacke, R. F. 1978, ApJ, 226, 863Carr, J. S., Evans II, N. J., Lacy, J. H., & Zhou, S. 1995, ApJ, 450, 667Chen, H., Myers, P. C., Ladd, E. F., & Wood, D. O. S. 1995, ApJ, 445, 377Chiar, J. E., Adamson, A. J., Kerr, T. H., & Whittet, D. C. B. 1994, ApJ,426, 240
———. 1995, ApJ, 455, 234Chiar, J. E., Adamson, A. J., Pendleton, Y. J., Whittet, D. C. B., Caldwell,D. A., & Gibb, E. L. 2002, ApJ, 570, 198
Chiar, J. E., Adamson, A. J., & Whittet, D. C. B. 1996, ApJ, 472, 665Chiar, J. E., Gerakines, P. A., Whittet, D. C. B., Pendleton, Y. J., Tielens,A. G. G. M., Adamson, A. J., & Boogert, A. C. A. 1998, ApJ, 498, 716
Chiar, J. E., Tielens, A. G. G. M., Whittet, D. C. B., Schutte, W. A., Boogert,A. C. A., Lutz, D., van Dishoeck, E. F., & Bernstein,M. P. 2000, ApJ, 537, 749
Choi, M., Evans II, N. J., Tafalla, M., & Bachiller, R. 2000, ApJ, 538, 738Cronin, J. R., & Pizzarello, S. 1990, Geochim. Cosmochim. Acta, 54, 2859Dartois, E., & d’Hendecourt, L. 2001, A&A, 365, 144Dartois, E., d’Hendecourt, L., Thi, W., Pontoppidan, K. M., & van Dishoeck,E. F. 2002, A&A, 394, 1057
Dartois, E., Schutte, W., Geballe, T. R., Demyk, K., Ehrenfreund, P., &d’Hendecourt, L. 1999, A&A, 342, L32
Dartois, E., et al. 1998, A&A, 338, L21de Graauw, Th., et al. 1996, A&A, 315, L49de Muizon, M. J., d’Hendecourt, L., & Geballe, T. R. 1990, A&A, 235, 367Demyk, K., Dartois, E., d’Hendecourt, L., Jourdain de Muizon, M., Heras,A. M., & Breitfellner, M. 1998, A&A, 339, 553
d’Hendecourt, L., & Allamandola, L. J. 1986, A&AS, 64, 453d’Hendecourt, L., & Jourdain de Muizon, M. 1989, A&A, 223, L5d’Hendecourt, L., et al. 1996, A&A, 315, L365Ehrenfreund, P., Bernstein, M. P., Dworkin, J. P., Sandford, S. A., &Allamandola, L. J. 2001, ApJ, 550, L95
Elias, J. H. 1978, ApJ, 224, 857Evans, N. J., Mundy, L. G., Kutner, M. L., & Depoy, D. L. 1989, ApJ, 346, 212Georgelin, Y. M., & Georgelin, Y. P. 1976, A&A, 49, 57Gerakines, P. A., Schutte, W. A., Greenbert, J. M., & van Dishoeck, E. F. 1995,A&A, 296, 810
Gerakines, P. A., et al. 1999, ApJ, 522, 357Gezari, D. Y., Backman, D. E., & Werner, M. W. 1998, ApJ, 509, 283Gibb, E. L., & Whittet, D. C. B. 2002, ApJ, 566, 113Gibb, E. L., Whittet, D. C. B., & Chiar, J. E. 2001, ApJ, 558, 702Gibb, E. L., et al. 2000, ApJ, 536, 347Goss, W. M., Matthews, H. E., & Winneberg, A. 1978, A&A, 65, 307Greenberg, J. M., Li, A., Mendoza-Gomez, C. X., Schutte, W. A., Gerakines,P. A., & de Groot, M. 1995, ApJ, 455, L177
Grishko, V. I., & Duley, W. W. 2000, ApJ, 543, L85Gurtler, J., Klaas, U., Henning, Th., Abraham, P., Lemke, D., Schreyer, K., &Lehmann, K. 2002, A&A, 390, 1075
Hanner, M. S., Brooke, T. Y., & Tokunaga, A. T. 1994, ApJ, 433, L97
Fig. 2.—Correlation plots showing the peak optical depths of (a) the excess absorption at 6.0 �m vs. XCN, (b) the 3.0 �m H2O feature vs. the 6.8 �m feature,(c) the 6.8 �m feature vs. XCN, and (d) the 6.8 �m feature vs. the excess at 6.0 �m. The excess at 6.0 �m was determined by subtracting the water contribution asdetermined from the 3.0 �m feature. The 6.8 �m optical depth was determined after subtraction of known contributions due to H2O and CH3OH. The diamonds aresources for which the 6.8 �m feature peaks at higher wavelength, while the plus signs represent sources with substantial contributions from both components in Keaneet al. (2001c). The circles are sources for which the 6.8 �m feature is weak and noisy.
GIBB ET AL.72 Vol. 151
Henning, Th., Pfau, W., & Altenhoff, W. J. 1990, A&A, 227, 542Hiraoka, K., Sato, T., Sato, S., Sogoshi, N., Yokoyama, T., Hideaki, T., &Kitagawa, S. 2002, ApJ, 577, 265
Hudgins, D. M., Sandford, S. A., Allamandola, L. J., & Tielens, A. G. G. M.1993, ApJS, 86, 713
Hudson, R. L., & Moore, M. H. 1995, Radiat. Phys. Chem., 45, 779Hudson, R. L., Moore, M. H., & Gerakines, P. A. 2001, ApJ, 550, 1140Humphreys, R. M. 1978, ApJS, 38, 309Keane, J. V. 2002, Ph.D. thesis, Univ. GroningenKeane, J. V., Boogert, A. C. A., Tielens, A. G. G. M., Ehrenfreund, P., &Schutte, W. A. 2001a, A&A, 375, L43
Keane, J. V., Boonman, A. M. S., Tielens, A. G. G. M., & van Dishoeck, E. F.2001b, A&A, 376, L5
Keane, J. V., Tielens, A. G. G. M., Boogert, A. C. A., Schutte, W. A., &Whittet, D. C. B. 2001c, A&A, 376, 254
Kerkhof, O., Schutte, W. A., & Ehrenfreund, P. 1999, A&A, 349, 990Koresko, C. D., Beckwith, S., Ghez, A. M., Matthews, K., Herbst, T. M., &Smith, D. A. 1993, AJ, 105, 1481
Lacy, J. H., Farah, H., Sandford, S. A., & Allamandola, L. J. 1998, ApJ, 501,L105
Ladd, E. F., Deane, J. R., Sanders, D. B., & Wynn-Williams, C. G. 1993, ApJ,419, 186
Lahuis, F., & van Dishoeck, E. F. 2000, A&A, 355, 699Lutz, D., et al. 1996, A&A, 315, L269Marraco, H. G., & Rydgren, A. E. 1981, AJ, 86, 62Minchin, N. R., Hough, J. H., Burton, M. G., & Yamashita, T. 1991, MNRAS,251, 522
Mitchell, G. F., Allen, M., & Maillard, J.-P. 1988, ApJ, 333, L55Mitchell, G. F., & Hasegawa, T. I. 1991, ApJ, 371, L33Mitchell, G. F., Lee, S. W., Maillard, J. P., Matthews, H., Hasegawa, T. I., &Harris, A. I. 1995, ApJ, 438, 794
Mitchell, G. F., Maillard, J. P., Allen, M., Beer, R., & Belcourt, K. 1990, ApJ,363, 554
Moneti, A., Cernicharo, J., & Pardo, J. R. 2001, ApJ, 549, L203Mozurkewich, D., Schwartz, P. R., & Smith, H. A. 1986, ApJ, 311, 371Munoz Caro, G. M., et al. 2002, Nature, 416, 403Nummelin, A., Whittet, D. C. B., Gibb, E. L., Gerakines, P. A., & Chiar, J. E.2001, ApJ, 558, 185
Palumbo, M. E., Geballe, T. R., & Tielens, A. G. G. M. 1997, ApJ, 479, 839Pendleton, Y. J., Tielens, A. G. G. M., Tokunaga, A. T., & Bernstein, M. P.1999, ApJ, 513, 294
Pontoppidan, K. M., Dartois, E., van Dishoeck, E. F., Thi, W.-F., &d’Hendecourt, L. 2003, A&A, 404, L17
Rieke, G. H., & Lebofsky, M. J. 1985, ApJ, 288, 618Salama, F., Allamandola, L. J., Witteborn, F. C., Cruikshank, D. P., Sandford,S. A., & Bregman, J. D. 1990, Icarus, 83, 66
Sandford, S. A., & Allamandola, L. J. 1990, Icarus, 87, 188Sandford, S. A., Allamandola, L. J., Tielens, A. G. G. M., & Valero, L. J. 1988,ApJ, 329, 498
Schreyer, K., Helmich, F. P., van Dishoeck, E. F., & Henning, Th. 1997, A&A,326, 347
Schutte, W. A., Allamandola, L. J., & Sandford, S. A. 1993, Icarus, 104, 118Schutte, W. A., Gerakines, P. A., Geballe, T. R., van Dishoeck, E. F., &Greenberg, J. M. 1996, A&A, 309, 633
Schutte, W. A., & Greenberg, J. M. 1997, A&A, 317, L43Schutte, W. A., & Khanna, R. K. 2003, A&A, 398, 1049Schutte, W. A., et al. 1998, A&A, 337, 261———. 1999, A&A, 343, 966Sellgren, K., Smith, R. G., & Brooke, T. Y. 1994, ApJ, 433, 179Skinner, C. J., Tielens, A. G. G. M., Barlow, M. J., & Justtanont, K. 1992, ApJ,399, L79
Smith, R. G., Sellgren, K., & Tokunaga, A. T. 1989, ApJ, 344, 413Smits, D. P., Cohen, R. J., & Hutawaradorn, B. 1998, MNRAS, 296, L11Snell, R. L., Scoville, N. Z., Sanders, D. B., & Erickson, N. R. 1984, ApJ,284, 176
Snyder, L. E. 1997, Origins Life Evol. Biosphere, 27, 115Strazzulla, G., Nisini, B., Leto, G., Paulumbo, M. E., & Saraceno, P. 1998,A&A, 334, 1056
Taban, I. M., Schutte, W. A., Pontoppidan, K. M., & van Dishoeck, E. F. 2003,A&A, 399, 169
Teixeira, T. C., & Emerson, J. P. 1999, A&A, 351, 303Thompson, R. I., Corbin, M. R., Young, E., & Schneider, G. 1998, ApJ,492, L177
Tieftrunk, A. R., Gaume, R. A., Claussen, M. J., Wilson, T. L., & Johnston,K. J. 1997, A&A, 318, 931
Tielens, A. G. G. M., & Hagen, W. 1982, A&A, 114, 245Tielens, A. G. G. M., Meixner, M. M., van der Werf, P. P., Bregman, J., &Tauber, J. A. 1993, Science, 262, 86
Tielens, A. G. G. M., Tokunaga, A. T., Geballe, T. R., & Baas, F. 1991, ApJ,381, 181
Torres-Dodgen, A. V., Tapia, M., & Carroll, M. 1991, MNRAS, 249, 1van der Tak, F. S., van Dishoeck, E. F., Evans II, N. J., & Blake, G. A. 1999,ApJ, 522, 991
van Dishoeck, E. F., Wright, C. M., Cernicharo, J., Gonzalez-Alfonso, E., deGraauw, Th., Helmich, F. P., & Vandenbussche, B. 1998, ApJ, 502, L173
Watanabe, N., & Kouchi, A. 2002, ApJ, 571, L173Werner, M. W., Becklin, E. E., Gatley, I., Matthews, K., & Neugebauer, G.1979, MNRAS, 188, 463
Whittet, D. C. B. 2003, Dust in the Galactic Environment (Bristol: Inst. Phys.Publ.)
Whittet, D. C. B., Bode, M. F., Longmore, A. J., Baines, D. W. T., & Evans, A.1983, Nature, 303, 218
Whittet, D. C. B., Pendleton, Y. J., Gibb, E. L., Boogert, A. C. A., Chiar, J. E.,& Nummelin, A. 2001, ApJ, 550, 793
Whittet, D. C. B., et al. 1996, ApJ, 458, 363———. 1997, ApJ, 490, 729———. 1998, ApJ, 498, L159Wilking, B. A., Taylor, K. N. R., & Storey, J. W. V. 1986, AJ, 92, 103Willner, S. P., et al. 1982, ApJ, 253, 174Woon, D. E. 2002, ApJ, 571, L177Wynn-Williams, C. G. 1982, ARA&A, 20, 587
INTERSTELLAR ICE 73No. 1, 2004