Interspecific protection against oxidative stress: green ...
5
Supporting figures S1, S2 and S3 to: Interspecific protection against oxidative stress: green algae protect harmful cyanobacteria against hydrogen peroxide Erik F.J. Weenink 1 , Hans C.P. Matthijs 1† , J. Merijn Schuurmans 1 , Tim Piel 1 , Maria J. van Herk 1 , Corrien A.M. Sigon 1 , Petra M. Visser 1 and Jef Huisman 1 1 Department of Freshwater and Marine Ecology, Institute for Biodiversity and Ecosystem Dynamics, University of Amsterdam, P.O. Box 94240, 1090 GE Amsterdam, The Netherlands.
Transcript of Interspecific protection against oxidative stress: green ...
Supporting figures S1, S2 and S3 to:
Interspecific protection against oxidative stress:
green algae protect harmful cyanobacteria against hydrogen peroxide
Erik F.J. Weenink1, Hans C.P. Matthijs1†, J. Merijn Schuurmans1, Tim Piel1, Maria J. van Herk1,
Corrien A.M. Sigon1, Petra M. Visser1 and Jef Huisman1
1Department of Freshwater and Marine Ecology, Institute for Biodiversity and Ecosystem Dynamics,
University of Amsterdam, P.O. Box 94240, 1090 GE Amsterdam, The Netherlands.
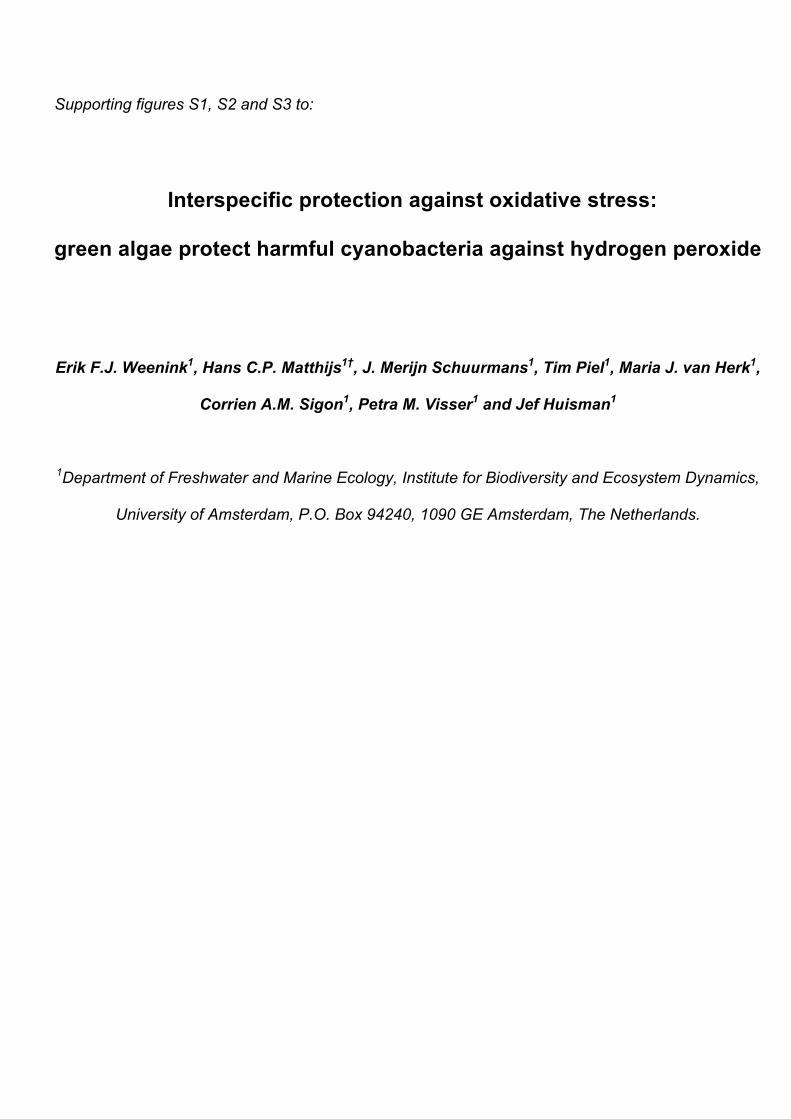
Minimum fluorescence (F0) Maximum fluorescence (Fm)
Microcystis
0
200
400
600
800 Microcystis
Anabaena
0
100
200
300
400 Anabaena
Flu
ores
cenc
e (A
U)
0 mg L-1 1 mg L-1 2 mg L-1 3.5 mg L-1 5 mg L-1 8 mg L-1 12 mg L-1
0 5 10 15 20 25
Planktothrix
0
300
600
900
1200
1500
0 5 10 15 20 25
Planktothrix
Time after H2O2 addition (hour)
Fig. S1. Minimum fluorescence (F0) and maximum fluorescence (Fm) in monocultures
of three species of freshwater cyanobacteria: Microcystis aeruginosa strain PCC
7806, Anabaena PCC 7938 and Planktothrix PCC 7811, after addition of different
H2O2 concentrations.
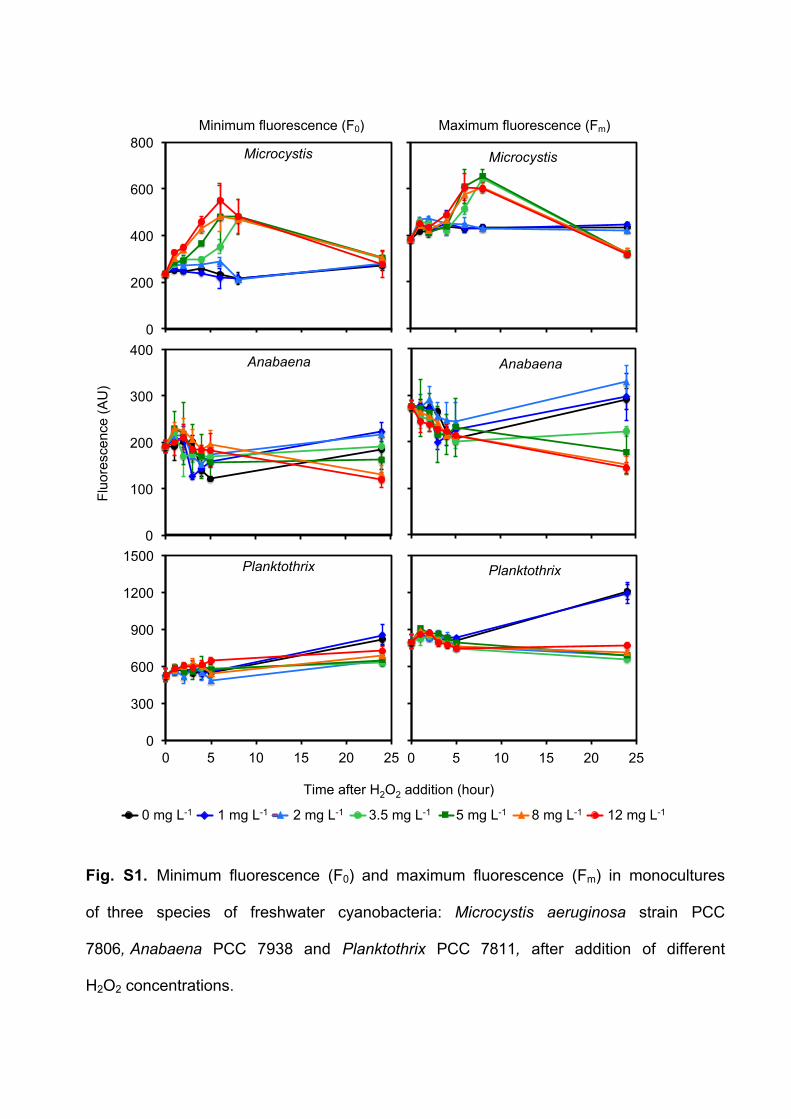
Chlorella
0
500
1000
1500
2000 Chlorella
Desmodesmus
0
200
400
600
800
1000 Desmodesmus
0 5 10 15 20 25
Kirchneriella
0
250
500
750
1000
1250
0 5 10 15 20 25
Kirchneriella
0 mg L-1 12 mg L-1 20 mg L-1 35 mg L-1 50 mg L-1 75 mg L-1 100 mg L-1
Time after H2O2 addition (hour)
Flu
ores
cenc
e (A
U)
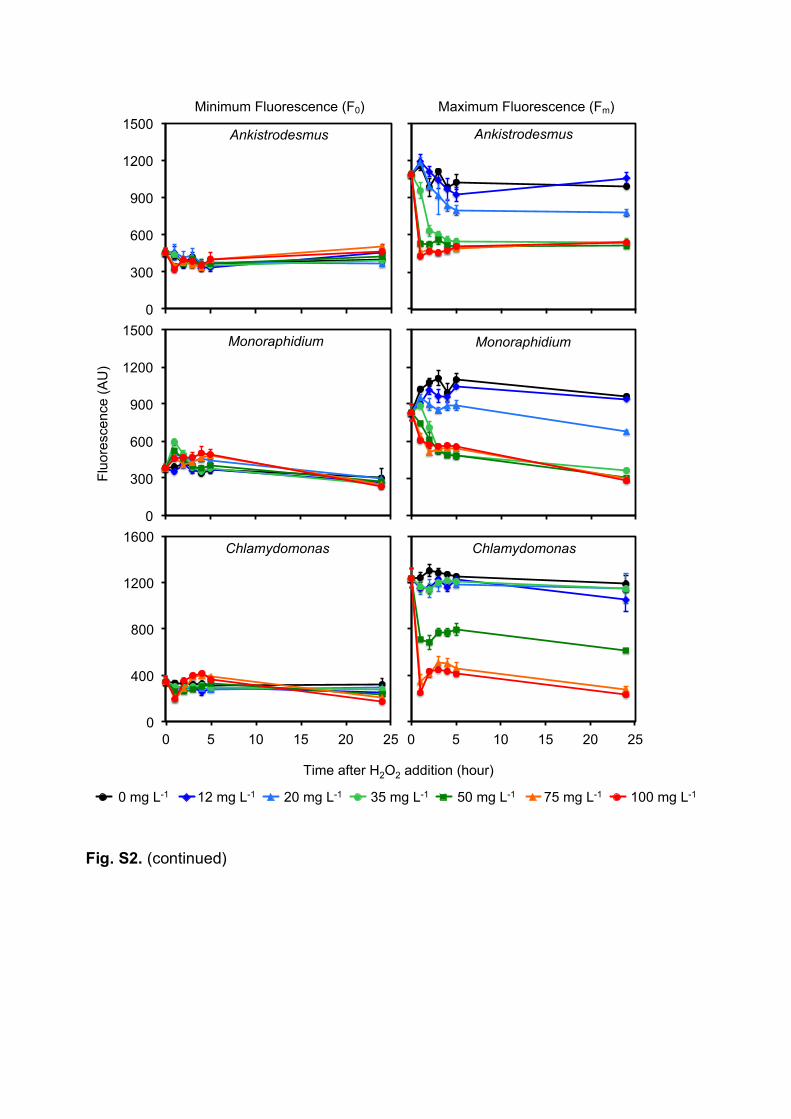
Minimum fluorescence (F0) Maximum fluorescence (Fm)
Fig. S2. Minimum Fluorescence (F0) and maximum fluorescence (Fm) in monocultures of
six species of fresh-water green algae: Chlorella sorokiniana SAG 211-8k, Desmodesmus
armatus SAG 276-4e, Kirchneriella contorta SAG 11.81, Ankistrodesmus falcatus SAG
202-9, Monoraphidium graffithii SAG 202-13 and Chlamydomonas reinhardtii SAG 77.81,
after addition of different H2O2 concentrations.
0 mg L-1 12 mg L-1 20 mg L-1 35 mg L-1 50 mg L-1 75 mg L-1 100 mg L-1
Ankistrodesmus
0
300
600
900
1200
1500 Ankistrodesmus
Monoraphidium
0
300
600
900
1200
1500 Monoraphidium
0 5 10 15 20 25
Chlamydomonas
0
400
800
1200
1600
0 5 10 15 20 25
Chlamydomonas
Time after H2O2 addition (hour)
Flu
ores
cenc
e (A
U)
Minimum Fluorescence (F0) Maximum Fluorescence (Fm)
Fig. S2. (continued)
spent medium Chlorella b
0 1 2 3
spent medium Microcystis d
0
5
10
15
20 a lysate Chlorella
0
5
10
15
20
0 1 2 3
c lysate Microcystis
H2O
2 con
cent
ratio
n (m
g L-
1 )
Time after H2O2 addition (hours)
2.5 (mg/l) 5 (mg/l) 10 (mg/l) 15 (mg/l) 20 (mg/l) 2.5 mg L-1 20 mg L-15 mg L-1 10 mg L-1 15 mg L-1
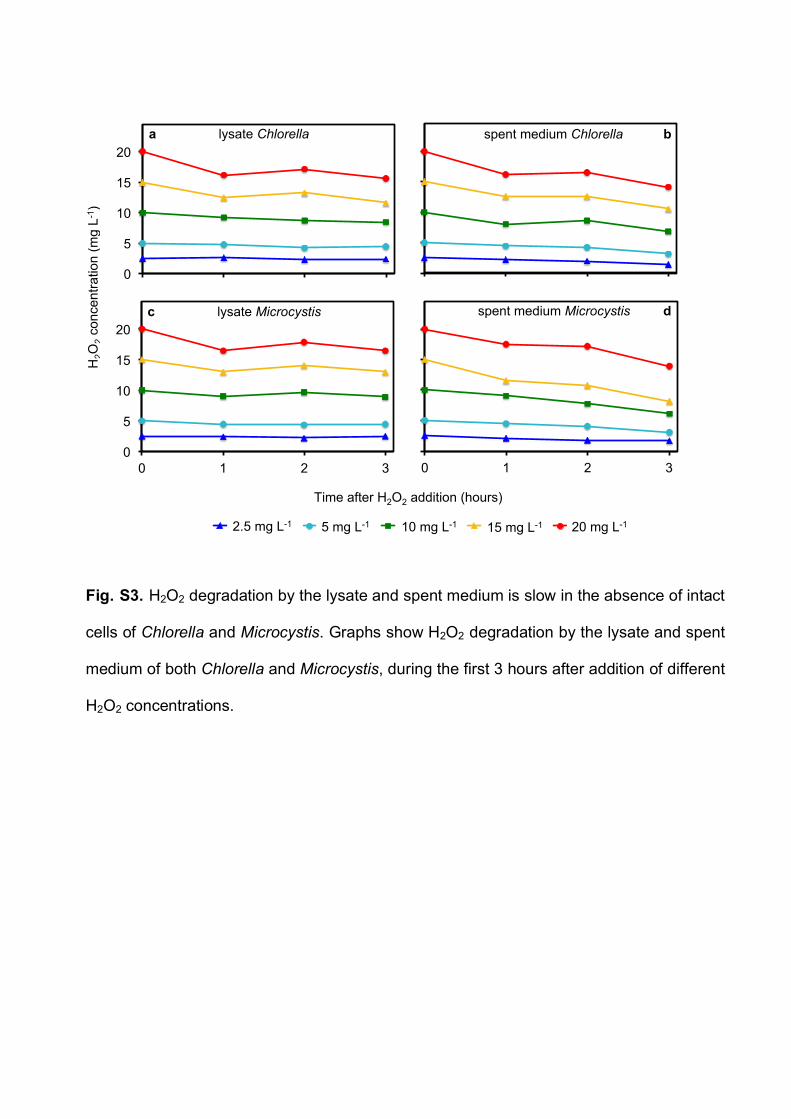
Fig. S3. H2O2 degradation by the lysate and spent medium is slow in the absence of intact
cells of Chlorella and Microcystis. Graphs show H2O2 degradation by the lysate and spent
medium of both Chlorella and Microcystis, during the first 3 hours after addition of different
H2O2 concentrations.