
INTERROGATORIES OF VULNERABLE ENERGY CONSUMERS COALITION€¦ · interrogatories of vulnerable...
257
Toronto Hydro-Electric System Limited EB-2009-0139 Exhibit R1 Tab 11 Schedule 1 Filed: 2009 Nov 30 Page 1 of 6 INTERROGATORIES OF VULNERABLE ENERGY CONSUMERS COALITION Witness Panel(s): 1 INTERROGATORY 1: 1 Reference(s): Exhibit B1 Tab 14 Schedule1 2 3 a) Please provide a Schedule with THESL’s actual reliability indices for the period 2006 4 to 2008 (SAIDI, SAIFI and CAIDI, with and without LoS and MEDs.) 5 b) Provide an analysis and assessment of trends in reliability. 6 c) Indicate which parts of the system has the worst reliability, by providing the 2006- 7 2008 relevant SAIDI and CI indices for Transformers, underground and overhead. 8 Discuss the result. 9 10 RESPONSE: 11 a) 12 Service Reliability Indicators Performance Measures (with Loss of Supply but including Major Event Days) 2006 2007 2008 Actual Actual Actual SAIDI (number of hours of interruption per customer) 1.57 1.95 1.24 SAIFI (number of interruptions per customer) 2.17 2.28 1.76 CAIDI (number of hours per interruption) 0.72 0.86 0.70 13 Service Reliability Indicators Performance Measures (with Loss of Supply but excluding Major Event Days) 2006 2007 2008 Actual Actual Actual SAIDI (number of hours of interruption per customer) 1.24 1.35 1.24 SAIFI (number of interruptions per customer) 2.06 2.01 1.76 CAIDI (number of hours per interruption) 0.60 0.67 0.70 14
-
Upload
hoangquynh -
Category
Documents
-
view
229 -
download
1
Transcript of INTERROGATORIES OF VULNERABLE ENERGY CONSUMERS COALITION€¦ · interrogatories of vulnerable...
Toronto Hydro-Electric System Limited EB-2009-0139
Exhibit R1 Tab 11
Schedule 1 Filed: 2009 Nov 30
Page 1 of 6
INTERROGATORIES OF VULNERABLE ENERGY CONSUMERS COALITION
Witness Panel(s): 1
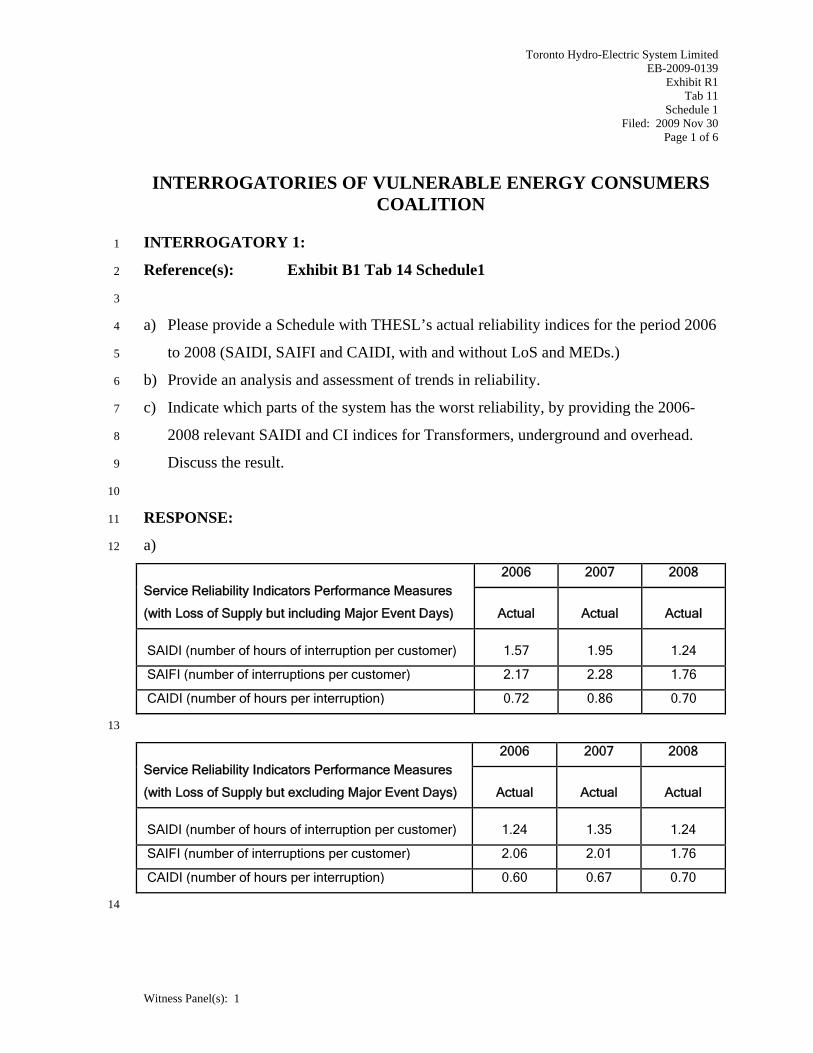
INTERROGATORY 1: 1
Reference(s): Exhibit B1 Tab 14 Schedule1 2
3
a) Please provide a Schedule with THESL’s actual reliability indices for the period 2006 4
to 2008 (SAIDI, SAIFI and CAIDI, with and without LoS and MEDs.) 5
b) Provide an analysis and assessment of trends in reliability. 6
c) Indicate which parts of the system has the worst reliability, by providing the 2006-7
2008 relevant SAIDI and CI indices for Transformers, underground and overhead. 8
Discuss the result. 9
10
RESPONSE: 11
a) 12
Service Reliability Indicators Performance Measures
(with Loss of Supply but including Major Event Days)
2006 2007 2008
Actual Actual Actual
SAIDI (number of hours of interruption per customer) 1.57 1.95 1.24
SAIFI (number of interruptions per customer) 2.17 2.28 1.76
CAIDI (number of hours per interruption) 0.72 0.86 0.70
13
Service Reliability Indicators Performance Measures
(with Loss of Supply but excluding Major Event Days)
2006 2007 2008
Actual Actual Actual
SAIDI (number of hours of interruption per customer) 1.24 1.35 1.24
SAIFI (number of interruptions per customer) 2.06 2.01 1.76
CAIDI (number of hours per interruption) 0.60 0.67 0.70
14
Toronto Hydro-Electric System Limited EB-2009-0139
Exhibit R1 Tab 11
Schedule 1 Filed: 2009 Nov 30
Page 2 of 6
INTERROGATORIES OF VULNERABLE ENERGY CONSUMERS COALITION
Witness Panel(s): 1
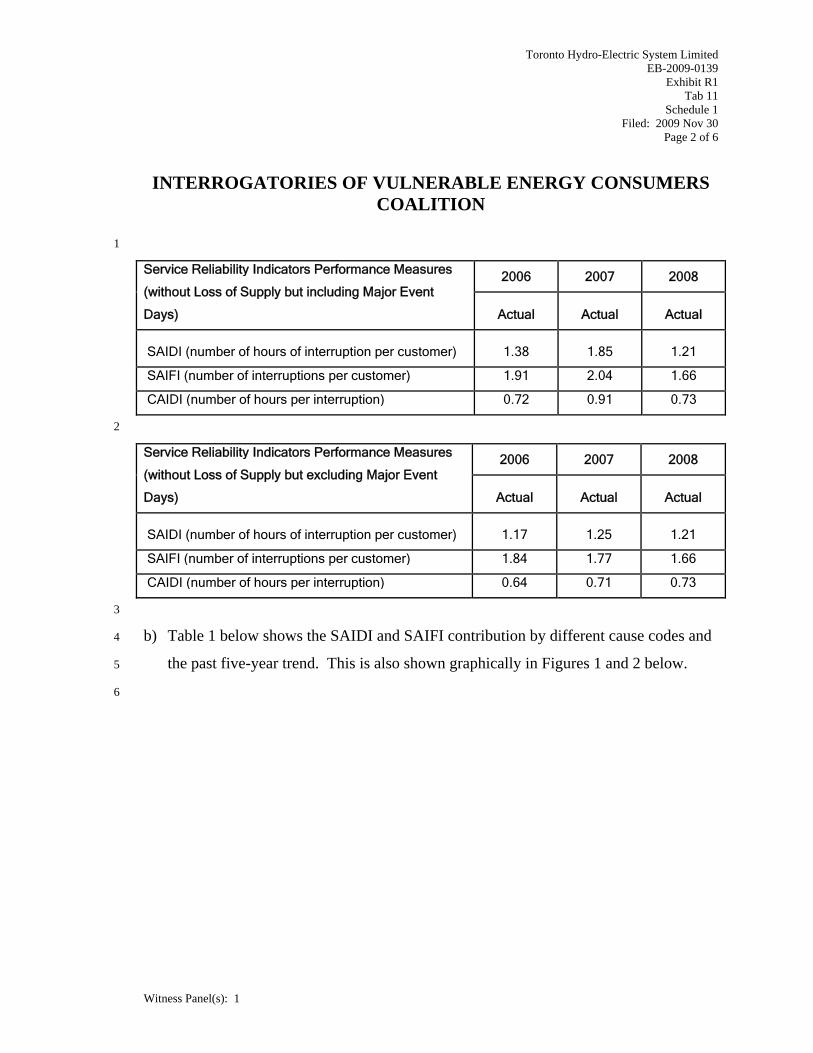
1
Service Reliability Indicators Performance Measures
(without Loss of Supply but including Major Event
Days)
2006 2007 2008
Actual Actual Actual
SAIDI (number of hours of interruption per customer) 1.38 1.85 1.21
SAIFI (number of interruptions per customer) 1.91 2.04 1.66
CAIDI (number of hours per interruption) 0.72 0.91 0.73
2
Service Reliability Indicators Performance Measures
(without Loss of Supply but excluding Major Event
Days)
2006 2007 2008
Actual Actual Actual
SAIDI (number of hours of interruption per customer) 1.17 1.25 1.21
SAIFI (number of interruptions per customer) 1.84 1.77 1.66
CAIDI (number of hours per interruption) 0.64 0.71 0.73
3
b) Table 1 below shows the SAIDI and SAIFI contribution by different cause codes and 4
the past five-year trend. This is also shown graphically in Figures 1 and 2 below. 5
6
Toronto Hydro-Electric System Limited EB-2009-0139
Exhibit R1 Tab 11
Schedule 1 Filed: 2009 Nov 30
Page 3 of 6
INTERROGATORIES OF VULNERABLE ENERGY CONSUMERS COALITION
Witness Panel(s): 1
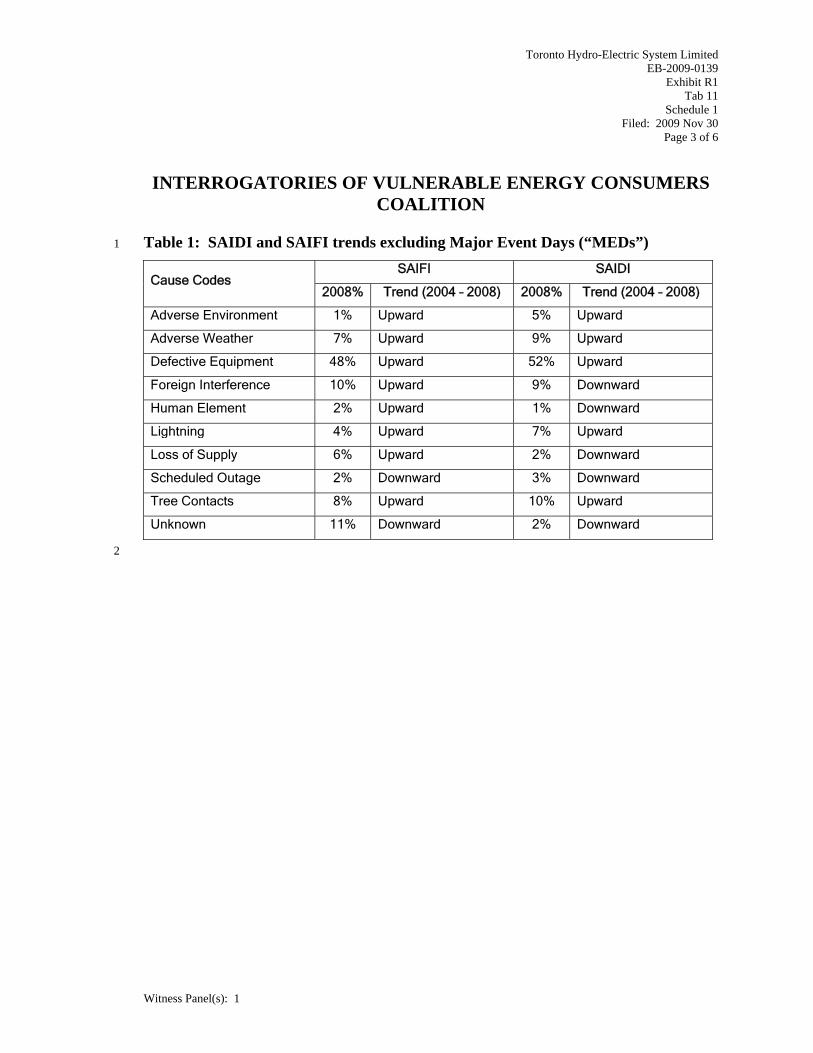
Table 1: SAIDI and SAIFI trends excluding Major Event Days (“MEDs”) 1
Cause Codes SAIFI SAIDI
2008% Trend (2004 – 2008) 2008% Trend (2004 – 2008)
Adverse Environment 1% Upward 5% Upward
Adverse Weather 7% Upward 9% Upward
Defective Equipment 48% Upward 52% Upward
Foreign Interference 10% Upward 9% Downward
Human Element 2% Upward 1% Downward
Lightning 4% Upward 7% Upward
Loss of Supply 6% Upward 2% Downward
Scheduled Outage 2% Downward 3% Downward
Tree Contacts 8% Upward 10% Upward
Unknown 11% Downward 2% Downward
2
Toronto Hydro-Electric System Limited EB-2009-0139
Exhibit R1 Tab 11
Schedule 1 Filed: 2009 Nov 30
Page 4 of 6
INTERROGATORIES OF VULNERABLE ENERGY CONSUMERS COALITION
Witness Panel(s): 1
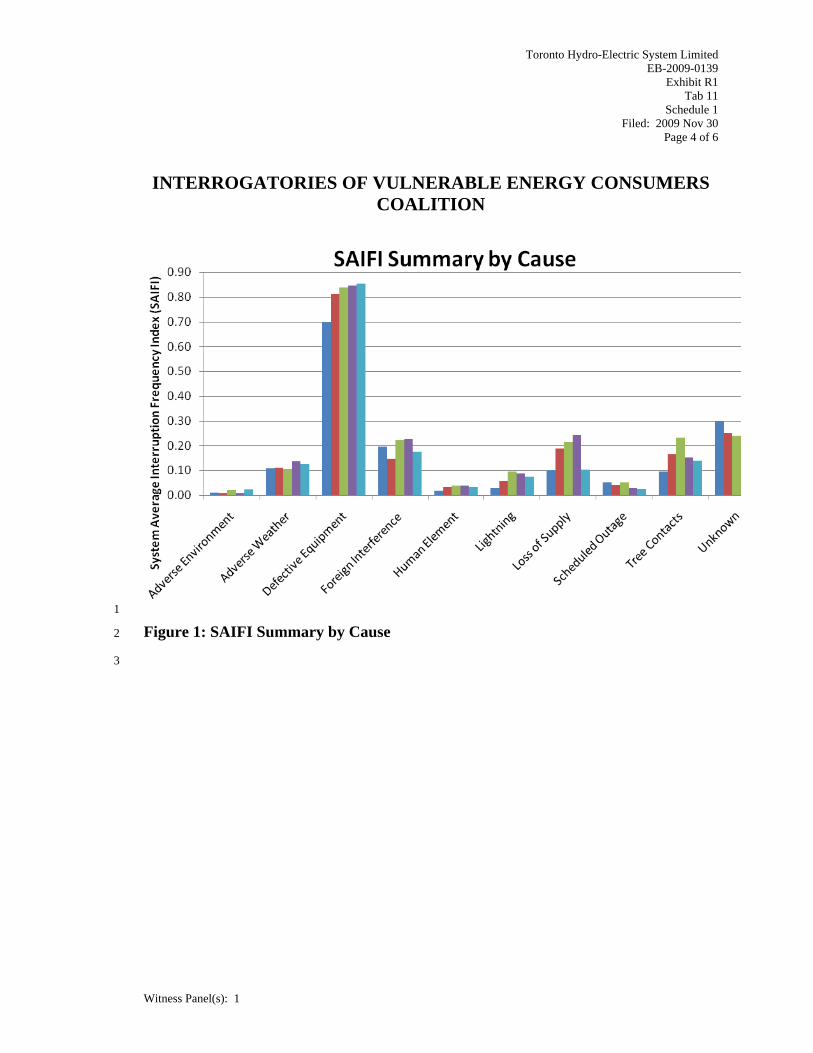
1
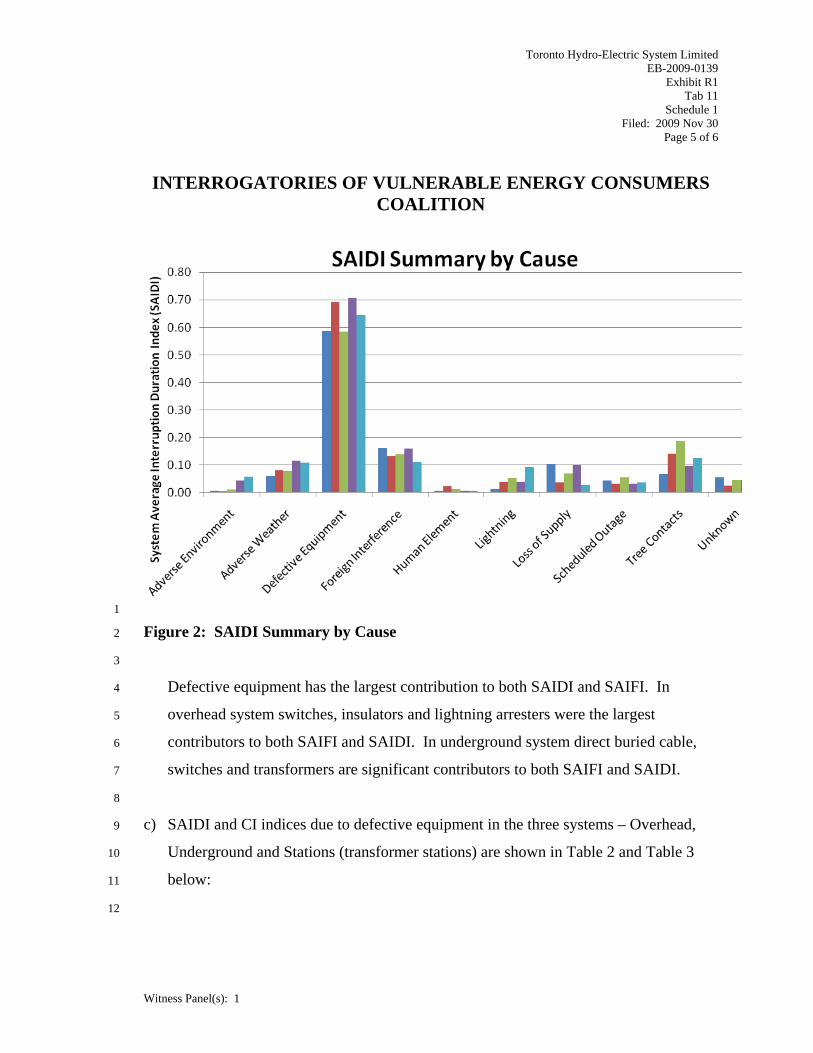
Figure 1: SAIFI Summary by Cause 2
3
Toronto Hydro-Electric System Limited EB-2009-0139
Exhibit R1 Tab 11
Schedule 1 Filed: 2009 Nov 30
Page 5 of 6
INTERROGATORIES OF VULNERABLE ENERGY CONSUMERS COALITION
Witness Panel(s): 1
1
Figure 2: SAIDI Summary by Cause 2
3
Defective equipment has the largest contribution to both SAIDI and SAIFI. In 4
overhead system switches, insulators and lightning arresters were the largest 5
contributors to both SAIFI and SAIDI. In underground system direct buried cable, 6
switches and transformers are significant contributors to both SAIFI and SAIDI. 7
8
c) SAIDI and CI indices due to defective equipment in the three systems – Overhead, 9
Underground and Stations (transformer stations) are shown in Table 2 and Table 3 10
below: 11
12
Toronto Hydro-Electric System Limited EB-2009-0139
Exhibit R1 Tab 11
Schedule 1 Filed: 2009 Nov 30
Page 6 of 6
INTERROGATORIES OF VULNERABLE ENERGY CONSUMERS COALITION
Witness Panel(s): 1
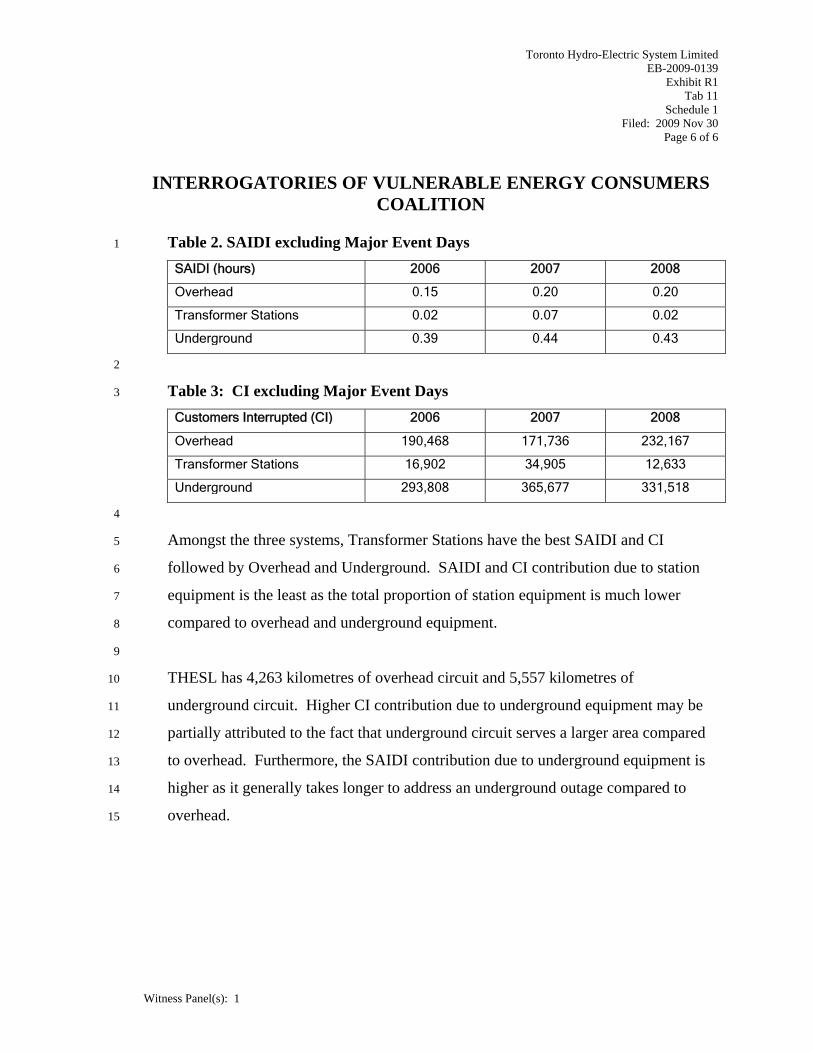
Table 2. SAIDI excluding Major Event Days 1
SAIDI (hours) 2006 2007 2008
Overhead 0.15 0.20 0.20
Transformer Stations 0.02 0.07 0.02
Underground 0.39 0.44 0.43
2
Table 3: CI excluding Major Event Days 3
Customers Interrupted (CI) 2006 2007 2008
Overhead 190,468 171,736 232,167
Transformer Stations 16,902 34,905 12,633
Underground 293,808 365,677 331,518
4
Amongst the three systems, Transformer Stations have the best SAIDI and CI 5
followed by Overhead and Underground. SAIDI and CI contribution due to station 6
equipment is the least as the total proportion of station equipment is much lower 7
compared to overhead and underground equipment. 8
9
THESL has 4,263 kilometres of overhead circuit and 5,557 kilometres of 10
underground circuit. Higher CI contribution due to underground equipment may be 11
partially attributed to the fact that underground circuit serves a larger area compared 12
to overhead. Furthermore, the SAIDI contribution due to underground equipment is 13
higher as it generally takes longer to address an underground outage compared to 14
overhead. 15

Toronto Hydro-Electric System Limited EB-2009-0139
Exhibit R1 Tab 11
Schedule 2 Filed: 2009 Nov 30
Page 1 of 1
INTERROGATORIES OF VULNERABLE ENERGY CONSUMERS COALITION
Witness Panel(s): 1
INTERROGATORY 2: 1
Reference(s): Exhibit C1Tab 2 Schedule 1 Page 1 2
Exhibit C1Tab 2 Schedule 2 Page 1 3
4
“THESL takes the view that the substance of any shared services study that it might now 5
perform has been so reduced that it would no longer be of any significant value to the 6
Board, stakeholders, or THESL, and that any costs so undertaken would be arguably 7
imprudent.” 8
a) Provide a copy of the Board’s reply to Mr. Couillard’s June 15, 2009 Letter. 9
b) Provide a comparison of the size of THESLs 2009 and 2010 Shared Services Budget 10
compared to other regulated utilities including Hydro One. 11
c) How many OEB regulated distributors have a formal shared services cost allocation 12
model. Provide a list and estimated size of shared services budget. 13
14
RESPONSE: 15
a) THESL provided rationale for not completing the Shared Services study in its June 16
15, 2009 letter and requested a response in writing from the Board if the rationale was 17
unacceptable. THESL did not receive a response to its June 15, 2009 letter from the 18
Board. 19
20
b) THESL does not have this information.. 21
22
c) THESL does not have this information.. 23
Toronto Hydro-Electric System Limited EB-2009-0139
Exhibit R1 Tab 11
Schedule 3 Filed: 2009 Nov 30
Page 1 of 2
INTERROGATORIES OF VULNERABLE ENERGY CONSUMERS COALITION
Witness Panel(s): 1
INTERROGATORY 3: 1
Reference(s): Exhibit C1 Tab 3 Schedule 1Page 1 and Appendix A and 2
Appendix B 3
4
a) Given the change in governance at THC/THESL provide an estimate of the reduction 5
in The Governance Responsibility Centre cost paid by THESL to THC for 2010. 6
b) In Appendix A clarify whether the 2008 Historical column is the Board Approved or 7
the 2008 Historical Actual. 8
c) If the latter provide the Board-Approved 2008 and provide a variance explanation. 9
d) In Appendix B Clarify whether the 2008 Historical is the Board Approved or the 10
2008 Historical Actual. 11
e) If the latter provide the Board-Approved 2008 and provide a variance explanation. 12
f) Provide more details of positions/functions and related costs repatriated from THC to 13
THESL in 2009/ 2010. Ensure the costs add/reconcile to the difference between 2009 14
Bridge and 2010 costs. 15
16
RESPONSE: 17
a) The amount paid by THESL to THC for the Governance Responsibility in 2010 will 18
be reduced by $160,000. In addition, THESL’s governance costs will be reduced by 19
$790,000. These changes are shown in Appendix A. 20
21
b) The historical column presents the actual 2008 amounts. 22
23
c) The Board approved a total OM&A amount and not specific OM&A amounts for cost 24
categories. Please see page 38, paragraph 1 of the Board’s Decision in EB-2007-25
0680. 26
Toronto Hydro-Electric System Limited EB-2009-0139
Exhibit R1 Tab 11
Schedule 3 Filed: 2009 Nov 30
Page 2 of 2
INTERROGATORIES OF VULNERABLE ENERGY CONSUMERS COALITION
Witness Panel(s): 1
1
d) The historical column presents the actual 2008 amounts. 2
3
e) The Board-approved a total amount for controllable expenses and not specific 4
OM&A amounts. Please see page 38, paragraph 1 of the Board’s Decision in EB-5
2007-0680. 6
7
f) As described in Exhibit C1, Tab 3, Schedule 1, the balance of 33 staff members in 8
Finance, Organizational Effectiveness, Legal Services and certain other areas will be 9
transferred to THESL in 2010. Within the Finance area, the functions of corporate 10
financial reporting, business planning, financial planning and reporting, corporate tax, 11
and internal audit will move to THESL in 2010. Within the Organizational 12
Effectiveness area, the functions of strategic direction and leadership will move to 13
THESL in 2010. Within the Legal area, the functions of legal strategic direction, 14
leadership and services will move to THESL in 2010. Within the Communications 15
area, the functions of strategic direction, leadership and external communication will 16
move to THESL in 2010. Lastly, within the EHS area, the functions of strategic and 17
direction and leadership will move to THESL in 2010. Please see Appendix B of this 18
Schedule reconciling the difference between the 2009 Bridge and 2010 costs. 19
IR:�VECC�3a
SummaryTHC THESL Total
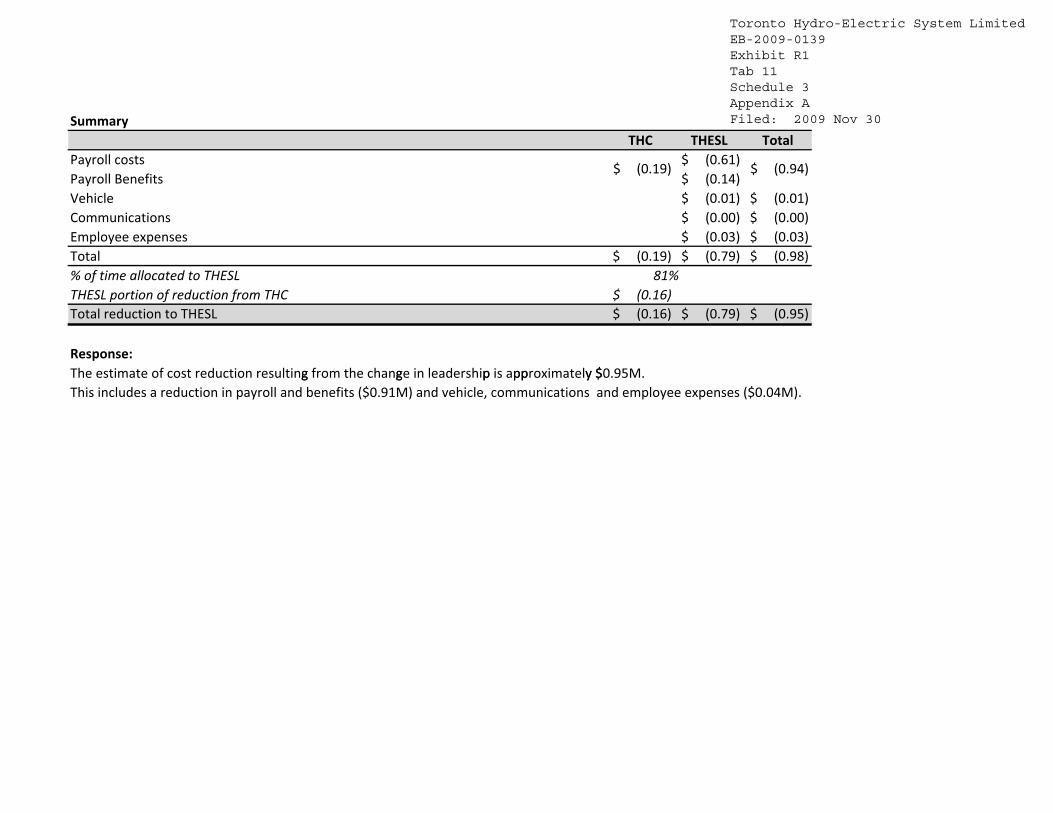
Payroll�costs (0.61)$�����Payroll�Benefits (0.14)$�����Vehicle (0.01)$����� (0.01)$�����Communications (0.00)$����� (0.00)$�����Employee�expenses (0.03)$����� (0.03)$�����Total (0.19)$������ (0.79)$����� (0.98)$�����%�of�time allocated to THESL 81%THESL�portion�of�reduction�from�THC (0.16)$�����Total�reduction�to�THESL (0.16)$������ (0.79)$����� (0.95)$�����
Response:
(0.19)$������ (0.94)$������
The�estimate�of�cost�reduction�resulting�from�the�change�in�leadership�is�approximately�$0.95M.
SS�THESL�Gov�rt�Revised�2009�11�27�AJ.xlsx��Summary1
This�includes�a�reduction�in�payroll�and�benefits�($0.91M)�and�vehicle,�communications �and�employee�expenses�($0.04M).g g p pp y $
SS�THESL�Gov�rt�Revised�2009�11�27�AJ.xlsx��Summary11/27/2009���5:34�PM
Toronto Hydro-Electric System LimitedEB-2009-0139Exhibit R1Tab 11Schedule 3Appendix AFiled: 2009 Nov 30
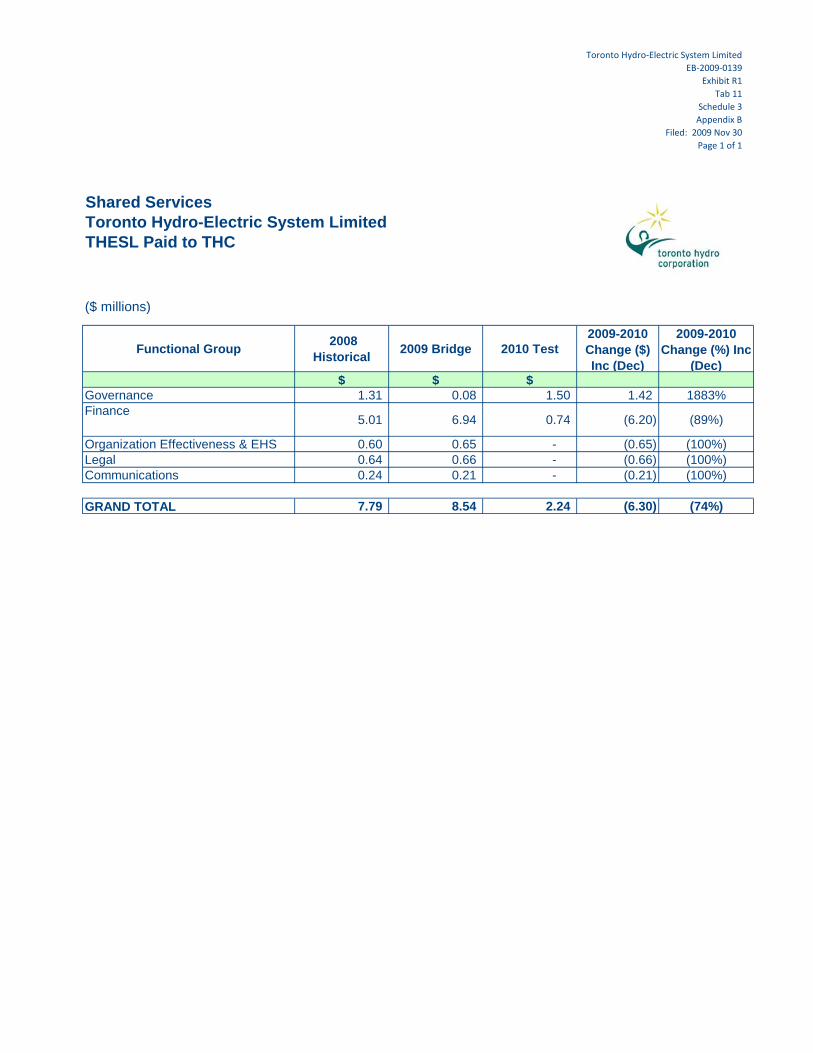
Toronto Hydro‐Electric System LimitedEB‐2009‐0139
Exhibit R1Tab 11
Schedule 3Appendix B
Filed: 2009 Nov 30Page 1 of 1
Shared Services Toronto Hydro-Electric System LimitedTHESL Paid to THC
($ millions)
Functional Group 2008 Historical 2009 Bridge 2010 Test
2009-2010 Change ($) Inc (Dec)
2009-2010 Change (%) Inc
(Dec)$ $ $
Governance 1.31 0.08 1.50 1.42 1883%Finance
5.01 6.94 0.74 (6.20) (89%)
Organization Effectiveness & EHS 0.60 0.65 - (0.65) (100%)Legal 0.64 0.66 - (0.66) (100%)Communications 0.24 0.21 - (0.21) (100%)
GRAND TOTAL 7.79 8.54 2.24 (6.30) (74%)
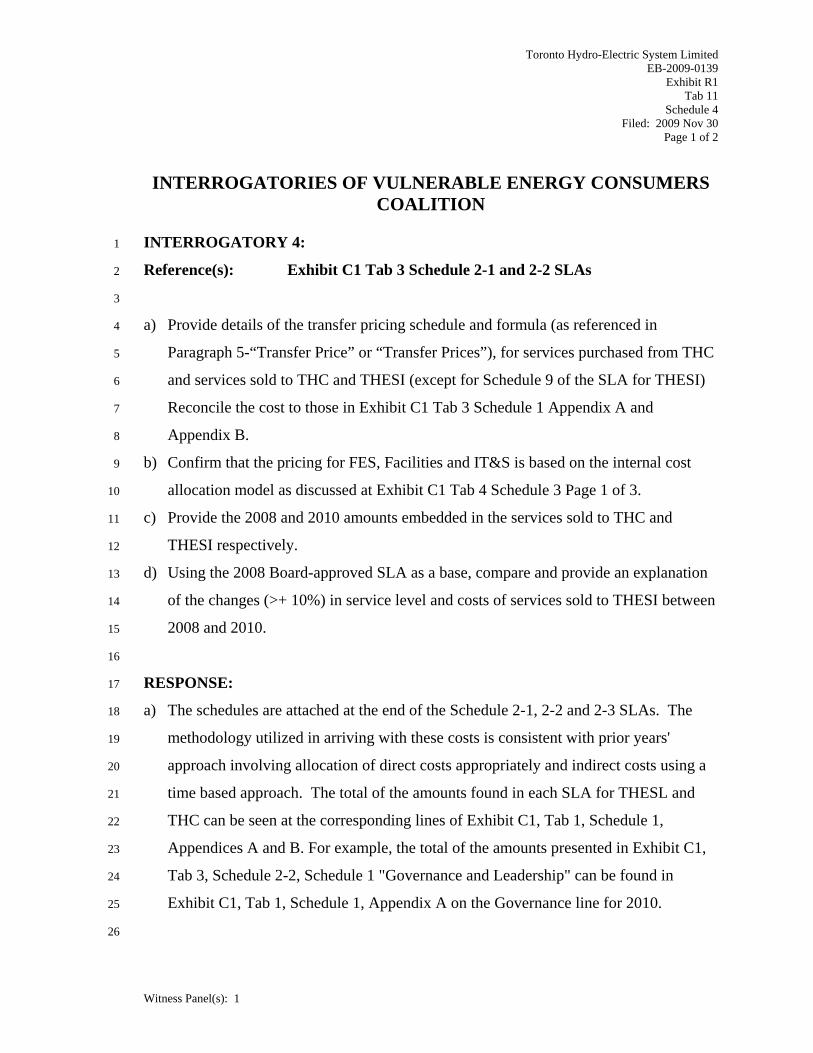
Toronto Hydro-Electric System Limited EB-2009-0139
Exhibit R1 Tab 11
Schedule 4 Filed: 2009 Nov 30
Page 1 of 2
INTERROGATORIES OF VULNERABLE ENERGY CONSUMERS COALITION
Witness Panel(s): 1
INTERROGATORY 4: 1
Reference(s): Exhibit C1 Tab 3 Schedule 2-1 and 2-2 SLAs 2
3
a) Provide details of the transfer pricing schedule and formula (as referenced in 4
Paragraph 5-“Transfer Price” or “Transfer Prices”), for services purchased from THC 5
and services sold to THC and THESI (except for Schedule 9 of the SLA for THESI) 6
Reconcile the cost to those in Exhibit C1 Tab 3 Schedule 1 Appendix A and 7
Appendix B. 8
b) Confirm that the pricing for FES, Facilities and IT&S is based on the internal cost 9
allocation model as discussed at Exhibit C1 Tab 4 Schedule 3 Page 1 of 3. 10
c) Provide the 2008 and 2010 amounts embedded in the services sold to THC and 11
THESI respectively. 12
d) Using the 2008 Board-approved SLA as a base, compare and provide an explanation 13
of the changes (>+ 10%) in service level and costs of services sold to THESI between 14
2008 and 2010. 15
16
RESPONSE: 17
a) The schedules are attached at the end of the Schedule 2-1, 2-2 and 2-3 SLAs. The 18
methodology utilized in arriving with these costs is consistent with prior years' 19
approach involving allocation of direct costs appropriately and indirect costs using a 20
time based approach. The total of the amounts found in each SLA for THESL and 21
THC can be seen at the corresponding lines of Exhibit C1, Tab 1, Schedule 1, 22
Appendices A and B. For example, the total of the amounts presented in Exhibit C1, 23
Tab 3, Schedule 2-2, Schedule 1 "Governance and Leadership" can be found in 24
Exhibit C1, Tab 1, Schedule 1, Appendix A on the Governance line for 2010. 25
26
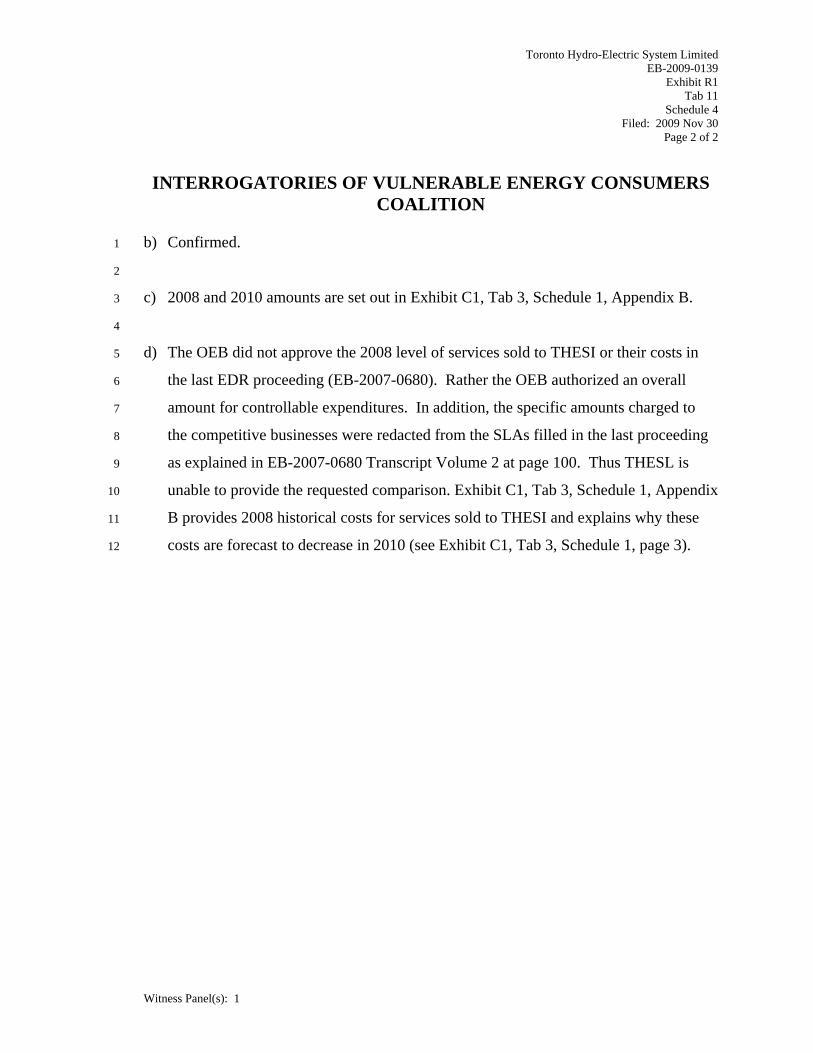
Toronto Hydro-Electric System Limited EB-2009-0139
Exhibit R1 Tab 11
Schedule 4 Filed: 2009 Nov 30
Page 2 of 2
INTERROGATORIES OF VULNERABLE ENERGY CONSUMERS COALITION
Witness Panel(s): 1
b) Confirmed. 1
2
c) 2008 and 2010 amounts are set out in Exhibit C1, Tab 3, Schedule 1, Appendix B. 3
4
d) The OEB did not approve the 2008 level of services sold to THESI or their costs in 5
the last EDR proceeding (EB-2007-0680). Rather the OEB authorized an overall 6
amount for controllable expenditures. In addition, the specific amounts charged to 7
the competitive businesses were redacted from the SLAs filled in the last proceeding 8
as explained in EB-2007-0680 Transcript Volume 2 at page 100. Thus THESL is 9
unable to provide the requested comparison. Exhibit C1, Tab 3, Schedule 1, Appendix 10
B provides 2008 historical costs for services sold to THESI and explains why these 11
costs are forecast to decrease in 2010 (see Exhibit C1, Tab 3, Schedule 1, page 3). 12
Toronto Hydro-Electric System Limited EB-2009-0139
Exhibit R1 Tab 11
Schedule 5 Filed: 2009 Nov 30
Page 1 of 1
INTERROGATORIES OF VULNERABLE ENERGY CONSUMERS COALITION
Witness Panel(s): 1
INTERROGATORY 5: 1
Reference(s): Exhibit C1 Tab 3 Schedule 3 2
3
a) Provide a Version of Schedule 3 that extracts information from the SLAs to add two 4
cost columns “2008 Board Approved” and “2010 Test” to each service. Add in 2008 5
services that are discontinued in 2010 as necessary. 6
b) Ensure the costs reconcile the cost to those in Exhibit C1 Tab 3 Schedule 1 Appendix 7
A and Appendix B. 8
c) Provide a variance report for all service for those costs in 2010 that are higher or 9
lower (+ 10%) in 2010 compared to 2008 (except discontinued services). 10
11
RESPONSE: 12
a) Please see attached Schedule A, which provides the requested information. 13
14
b) THESL has confirmed that the amounts reconcile. Please note that THESL will be 15
filing a revised version of Exhibit C1, Tab 3, Schedule 1, Appendix A to incorporate 16
the change in THC Governance costs presented in Exhibit R1, Tab 11, Schedule 3. 17
18
c) Please see Appendix A to this Schedule. 19
Shared Services Inventory Toronto Hydro-Electric System LimitedEB-2009-0139
Exhibit R1Tab 11
Schedule 5Appendix A
Filed: 2009 Nov 30Page 1 of 1
Service Service Definition Service Provider Company
Service Receiver Company 2010 Test 2008 SLA as Filed Change 2008-2010 $ Change 2008-2010 % Notation
Stewardship & Leadership - CEO Provide strategic direction, leadership and communication to the organization. THC THESL $1,420,897.00 $785,784.00 $635,113.00 81%
A higher percentage of costs are allocated to THESL
since virtually all staff and operations have moved from
THC to THESL.
Governance - Board of Directors Provide strategic direction, leadership and communication to the organization. THC THESL $80,000.00 $74,875.00 $5,125.00 7% Immaterial Change.
Finance - StewardshipProvide strategic direction, leadership and communication to the Finance group and the organization.
THC THESL $742,137.00 $226,410.00 $515,727.00 228%
A higher percentage of costs are allocated to THESL
since virtually all staff have moved from THC to THESL
and that THTI no longer exists.
Finance-DiscontinuedCorporate Financial Planning, Business Planning, Financial Planning & Reporting, Corporate Tax, Internal Audit and Internal Control Certification.
THC THESL $0.00 $3,991,825.00 -$3,991,825.00 -100%Discontinued due to
reorganization from THC to THESL in 2010.
Legal-Discontinued Legal Services, Legal Strategic Direction & Leadership THC THESL $0.00 $696,074.00 -$696,074.00 -100%Discontinued due to
reorganization from THC to THESL in 2010.
Communications-Discontinued External Communications, Strategic Direction, Leadership & Communications THC THESL $0.00 $169,805.00 -$169,805.00 -100%
Discontinued due to reorganization from THC to
THESL in 2010.
Environmental Health Safety-Discontinued Strategic Direction & Leadership THC THESL $0.00 $409,823.00 -$409,823.00 -100%Discontinued due to
reorganization from THC to THESL in 2010.
Organizational Effectiveness-Discontinued Strategic Direction & Leadership THC THESL $0.00 $622,240.00 -$622,240.00 -100%Discontinued due to
reorganization from THC to THESL in 2010.
IT-Management Services
Maintain and implement "Ellipse" and "Hyperion" based IT infrastructure, such as enterprise systems, enterprise database and enterprise storage needs and that they are separated and yet incorporated as part of of Enterprise IT Infrastructure.
THESL THC $29,460.00 $351,007.00 -$321,547.00 -92%
Cost reduced accordingly due to employee transfer
from THC to THESL, in 2010.
Facilities
Occupancy charges for various types of space. Operation & Maintenance, Real Estate, Human & Environmental Factors, Planning and Project Management, Manage Facility Function, Quality Assessment & Innovation, Investment Recovery
THESL THC $77,879.00 $486,336.00 -$408,457.00 -84%
Cost reduced accordingly due to employee transfer
from THC to THESL, in 2010.
Toronto Hydro-Electric System Limited EB-2009-0139
Exhibit R1 Tab 11
Schedule 6 Filed: 2009 Nov 30
Page 1 of 1
INTERROGATORIES OF VULNERABLE ENERGY CONSUMERS COALITION
Witness Panel(s): 1
INTERROGATORY 6: 1
Reference(s): Exhibit C1 Tab4 Schedule 1 Appendix B and Schedule 2 2
Appendix B 3
4
a) Provide the date of the Controllers Memo. 5
b) Will THESL update the Conference Board of Canada Report (Exhibit C1 Tab4 6
Schedule 2 Appendix B) used as the basis of the 2010 2.3% inflation forecast? If so 7
when will this be filed? 8
c) What is the OEB inflation factor for 2010 used with the Cost of Capital projection for 9
distributors? 10
11
RESPONSE: 12
a) The memo at Exhibit C1, Tab 4, Schedule 1, Appendix B was distributed in early 13
August 2009. The process as described in the memo was verbally communicated to 14
all executives at the beginning of the planning cycle (April 2009) and further 15
communicated to operational coordinators via a cross-functional planning team that 16
meet regularly through the planning cycle. The process was not significantly changed 17
from prior years. 18
19
b) Please see response to Board Staff interrogatory #4. 20
21
c) While the request is unclear, VECC appears to be seeking the inflation factor to be 22
used in the 2010 IRM model for those LDCs applying for rates based on the IRM 23
mechanism. This figure will not be available until early 2010. 24
Toronto Hydro-Electric System Limited EB-2009-0139
Exhibit R1 Tab 11
Schedule 7 Filed: 2009 Nov 30
Page 1 of 7
INTERROGATORIES OF VULNERABLE ENERGY CONSUMERS COALITION
Witness Panel(s): 3
INTERROGATORY 7: 1
Reference(s): Exhibit C2 Tab 3 Schedule 3 Page 9 of 11and Table 1 2
Exhibit C2 Tab3 Schedule 1 Appendix A 3
4
a) Provide a schedule that provides the major elements of the $41.3 million increase in 5
Civil Construction services. 6
b) How much of this work was tendered? Provide the # tenders and Aggregate amount 7
including the largest tender. 8
c) Provide the duration, name(s) and Costs of the Contract(s) for tree trimming. Explain 9
in terms of contract labour rates ($/hour) and accomplishment (feeder km) why there 10
was no increase in costs over 2008 in 2009 but there is a $400,000 or 13% increase in 11
2010? 12
d) Provide the list of bidders and summary of the winning bid for the new Contact 13
Voltage Scanning service. If Sole Source, provide a copy of the Sole Source 14
justification form F as required under Procurement Policy Sole Source Exception 15
paragraph b) and documentation regarding the date this was approved by the 16
Procurement Department 17
e) Explain in detail from the contract terms the basis of how the Scanning contractor’s 18
costs are charged- for example $ per day per truck/crew flat rate or $ /scan/km etc. 19
Show the build up to the $4 million contract cost in 2010. 20
21

Toronto Hydro-Electric System Limited EB-2009-0139
Exhibit R1 Tab 11
Schedule 7 Filed: 2009 Nov 30
Page 2 of 7
INTERROGATORIES OF VULNERABLE ENERGY CONSUMERS COALITION
Witness Panel(s): 3
RESPONSE: 1
a) The increased budget for New Portfolios, Downtown Contingency, and Externally 2
Initiated Plant Contingency is needed for new energy system needs and changing 3
customer demands, as well as the continuing effort to modernize assets in order to be 4
an industry leader in customer satisfaction. The 2010 budget is made up as follows: 5
Toronto Hydro-Electric System Limited EB-2009-0139
Exhibit R1 Tab 11
Schedule 7 Filed: 2009 Nov 30
Page 3 of 7
INTERROGATORIES OF VULNERABLE ENERGY CONSUMERS COALITION
Witness Panel(s): 3
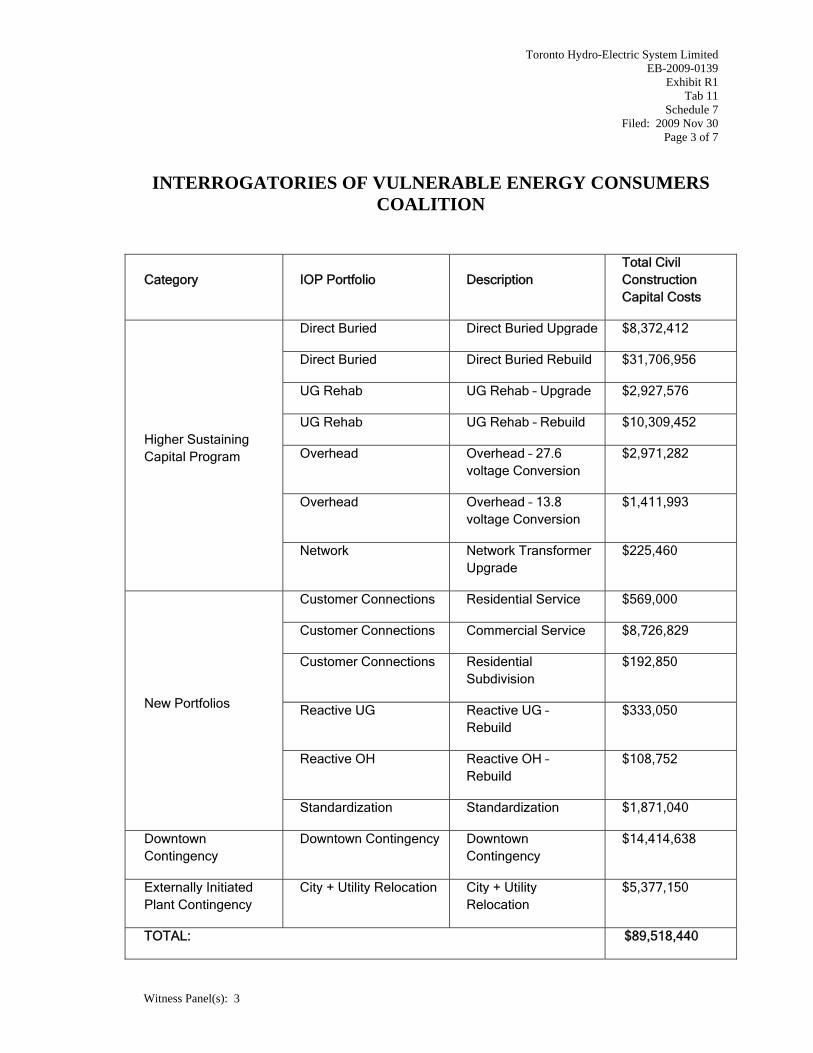
Category IOP Portfolio Description Total Civil Construction Capital Costs
Higher Sustaining Capital Program
Direct Buried Direct Buried Upgrade $8,372,412
Direct Buried Direct Buried Rebuild $31,706,956
UG Rehab UG Rehab – Upgrade $2,927,576
UG Rehab UG Rehab – Rebuild $10,309,452
Overhead Overhead – 27.6 voltage Conversion
$2,971,282
Overhead Overhead – 13.8 voltage Conversion
$1,411,993
Network Network Transformer Upgrade
$225,460
New Portfolios
Customer Connections Residential Service $569,000
Customer Connections Commercial Service $8,726,829
Customer Connections Residential Subdivision
$192,850
Reactive UG Reactive UG –Rebuild
$333,050
Reactive OH Reactive OH –Rebuild
$108,752
Standardization Standardization $1,871,040
Downtown Contingency
Downtown Contingency Downtown Contingency
$14,414,638
Externally Initiated Plant Contingency
City + Utility Relocation City + Utility Relocation
$5,377,150
TOTAL: $89,518,440
Toronto Hydro-Electric System Limited EB-2009-0139
Exhibit R1 Tab 11
Schedule 7 Filed: 2009 Nov 30
Page 4 of 7
INTERROGATORIES OF VULNERABLE ENERGY CONSUMERS COALITION
Witness Panel(s): 3
1
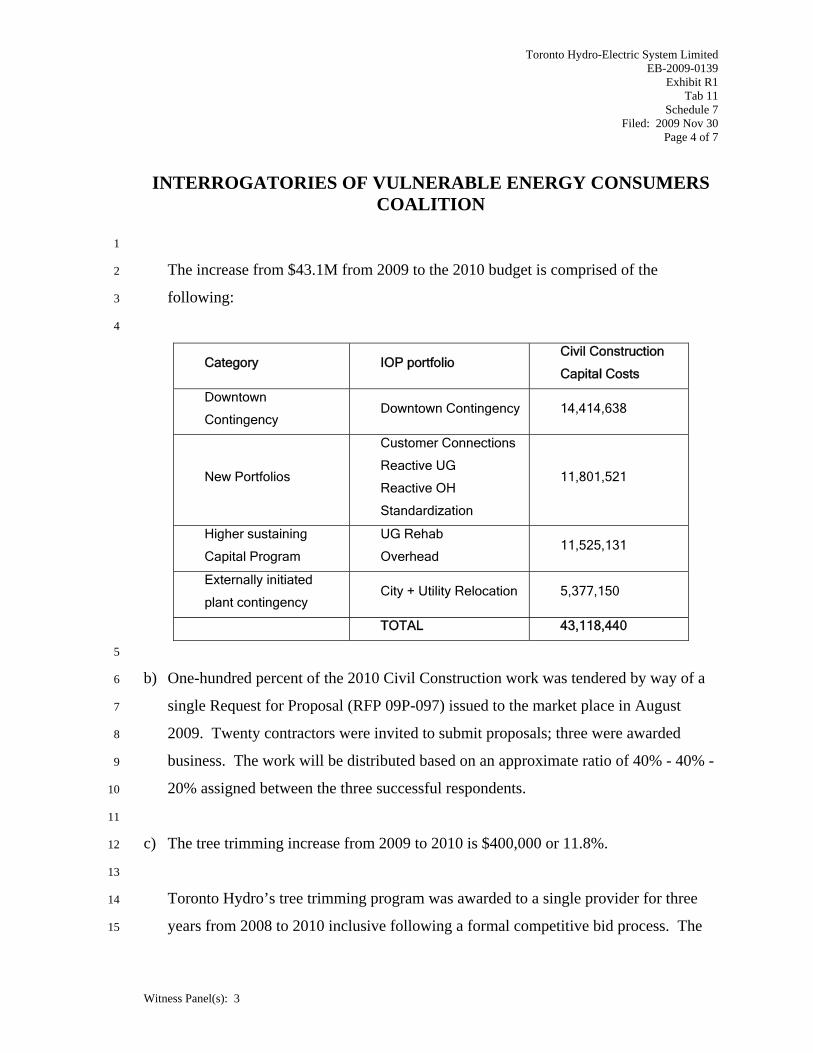
The increase from $43.1M from 2009 to the 2010 budget is comprised of the 2
following: 3
4
Category IOP portfolio Civil Construction
Capital Costs
Downtown
Contingency Downtown Contingency 14,414,638
New Portfolios
Customer Connections
Reactive UG
Reactive OH
Standardization
11,801,521
Higher sustaining
Capital Program
UG Rehab
Overhead 11,525,131
Externally initiated
plant contingency City + Utility Relocation 5,377,150
TOTAL 43,118,440
5
b) One-hundred percent of the 2010 Civil Construction work was tendered by way of a 6
single Request for Proposal (RFP 09P-097) issued to the market place in August 7
2009. Twenty contractors were invited to submit proposals; three were awarded 8
business. The work will be distributed based on an approximate ratio of 40% - 40% - 9
20% assigned between the three successful respondents. 10
11
c) The tree trimming increase from 2009 to 2010 is $400,000 or 11.8%. 12
13
Toronto Hydro’s tree trimming program was awarded to a single provider for three 14
years from 2008 to 2010 inclusive following a formal competitive bid process. The 15

Toronto Hydro-Electric System Limited EB-2009-0139
Exhibit R1 Tab 11
Schedule 7 Filed: 2009 Nov 30
Page 5 of 7
INTERROGATORIES OF VULNERABLE ENERGY CONSUMERS COALITION
Witness Panel(s): 3
price for each year’s tree trimming program was submitted by bidders after field 1
survey of all feeders proposed for trimming on a three-year contract. The cost of the 2
tree trimming contract is determined by more than the contract labour rates and the 3
accomplishment (feeder km). With the adoption of reliability based tree trimming 4
program using Davies Consulting Inc’s (“DCI”) Tree Trimming Model (“TTM”) in 5
2008, Toronto Hydro has also implemented an additional proactive initiative, aimed 6
to improve reliability, in which tree branches found above power conductors that are 7
normally outside the scope of tree trimming work will also be maintained during 8
regular pruning work. This reduces the chance of limbs breaking and falling on OH 9
lines during stormy weather. Depending on the type and size of trees along the 10
trimming route, the requirement for this tree storm hardening varies from tree to tree 11
and may result in variations in amount of work between calendar years. 12
13
As a result, although the distance of trimming remained virtually the same between 14
2008 and 2009, the amount of tree-related storm hardening requirement in 2009 is 15
projected to be less as compared to 2008, which offsets the annual labour rate 16
increase. 17
18
There is a cost increase of $400,000 from 2009 to 2010 because of significant feeder 19
km increase as called for by the TTM and general average labour rate increase. (Due 20
to the confidentiality of the agreements established with its suppliers Toronto Hydro 21
is unable to include contract labour rates in this response.) The following table shows 22
the feeder kilometres for 2008 to 2010: 23
24 2008 2009 2010
Circuit km 1,512 1,522 1,638
25
Toronto Hydro-Electric System Limited EB-2009-0139
Exhibit R1 Tab 11
Schedule 7 Filed: 2009 Nov 30
Page 6 of 7
INTERROGATORIES OF VULNERABLE ENERGY CONSUMERS COALITION
Witness Panel(s): 3
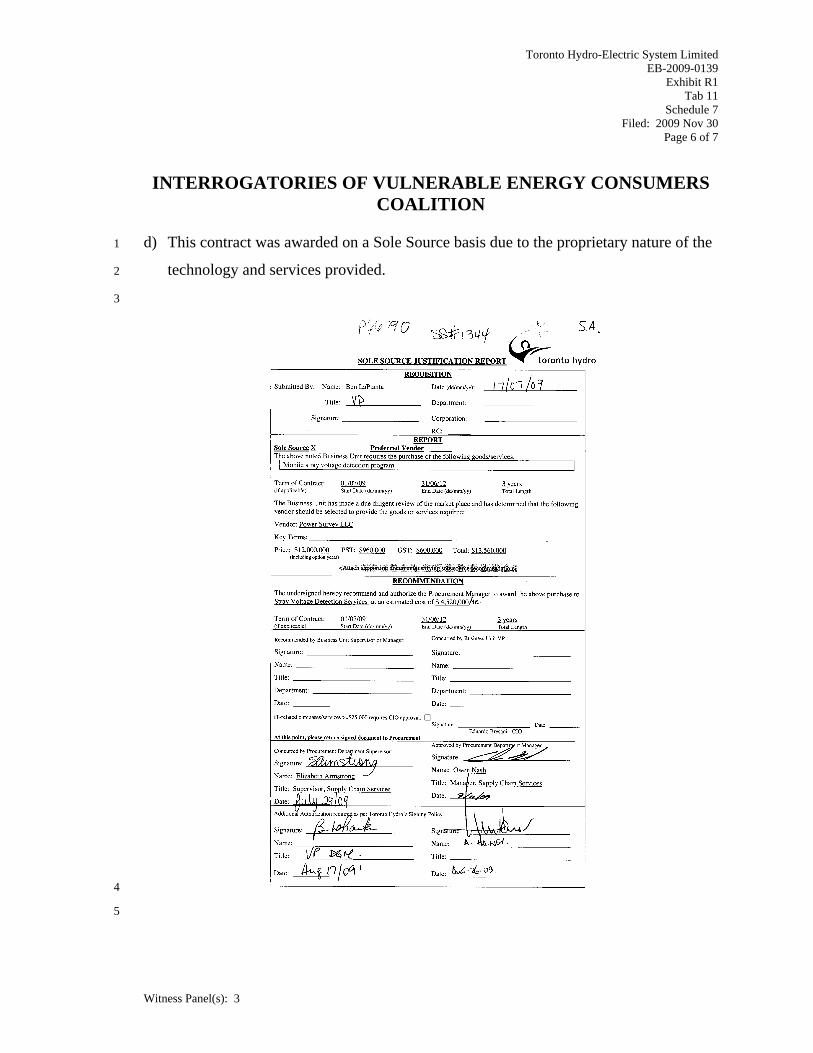
d) This contract was awarded on a Sole Source basis due to the proprietary nature of the 1
technology and services provided. 2
3
4
5
Toronto Hydro-Electric System Limited EB-2009-0139
Exhibit R1 Tab 11
Schedule 7 Filed: 2009 Nov 30
Page 7 of 7
INTERROGATORIES OF VULNERABLE ENERGY CONSUMERS COALITION
Witness Panel(s): 3
e) Proposed Mobile Stray Voltage Detection Program Includes: 1
• An aggregate of 40 hours per week of stray voltage scanning utilizing SVD2000 2
systems and crews each working 8 hours per night in Toronto Hydro territory 3
• 3 SVD2000 systems (September 1 – March 31). 4
• 1 SVD2000 system (April 1 – August 31) 5
• 24 hour / 7day dispatch team to coordinate efforts between Power Survey field 6
crews and Toronto Hydro 7
• Full-time client manager 8
• Full-time data manager 9
• Highly trained PSC senior stray voltage technicians 10
• Data storage 11
• GPS and paper map recording and storage 12
• Customizable daily program reports 13
• Quarterly and semi-annual summary reports 14
• Quality control technician(s) 15
• Monthly QA reports 16
• Use of professional engineering services 17
18
The Power Survey Company costs are charged on a lump-sum basis for the provision 19
of these services on a yearly basis. 20

Toronto Hydro-Electric System Limited EB-2009-0139
Exhibit R1 Tab 11
Schedule 8 Filed: 2009 Nov 30
Page 1 of 2
INTERROGATORIES OF VULNERABLE ENERGY CONSUMERS COALITION
Witness Panel(s): 4
INTERROGATORY 8: 1
Reference(s): Exhibit C2 Tab 4 Schedule 2 Tables1 and 2 and Pages4-5 2
3
a) Provide the historical Bridge and 2010 fleet operating costs broken down between 4
fuel insurance and maintenance. 5
b) Provide details of the fleet fuel costs for 2008, 2009 and projected 2010 6
i. Total Costs 7
ii. Average $/litre (Liquid fuels and equivalent for gaseous fuels) 8
iii. # km of travel and or hours of use 9
iv. Fleet Average fuel cost per vehicle and per km 10
c) Explain why average fuel use and costs per vehicle would not decrease in 2010 given 11
the change to more fuel efficient vehicles? 12
d) Explain the increase in Fleet Capital expenditure 2008-2010 based on the actual and 13
projected number of 14
i. Retirements/replacements 15
ii. Increase in vehicle fleet 16
iii. Average cost of new/replacement vehicles 17
e) Provide a list of executive and staff vehicles – type and age. Indicate which are 18
personal/dedicated and which are general fleet. 19
20
RESPONSE: 21
a) See Table 1 below 22
Table 1 2008 2009 2010
Vehicle Fuel $1.9M $1.9M $2M
Vehicle Insurance $280K $301K $420K
MAINT $7.2M $9.7M $9.8M 23

Toronto Hydro-Electric System Limited EB-2009-0139
Exhibit R1 Tab 11
Schedule 8 Filed: 2009 Nov 30
Page 2 of 2
INTERROGATORIES OF VULNERABLE ENERGY CONSUMERS COALITION
Witness Panel(s): 4
b) THESL tracks total fuel costs and does not track fuel consumption by mileage or per 1
vehicle. 2
• 2008 = $1.9M for 1.8M Litres fuel 3
• 2009 = $1.9M for 1.8M Litres fuel 4
• 2010 = $2.0M 5
6
c) Vehicle use has increased in line to support the increase in business requirements. 7
8
d) Fleet Capital Expenditure increases are based on increases to business requirements 9
and not directly co-related to (i), (ii) and (iii). 10
11
e) Please see Appendix A to this Schedule. 12

Toronto Hydro‐Electric System LimitedEB‐2009‐0139
Exhibit R1Tab 11
Schedule 8Appendix A
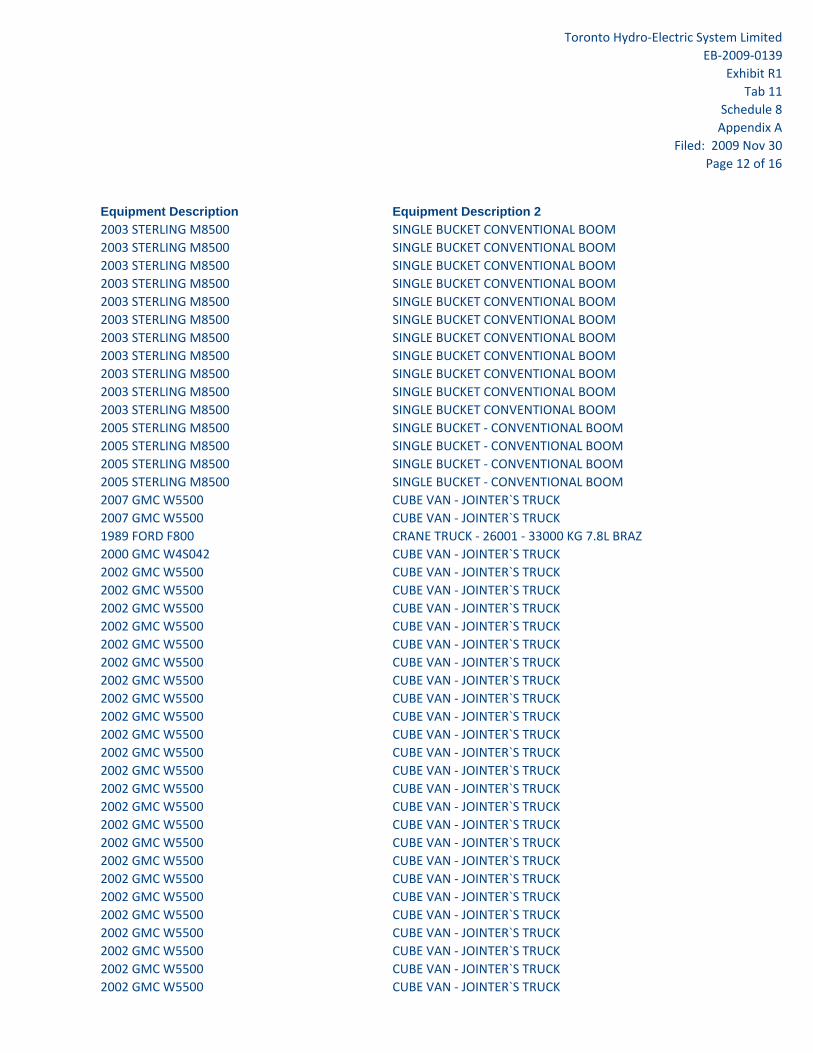
Filed: 2009 Nov 30Page 1 of 16
Equipment Description Equipment Description 22008 LEXUS RX 350 EXECUTIVE VEHICLE2007 CADILLAC CTS EXECUTIVE VEHICLE2007 LEXUS RX 350 EXECUTIVE VEHICLE2007 VOLK ELP EXECUTIVE VEHICLE2007 LEXUS IS250 EXECUTIVE VEHICLE2008 MERCEDES BENZ C350 EXECUTIVE VEHICLE2006 BMW 750I EXECUTIVE VEHICLE2008 ‐ BMW 328i EXECUTIVE VEHICLE2005 TOYOTA AVALON EXECUTIVE VEHICLE2008 CHEVY TAHOE 4WD 4‐DR HYBRID LT EXECUTIVE VEHICLE1999 FORD F450 PICKUP ‐ REGULAR CAB2004 CHEV CAVALIER 4DR SEDAN2004 CHEV CAVALIER 4DR SEDAN2006 AUDI A6 4.2L EXECUTIVE VEHICLE2007 LEXUS IS 350 EXECUTIVE VEHICLE2007 ACURA MDX EXECUTIVE VEHICLE2007 LEXUS IS 250 AWD EXECUTIVE VEHICLE2007 ACURA 3.2 TLS EXECUTIVE VEHICLE2007 Lincoln MKX EXECUTIVE VEHICLE2007 NISSAN MAXIMA SE EXECUTIVE VEHICLE2008 DODGE CALIBER 4DR SEDAN2008 DODGE CALIBER 4DR SEDAN2008 DODGE CALIBER 4DR SEDAN2008 DODGE CALIBER 4DR SEDAN2008 DODGE CALIBER 4DR SEDAN2008 DODGE CALIBER 4DR SEDAN2008 DODGE CALIBER 4DR SEDAN2008 DODGE CALIBER 4DR SEDAN2008 DODGE CALIBER 4DR SEDAN2008 DODGE CALIBER 4DR SEDAN2008 DODGE CALIBER 4DR SEDAN2008 DODGE CALIBER 4DR SEDAN2008 DODGE CALIBER 4DR SEDAN2008 DODGE CALIBER 4DR SEDAN2009 FORD FOCUS ‐ AUTOMATIC TRANSAXLE 4DR SEDAN2009 FORD FOCUS ‐ AUTOMATIC TRANSAXLE 4DR SEDAN2001 CHEV SILVERADO 1500 FULLSIZE EXTENDED CAB PICKUP2000 CHEV C2500 FULLSIZE EXTENDED CAB PICKUP2000 CHEV C2500 FULLSIZE EXTENDED CAB PICKUP2000 CHEV C2500 FULLSIZE EXTENDED CAB PICKUP2000 CHEV C2500 FULLSIZE REGULAR CAB PICKUP2000 CHEV C2500 FULLSIZE EXTENDED CAB PICKUP2000 CHEV C2500 FULLSIZE REGULAR CAB PICKUP

Toronto Hydro‐Electric System LimitedEB‐2009‐0139
Exhibit R1Tab 11
Schedule 8Appendix A
Filed: 2009 Nov 30Page 2 of 16
Equipment Description Equipment Description 22000 CHEV C2500 FULLSIZE REGULAR CAB PICKUP2000 CHEV C2500 FULLSIZE EXTENDED CAB PICKUP2002 CHEV CAVALIER COMPACT CAR2000 CHEV C2500 FULLSIZE REGULAR CAB PICKUP2000 CHEV C2500 FULLSIZE REGULAR CAB PICKUP2000 CHEV C2500 FULLSIZE REGULAR CAB PICKUP2007 CHEV SILVERADO FULL SIZE ‐ PICK UP FULL SIZE VAN2007 CHEV SILVERADO FULL SIZE ‐ PICK UP2007 CHEV SILVERADO FULL SIZE ‐ PICK UP FULL SIZE VAN2007 CHEV SILVERADO FULL SIZE ‐ PICK UP FULL SIZE VAN2007 CHEV SILVERADO FULL SIZE ‐ PICK UP FULL SIZE VAN2007 CHEV SILVERADO FULL SIZE ‐ PICK UP FULL SIZE VAN2007 CHEV SILVERADO FULL SIZE ‐ PICK UP FULL SIZE VAN2007 CHEV SILVERADO FULL SIZE ‐ PICK UP FULL SIZE VAN2007 CHEV SILVERADO 25 FULLSIZE EXTENDED CAB PICKUP2007 CHEV SILVERADO 25 FULLSIZE EXTENDED CAB PICKUP2007 CHEV SILVERADO 25 FULLSIZE EXTENDED CAB PICKUP2007 Dodge Model 1500 4x4 FULL SIZE ‐ PICK UP2009 DODGE 1500 RAM PICKUP 4 DR EXTENDED CAB PICKUP1999 FORD F450 FULLSIZE PICKUP W UTILITY BODY1999 FORD F450 FULLSIZE PICKUP W UTILITY BODY1999 FORD F450 FULLSIZE PICKUP W UTILITY BODY2003 DODGE 3500 FULL SIZE VAN2003 DODGE 3500 FULL SIZE VAN2003 DODGE 3500 FULL SIZE VAN2003 DODGE 3500 FULL SIZE VAN2003 DODGE 3500 FULL SIZE VAN2003 DODGE 3500 FULL SIZE VAN1992 FORD F800 SINGLE BUCKET ‐ CONVENTIONAL BOOM2003 DODGE 3500 FULL SIZE VAN2003 DODGE 3500 FULL SIZE VAN2003 DODGE 3500 FULL SIZE VAN2003 DODGE 3500 FULL SIZE VAN2003 DODGE 3500 FULL SIZE VAN2003 DODGE 3500 FULL SIZE VAN2005 FORD E350 FULL SIZE VAN2005 FORD E350 FULL SIZE PASSENGER VAN2006 FORD E350 FULL SIZE VAN2008 FORD ECONOLINE E2 FULL SIZE VAN2008 FORD ECONOLINE E2 FULL SIZE VAN2009 FORD ECONOLINE E2 FULL SIZE VAN2009 FORD ECONOLINE E2 FULL SIZE VAN2003 FORD E350 FULL SIZE VAN

Toronto Hydro‐Electric System LimitedEB‐2009‐0139
Exhibit R1Tab 11
Schedule 8Appendix A
Filed: 2009 Nov 30Page 3 of 16
Equipment Description Equipment Description 22003 FORD E350 FULL SIZE VAN2003 FORD E350 FULL SIZE VAN1996 DODGE B250 FULL SIZE ‐ CARGO VAN2000 CHEV G2500 FULLSIZE CARGO VAN2003 FORD F150 FULL SIZE REGULAR CAB PICK UP2003 FORD F150 FULL SIZE REGULAR CAB PICK UP2003 FORD F150 FULL SIZE REGULAR CAB PICK UP2003 FORD F150 FULL SIZE REGULAR CAB PICK UP2003 FORD F150 FULL SIZE REGULAR CAB PICK UP2008 FORD F150 FULL SIZE REGULAR CAB PICK UP2008 FORD F150 FULL SIZE REGULAR CAB PICK UP2009 FORD E150 FULL SIZE ‐ CARGO VAN2008 CHEVROLET UPLANDER PASSENGER MINIVAN2008 CHEVROLET UPLANDER PASSENGER MINIVAN2008 CHEVROLET UPLANDER PASSENGER MINIVAN2008 CHEVROLET UPLANDER PASSENGER MINIVAN2008 CHEVROLET UPLANDER PASSENGER MINIVAN2008 CHEVROLET UPLANDER PASSENGER MINIVAN2008 CHEV UPLANDER EXT.WB.4‐DR CARGO MINI VAN2008 CHEV UPLANDER EXT.WB.4‐DR CARGO MINI VAN2008 CHEV UPLANDER EXT.WB.4‐DR CARGO MINI VAN2008 CHEV UPLANDER EXT.WB.4‐DR CARGO MINI VAN2008 CHEV UPLANDER EXT.WB.4‐DR CARGO MINI VAN2008 CHEV UPLANDER EXT.WB.4‐DR CARGO MINI VAN2008 CHEV UPLANDER EXT.WB.4‐DR CARGO MINI VAN2008 CHEV UPLANDER EXT.WB.4‐DR CARGO MINI VAN2008 CHEV UPLANDER EXT.WB.4‐DR CARGO MINI VAN2008 CHEV UPLANDER EXT.WB.4‐DR CARGO MINI VAN2008 CHEV UPLANDER EXT.WB.4‐DR CARGO MINI VAN2007 FORD F450 LINE TRUCK W/ STAKE BODY ‐ FLEET SERVICE2008 CHEV UPLANDER EXT.WB.4‐DR CARGO MINI VAN2008 CHEV UPLANDER EXT.WB.4‐DR CARGO MINI VAN1996 FORD F450 LINE TRUCK W/ STAKE BODY ‐ FLEET SERVICE1995 FORD E150 FULL SIZE ‐ CARGO VAN2000 FORD E350 CREW/CARGO VAN1991 NAVISTAR 4900 DOUBLE BUCKET ‐ 51` ‐ 64` REACH2002 STERLING M7500 SINGLE BUCKET1996 NAVISTAR 4700 DOUBLE BUCKET ‐ 50` ‐ MATERIAL HANDLER2005 STERLING M8500 SINGLE BUCKET CONVENTIONAL BOOM2005 STERLING M8500 SINGLE BUCKET CONVENTIONAL BOOM2003 STERLING M8500 SINGLE BUCKET CONVENTIONAL BOOM2003 STERLING M8500 SINGLE BUCKET CONVENTIONAL BOOM2006 STERLING M8500 SINGLE BUCKET CONVENTIONAL BOOM

Toronto Hydro‐Electric System LimitedEB‐2009‐0139
Exhibit R1Tab 11
Schedule 8Appendix A
Filed: 2009 Nov 30Page 4 of 16
Equipment Description Equipment Description 22006 STERLING M8500 SINGLE BUCKET CONVENTIONAL BOOM2007 STERLING M8500 DOUBLE BUCKET CONVENTIONAL BOOM2007 STERLING M8500 DOUBLE BUCKET CONVENTIONAL BOOM2005 STERLING M8500 SINGLE BUCKET CONVENTIONAL BOOM2006 INTERNATIONAL 4400 SINGLE BUCKET ‐ CONVENTIONAL BOOM2006 INTERNATIONAL 4400 SINGLE BUCKET ‐ CONVENTIONAL BOOM2006 INTERNATIONAL 4400 SINGLE BUCKET ‐ CONVENTIONAL BOOM2006 INTERNATIONAL 4400 SINGLE BUCKET ‐ CONVENTIONAL BOOM2006 INTERNATIONAL 4400 SINGLE BUCKET ‐ CONVENTIONAL BOOM2007 STERLING M8500 SINGLE BUCKET CONVENTIONAL BOOM2007 STERLING M8500 SINGLE BUCKET CONVENTIONAL BOOM2007 STERLING M8500 SINGLE BUCKET CONVENTIONAL BOOM2007 STERLING M8500 SINGLE BUCKET CONVENTIONAL BOOM2007 STERLING M8500 SINGLE BUCKET CONVENTIONAL BOOM2007 STERLING M8500 SINGLE BUCKET CONVENTIONAL BOOM2007 STERLING M8500 SINGLE BUCKET CONVENTIONAL BOOM2007 STERLING M8500 SINGLE BUCKET CONVENTIONAL BOOM2007 STERLING M8500 SINGLE BUCKET CONVENTIONAL BOOM2007 STERLING M8500 SINGLE BUCKET CONVENTIONAL BOOM2007 STERLING M8500 SINGLE BUCKET CONVENTIONAL BOOM2007 STERLING M8500 SINGLE BUCKET CONVENTIONAL BOOM2007 STERLING M8500 SINGLE BUCKET CONVENTIONAL BOOM2007 STERLING M8500 SINGLE BUCKET CONVENTIONAL BOOM2007 STERLING M8500 SINGLE BUCKET CONVENTIONAL BOOM2006 DODGE CARAVAN CARGO MINI VAN2006 DODGE CARAVAN CARGO MINI VAN2006 DODGE CARAVAN CARGO MINI VAN2006 DODGE CARAVAN CARGO MINI VAN2006 DODGE CARAVAN CARGO MINI VAN2006 DODGE CARAVAN CARGO MINI VAN2006 DODGE CARAVAN CARGO MINI VAN2006 DODGE CARAVAN CARGO MINI VAN2007 DODGE CARAVAN CARGO MINI VAN2007 DODGE CARAVAN CARGO MINI VAN1998 FORD E250 CARGO (MINI) VAN2007 DODGE CARAVAN CARGO MINI VAN2007 DODGE CARAVAN CARGO MINI VAN2007 DODGE CARAVAN CARGO MINI VAN2007 DODGE CARAVAN CARGO MINI VAN2007 DODGE CARAVAN CARGO MINI VAN2003 STERLING M8500 SINGLE BUCKET CONVENTIONAL BOOM2003 STERLING M8500 SINGLE BUCKET CONVENTIONAL BOOM2007 STERLING M8500 DOUBLE BUCKET ‐ 51' TO 64'

Toronto Hydro‐Electric System LimitedEB‐2009‐0139
Exhibit R1Tab 11
Schedule 8Appendix A
Filed: 2009 Nov 30Page 5 of 16
Equipment Description Equipment Description 22007 STERLING M8500 SINGLE BUCKET ‐ CONVENTIONAL BOOM2007 STERLING M8500 SINGLE BUCKET ‐ CONVENTIONAL BOOM2007 STERLING M8500 DOUBLE BUCKET ‐ 51' TO 64'2007 STERLING M8500 DOUBLE BUCKET ‐ 51' TO 64'2007 STERLING M8500 DOUBLE BUCKET ‐ 51' TO 64'2007 STERLING M8500 DOUBLE BUCKET ‐ 51' TO 64'2007 STERLING M8500 SINGLE BUCKET ‐ CONVENTIONAL BOOM2007 STERLING M8500 SINGLE BUCKET ‐ CONVENTIONAL BOOM2007 STERLING M8500 DOUBLE BUCKET ‐ 51' TO 64'2007 STERLING M8500 SINGLE BUCKET ‐ CONVENTIONAL BOOM1998 FORD E250 FULL SIZE ‐ CARGO VAN2007 STERLING M8500 DOUBLE BUCKET ‐ 51' TO 64'1999 FORD E350 FULL SIZE ‐ CARGO VAN1994 FREIGHTLINER FL80 DOUBLE BUCKET ‐ UP TO 50` REACH2007 GMC W5500 CUBE VAN ‐ JOINTER`S TRUCK1992 NAVISTAR 4700 CRANE TRUCK1993 NAVISTAR 4700 CRANE TRUCK1993 NAVISTAR 4900 LARGE DIGGER DERRICK (I.E. P60)1995 FORD E350 CUBE VAN1995 FORD E350 CUBE VAN1994 NAVISTAR 4900 SINGLE BUCKET ‐ CONVENTIONAL BOOM1992 NAVISTAR 4700 LINE TRUCK ‐ 10001‐16000 KG2005 INTERNATIONAL 40S LINE TRUCK 10001‐16000KG2005 GMC UNKNOWN SINGLE AXLE CONVENTIONAL CAB1992 NAVISTAR 4700 DUMP TRUCK ‐ 10001 ‐ 16000 KG1994 FREIGHTLINER FL80 SINGLE BUCKET ‐ CONVENTIONAL BOOM1994 NAVISTAR 4700 CRANE TRUCK ‐ 16001 ‐ 26000 KG1994 NAVISTAR 4700 DUMP TRUCK ‐ 10001 ‐ 16000 KG1994 NAVISTAR 4900 SINGLE BUCKET ‐ CONVENTIONAL BOOM1994 NAVISTAR 4900 SINGLE BUCKET ‐ CONVENTIONAL BOOM1994 NAVISTAR 4900 DUMP TRUCK1994 FREIGHTLINER FL80 TANDEM CABLE TRUCK2008 INTERNATIONAL MODEL 7400 6x4 TRUCK TANDEM CABLE TRUCK1992 FORD LNT 8000 TANDEM CABLE TRUCK2006 INTERNATIONAL TANDEM TRUCK TANDEM CABLE TRUCK1996 FORD F450 CUBE VAN1995 NAVISTAR 4700 SINGLE BUCKET ‐ CONVENTIONAL BOOM1995 NAVISTAR 4700 AERIAL PLATFORM TRUCK1995 NAVISTAR 4700 DUMP TRUCK1995 NAVISTAR 4700 DUMP TRUCK1995 NAVISTAR 4900 LARGE DIGGER DERRICK1995 NAVISTAR 4700 CRANE W/ KNUCKLE BOOM1995 NAVISTAR 4700 CRANE W/ KNUCKLE BOOM

Toronto Hydro‐Electric System LimitedEB‐2009‐0139
Exhibit R1Tab 11
Schedule 8Appendix A
Filed: 2009 Nov 30Page 6 of 16
Equipment Description Equipment Description 21995 NAVISTAR 4700 CRANE W/ KNUCKLE BOOM1995 FORD F350 DUMP TRUCK 10001‐16000 KG1997 FORD F450 CUBE VAN > 4600 KG1997 FORD F450 CUBE VAN > 4600 KG1998 NAVISTAR 4900 DOUBLE BUCKET ‐ UP TO 50` REACH1998 NAVISTAR 4900 SINGLE BUCKET ‐ COMVENTIONAL BOOM2006 FORD E450 CUBE VAN1999 FORD F450 CUBE VAN > 4600 KG1994 FREIGHTLINER FL80 DOUBLE BUCKET ‐ 51` ‐ 64` REACH1992 FREIGHTLINER FL80 DOUBLE BUCKET ‐ 65`+ REACH (TX5065)2009 HINO 258 # WS3078 DUMP TRUCK DUMP TRUCK1996 NAVISTAR F2‐654 DOUBLE BUCKET ‐ 51` ‐ 64` REACH1996 GMC SIERRA FULL SIZE ‐ REGULAR CAB1996 GMC 1500 FULL SIZE ‐ REGULAR CAB1996 GMC SIERRA FULL SIZE ‐ REGULAR CAB 1/2 TON1997 FORD F150 FULL SIZE ‐ REGULAR CAB1997 FORD F150 XL FULL SIZE ‐ REGULAR CAB1999 GMC TC7H042 SINGLE BUCKET‐ CONVENTIONAL BOOM2004 CHEV SILVERADO 1500 FULLSIZE EXTENDED CAB PICKUP HYBRID2005 CHEV SILVERADO 1500 FULLSIZE EXTENDED CAB PICKUP HYBRID2005 CHEV SILVERADO 1500 FULLSIZE EXTENDED CAB PICKUP HYBRID2005 CHEV SILVERADO 1500 FULLSIZE EXTENDED CAB PICKUP HYBRID2007 CHEV SILVERADO FULLSIZE EXTENDED CAB PICKUP2007 CHEV SILVERADO FULLSIZE EXTENDED CAB PICKUP2007 CHEV SILVERADO FULL SIZE ‐ PICK UP TRUCK2007 CHEV SILVERADO 1500 FULLSIZE EXTENDED CAB PICKUP2007 CHEV SILVERADO FULLSIZE EXTENDED CAB PICKUP2000 CHEV C2500 FULLSIZE REGULAR CAB PICKUP2007 CHEV SILVERADO FULLSIZE EXTENDED CAB PICKUP2007 CHEV SILVERADO FULL SIZE ‐ PICK UP FULL SIZE VAN2007 CHEV SILVERADO FULL SIZE ‐ PICK UP FULL SIZE VAN1994 DODGE DAKOTA FULL SIZE ‐ REGULAR CAB1990 WESTERN STAR 3864‐S DOUBLE BUCKET ‐ `65` + REACH1998 GMC T8500 SINGLE BUCKET‐SQUIRT BOOM2002 STERLING M7500 SINGLE BUCKET ‐ CONVENTIONAL BOOM2002 STERLING M7500 SINGLE BUCKET‐CONVENTIONAL BOOM1990 FREIGHTLINER FLC11264SD DOUBLE BUCKET ‐ 65` +REACH2002 STERLING M7500 SINGLE BUCKET ‐ CONVENTIONAL BOOM1992 FORD LTS8000 DOUBLE BUCKET ‐ `65`+ REACH2007 STERLING M8500 DOUBLE BUCKET CONVENTIONAL BOOM2007 STERLING M8500 DOUBLE BUCKET CONVENTIONAL BOOM2008 FORD E350 8T0339 VAN W/ AERIAL DEVICE2000 CHEV G3500 SCADA VAN + AERIAL DEVICE

Toronto Hydro‐Electric System LimitedEB‐2009‐0139
Exhibit R1Tab 11
Schedule 8Appendix A
Filed: 2009 Nov 30Page 7 of 16
Equipment Description Equipment Description 21997 FREIGHTLINER FL80 SINGLE BUCKET‐ CONVENTIONAL BOOM 5.9L1995 FREIGHTLINER FL80 SINGLE BUCKET ‐ CONVENTIONAL BOOM2007 STERLING M8500 SMALL DIGGER DERRICK1992 FREIGHTLINER FL80 DIGGER DERRICK2007 STERLING M8500 DIGGER DERRICK2006 ‐ STERLING M8500 SMALL DIGGER DERRICK2001 STERLING M7500 SMALL DIGGER DERRICK1992 NAVISTAR 4900 4X2 SMALL DIGGER DERRICK1992 WESTERN STAR 4864F DERRICK LARGE (I.E. P60)1993 WESTERN STAR 4864F SMALL DIGGER DERRICK1997 NAVISTAR 4900 SMALL DIGGER DERRICK2002 GMC T8500 SINGLE BUCKET ‐ SQUIRT BOOM2002 GMC T8500 SINGLE BUCKET ‐ SQUIRT BOOM2002 GMC T8500 SINGLE BUCKET ‐ SQUIRT BOOM2002 GMC T8500 SINGLE BUCKET ‐ SQUIRT BOOM2002 GMC T8500 SINGLE BUCKET ‐ SQUIRT BOOM2006 GMC T8500 SINGLE BUCKET ‐ SQUIRT BOOM2006 GMC TT8F042 SINGLE BUCKET ‐ SQUIRT BOOM2006 GMC T8500 SINGLE BUCKET ‐ SQUIRT BOOM2006 FORD E350 VAN W/ AERIAL DEVICE2007 INTERNATIONAL MODEL 4200 SINGLE BUCKET SQUIRT BOOM1996 NAVISTAR 4700 CRANE W/ KNUCKLE BOOM1996 FREIGHTLINER FL80 CRANE TRUCK W/ KNUCKLE BOOM1996 FREIGHTLINER FL80 CRANE TRUCK W/ BOOM1997 FREIGHTLINER FL80 SMALL DIGGER DERRICK1997 NAVISTAR 4700 CRANE TRUCK 10001‐16000KG2009 STERLING LT8513 CRANE TRUCK ‐ 26001‐33000 KG1997 CHEV CAVALIER COMPACT CAR2003 DODGE SX 2.0 COMPACT 4DR SEDAN2003 DODGE SX 2.0 COMPACT 4DR SEDAN2003 DODGE SX 2.0 COMPACT 4DR SEDAN2005 DODGE SX 2.0 COMPACT2005 DODGE SX 2.0 COMPACT2005 DODGE SX 2.0 COMPACT2005 DODGE SX 2.0 COMPACT2005 DODGE SX 2.0 COMPACT2005 DODGE SX 2.0 COMPACT SUB COMPACT CAR2007 TOYOTA PRIUS 4DR SEDAN HYBRID VEHICLE2001 STERLING M7500 SINGLE BUCKET2001 STERLING M7500 SINGLE BUCKET2001 STERLING M7500 SINGLE BUCKET2001 STERLING M7500 SINGLE BUCKET2001 STERLING M7500 SINGLE BUCKET

Toronto Hydro‐Electric System LimitedEB‐2009‐0139
Exhibit R1Tab 11
Schedule 8Appendix A
Filed: 2009 Nov 30Page 8 of 16
Equipment Description Equipment Description 22001 STERLING M7500 SINGLE BUCKET2001 STERLING M7500 SINGLE BUCKET2001 STERLING M7500 SINGLE BUCKET2001 STERLING M7500 SINGLE BUCKET2001 STERLING M7500 SINGLE BUCKET2001 STERLING M7500 SINGLE BUCKET2001 STERLING M7500 SINGLE BUCKET1995 FREIGHTLINER FL80 SGL BKT CONVENTIONAL BOOM AERIAL DEVICE1995 FREIGHTLINER FL80 DBL BKT ‐ 51` TO 64` REACH AERIAL DEVICE2002 Sterling M7500 SINGLE BUCKET ‐ CONVENTIONAL BOOM2002 FORD E250 FULL SIZE VAN2002 FORD E250 FULL SIZE VAN2002 FORD E250 FULL SIZE VAN2002 FORD E250 FULL SIZE VAN2002 FORD E250 FULL SIZE VAN2002 FORD E250 FULL SIZE VAN2002 FORD E250 FULL SIZE VAN2002 FORD E250 FULL SIZE VAN2002 FORD E250 FULL SIZE VAN2002 FORD E250 FULL SIZE VAN2002 FORD E250 FULL SIZE VAN2002 FORD E250 FULL SIZE VAN2002 FORD E250 FULL SIZE VAN2002 FORD E250 FULL SIZE VAN2002 FORD E250 FULL SIZE VAN2004 FORD E350 FULL SIZE VAN2004 FORD E350 FULL SIZE VAN2004 FORD E350 FULL SIZE VAN2004 FORD E350 FULL SIZE VAN2004 FORD E350 FULL SIZE VAN1992 NAVISTAR 4600LP LINE TRUCK 10001‐16000KG1996 CHEV LF3500 DUMP TRUCK 10001‐16000KG1994 CHEV 3500 DUMP TRUCK 10001‐16000KG1991 FORD F800 DUMP TRUCK 10001‐16000KG2006 CHEV UPLANDER 9197RS CARGO MINI VAN2006 CHEV UPLANDER 9198RS CARGO MINI VAN2006 CHEV UPLANDER 9199RS CARGO MINI VAN2006 CHEV UPLANDER CARGO MINI VAN2006 CHEV UPLANDER 4401TA CARGO MINI VAN2006 CHEV UPLANDER 4402TA CARGO MINI VAN2006 CHEV UPLANDER 4403TA CARGO MINI VAN2006 CHEV UPLANDER 4404TA CARGO MINI VAN2006 CHEV UPLANDER 4405TA CARGO MINI VAN

Toronto Hydro‐Electric System LimitedEB‐2009‐0139
Exhibit R1Tab 11
Schedule 8Appendix A
Filed: 2009 Nov 30Page 9 of 16
Equipment Description Equipment Description 22009 CHEV UPLANDER EXT.WB.4‐DR CARGO MINI VAN2009 CHEV UPLANDER EXT.WB.4‐DR CARGO MINI VAN2009 CHEV UPLANDER EXT.WB.4‐DR CARGO MINI VAN1996 FREIGHTLINER FL80 SINGLE BUCKET TROUBLE TRUCK1996 FREIGHTLINER FL80 DOUBLE BUCKET ‐ UP TO 50` REACH1997 NAVISTAR SA475 SINGLE BUCKET ‐ CONVENTIONAL BOOM1997 NAVISTAR SA475 SINGLE BUCKET ‐ CONVENTIONAL BOOM1997 NAVISTAR 4700 SINGLE BUCKET ‐ CONVENTIONAL BOOM2005 GMC 3500 FULL SIZE CARGO VAN2005 GMC 3500 FULL SIZE CARGO VAN2005 GMC G3500 FULL‐SIZE CARGO VAN2005 CHEV GMC G3500 FULL‐SIZE CARGO VAN2005 GMC G3500 FULL‐SIZE CARGO VAN2005 CHEV GMC G3500 FULL‐SIZE CARGO VAN2006 GMC CC5E042 LINE TRUCK ‐ 10001‐16000 KG1987 NAVISTAR SS CUBE VAN2006 CHEV UPLANDER PASSENGER (MINI) VAN2006 CHEV UPLANDER PASSENGER (MINI) VAN2006 CHEV UPLANDER PASSENGER (MINI) VAN2006 CHEV UPLANDER PASSENGER (MINI) VAN2006 CHEV UPLANDER PASSENGER (MINI) VAN2006 CHEV UPLANDER PASSENGER (MINI) VAN2006 CHEV UPLANDER PASSENGER (MINI) VAN2006 CHEV UPLANDER PASSENGER (MINI) VAN2006 CHEV UPLANDER PASSENGER (MINI) VAN2009 CHEV UPLANDER PASSENGER (MINI) VAN2009 CHEV UPLANDER PASSENGER (MINI) VAN2005 DODGE CARAVAN CARGO MINI VAN2005 DODGE CARAVAN CARGO MINI VAN2005 DODGE CARAVAN CARGO MINI VAN2004 FORD FREESTAR CARGO MINI VAN2005 DODGE CARAVAN CARGO MINI VAN2005 DODGE CARAVAN CARGO MINI VAN2005 DODGE CARAVAN CARGO MINI VAN2005 DODGE CARAVAN CARGO MINI VAN2006 FORD FREESTAR 8116RH CARGO MINI VAN2006 FORD FREESTAR CARGO MINI VAN2006 FORD FREESTAR CARGO MINI VAN2006 FORD FREESTAR CARGO MINIVAN1997 NAVISTAR 4700 LP CUBE VAN2002 GMC W4S042 CUBE VAN2002 GMC W4S042 CUBE VAN2007 GMC W5500 CUBE VAN ‐ JOINTER`S TRUCK

Toronto Hydro‐Electric System LimitedEB‐2009‐0139
Exhibit R1Tab 11
Schedule 8Appendix A
Filed: 2009 Nov 30Page 10 of 16
Equipment Description Equipment Description 22008 CHEV CG 33405 FULL SIZE VAN2008 CHEV CG 33405 FULL SIZE VAN2008 CHEV CG 33405 FULL SIZE VAN2008 CHEV CG 33405 FULL SIZE VAN2008 CHEV CG 33405 FULL SIZE VAN2008 CHEV CG 13405 FULL SIZE VAN2008 CHEV CG 13405 FULL SIZE VAN2008 FORD E150 FULL SIZE ‐ CARGO VAN2008 FORD E150 FULL SIZE ‐ CARGO VAN1997 DODGE RAM 2500 FULL SIZE ‐ CARGO VAN2001 FORD WINDSTAR CARGO MINIVAN2001 FORD WINDSTAR CARGO MINIVAN2001 FORD WINDSTAR CARGO MINIVAN2001 FORD WINDSTAR CARGO MINIVAN2001 FORD WINDSTAR CARGO MINIVAN2001 FORD WINDSTAR CARGO MINIVAN2001 FORD WINDSTAR CARGO MINIVAN2001 FORD WINDSTAR CARGO MINIVAN2001 FORD WINDSTAR CARGO MINIVAN2001 FORD WINDSTAR CARGO MINI VAN2001 FORD WINDSTAR CARGO MINI VAN1993 REEDRILL TEXOMA MINI DIGGER DERRICK2003 CHEV VENTURE CARGO MINI VAN2003 CHEV VENTURE CARGO MINI VAN2003 CHEV VENTURE CARGO MINI VAN2003 CHEV VENTURE CARGO MINI VAN2003 CHEV VENTURE CARGO MINI VAN2000 CHEV C2500 FULLSIZE REGULAR CAB PICKUP2000 CHEV C2500 FULLSIZE EXTENDED CAB PICKUP2000 CHEV C2500 FULLSIZE REGULAR CAB PICKUP2000 CHEV C2500 FULLSIZE EXTENDED CAB PICKUP2000 CHEV C2500 FULLSIZE EXTENDED CAB PICKUP2000 CHEV C2500 FULLSIZE REGULAR CAB PICKUP2000 CHEV C2500 FULLSIZE REGULAR CAB PICKUP2000 CHEV C2500 FULLSIZE EXTENDED CAB PICKUP2000 CHEV C2500 FULLSIZE EXTENDED CAB PICKUP2000 CHEV C2500 FULLSIZE EXTENDED CAB PICKUP2003 STERLING M8500 DBL BUCKET ‐ 46` CONVENTIONAL WITH JIB2003 STERLING M8500 DBL BUCKET ‐ 46` CONVENTIONAL WITH JIB2003 STERLING M8500 DBL BUCKET ‐ 46` CONVENTIONAL WITH JIB2003 STERLING M8500 DBL BUCKET ‐ 46` CONVENTIONAL WITH JIB2003 STERLING M8500 DBL BUCKET ‐ 46` CONVENTIONAL WITH JIB2003 STERLING M8500 DBL BUCKET ‐ 46` CONVENTIONAL WITH JIB

Toronto Hydro‐Electric System LimitedEB‐2009‐0139
Exhibit R1Tab 11
Schedule 8Appendix A
Filed: 2009 Nov 30Page 11 of 16
Equipment Description Equipment Description 21992 FORD LTS8000 CRANE TRUCK2003 CHEV C2500 FULL SIZE EXTENDED CAB PICK UP2003 CHEV C2500 FULL SIZE EXTENDED CAB PICK UP2003 CHEV C2500 FULL SIZE EXTENDED CAB PICK UP2003 CHEV C2500 FULL SIZE EXTENDED CAB PICK UP1994 FREIGHTLINER FL80 CRANE TRUCK2001 CHEV C2500 FULL SIZE EXTENDED CAB PICK UP2001 CHEV C2500 FULL SIZE EXTENDED CAB PICK UP2001 CHEV C2500 FULL SIZE EXTENDED CAB PICK UP2001 CHEV C2500 FULL SIZE EXTENDED CAB PICK UP2001 CHEV C2500 FULL SIZE EXTENDED CAB PICK UP2001 CHEV C2500 FULL SIZE EXTENDED CAB PICK UP2001 CHEV C2500 FULL SIZE EXTENDED CAB PICK UP2001 CHEV C2500 FULL SIZE REGULAR CAB PICK UP2001 CHEV C2500 FULL SIZE EXTENDED CAB PICK UP2001 CHEV C2500 FULL SIZE EXTENDED CAB PICK UP2001 CHEV C2500 FULL SIZE EXTENDED CAB PICK UP2001 CHEV C2500 FULL SIZE EXTENDED CAB PICK UP2001 CHEV C2500 FULL SIZE EXTENDED CAB PICK UP2001 CHEV C2500 FULL SIZE REGULAR CAB PICK UP2001 CHEV C2500 FULL SIZE REGULAR CAB PICK UP2001 CHEV C2500 FULL SIZE REGULAR CAB PICK UP2001 CHEV C2500 FULL SIZE REGULAR CAB PICK UP2001 CHEV C2500 FULL SIZE EXTENDED CAB PICK UP2001 CHEV C2500 FULL SIZE REGULAR CAB PICK UP2001 CHEV C2500 FULL SIZE EXTENDED CAB PICK UP2001 CHEV C2500 FULL SIZE EXTENDED CAB PICK UP2003 CHEV C2500 FULL SIZE EXTENDED CAB PICK UP2003 CHEV C2500 FULL SIZE EXTENDED CAB PICK UP2003 CHEV C2500 FULL SIZE EXTENDED CAB PICK UP2003 CHEV C2500 FULL SIZE EXTENDED CAB PICK UP2003 CHEV C2500 FULL SIZE EXTENDED CAB PICK UP2003 CHEV C2500 FULL SIZE EXTENDED CAB PICK UP2005 STERLING M8500 DIGGER DERRICK1986 NAVISTAR 1754 CRANE TRUCK2002 STERLING M7500 SINGLE BUCKET2002 STERLING M7500 SINGLE BUCKET2002 STERLING M7500 SINGLE BUCKET ‐ CONVENTIONAL BOOM2007 STERLING M8500 SINGLE BUCKET CONVENTIONAL BOOM2002 STERLING M7500 SINGLE BUCKET CONVENTIONAL BOOM2002 STERLING M7500 SINGLE BUCKET ‐ 46` CONVENTIONAL WITH JI2002 STERLING M7500 SINGLE BUCKET ‐ 46` CONVENTIONAL WITH JI2003 STERLING M8500 SINGLE BUCKET CONVENTIONAL BOOM
Toronto Hydro‐Electric System LimitedEB‐2009‐0139
Exhibit R1Tab 11
Schedule 8Appendix A
Filed: 2009 Nov 30Page 12 of 16
Equipment Description Equipment Description 22003 STERLING M8500 SINGLE BUCKET CONVENTIONAL BOOM2003 STERLING M8500 SINGLE BUCKET CONVENTIONAL BOOM2003 STERLING M8500 SINGLE BUCKET CONVENTIONAL BOOM2003 STERLING M8500 SINGLE BUCKET CONVENTIONAL BOOM2003 STERLING M8500 SINGLE BUCKET CONVENTIONAL BOOM2003 STERLING M8500 SINGLE BUCKET CONVENTIONAL BOOM2003 STERLING M8500 SINGLE BUCKET CONVENTIONAL BOOM2003 STERLING M8500 SINGLE BUCKET CONVENTIONAL BOOM2003 STERLING M8500 SINGLE BUCKET CONVENTIONAL BOOM2003 STERLING M8500 SINGLE BUCKET CONVENTIONAL BOOM2003 STERLING M8500 SINGLE BUCKET CONVENTIONAL BOOM2005 STERLING M8500 SINGLE BUCKET ‐ CONVENTIONAL BOOM2005 STERLING M8500 SINGLE BUCKET ‐ CONVENTIONAL BOOM2005 STERLING M8500 SINGLE BUCKET ‐ CONVENTIONAL BOOM2005 STERLING M8500 SINGLE BUCKET ‐ CONVENTIONAL BOOM2007 GMC W5500 CUBE VAN ‐ JOINTER`S TRUCK2007 GMC W5500 CUBE VAN ‐ JOINTER`S TRUCK1989 FORD F800 CRANE TRUCK ‐ 26001 ‐ 33000 KG 7.8L BRAZ2000 GMC W4S042 CUBE VAN ‐ JOINTER`S TRUCK2002 GMC W5500 CUBE VAN ‐ JOINTER`S TRUCK2002 GMC W5500 CUBE VAN ‐ JOINTER`S TRUCK2002 GMC W5500 CUBE VAN ‐ JOINTER`S TRUCK2002 GMC W5500 CUBE VAN ‐ JOINTER`S TRUCK2002 GMC W5500 CUBE VAN ‐ JOINTER`S TRUCK2002 GMC W5500 CUBE VAN ‐ JOINTER`S TRUCK2002 GMC W5500 CUBE VAN ‐ JOINTER`S TRUCK2002 GMC W5500 CUBE VAN ‐ JOINTER`S TRUCK2002 GMC W5500 CUBE VAN ‐ JOINTER`S TRUCK2002 GMC W5500 CUBE VAN ‐ JOINTER`S TRUCK2002 GMC W5500 CUBE VAN ‐ JOINTER`S TRUCK2002 GMC W5500 CUBE VAN ‐ JOINTER`S TRUCK2002 GMC W5500 CUBE VAN ‐ JOINTER`S TRUCK2002 GMC W5500 CUBE VAN ‐ JOINTER`S TRUCK2002 GMC W5500 CUBE VAN ‐ JOINTER`S TRUCK2002 GMC W5500 CUBE VAN ‐ JOINTER`S TRUCK2002 GMC W5500 CUBE VAN ‐ JOINTER`S TRUCK2002 GMC W5500 CUBE VAN ‐ JOINTER`S TRUCK2002 GMC W5500 CUBE VAN ‐ JOINTER`S TRUCK2002 GMC W5500 CUBE VAN ‐ JOINTER`S TRUCK2002 GMC W5500 CUBE VAN ‐ JOINTER`S TRUCK2002 GMC W5500 CUBE VAN ‐ JOINTER`S TRUCK2002 GMC W5500 CUBE VAN ‐ JOINTER`S TRUCK2002 GMC W5500 CUBE VAN ‐ JOINTER`S TRUCK

Toronto Hydro‐Electric System LimitedEB‐2009‐0139
Exhibit R1Tab 11
Schedule 8Appendix A
Filed: 2009 Nov 30Page 13 of 16
Equipment Description Equipment Description 22002 GMC W5500 CUBE VAN ‐ JOINTER`S TRUCK2002 GMC W5500 CUBE VAN ‐ JOINTER`S TRUCK2002 GMC W5500 CUBE VAN ‐ JOINTER`S TRUCK2002 GMC W5500 CUBE VAN ‐ JOINTER`S TRUCK2002 GMC W5500 CUBE VAN ‐ JOINTER`S TRUCK2002 GMC W5500 CUBE VAN ‐ JOINTER`S TRUCK2002 GMC W5500 CUBE VAN ‐ JOINTER`S TRUCK2002 GMC W5500 CUBE VAN ‐ JOINTER`S TRUCK2002 GMC W5500 CUBE VAN ‐ JOINTER`S TRUCK2002 GMC W5500 CUBE VAN ‐ JOINTER`S TRUCK2004 GMC W5500 CUBE VAN ‐ JOINTER`S TRUCK2005 GMC W5500 CUBE VAN ‐ JOINTER`S TRUCK2005 GMC W5500 CUBE VAN ‐ JOINTER`S TRUCK2005 GMC W5500 CUBE VAN ‐ JOINTER`S TRUCK2005 GMC W5500 CUBE VAN ‐ JOINTER`S TRUCK2005 GMC W5500 CUBE VAN ‐ JOINTER`S TRUCK2006 GMC W5500 CUBE VAN ‐ JOINTER`S TRUCK1997 FORD AEROSTAR CARGO (MINI) VAN2007 DODGE CARAVAN CARGO MINI VAN2007 DODGE CARAVAN CARGO MINI VAN2007 DODGE CARAVAN CARGO MINI VAN2007 DODGE CARAVAN CARGO MINI VAN2007 DODGE CARAVAN CARGO MINI VAN2008 DODGE CARAVAN CARGO MINI VAN2008 DODGE CARAVAN CARGO MINI VAN2007 DODGE CARAVAN CARGO MINI VAN2005 GMC CC5E042 LINE TRUCK ‐ 10001‐16000 KG2005 GMC CC5E042 LINE TRUCK ‐ 10001‐16000 KG2006 GMC CC5E042 LINE TRUCK ‐ 10001‐16000 KG2000 CHEV CAVALIER BI‐FUEL COMPACT CAR2000 CHEV CAVALIER BI‐FUEL COMPACT CAR2000 CHEV CAVALIER BI‐FUEL COMPACT CAR2000 CHEV CAVALIER BI‐FUEL COMPACT CAR2000 CHEV CAVALIER BI‐FUEL COMPACT CAR2001 TOYOTA PRIUS ELECTRIC HYBRID CAR2003 HONDA CIVIC 4DR SEDAN HYBRID VEHICLE2003 HONDA CIVIC 4DR SEDAN HYBRID VEHICLE2003 HONDA CIVIC 4 DR SEDAN HYBRID VEHICLE2003 HONDA CIVIC 4 DR SEDAN HYBRID VEHICLE2003 HONDA CIVIC 4 DR SEDAN HYBRID VEHICLE2000 CHEV C2500 FULLSIZE REGULAR CAB PICKUP2006 FORD F250 FULL SIZE EXTENDED CAB PICK UP2006 FORD F250 FULL SIZE EXTENDED CAB PICK UP

Toronto Hydro‐Electric System LimitedEB‐2009‐0139
Exhibit R1Tab 11
Schedule 8Appendix A
Filed: 2009 Nov 30Page 14 of 16
Equipment Description Equipment Description 21997 CHEV LT2500 FULL SIZE ‐ CREW CAB1997 CHEV LT2500 FULL SIZE PICK UP ‐ CREW CAB2003 CHEV VENTURE CARGO MINI VAN2003 CHEV VENTURE CARGO MINI VAN2003 CHEV VENTURE CARGO MINI VAN2003 CHEV VENTURE CARGO MINI VAN2003 CHEV VENTURE CARGO MINI VAN2003 CHEV VENTURE CARGO MINI VAN2003 CHEV VENTURE CARGO MINI VAN2003 DODGE CARAVAN WINDOW MINI VAN2005 CHEV CC 55E WELDING TRUCK2007 FORD F550 CRANE TRUCK 10001‐16000KG2007 FORD F550 CRANE TRUCK 10001‐16000KG2008 KENWORTH MODEL T170 CRANE TRUCK 10001‐16000KG2008 STERLING ACT CRANE TRUCK 16001 ‐ 26000 KG2006 CHEV 3500 FULL SIZE ‐ CARGO VAN2006 CHEV 3500 FULL SIZE ‐ CARGO VAN2006 CHEV 3500 FULL SIZE ‐ CARGO VAN2006 CHEV 3500 FULL SIZE ‐ CARGO VAN2006 CHEV 3500 FULL‐SIZE CARGO VAN2006 CHEV 3500 FULL SIZE ‐ CARGO VAN2006 FORD E250 FULL SIZE CARGO VAN2006 FORD E250 FULL SIZE CARGO VAN2006 FORD E250 FULL SIZE CARGO VAN2009 STERLING ACTERRA M8500 DOUBLE BUCKET ‐ 51' TO 64'2009 STERLING M8500 DOUBLE BUCKET ‐ 51' TO 64'2009 STERLING M8500 DOUBLE BUCKET ‐ 51' TO 64'2009 STERLING M8500 DOUBLE BUCKET ‐ 51' TO 64'2007 STERLING M8500 DOUBLE BUCKET ‐ 51' TO 64'2009 STERLING M8500 DOUBLE BUCKET ‐ 51' TO 64'2009 STERLING M8500 DOUBLE BUCKET ‐ 51' TO 64'1994 JDJ TRAILERS ENC BOX TRAILERS1987 TIMBERLAND DPT‐30B CABLE/REEL TRAILER1991 YORK UTILITY C STRINGING/TENSIONER1987 TIMBERLAND DPT‐30B STRINGING/TENSIONER1972 NYE UNKNOWN CABLE/REEL1980 JC TRAILERS 9TD POLE1996 JJ 001‐P POLE1967 KING UNKNOWN POLE1994 TJ WELDING P‐90 POLE TRAILER1980 JC TRAILERS CUSTOM CABLE/REEL TRAILER1994 JDJ TRAILERS DU‐6‐10 DUMP TRAILER2004 VERMEER BC1000XL CHIPPER TRAILER

Toronto Hydro‐Electric System LimitedEB‐2009‐0139
Exhibit R1Tab 11
Schedule 8Appendix A
Filed: 2009 Nov 30Page 15 of 16
Equipment Description Equipment Description 22004 VERMEER BC1000XL CHIPPER TRAILER1994 JDJ TRAILERS DU‐6‐10 DUMP TRAILER1993 TIMBERLAND RC80‐72 CABLE/REEL TRAILER1972 KING 4SW POLE TRAILER1972 KING 3CT CABLE/REEL TRAILER1986 TJ WELDING 700 MISC. TRAILER1988 HUTCHINSON UNKNOWN STRINGING TENSIONER TRAILER1992 HUTCHINSON UNKNOWN MISC. TRAILER1993 SHERMAN RIELLY PT‐2766 STRINGING/TENSIONER1960 HOME UNKNOWN REEL TRAILER1977 TJ WELDING UNKNOWN POLE TRAILER1989 REEDRILL 4040B MISC. TRAILER1989 BRIGGS&STRATTON 1100G TRANSFORMER HOIST1997 O.T.C. 12`EN MISC. TRAILER1989 TJ WELDING 600S BOX TRAILER1989 TJ WELDING 600S BOX TRAILER2007 PRAXAIR TRAILER WITH WELDER MISC. TRAILER1992 TJ WELDING 300S MISC. TRAILER1993 REEDRILL UNKNOWN FLOAT1958 HUTCH UNKNOWN CART TRAILER1991 KING 3CTH‐108 CABLE/REEL TRAILER1991 G AND C BECHARD G‐C1 OIL FILTERING AND STORAGE TRAILER1992 TJ WELDING 150 FLOAT1992 MANAC 12232101 POLE1994 ALTEC AD‐108 CABLE/REEL TRAILER1995 TIMBERLAND DPT‐30B STRINGING/TENSIONER TRAILER1995 TIMBERLAND DPT‐30B STRINGING/TENSIONER TRAILER1995 SONKIND S‐1 CABLE / REEL TRAILER1995 SONKIND UNKNOWN CABLE / REEL TRAILER1996 MANAC 12232101 POLE TRAILER1985 TJ WELDING 700R CABLE / REEL TRAILER1979 STANMORE UNKNOWN FLAT BED TILT TRAILER FOR KABOTA1962 SMITH BROS UNKNOWN CABLE / REEL TRAILER1965 SMITH BROS UNKNOWN MOBILE TX. TRAILER1957 HUTCH UNKNOWN POLE TRAILER2005 NANDO FLATBED TRAILER WITH GENERATORPOSI PLUS 1400 2006 POSI PLUS 1400 CABLE2006 POSI PLUS 1400 POSI PLUS 1400 CABLE2006 POSI PLUS 1400 POSI PLUS 1400 CABLE2005 TIMBERLAND DPT‐30B STRINGING/TENSIONER2005 TIMBERLAND DPT‐30B STRINGING/TENSIONER2005 TIMBERLAND DPT‐30B STRINGING/TENSIONER2005 TIMBERLAND DPT‐30B STRINGING/TENSIONER

Toronto Hydro‐Electric System LimitedEB‐2009‐0139
Exhibit R1Tab 11
Schedule 8Appendix A
Filed: 2009 Nov 30Page 16 of 16
Equipment Description Equipment Description 22005 TIMBERLAND DPT‐30B STRINGING/TENSIONER2005 TIMBERLAND DPT‐30B STRINGING/TENSIONER2009 SHERMAN REILLY MODEL DDH‐75‐T UNDERGROUND PULLER/TRAILER2009 SHERMAN REILLY MODEL DDH‐75‐T UNDERGROUND PULLER/TRAILER2009 RP Model CR8 CABLE / REEL TRAILER2009 RP Model CR8 CABLE / REEL TRAILER2009 RP Model CR8 CABLE / REEL TRAILER2009 RP Model CR8 CABLE / REEL TRAILER
Toronto Hydro-Electric System Limited EB-2009-0139
Exhibit R1 Tab 11
Schedule 9 Filed: 2009 Nov 30
Page 1 of 1
INTERROGATORIES OF VULNERABLE ENERGY CONSUMERS COALITION
Witness Panel(s): 4
INTERROGATORY 9: 1
Reference(s): Exhibit C1, Tab 4, Schedule 3 2
3
FES allocates its fleet costs to the business units of THESL and to affiliates based on the 4
cost allocation model described in Exhibit C1, Tab 4, Schedule 3. 5
a) Provide a copy of Exhibit C1, Tab 4, Schedule 3. 6
7
RESPONSE: 8
Please refer to the Application provided. 9

Toronto Hydro-Electric System Limited EB-2009-0139
Exhibit R1 Tab 11
Schedule 10 Filed: 2009 Nov 30
Page 1 of 2
INTERROGATORIES OF VULNERABLE ENERGY CONSUMERS COALITION
Witness Panel(s): 3
INTERROGATORY 10: 1
Reference(s): Exhibit C2 Tab 1 Schedule 2 2
3
“As part of THESL’s new five-year Collective Agreement with CUPE effective February 4
1, 2009, a group incentive program was introduced for unionized employees in the 5
critical front-line roles of Crew Leader and System Response Representative. This new 6
Gain Sharing Program is a groundbreaking achievement, linking pay to successful 7
delivery of specific results. The purpose of the program is to incent the right behaviours 8
and advance the performance expectations for these employees to promote individual 9
accountability and drive operational improvements. The new Gain Sharing Program has 10
its own Scorecard linked to THESL’s Scorecard and consists of four specific key 11
performance indicators (“KPIs”):” 12
a) Provide an estimate of the number and list of Ontario utilities that have a similar gain 13
sharing program for Unionized Employees. 14
b) How many Employees are eligible – provide a breakdown by group. 15
c) Provide an estimate of the annual cost of the program based on expected performance 16
in 2009 and 2010 respectively. 17
d) Explain why Line 47 of Exhibit C2 Tab 1 Schedule2 Appendix A appears to show for 18
Union employees, an increase in incentive pay in 2009 relative to 2008, but a 19
decrease in incentive pay from 2009-2010. Reconcile this with the cost consequences 20
from implementation of the Gain Sharing Program. 21
e) Provide the 2010 Scorecard for the Gain Sharing Program. Highlight any differences 22
in the Scorecard or bonus calculation. 23
24
RESPONSE: 25
a) THESL is aware of four utilities that have gainsharing programs. They are: 26

Toronto Hydro-Electric System Limited EB-2009-0139
Exhibit R1 Tab 11
Schedule 10 Filed: 2009 Nov 30
Page 2 of 2
INTERROGATORIES OF VULNERABLE ENERGY CONSUMERS COALITION
Witness Panel(s): 3
• Enbridge Gas Distribution Inc. 1
• EPCOR Utilities Inc. 2
• B.C. Hydro 3
• Union Gas Limited 4
5
b) Eighty-one Crew Leaders and 43 System Response Representatives will be eligible 6
for 2009. An additional two System Response Representatives will be eligible for 7
2010. 8
9
c) The cost of the Gain Sharing Program is estimated to be $260,000 if participants 10
achieve target for all four KPIs on the 2009 Gain Sharing Scorecard. The cost, based 11
on the same premise for 2010, is estimated to be $270,000. 12
13
d) Line 47 is an average of incentive pay. For 2009, the union category includes 31 14
employees who were members of the Society of Energy Professionals (“SEP”) and 15
receive incentive pay under THESL’s Compensation Program. For 2010, the union 16
category includes 37 SEP employees plus the 124 employees in the Gain Sharing 17
Program. While both programs are incentive pay programs, they are different in 18
design and payout eligibility. The addition of 124 employees reduced the overall 19
average. 20
21
e) The Gain Sharing Scorecard is a subset of the THESL Scorecard which has not yet 22
been approved by THESL’s Board of Directors for 2010 and can be provided upon 23
Board of Directors approval. 24

Toronto Hydro-Electric System Limited EB-2009-0139
Exhibit R1 Tab 11
Schedule 11 Filed: 2009 Nov 30
Page 1 of 1
INTERROGATORIES OF VULNERABLE ENERGY CONSUMERS COALITION
Witness Panel(s): 3
INTERROGATORY 11: 1
Reference(s): Exhibit C1 Tab 1 Schedule 4 2
Exhibit C2 Tab 1 Schedule 6 3
4
a) Provide the 2010 Executive and Management Scorecards for THC and THESL. 5
b) Compare/ contrast the Scorecards and provide explanations for any material changes 6
for 2010. 7
c) Compare the Scorecard to that for the Unionized Employees Gain Sharing plan and 8
highlight the linkages and rationale for the main differences. 9
10
RESPONSE: 11
a) The 2010 Executive and Management Scorecards for 2010 have not yet been 12
approved by the Board of Directors and can be provided upon Board of Directors 13
approval. 14
15
b) See a) above. 16
17
c) See a) above. 18

Toronto Hydro-Electric System Limited EB-2009-0139
Exhibit R1 Tab 11
Schedule 12 Filed: 2009 Nov 30
Page 1 of 2
INTERROGATORIES OF VULNERABLE ENERGY CONSUMERS COALITION
Witness Panel(s): 2
INTERROGATORY 12: 1
Reference(s): Exhibit C2 Tab 1 Schedule 2 Page 5 2
3
a) Please justify an increase in Total Compensation of over 13% for 2010 combined 4
with an increase in Average compensation per employee from 123,490 to 125,650 or 5
1.8% when THESL customers are faced with losing their jobs or just getting by on 6
their current compensation and businesses are closing and/or laying off employees? 7
b) Why would not THESL recognize that the economic situation remains dire and 8
postpone or modify its expansion plans for 2010? 9
c) Provide the rationale and details of the calculations for the increase in the % of total 10
compensation capitalized from ~42.9% in 2008 Board Approved to ~46.6% in 2010. 11
12
RESPONSE: 13
a) To attract new talent and retain current staff, including our seasoned employees, 14
THESL’s total compensation must be competitive with the market. THESL 15
compensation system is performance-based therefore, any increase in base salary and 16
payout of incentive pay is tied to achievement of business results. Extending this 17
linkage of compensation to performance, THESL has also added Gain Sharing for 18
key bargaining unit positions to drive productivity improvement. Payout of the Gain 19
Sharing incentive pay will be based on attainment of Key Performance Indicators on 20
THESL scorecard. The Total Compensation of approximately 11% for 2010 also 21
includes the second year increase of a five-year collective agreement that will provide 22
labour stability for the coming years. Furthermore, this increase captures the 23
additional cost of hiring new full-time employees into THESL’s workforce. 24
25
Toronto Hydro-Electric System Limited EB-2009-0139
Exhibit R1 Tab 11
Schedule 12 Filed: 2009 Nov 30
Page 2 of 2
INTERROGATORIES OF VULNERABLE ENERGY CONSUMERS COALITION
Witness Panel(s): 2
b) THESL needs to carry out sustaining and emerging plans for 2010 to maintain system 1
reliability, service quality, integration of present and anticipated distribution 2
requirements, minimize long-run life-cycle costs, address government initiatives such 3
as the GEGEA, Transit City expansion requests and other emerging requirements. 4
These requirements are not dependent on the economy. 5
6
c) The increase in the percentage of total compensation capitalized from ~42.9% in 7
2008 Board-Approved to ~46.6% in 2010 attributed by the growing capital program 8
in THESL. 9

Toronto Hydro-Electric System Limited EB-2009-0139
Exhibit R1 Tab 11
Schedule 13 Filed: 2009 Nov 30
Page 1 of 2
INTERROGATORIES OF VULNERABLE ENERGY CONSUMERS COALITION
Witness Panel(s): 2
INTERROGATORY 13: 1
Reference(s): Exhibits C2 Tab 1 Schedule 5 2
Exhibits C2 Tab5 Schedule1 page 5-7 and Tables 2 and 3 3
4
Table 1 Shows 53 retirements in 2009 and 38 retirements in 2010 5
a) Provide an update of 2009 retirements and the impact of the variance on 2009 total 6
compensation. 7
b) Show the 2010 forecast breakdown of retirements by type of position and level. 8
c) Provide a schedule of the forecast retirements by Quarter of 2010 and the associated 9
impact on 2010 total compensation. Reconcile the estimated $ impact to the amounts 10
shown at lines17-20 of C2 Tab1 Schedule 2 Appendix A. 11
12
RESPONSE: 13
a) In 2009, 30 employees have retired to date. It is expected that these employees will 14
be replaced with no material impact to 2009 total compensation. 15
16
b) The table below outlines the 2010 forecasted retirements by employee category. 17
Employee Category 2010 Forecasted Retirements
Executive
Mangerial 4
Management/Non-Union 3
Union 31
Total 38
18

Toronto Hydro-Electric System Limited EB-2009-0139
Exhibit R1 Tab 11
Schedule 13 Filed: 2009 Nov 30
Page 2 of 2
INTERROGATORIES OF VULNERABLE ENERGY CONSUMERS COALITION
Witness Panel(s): 2
The table below outlines the 2010 forecasted retirement per quarter. 1
2010 Quarter Forecasted Retirements
Q1 2010 15
Q2 2010 8
Q3 2010 7
Q4 2010 8
Total 38
2
It is expected that these employees will be replaced with no material impact to 2010 3
total compensation. 4
Toronto Hydro-Electric System Limited EB-2009-0139
Exhibit R1 Tab 11
Schedule 14 Filed: 2009 Nov 30
Page 1 of 3
INTERROGATORIES OF VULNERABLE ENERGY CONSUMERS COALITION
Witness Panel(s): 2
INTERROGATORY 14: 1
Reference(s): Exhibit C2 Tab1 Schedule 2 Appendix A 2
Exhibit C2 Tab5 Schedule1 page 5-7 and Tables 2 and 3 3
4
In 2010, some 130 new employees will be hired into leadership, trades, technical and 5
customer service positions, along with engaging contractors. 6
a) Reconcile the Union Head count average of 1265 in 2009 and 1326 for Union 7
employees C2 Tab1 Schedule 2 Appendix A with C2 Tab5 Schedule1Tables 2 and 3. 8
b) Provide a schedule that shows by month the hiring plan for Union Employees by level 9
and the associated $ impact on 2010 total compensation costs. Reconcile the total 10
compensation cost to the amounts shown at line 31 of C2 Tab1 Schedule 2 Appendix 11
A. 12
c) Provide a schedule that shows by month the hiring plan for non-union employees by 13
level and the associated $ impact on 2010 total compensation costs. Reconcile the 14
total compensation cost to the amounts shown at lines 29 and 30 of C2 Tab1 Schedule 15
2 Appendix A. 16
d) If delays in hiring occur (as appears to be the case in 2008 and 2009) estimate the 17
impact on total compensation of a reduction in 10 FTEs for non-union employees and 18
a reduction of 10 FTEs in union employees. State clearly your timing assumptions. 19
20
RESPONSE: 21
a) 1265 and 1326 in Exhibit C2, Tab1, Schedule 2 Appendix A are FTEs for the Union 22
employee category, not average headcounts. In 2009, the Trades Apprentices staffing 23
plan number of 82 on Table 2 is comprised of 76 underground/overhead line 24
apprentices, four meter mechanic apprentices and two apprentice program graduates. 25
In 2010, the 128 is comprised of 80 apprentices continuing in the program plus an 26
Toronto Hydro-Electric System Limited EB-2009-0139
Exhibit R1 Tab 11
Schedule 14 Filed: 2009 Nov 30
Page 2 of 3
INTERROGATORIES OF VULNERABLE ENERGY CONSUMERS COALITION
Witness Panel(s): 2
additional 40 line apprentices, four meter mechanics and four stations apprentices to 1
be hired in 2010. In 2010, the Technical Apprentice staffing plan number of 62 on 2
Table 3 is comprised of 29 current apprentices plus 33 technical apprentices to be 3
hired in 2010. The numbers shown in these Tables are headcounts, not FTEs. 4
5
b & c) 6
Table below shows by month the hiring plan for Managerial, Management/Non-7
Union and Union Employees with the associated $ impact on total compensation 8
(Salary, Wages & Benefits). 9
10
Hiring Plan 11
Category Jan Feb Mar Jun Aug TotalManagerial ‐$ ‐$ ‐$ 192 k$ ‐$ 192 k$ Mgmt / Non Union 3,983 k$ ‐$ 1,247 k$ 5,268 k$ ‐$ 10,498 k$ Union 5,151 k$ 1,281 k$ 656 k$ 2,308 k$ 596 k$ 9,992 k$
9,134 k$ 1,281 k$ 1,903 k$ 7,767 k$ 596 k$ 20,681 k$ 12
13
Table below is the reconciliation between line 29, 30 and 31 “Total Compensation 14
(Salary, Wages & Benefits)” as per Appendix A, C2-T1-S2. 15
16
Existing 17
Category Jan Feb Mar Jun Aug TotalManagerial 9,073 k$ ‐$ ‐$ ‐$ ‐$ 9,073 k$ Mgmt / Non Union 40,376 k$ ‐$ ‐$ ‐$ ‐$ 40,376 k$ Union 129,986 k$ ‐$ ‐$ ‐$ ‐$ 129,986 k$
182,907 k$ ‐$ ‐$ ‐$ ‐$ 182,907 k$ 18
Toronto Hydro-Electric System Limited EB-2009-0139
Exhibit R1 Tab 11
Schedule 14 Filed: 2009 Nov 30
Page 3 of 3
INTERROGATORIES OF VULNERABLE ENERGY CONSUMERS COALITION
Witness Panel(s): 2
Hiring Plan & Existing 1
Category Jan Feb Mar Jun Aug TotalManagerial 9,073 k$ ‐$ ‐$ 192 k$ ‐$ 9,264 k$ Mgmt / Non Union 44,359 k$ ‐$ 1,247 k$ 5,268 k$ ‐$ 50,874 k$ Union 135,137 k$ 1,281 k$ 656 k$ 2,308 k$ 596 k$ 139,977 k$
192,042 k$ 1,281 k$ 1,903 k$ 7,767 k$ 596 k$ 203,588 k$ 2
3
d) Below is the estimated impact on total compensation of a reduction in 10 FTEs for 4
non-union employees and a reduction of 10 FTEs in union employees for 12 months. 5
6
Category Total
Mgmt / Non Union 1,347 k$ Union 920 k$
Toronto Hydro-Electric System Limited EB-2009-0139
Exhibit R1 Tab 11
Schedule 15 Filed: 2009 Nov 30
Page 1 of 2
INTERROGATORIES OF VULNERABLE ENERGY CONSUMERS COALITION
Witness Panel(s): 4
INTERROGATORY 15: 1
Reference(s): Exhibit C2 Tab 2 Schedule 2 Table 1 Facilities Capital Plan 2
3
a) Provide a schedule based on Table 1 that shows the amounts expected to close to rate 4
base in 2010 and 2011. 5
b) Assume that the expenditures are delayed by 6 months and revise the answer to part 6
a) accordingly. 7
8
RESPONSE: 9
Please note that there was an error in costs provided in Exhibit C2, Tab 2, Schedule 2, 10
Table 1. The error has no impact on rate base calculations as the figures were only 11
incorrect for this Exhibit and were correct in the detailed calculations performed. The 12
table should have been presented as such: 13
14
2008 Historical 2009 Bridge 2010 Test
Administrative offices and
operations centres 2.3 3.8 11.5
Substations 0.1 1.5 1.1
Environmental 0.1 0.2 0.2
Office Furniture 1.1 1.8 0.8
Total 3.5 7.3 13.6
15
Toronto Hydro-Electric System Limited EB-2009-0139
Exhibit R1 Tab 11
Schedule 15 Filed: 2009 Nov 30
Page 2 of 2
INTERROGATORIES OF VULNERABLE ENERGY CONSUMERS COALITION
Witness Panel(s): 4
1
a) The amounts provided in Table 1 will impact rate base as such: 2
2010 Test 2010 Rate Base 2011 Rate Base
Administrative offices and
operations centres 11.5 4.9 6.6
Substations 1.1 0.5 0.6
Environmental 0.2 0.2 0.0
Office Furniture 0.8 0.6 0.2
Total 13.6 6.2 7.4
3
b) The estimated effect of a six-month delay would have the following impact on rate 4
base assuming THESL could still complete the projects by 2011: 5
2010 Test 2010 Rate Base 2011 Rate Base
Administrative offices and
operations centres 11.5 0.0 11.5
Substations 1.1 0.0 1.1
Environmental 0.2 0.1 0.1
Office Furniture 0.8 0.1 0.7
Total 13.6 0.2 13.4

Toronto Hydro-Electric System Limited EB-2009-0139
Exhibit R1 Tab 11
Schedule 16 Filed: 2009 Nov 30
Page 1 of 1
INTERROGATORIES OF VULNERABLE ENERGY CONSUMERS COALITION
Witness Panel(s): 3
INTERROGATORY 16: 1
Reference(s): Exhibit D1 Tab 2 Schedule 1 Table 5 2
Exhibit D1, Tab 4, Schedule 1 3
4
a) Provide a Schedule that shows details of the major additions to fixed assets in 2010. 5
6
RESPONSE: 7
Refer to Appendix A of this Schedule. 8
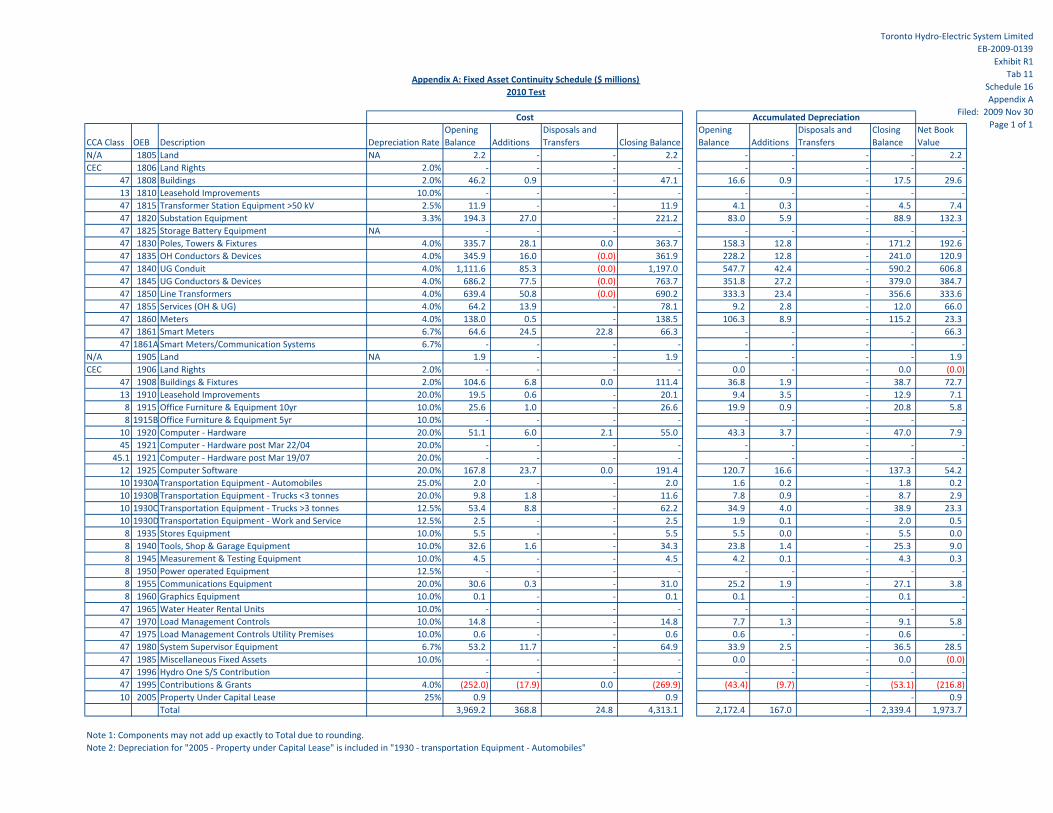
Toronto Hydro‐Electric System LimitedEB‐2009‐0139
Exhibit R1Tab 11
Schedule 16Appendix A
Filed: 2009 Nov 30Page 1 of 1
CCA Class OEB Description Depreciation RateOpening Balance Additions
Disposals and Transfers Closing Balance
Opening Balance Additions
Disposals and Transfers
Closing Balance
Net Book Value
N/A 1805 Land NA 2.2 ‐ ‐ 2.2 ‐ ‐ ‐ ‐ 2.2CEC 1806 Land Rights 2.0% ‐ ‐ ‐ ‐ ‐ ‐ ‐ ‐ ‐
47 1808 Buildings 2.0% 46.2 0.9 ‐ 47.1 16.6 0.9 ‐ 17.5 29.613 1810 Leasehold Improvements 10.0% ‐ ‐ ‐ ‐ ‐ ‐ ‐ ‐ ‐47 1815 Transformer Station Equipment >50 kV 2.5% 11.9 ‐ ‐ 11.9 4.1 0.3 ‐ 4.5 7.447 1820 Substation Equipment 3.3% 194.3 27.0 ‐ 221.2 83.0 5.9 ‐ 88.9 132.347 1825 Storage Battery Equipment NA ‐ ‐ ‐ ‐ ‐ ‐ ‐ ‐ ‐47 1830 Poles, Towers & Fixtures 4.0% 335.7 28.1 0.0 363.7 158.3 12.8 ‐ 171.2 192.647 1835 OH Conductors & Devices 4.0% 345.9 16.0 (0.0) 361.9 228.2 12.8 ‐ 241.0 120.947 1840 UG Conduit 4.0% 1,111.6 85.3 (0.0) 1,197.0 547.7 42.4 ‐ 590.2 606.847 1845 UG Conductors & Devices 4.0% 686.2 77.5 (0.0) 763.7 351.8 27.2 ‐ 379.0 384.747 1850 Line Transformers 4.0% 639.4 50.8 (0.0) 690.2 333.3 23.4 ‐ 356.6 333.647 1855 Services (OH & UG) 4.0% 64.2 13.9 ‐ 78.1 9.2 2.8 ‐ 12.0 66.047 1860 Meters 4.0% 138.0 0.5 ‐ 138.5 106.3 8.9 ‐ 115.2 23.347 1861 Smart Meters 6.7% 64.6 24.5 22.8 66.3 ‐ ‐ ‐ ‐ 66.347 1861ASmart Meters/Communication Systems 6.7% ‐ ‐ ‐ ‐ ‐ ‐ ‐ ‐ ‐
N/A 1905 Land NA 1.9 ‐ ‐ 1.9 ‐ ‐ ‐ ‐ 1.9CEC 1906 Land Rights 2.0% ‐ ‐ ‐ ‐ 0.0 ‐ ‐ 0.0 (0.0)
47 1908 Buildings & Fixtures 2.0% 104.6 6.8 0.0 111.4 36.8 1.9 ‐ 38.7 72.713 1910 Leasehold Improvements 20.0% 19.5 0.6 ‐ 20.1 9.4 3.5 ‐ 12.9 7.18 1915 Office Furniture & Equipment 10yr 10.0% 25.6 1.0 ‐ 26.6 19.9 0.9 ‐ 20.8 5.88 1915B Office Furniture & Equipment 5yr 10.0% ‐ ‐ ‐ ‐ ‐ ‐ ‐ ‐ ‐
10 1920 Computer ‐ Hardware 20.0% 51.1 6.0 2.1 55.0 43.3 3.7 ‐ 47.0 7.945 1921 Computer ‐ Hardware post Mar 22/04 20.0% ‐ ‐ ‐ ‐ ‐ ‐ ‐ ‐ ‐
45.1 1921 Computer ‐ Hardware post Mar 19/07 20.0% ‐ ‐ ‐ ‐ ‐ ‐ ‐ ‐ ‐12 1925 Computer Software 20.0% 167.8 23.7 0.0 191.4 120.7 16.6 ‐ 137.3 54.210 1930ATransportation Equipment ‐ Automobiles 25.0% 2.0 ‐ ‐ 2.0 1.6 0.2 ‐ 1.8 0.210 1930B Transportation Equipment ‐ Trucks <3 tonnes 20.0% 9.8 1.8 ‐ 11.6 7.8 0.9 ‐ 8.7 2.910 1930C Transportation Equipment ‐ Trucks >3 tonnes 12.5% 53.4 8.8 ‐ 62.2 34.9 4.0 ‐ 38.9 23.310 1930DTransportation Equipment ‐ Work and Service 12.5% 2.5 ‐ ‐ 2.5 1.9 0.1 ‐ 2.0 0.58 1935 Stores Equipment 10.0% 5.5 ‐ ‐ 5.5 5.5 0.0 ‐ 5.5 0.08 1940 Tools, Shop & Garage Equipment 10.0% 32.6 1.6 ‐ 34.3 23.8 1.4 ‐ 25.3 9.08 1945 Measurement & Testing Equipment 10.0% 4.5 ‐ ‐ 4.5 4.2 0.1 ‐ 4.3 0.38 1950 Power operated Equipment 12.5% ‐ ‐ ‐ ‐ ‐ ‐ ‐ ‐ ‐8 1955 Communications Equipment 20.0% 30.6 0.3 ‐ 31.0 25.2 1.9 ‐ 27.1 3.88 1960 Graphics Equipment 10.0% 0.1 ‐ ‐ 0.1 0.1 ‐ ‐ 0.1 ‐
47 1965 Water Heater Rental Units 10.0% ‐ ‐ ‐ ‐ ‐ ‐ ‐ ‐ ‐47 1970 Load Management Controls 10.0% 14.8 ‐ ‐ 14.8 7.7 1.3 ‐ 9.1 5.847 1975 Load Management Controls Utility Premises 10.0% 0.6 ‐ ‐ 0.6 0.6 ‐ ‐ 0.6 ‐47 1980 System Supervisor Equipment 6.7% 53.2 11.7 ‐ 64.9 33.9 2.5 ‐ 36.5 28.547 1985 Miscellaneous Fixed Assets 10.0% ‐ ‐ ‐ ‐ 0.0 ‐ ‐ 0.0 (0.0)47 1996 Hydro One S/S Contribution ‐ ‐ ‐ ‐ ‐ ‐ ‐ ‐ ‐47 1995 Contributions & Grants 4.0% (252.0) (17.9) 0.0 (269.9) (43.4) (9.7) ‐ (53.1) (216.8)10 2005 Property Under Capital Lease 25% 0.9 0.9 ‐ 0.9
Total 3,969.2 368.8 24.8 4,313.1 2,172.4 167.0 ‐ 2,339.4 1,973.7
Note 1: Components may not add up exactly to Total due to rounding.Note 2: Depreciation for "2005 ‐ Property under Capital Lease" is included in "1930 ‐ transportation Equipment ‐ Automobiles"
Cost Accumulated Depreciation
2010 TestAppendix A: Fixed Asset Continuity Schedule ($ millions)
Toronto Hydro-Electric System Limited EB-2009-0139
Exhibit R1 Tab 11
Schedule 17 Filed: 2009 Nov 30
Page 1 of 1
INTERROGATORIES OF VULNERABLE ENERGY CONSUMERS COALITION
Witness Panel(s): 3
INTERROGATORY 17: 1
Reference(s): Exhibits D1 Tab 3 Schedule 1 Table 1 2
Exhibit F1 Tab1 Schedule 1 3
4
a) Provide a version of Table 1 that separates Controllable O&M Expense from 5
Amortization by inserting a line Subtotal Controllable O&M Expense. 6
b) Insert lines showing the annual year over year Increases and % increases for both 7
Controllable O&M Expense and Amortization. 8
9
RESPONSE: 10
See Appendix A of this Schedule. 11
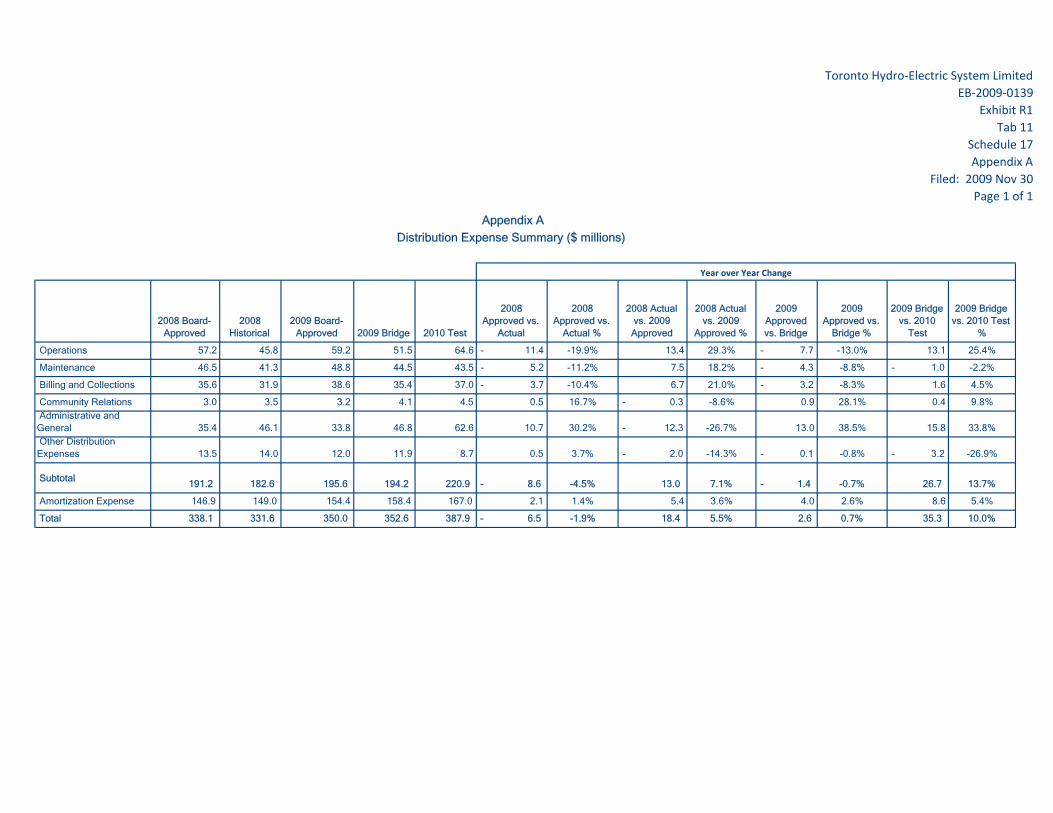
Toronto Hydro‐Electric System LimitedEB‐2009‐0139
Exhibit R1Tab 11
Schedule 17Appendix A
Filed: 2009 Nov 30Page 1 of 1
2008 Board-Approved
2008 Historical
2009 Board-Approved 2009 Bridge 2010 Test
2008 Approved vs.
Actual
2008 Approved vs.
Actual %
2008 Actual vs. 2009 Approved
2008 Actual vs. 2009
Approved %
2009 Approved vs. Bridge
2009 Approved vs.
Bridge %
2009 Bridge vs. 2010
Test
2009 Bridge vs. 2010 Test
%
Operations 57.2 45.8 59.2 51.5 64.6 - 11.4 -19.9% 13.4 29.3% - 7.7 -13.0% 13.1 25.4%
Maintenance 46.5 41.3 48.8 44.5 43.5 - 5.2 -11.2% 7.5 18.2% - 4.3 -8.8% - 1.0 -2.2%
Billing and Collections 35.6 31.9 38.6 35.4 37.0 - 3.7 -10.4% 6.7 21.0% - 3.2 -8.3% 1.6 4.5%
Community Relations 3.0 3.5 3.2 4.1 4.5 0.5 16.7% - 0.3 -8.6% 0.9 28.1% 0.4 9.8% Administrative and General 35.4 46.1 33.8 46.8 62.6 10.7 30.2% - 12.3 -26.7% 13.0 38.5% 15.8 33.8% Other Distribution Expenses 13.5 14.0 12.0 11.9 8.7 0.5 3.7% - 2.0 -14.3% - 0.1 -0.8% - 3.2 -26.9%
Subtotal 191.2 182.6 195.6 194.2 220.9 - 8.6 -4.5% 13.0 7.1% - 1.4 -0.7% 26.7 13.7%
Amortization Expense 146.9 149.0 154.4 158.4 167.0 2.1 1.4% 5.4 3.6% 4.0 2.6% 8.6 5.4%
Total 338.1 331.6 350.0 352.6 387.9 - 6.5 -1.9% 18.4 5.5% 2.6 0.7% 35.3 10.0%
Appendix A
Distribution Expense Summary ($ millions)
Year over Year Change
Toronto Hydro-Electric System Limited EB-2009-0139
Exhibit R1 Tab 11
Schedule 18 Filed: 2009 Nov 30
Page 1 of 2
INTERROGATORIES OF VULNERABLE ENERGY CONSUMERS COALITION
Witness Panel(s): 5
INTERROGATORY 18: 1
Reference(s): Exhibit D1 Tab 3 Schedule 1 Table 1 2
Exhibit F1 Tab1 Schedule1 Table 1 3
4
Trends in OM&A are important to understanding efficiency gains and comparisons to 5
similar distributors 6
a) With regard to benchmarking THESL’s historic OM&A costs, confirm/correct the 7
base data for 2005 and 2007 shown in the file “Comparison of Distributors (EB-2006-8
0268)” found on the OEB web site: http://www.oeb.gov.on.ca/OEB/_Documents/EB-9
2006-0268/Comparison_of_Distributors_with_2007_data.xls 10
11
2007 2006 2005
$167,979,422 $154,607,722 $157,441,700
12
b) For the historic and bridge years 2008-2009 compute the THESL OM&A cost per 13
customer. 14
c) Compute the OM&A per kilowatt hour of energy distributed for the years 2005-2009. 15
d) Compute the year over year percentage increases and discuss trends in OM&A per 16
customer and per Kilowatt hr of energy distributed .2005-2009. 17
e) Compute the forecast metrics (OM&A/customer and per kWh distributed) for 2010 18
and discuss the changes relative to 2005-2009 and the implied trend. 19
20
RESPONSE: 21
a) 2008 EDR and 2010 EDR data is available for comparative purposes. 22
23
b) See Appendix A of this Schedule. 24
25
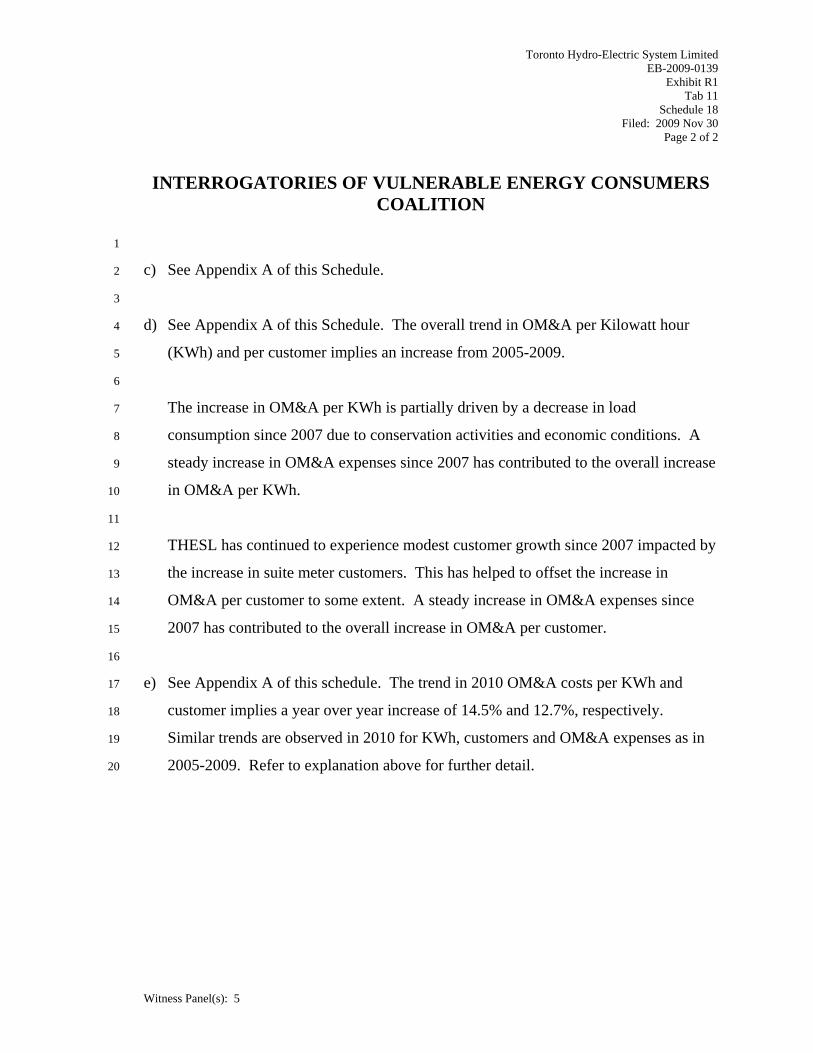
Toronto Hydro-Electric System Limited EB-2009-0139
Exhibit R1 Tab 11
Schedule 18 Filed: 2009 Nov 30
Page 2 of 2
INTERROGATORIES OF VULNERABLE ENERGY CONSUMERS COALITION
Witness Panel(s): 5
1
c) See Appendix A of this Schedule. 2
3
d) See Appendix A of this Schedule. The overall trend in OM&A per Kilowatt hour 4
(KWh) and per customer implies an increase from 2005-2009. 5
6
The increase in OM&A per KWh is partially driven by a decrease in load 7
consumption since 2007 due to conservation activities and economic conditions. A 8
steady increase in OM&A expenses since 2007 has contributed to the overall increase 9
in OM&A per KWh. 10
11
THESL has continued to experience modest customer growth since 2007 impacted by 12
the increase in suite meter customers. This has helped to offset the increase in 13
OM&A per customer to some extent. A steady increase in OM&A expenses since 14
2007 has contributed to the overall increase in OM&A per customer. 15
16
e) See Appendix A of this schedule. The trend in 2010 OM&A costs per KWh and 17
customer implies a year over year increase of 14.5% and 12.7%, respectively. 18
Similar trends are observed in 2010 for KWh, customers and OM&A expenses as in 19
2005-2009. Refer to explanation above for further detail. 20
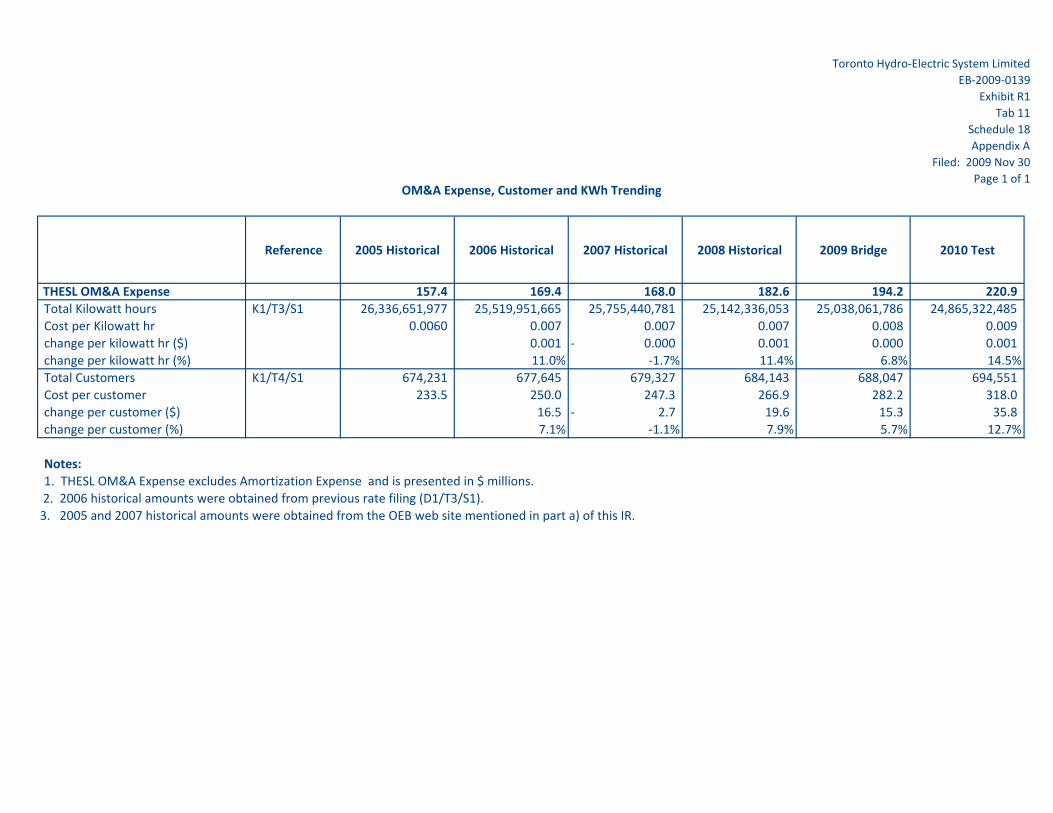
Toronto Hydro‐Electric System LimitedEB‐2009‐0139
Exhibit R1Tab 11
Schedule 18Appendix A
Filed: 2009 Nov 30Page 1 of 1
Reference 2005 Historical 2006 Historical 2007 Historical 2008 Historical 2009 Bridge 2010 Test
THESL OM&A Expense 157.4 169.4 168.0 182.6 194.2 220.9 Total Kilowatt hours K1/T3/S1 26,336,651,977 25,519,951,665 25,755,440,781 25,142,336,053 25,038,061,786 24,865,322,485 Cost per Kilowatt hr 0.0060 0.007 0.007 0.007 0.008 0.009 change per kilowatt hr ($) 0.001 0.000‐ 0.001 0.000 0.001 change per kilowatt hr (%) 11.0% ‐1.7% 11.4% 6.8% 14.5%Total Customers K1/T4/S1 674,231 677,645 679,327 684,143 688,047 694,551 Cost per customer 233.5 250.0 247.3 266.9 282.2 318.0 change per customer ($) 16.5 2.7‐ 19.6 15.3 35.8 change per customer (%) 7.1% ‐1.1% 7.9% 5.7% 12.7%
Notes:1. THESL OM&A Expense excludes Amortization Expense and is presented in $ millions. 2. 2006 historical amounts were obtained from previous rate filing (D1/T3/S1). 3. 2005 and 2007 historical amounts were obtained from the OEB web site mentioned in part a) of this IR.
OM&A Expense, Customer and KWh Trending
Toronto Hydro-Electric System Limited EB-2009-0139
Exhibit R1 Tab 11
Schedule 19 Filed: 2009 Nov 30
Page 1 of 2
INTERROGATORIES OF VULNERABLE ENERGY CONSUMERS COALITION
Witness Panel(s): 3
INTERROGATORY 19: 1
Reference(s): Exhibit D1, Tab7 Schedule 1 Page 20 2
Exhibit D1 Tab 10, Schedule 4. Page 6 3
4
a) Reconcile explain the amount of $423.6 million shown for 2010 CAPEX with the 5
amount of $366.6 million shown in the Ten year Capital Plan (pages 6 and 43). 6
7
RESPONSE: 8
The summary of Capital Budget as shown on page 19 of 20 in Exhibit D1, Tab 7, 9
Schedule 1 is correct. Line item labeled “Total Sustaining Capital” with $157.0 M is 10
common and identical to both documents. Line items labeled “Reactive Work” with 11
$22.5M, Customer Connections” with $32.5M, and “Customer Capital Contribution” 12
with ($24.4M) are common and identical to both documents. 13
14
Line item “Asset Management” with $2.8M in Exhibit D1, Tab 7, Schedule 1 has been 15
included in the Stations System Enhancement Exhibit D1, Tab 8, Schedule 10. 16
17
Line item “Engineering Capital” with $31.2M in Exhibit D1, Tab 7, Schedule 1 does not 18
correspond to the line item “Engineering Capital” with $30.1M in Exhibit D1, Tab 8, 19
Schedule 10. Engineering Capital is a function of Total Capital and the $30.1M 20
represents a number derived from a previous iteration of a smaller capital. The Line Item 21
“Engineering Capital” with $31.2M Exhibit D1, Tab 7, Schedule 1 will remain as is and 22
the line item “Engineering Capital” with $30.1M in Exhibit D1, Tab 8, Schedule 10 will 23
be revised to $31.2M. 24
25
Toronto Hydro-Electric System Limited EB-2009-0139
Exhibit R1 Tab 11
Schedule 19 Filed: 2009 Nov 30
Page 2 of 2
INTERROGATORIES OF VULNERABLE ENERGY CONSUMERS COALITION
Witness Panel(s): 3
Line item “AFUDC” with $4.4Min Exhibit D1, Tab 7, Schedule 1 (Allowance for Funds 1
Used During Construction ) was not considered in the 2010-2019 Electrical Distribution 2
Capital as it is a financial concept that does not need to be considered for Capital 3
Construction Projects.All line items within General Plan, Customer Services and 4
Information Technology in Exhibit D1, Tab 7, Schedule 1 (Total of $75.6M), are not 5
captured in the 2010-2019 Electrical Distribution Capital Plan in Exhibit D1, Tab 8, 6
Schedule 10. 7
8
Line items “Standardization”, Downtown Contigency”, “FESI 7 / WPF”, “Smart Grid 9
Operations”, “Externally Initiated Plant Relocations”, and “Secondary Upgrade” are 10
common and identical in both documents. 11
12
Line item “Stations System Enhancements” with $15.2M in Exhibit D1, Tab 7, Schedule 13
1 is short by $2.8M as explained earlier and once considered does equate to the $18.0M 14
as shown in line item “Stations System Enhancements” in Exhibit D1, Tab 8, Schedule 15
10. 16

Toronto Hydro-Electric System Limited EB-2009-0139
Exhibit R1 Tab 11
Schedule 20 Filed: 2009 Nov 30
Page 1 of 2
INTERROGATORIES OF VULNERABLE ENERGY CONSUMERS COALITION
Witness Panel(s): 3
INTERROGATORY 20: 1
Reference(s): Exhibit D1, Tab7 Schedule 1 Page 20
Exhibit D1 T9 S5 page 4 Table 1
2
a) Provide an explanation for the differences in the 2008 Historical and 2009 Bridge 3
year figures for plant relocations. 4
b) If as stated, plant relocations are driven by City and TTC infrastructure development, 5
please provide the details how cost sharing/recovery works and what the costs and 6
recoveries are in 2009 and forecast for 2010. 7
c) Provide details of the $27.6 million cost in 2010 in terms of major projects >$1 8
million including costs of asset retirement/replacement and relocation. 9
RESPONSE: 10
a) In Exhibit D1, Tab 9, Schedule 5, below Table 1, it is noted that the 2008 Historical 11
and 2009 Bridge Gross amounts are captured in the sustaining capital programs and 12
are not shown separately in the summary table in Exhibit D1, Tab 7, Schedule 1. 13
Starting 2010 THESL decided to identify these externally initiated plant relocation 14
projects separately from other programs due to the large number of anticipated 15
requests from external agencies (particularly due to various level of Governments 16
stimulus package). Until then these projects were included within existing THESL 17
sustaining capital programs. 18
19
b) The Government of Ontario’s Public Service Works on Highway Act, R.S.O. 1990, 20
Chapter P.49, provides the formula on cost sharing/recovery arrangements between 21
the Utilities and all road authorities (i.e., Government/City) on those projects that 22
requires the Utilities plant relocation projects. This cost sharing/recovery act 23

Toronto Hydro-Electric System Limited EB-2009-0139
Exhibit R1 Tab 11
Schedule 20 Filed: 2009 Nov 30
Page 2 of 2
INTERROGATORIES OF VULNERABLE ENERGY CONSUMERS COALITION
Witness Panel(s): 3
stipulates that THESL pay 100 percent of materials used on plant relocation projects. 1
However, the associated labour and vehicle cost are shared 50:50. (50 percent by 2
THESL and 50 percent by the requester). All TTC-initiated plant relocation projects 3
are paid by the TTC 100 percent. 4
5
c) See response to Board Staff interrogatory #75 a). 6
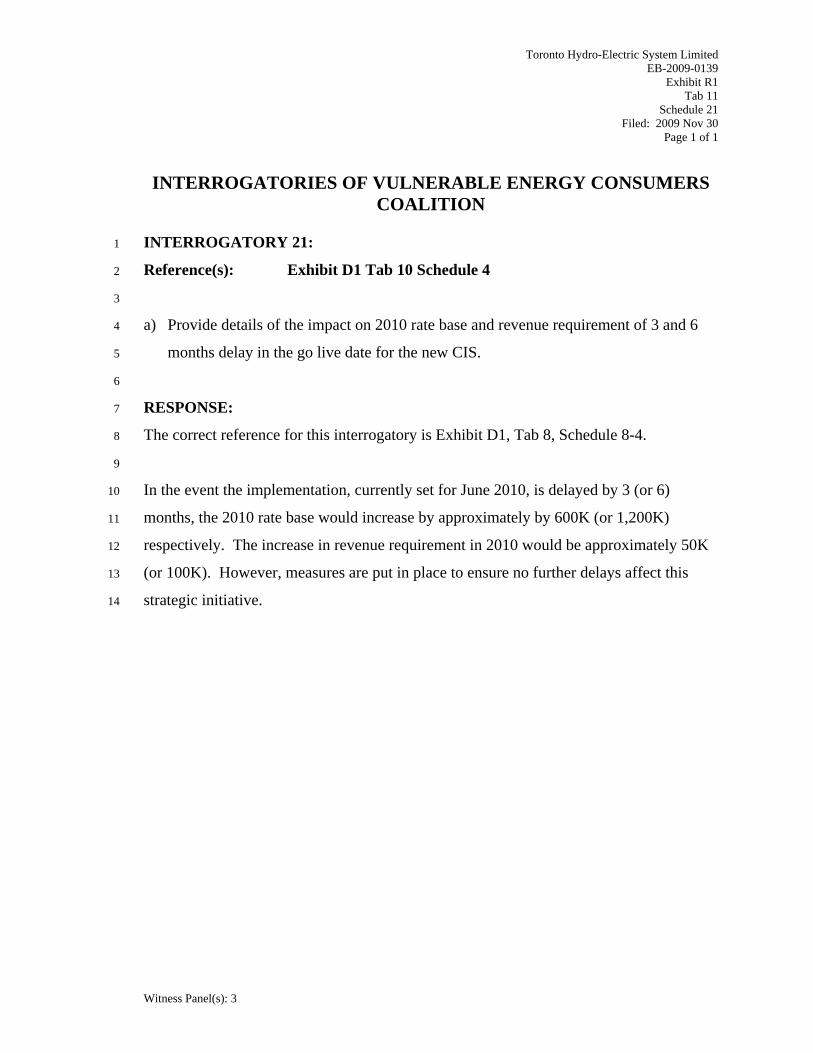
Toronto Hydro-Electric System Limited EB-2009-0139
Exhibit R1 Tab 11
Schedule 21 Filed: 2009 Nov 30
Page 1 of 1
INTERROGATORIES OF VULNERABLE ENERGY CONSUMERS COALITION
Witness Panel(s): 3
INTERROGATORY 21: 1
Reference(s): Exhibit D1 Tab 10 Schedule 4 2
3
a) Provide details of the impact on 2010 rate base and revenue requirement of 3 and 6 4
months delay in the go live date for the new CIS. 5
6
RESPONSE: 7
The correct reference for this interrogatory is Exhibit D1, Tab 8, Schedule 8-4. 8
9
In the event the implementation, currently set for June 2010, is delayed by 3 (or 6) 10
months, the 2010 rate base would increase by approximately by 600K (or 1,200K) 11
respectively. The increase in revenue requirement in 2010 would be approximately 50K 12
(or 100K). However, measures are put in place to ensure no further delays affect this 13
strategic initiative. 14
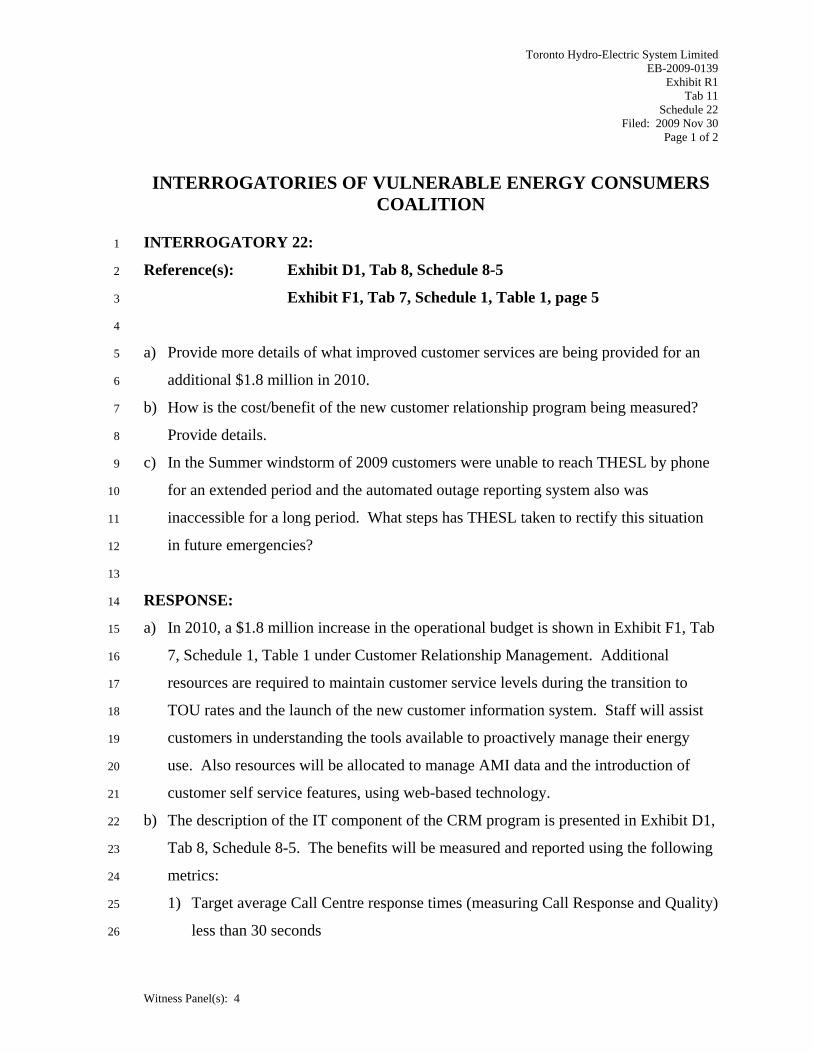
Toronto Hydro-Electric System Limited EB-2009-0139
Exhibit R1 Tab 11
Schedule 22 Filed: 2009 Nov 30
Page 1 of 2
INTERROGATORIES OF VULNERABLE ENERGY CONSUMERS COALITION
Witness Panel(s): 4
INTERROGATORY 22: 1
Reference(s): Exhibit D1, Tab 8, Schedule 8-5 2
Exhibit F1, Tab 7, Schedule 1, Table 1, page 5 3
4
a) Provide more details of what improved customer services are being provided for an 5
additional $1.8 million in 2010. 6
b) How is the cost/benefit of the new customer relationship program being measured? 7
Provide details. 8
c) In the Summer windstorm of 2009 customers were unable to reach THESL by phone 9
for an extended period and the automated outage reporting system also was 10
inaccessible for a long period. What steps has THESL taken to rectify this situation 11
in future emergencies? 12
13
RESPONSE: 14
a) In 2010, a $1.8 million increase in the operational budget is shown in Exhibit F1, Tab 15
7, Schedule 1, Table 1 under Customer Relationship Management. Additional 16
resources are required to maintain customer service levels during the transition to 17
TOU rates and the launch of the new customer information system. Staff will assist 18
customers in understanding the tools available to proactively manage their energy 19
use. Also resources will be allocated to manage AMI data and the introduction of 20
customer self service features, using web-based technology. 21
b) The description of the IT component of the CRM program is presented in Exhibit D1, 22
Tab 8, Schedule 8-5. The benefits will be measured and reported using the following 23
metrics: 24
1) Target average Call Centre response times (measuring Call Response and Quality) 25
less than 30 seconds 26

Toronto Hydro-Electric System Limited EB-2009-0139
Exhibit R1 Tab 11
Schedule 22 Filed: 2009 Nov 30
Page 2 of 2
INTERROGATORIES OF VULNERABLE ENERGY CONSUMERS COALITION
Witness Panel(s): 4
2) Improved customer satisfaction against benchmark surveys completed in 2008. 1
Surveys will assess customer experience across key touch points: service 2
reliability, customer service, service offerings and communications 3
3) Key Performance Indicators will set targets and track performance 4
5
c) THESL has made improvements to the Interactive Voice Response System (IVR) to 6
increase the volume of calls that can simultaneously access our telephone and 7
automated reporting system. Also, the location of the outage message has been 8
moved, so customers can hear the information immediately. This reduces customer 9
wait time and increases the capacity to handle customer calls. The number of staff 10
trained to handle power outage and emergency calls has been increased, and a more 11
efficient after-hours staff call-in process has been implemented. 12

Toronto Hydro-Electric System Limited EB-2009-0139
Exhibit R1 Tab 11
Schedule 23 Filed: 2009 Nov 30
Page 1 of 1
INTERROGATORIES OF VULNERABLE ENERGY CONSUMERS COALITION
Witness Panel(s): 3
INTERROGATORY 23: 1
Reference(s): Exhibit D1, Tab 9, Schedule 7 2
3
a) Provide a Schedule showing all CAPEX and OM&A costs in 2010 related to 4
remediation as a result of the Level III contact voltage remediation emergency. 5
b) Provide a copy of the multi-year CV remediation program. 6
7
RESPONSE: 8
a) In addition to this follow up work to the Level III contact voltage remediation 9
emergency of $6.5 million, two capital programs have been proposed related to the 10
standardization of equipment arising from the contact voltage remediation 11
emergency: 12
Handwell standardization: $9.2 million (refer to Exhibit D1, Tab 9, Schedule 1) and 13
distribution cable serving street lighting standardization: $5.2 million (refer to 14
Exhibit D1, Tab 9, Schedule 1) 15
16
One OM&A program has been proposed related to the contact voltage remediation 17
emergency: 18
Contact voltage scan in the predictive maintenance program: $4.4 million (refer to 19
Exhibit F1, Tab 1, Schedule 4) 20
21
b) A three-year OM&A program is proposed for contact voltage scanning in the 22
predictive maintenance program with Power Survey Company for the use of an 23
approved proprietary system to scan the city for potential of contact voltage four 24
times a year. The program is described in Exhibit F1, Tab 1, Schedule 4, pages 5 and 25
6. 26

Toronto Hydro-Electric System Limited EB-2009-0139
Exhibit R1 Tab 11
Schedule 24 Filed: 2009 Nov 30
Page 1 of 1
INTERROGATORIES OF VULNERABLE ENERGY CONSUMERS COALITION
Witness Panel(s): 5
INTERROGATORY 24: 1
Reference(s): Exhibit E1 Tab1 Schedule1 page 3 2
3
a) Will THESL update the forecast coupon rate for the new debt issue and/or provide 4
this as soon as available? 5
b) What happens to your answer to part a) if the Coupon rate is different from forecast 6
but the Board has not issued its Decision? 7
c) Provide the basis of the proposed coupon rate of 5.75% - sources of forecast etc. 8
9
RESPONSE: 10
a) Please see response to Board Staff interrogatory #83. 11
12
b) THESL is prepared to update its cost of capital up to the time of rate finalization for 13
actual debt issuances only. However, for obvious reasons, THESL cannot be 14
expected to update forecast debt costs on an ongoing basis in a forward test year 15
framework. 16
17
c) Please see response to BOMA interrogatory 45 e). 18

Toronto Hydro-Electric System Limited EB-2009-0139
Exhibit R1 Tab 11
Schedule 25 Filed: 2009 Nov 30
Page 1 of 2
INTERROGATORIES OF VULNERABLE ENERGY CONSUMERS COALITION
Witness Panel(s): 5
INTERROGATORY 25: 1
Reference(s): Exhibit E1 Tab4 Schedule1 and Schedule 2 2
3
a) Provide the details of the calculation supporting the Long and Medium Term debt 4
principle amount of $1,210.9 million for 2010 in Schedule 1 and reconcile this with 5
the amount of average monthly debt of $1,277,491,219 shown in Schedule 2. 6
b) For Cost of Capital calculation purposes confirm that the amount in Schedule 1 7
($1,210.9 million is the appropriate principle amount). 8
c) Show how the forecast LMT Debt average coupon rate of 5.60% was calculated. 9
d) Confirm that this coupon rate as well as the ST debt rate will be updated as soon as 10
available. 11
12
RESPONSE: 13
a) The $1,210.9 million shown in Exhibit E1, Tab 4, Schedule 1 is the deemed long-14
term debt component of the capital structure. The $1,277,491,219 is the forecast 15
actual average of monthly debt outstanding for the Test Year. 16
17
b) For computation of the overall cost of capital, the deemed capital structure – and 18
deemed medium and long term debt component – is the value to use. 19
20
c) The 5.60% is calculated from the Total Carrying costs (7, Row 8) of $71,596,043 21
divided by the average of monthly debt outstanding (Exhibit E1, Tab 4, Schedule 2, 22
Column 4, Row 8) of $1,277,491,219. 23
24
d) Please see response to Board Staff interrogatory #83. THESL will incorporate the 25
Board-Approved ROE and Short-term Debt rate according to the established Cost of 26

Toronto Hydro-Electric System Limited EB-2009-0139
Exhibit R1 Tab 11
Schedule 25 Filed: 2009 Nov 30
Page 2 of 2
INTERROGATORIES OF VULNERABLE ENERGY CONSUMERS COALITION
Witness Panel(s): 5
Capital Guidelines, when the information is available. 1

Toronto Hydro-Electric System Limited EB-2009-0139
Exhibit R1 Tab 11
Schedule 26 Filed: 2009 Nov 30
Page 1 of 3
INTERROGATORIES OF VULNERABLE ENERGY CONSUMERS COALITION
Witness Panel(s): 4
INTERROGATORY 26: 1
Reference(s): Exhibit F1 Tab 1 Schedule 1, Table 2 2
Exhibit F1 Tab 1 Schedule 2 Table 1 3
4
The major increases between 2009 Bridge year and 2010 Test year can be attributed to 5
the Contact Voltage Scan in the Maintenance Program, Time-of-Use in Customer 6
Services and work force staffing in Operations Support. 7
a) How much of the increase in maintenance cost is related to the contact voltage 8
scanning? Provide estimates of 2010 contractor costs and THESL in-house costs 9
b) Provide a copy of the PSC contract and/or the basis on which THESL is being 10
charged $4.1 million for the services. 11
c) Exhibit F1 Tab 1Schedule 4 page 6 lists the 2010 scanning accomplishment as 630 12
square km. Explain why, since the scans are along streets/boulevards on the SEL 13
system a better metric is not linear km scanned. List the basis of the contractor’s 14
charges – square km or linear km or other metric per the contract. 15
d) Explain why the preventative maintenance costs for street lighting asset verification 16
(lines 18-20) be included in THESL[’]s 2010 operating budget until the Board has 17
made a determination that these are distribution assets. 18
e) Identify and list with references, all other operating and capital items related to 19
THESI Street lighting assets in the 2010 budgets. 20
f) For the tree trimming operations budget provide the actual costs and accomplishment 21
for 2008, 2009 and forecast 2010 based on feeder km trimmed22
23
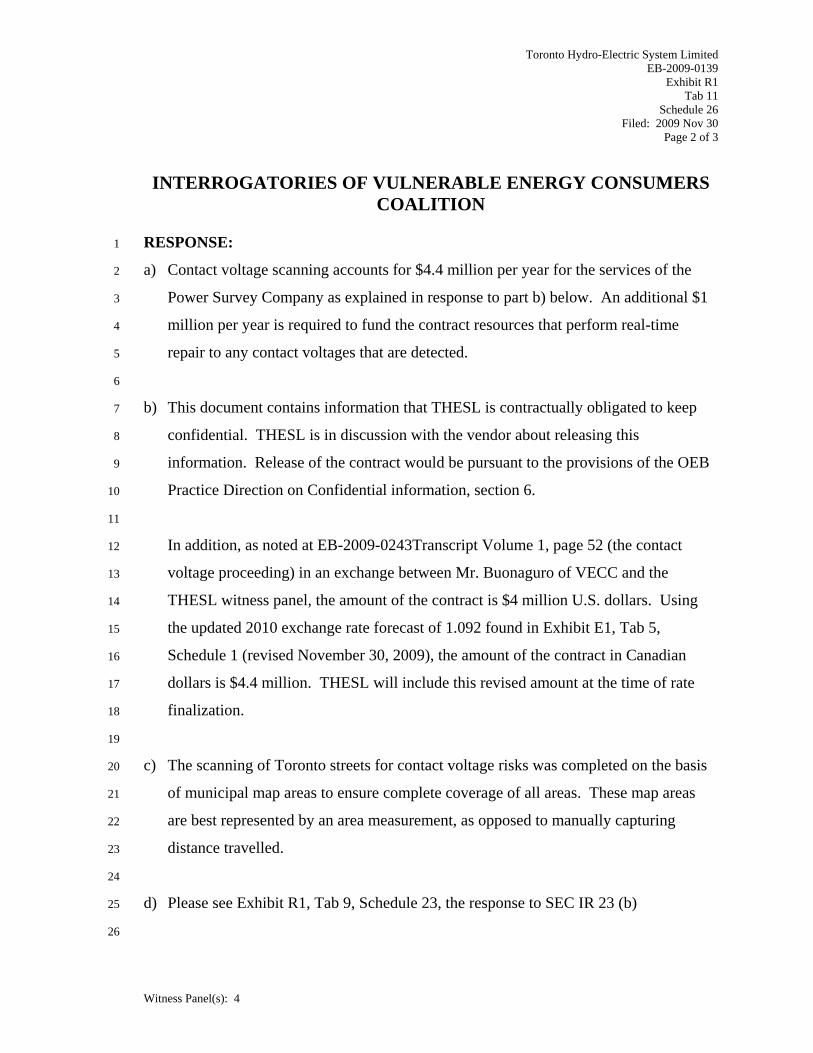
Toronto Hydro-Electric System Limited EB-2009-0139
Exhibit R1 Tab 11
Schedule 26 Filed: 2009 Nov 30
Page 2 of 3
INTERROGATORIES OF VULNERABLE ENERGY CONSUMERS COALITION
Witness Panel(s): 4
RESPONSE: 1
a) Contact voltage scanning accounts for $4.4 million per year for the services of the 2
Power Survey Company as explained in response to part b) below. An additional $1 3
million per year is required to fund the contract resources that perform real-time 4
repair to any contact voltages that are detected. 5
6
b) This document contains information that THESL is contractually obligated to keep 7
confidential. THESL is in discussion with the vendor about releasing this 8
information. Release of the contract would be pursuant to the provisions of the OEB 9
Practice Direction on Confidential information, section 6. 10
11
In addition, as noted at EB-2009-0243Transcript Volume 1, page 52 (the contact 12
voltage proceeding) in an exchange between Mr. Buonaguro of VECC and the 13
THESL witness panel, the amount of the contract is $4 million U.S. dollars. Using 14
the updated 2010 exchange rate forecast of 1.092 found in Exhibit E1, Tab 5, 15
Schedule 1 (revised November 30, 2009), the amount of the contract in Canadian 16
dollars is $4.4 million. THESL will include this revised amount at the time of rate 17
finalization. 18
19
c) The scanning of Toronto streets for contact voltage risks was completed on the basis 20
of municipal map areas to ensure complete coverage of all areas. These map areas 21
are best represented by an area measurement, as opposed to manually capturing 22
distance travelled. 23
24
d) Please see Exhibit R1, Tab 9, Schedule 23, the response to SEC IR 23 (b) 25
26
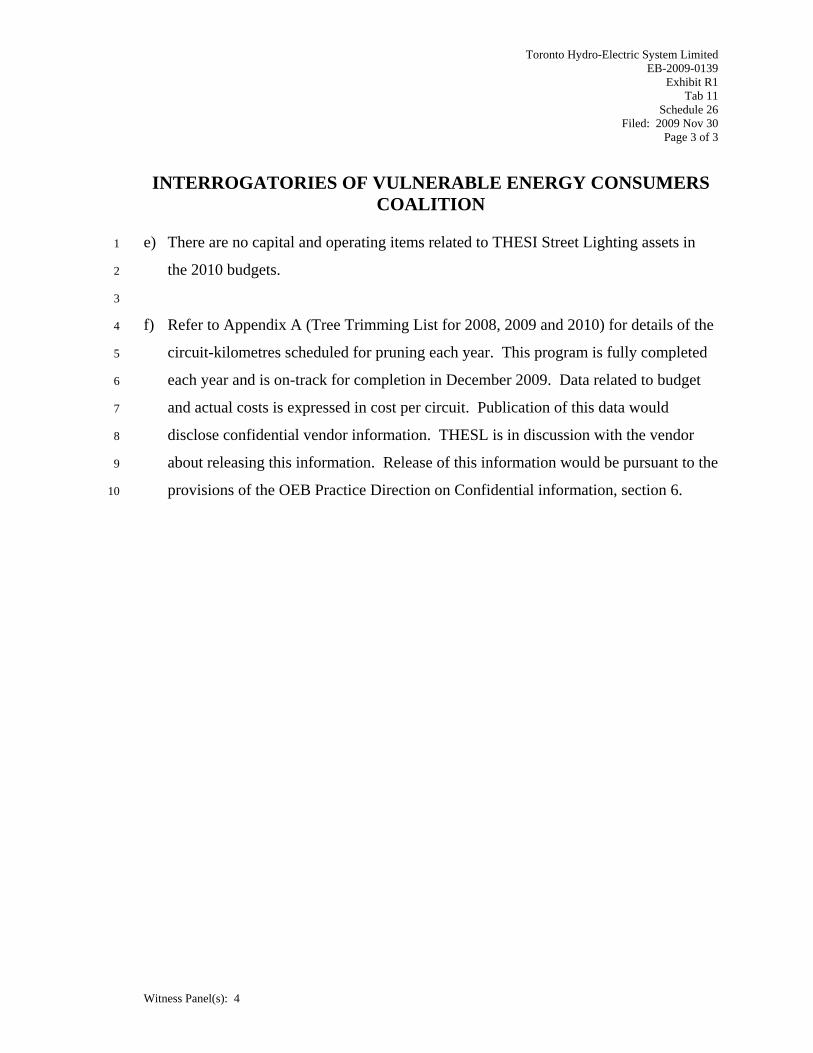
Toronto Hydro-Electric System Limited EB-2009-0139
Exhibit R1 Tab 11
Schedule 26 Filed: 2009 Nov 30
Page 3 of 3
INTERROGATORIES OF VULNERABLE ENERGY CONSUMERS COALITION
Witness Panel(s): 4
e) There are no capital and operating items related to THESI Street Lighting assets in 1
the 2010 budgets. 2
3
f) Refer to Appendix A (Tree Trimming List for 2008, 2009 and 2010) for details of the 4
circuit-kilometres scheduled for pruning each year. This program is fully completed 5
each year and is on-track for completion in December 2009. Data related to budget 6
and actual costs is expressed in cost per circuit. Publication of this data would 7
disclose confidential vendor information. THESL is in discussion with the vendor 8
about releasing this information. Release of this information would be pursuant to the 9
provisions of the OEB Practice Direction on Confidential information, section 6. 10
Toronto Hydro-Electric System LimitedEB-2009-0139
Exhibit R1Tab 11
Schedule 26Appendix A
Filed: 2009 Nov 30Page 1 of 31
Circuit Substation Name
ALB Yes or
No Priority Substation Address Former Municipality VoltageCircuit
Length (Km)Approx. # of Units
Quote(Standard Prunning)
ETNF1 ALLENBY MS Y 1 2310 Islington Ave. ETOBICOKE 4.16 kV 3.38ETNF2 ALLENBY MS Y 2 2310 Islington Ave. ETOBICOKE 4.16 kV 7.23ETNF3 ALLENBY MS Y 3 2310 Islington Ave. ETOBICOKE 4.16 kV 1.51NY53M24 BERMONDSEY II TS N 4 178 BERMONDSEY RD. NORTH YORK 27.6 kV 4.17NY53M25 BERMONDSEY II TS N 5 178 BERMONDSEY RD. NORTH YORK 27.6 kV 10.12NY53M26 BERMONDSEY II TS N 6 178 BERMONDSEY RD. NORTH YORK 27.6 kV 6.92NY53M27 BERMONDSEY II TS N 7 178 BERMONDSEY RD. NORTH YORK 27.6 kV 1.57NY53M28 BERMONDSEY II TS N 8 178 BERMONDSEY RD. NORTH YORK 27.6 kV 3.9NYSS23F2 BOND MS N 9 130 Bond Ave NORTH YORK 4.16 kV 2.04ETWCF1 ELMHURST MS Y 10 62 Elmhurst Dr ETOBICOKE 4.16 kV 6.81ETWCF2 ELMHURST MS Y 11 62 Elmhurst Dr ETOBICOKE 4.16 kV 1.47ETWCF3 ELMHURST MS Y 12 62 Elmhurst Dr ETOBICOKE 4.16 kV 1.39NY53M1 BERMONDSEY I TS N 13 178 BERMONDSEY RD. NORTH YORK 27.6 kV 2.06NY53M10 BERMONDSEY I TS N 14 178 BERMONDSEY RD. NORTH YORK 27.6 kV 4.82NY53M2 BERMONDSEY I TS N 15 178 BERMONDSEY RD. NORTH YORK 27.6 kV 1.06NY53M5 BERMONDSEY I TS N 16 178 BERMONDSEY RD NORTH YORK 27 6 kV 8 22
Price Form 12008 Maintenance Pruning Circuit List and Quotation
NY53M5 BERMONDSEY I TS N 16 178 BERMONDSEY RD. NORTH YORK 27.6 kV 8.22NY53M6 BERMONDSEY I TS N 17 178 BERMONDSEY RD. NORTH YORK 27.6 kV 9.16NY53M8 BERMONDSEY I TS N 18 178 BERMONDSEY RD. NORTH YORK 27.6 kV 17.84NY53M9 BERMONDSEY I TS N 19 178 BERMONDSEY RD. NORTH YORK 27.6 kV 3.6ETZJF1 METEOR MS Y 20 139 Carlingview Dr ETOBICOKE 13.8 kV 0.97ETZJF2 METEOR MS Y 21 139 Carlingview Dr ETOBICOKE 13.8 kV 4.74ETLDF1 CLOVERDALE MALL MS N 22 250 The East Mall ETOBICOKE 4.16 kV 3.49ETUAF1 WATERCLIFFE MS Y 23 40 A Watercliffe Rd ETOBICOKE 4.16 kV 2.24ETUAF2 WATERCLIFFE MS Y 24 40 A Watercliffe Rd ETOBICOKE 4.16 kV 2.64ETUAF3 WATERCLIFFE MS Y 25 40 A Watercliffe Rd ETOBICOKE 4.16 kV 0.85ETEQF1 ENTERPRISE MS Y 26 74 Leading Road ETOBICOKE 13.8 kV 2.78ETEQF2 ENTERPRISE MS Y 27 74 Leading Road ETOBICOKE 13.8 kV 1.38ETEQF3 ENTERPRISE MS Y 28 74 Leading Road ETOBICOKE 13.8 kV 5.15ETNGF1 BRAEBURN MS Y 29 15 Arcot Blvd ETOBICOKE 4.16 kV 2.32
Price Form 12008 Maintenance Pruning Circuit List and Quotation
Page 1 of 31
Toronto Hydro-Electric System LimitedEB-2009-0139
Exhibit R1Tab 11
Schedule 26Appendix A
Filed: 2009 Nov 30Page 2 of 31
Circuit Substation Name
ALB Yes or
No Priority Substation Address Former Municipality VoltageCircuit
Length (Km)Approx. # of Units
Quote(Standard Prunning)
Price Form 12008 Maintenance Pruning Circuit List and Quotation
ETNGF2 BRAEBURN MS Y 30 15 Arcot Blvd ETOBICOKE 4.16 kV 0.6ETNGF3 BRAEBURN MS Y 31 15 Arcot Blvd ETOBICOKE 4.16 kV 1.06ETNGF4 BRAEBURN MS Y 32 15 Arcot Blvd ETOBICOKE 4.16 kV 0.81NYSS59F1 BROADLANDS MS N 33 1 Broadlands Blvd NORTH YORK 4.16 kV 3.33NYSS59F2 BROADLANDS MS N 34 1 Broadlands Blvd NORTH YORK 4.16 kV 2.31NYSS59F3 BROADLANDS MS N 35 1 Broadlands Blvd NORTH YORK 4.16 kV 2.04NYSS59F6 BROADLANDS MS N 36 1 Broadlands Blvd NORTH YORK 4.16 kV 0.93TOB10PQ PARKDALE MS N 37 1457 Queen St W TORONTO 4.16 kV 0.96TOB2PQ PARKDALE MS N 38 1457 Queen St W TORONTO 4.16 kV 0.64TOB3PQ PARKDALE MS N 39 1457 Queen St W TORONTO 4.16 kV 2.42TOB4PQ PARKDALE MS N 40 1457 Queen St W TORONTO 4.16 kV 0.36TOB5PQ PARKDALE MS N 41 1457 Queen St W TORONTO 4.16 kV 2.06TOB6PQ PARKDALE MS N 42 1457 Queen St W TORONTO 4.16 kV 1.25TOB7PQ PARKDALE MS N 43 1457 Queen St W TORONTO 4.16 kV 0.02TOB8PQ PARKDALE MS N 44 1457 Queen St W TORONTO 4.16 kV 2.02TOB9PQ PARKDALE MS N 45 1457 Queen St W TORONTO 4 16 kV 1 5TOB9PQ PARKDALE MS N 45 1457 Queen St W TORONTO 4.16 kV 1.5TOA200E CARLAW TS N 46 369 Carlaw Ave TORONTO 13.8 kV 6.47TOA201E CARLAW TS N 47 369 Carlaw Ave TORONTO 13.8 kV 7.23TOA480E CARLAW TS N 48 369 Carlaw Ave TORONTO 13.8 kV 0.04TOB108E CARLAW TS N 49 369 Carlaw Ave TORONTO 4.16 kV 2.78NYSS11F2 CUMMER MS N 50 38 Cummer Ave NORTH YORK 4.16 kV 0.07NYSS11F3 CUMMER MS N 51 38 Cummer Ave NORTH YORK 4.16 kV 0.87ETMGF1 ALBION MS Y 52 2 Rampart Rd ETOBICOKE 4.16 kV 4.49ETMGF2 ALBION MS Y 53 2 Rampart Rd ETOBICOKE 4.16 kV 1.12ETMGF3 ALBION MS Y 54 2 Rampart Rd ETOBICOKE 4.16 kV 0.85ETMGF4 ALBION MS Y 55 2 Rampart Rd ETOBICOKE 4.16 kV 0.83ETR29M1 REXDALE TS Y 56 90 Westmore Dr ETOBICOKE 27.6 kV 8.22ETR29M2 REXDALE TS Y 57 90 Westmore Dr ETOBICOKE 27.6 kV 6.32ETR29M3 REXDALE TS Y 58 90 Westmore Dr ETOBICOKE 27.6 kV 16.63
Page 2 of 31

Toronto Hydro-Electric System LimitedEB-2009-0139
Exhibit R1Tab 11
Schedule 26Appendix A
Filed: 2009 Nov 30Page 3 of 31
Circuit Substation Name
ALB Yes or
No Priority Substation Address Former Municipality VoltageCircuit
Length (Km)Approx. # of Units
Quote(Standard Prunning)
Price Form 12008 Maintenance Pruning Circuit List and Quotation
ETR29M33 REXDALE TS Y 59 90 Westmore Dr ETOBICOKE 27.6 kV 5.71ETR29M34 REXDALE TS Y 60 90 Westmore Dr ETOBICOKE 27.6 kV 3.14ETR29M35 REXDALE TS Y 61 90 Westmore Dr ETOBICOKE 27.6 kV 4.81ETR29M36 REXDALE TS Y 62 90 Westmore Dr ETOBICOKE 27.6 kV 5.96ETR29M4 REXDALE TS Y 63 90 Westmore Dr ETOBICOKE 27.6 kV 4.91ETR29M5 REXDALE TS Y 64 90 Westmore Dr ETOBICOKE 27.6 kV 7.97ETR29M6 REXDALE TS Y 65 90 Westmore Dr ETOBICOKE 27.6 kV 7.25ETARF1 ROYALCREST MS Y 66 Martin Grove Rd. S. oF Steeles Ave. ETOBICOKE 4.16 kV 0.19ETARF3 ROYALCREST MS Y 67 Martin Grove Rd. S. oF Steeles Ave. ETOBICOKE 4.16 kV 0.58ETARF4 ROYALCREST MS Y 68 Martin Grove Rd. S. oF Steeles Ave. ETOBICOKE 4.16 kV 0.76ETLGF1 GUNTON MS Y 69 39 Gunton Dr ETOBICOKE 4.16 kV 2.8ETLGF3 GUNTON MS Y 70 39 Gunton Dr ETOBICOKE 4.16 kV 0.8ETLGF4 GUNTON MS Y 71 39 Gunton Dr ETOBICOKE 4.16 kV 1.2ETZDF1 BELFIELD MS Y 72 121 Belfield Rd ETOBICOKE 4.16 kV 1.79ETZDF2 BELFIELD MS Y 73 121 Belfield Rd ETOBICOKE 4.16 kV 1.72ETZDF3 BELFIELD MS Y 74 121 Belfield Rd ETOBICOKE 4 16 kV 1 62ETZDF3 BELFIELD MS Y 74 121 Belfield Rd ETOBICOKE 4.16 kV 1.62ETZDF4 BELFIELD MS Y 75 121 Belfield Rd ETOBICOKE 4.16 kV 0.85NYSS44F1 SLOANE MS N 76 180 Sloane Ave NORTH YORK 4.16 kV 1.3NYSS44F2 SLOANE MS N 77 180 Sloane Ave NORTH YORK 4.16 kV 1.87NYSS44F3 SLOANE MS N 78 180 Sloane Ave NORTH YORK 4.16 kV 1.26ETVAF1 THISTLETOWN MS Y 79 55 Thistledown Blvd ETOBICOKE 4.16 kV 3.25ETVAF2 THISTLETOWN MS Y 80 55 Thistledown Blvd ETOBICOKE 4.16 kV 3.72ETVAF3 THISTLETOWN MS Y 81 55 Thistledown Blvd ETOBICOKE 4.16 kV 3.79ETVAF4 THISTLETOWN MS Y 82 55 Thistledown Blvd ETOBICOKE 4.16 kV 2.11TOB1CD COLLEGE MS N 83 955 College St TORONTO 4.16 kV 0.36TOB2CD COLLEGE MS N 84 955 College St TORONTO 4.16 kV 3.36TOB4CD COLLEGE MS N 85 955 College St TORONTO 4.16 kV 1.12TOB5CD COLLEGE MS N 86 955 College St TORONTO 4.16 kV 1.48TOB7CD COLLEGE MS N 87 955 College St TORONTO 4.16 kV 1.5
Page 3 of 31
Toronto Hydro-Electric System LimitedEB-2009-0139
Exhibit R1Tab 11
Schedule 26Appendix A
Filed: 2009 Nov 30Page 4 of 31
Circuit Substation Name
ALB Yes or
No Priority Substation Address Former Municipality VoltageCircuit
Length (Km)Approx. # of Units
Quote(Standard Prunning)
Price Form 12008 Maintenance Pruning Circuit List and Quotation
TOA63H HIGH LEVEL MS N 88 292-296 Mac Pherson Ave TORONTO 13.8 kV 0.02ETNFF1 MARMAC MS Y 89 25 McLachlan Rd ETOBICOKE 13.8 kV 4.4ETNFF2 MARMAC MS Y 90 25 McLachlan Rd ETOBICOKE 13.8 kV 2.25ETNFF3 MARMAC MS Y 91 25 McLachlan Rd ETOBICOKE 13.8 kV 2.83ETEHF1 CONSTELLATION MS Y 92 367 Carlingview Dr ETOBICOKE 13.8 kV 1.63ETEHF2 CONSTELLATION MS Y 93 367 Carlingview Dr ETOBICOKE 13.8 kV 1.71ETBRF1 HUMBERLINE MS Y 94 267 Humberline Dr (FIREHALL #11) ETOBICOKE 13.8 kV 5.39ETBRF2 HUMBERLINE MS Y 95 267 Humberline Dr (FIREHALL #11) ETOBICOKE 13.8 kV 4.45ETBRF3 HUMBERLINE MS Y 96 267 Humberline Dr (FIREHALL #11) ETOBICOKE 13.8 kV 0.28ETCAF1 REDCLIFF MS Y 97 2130 Kipling Ave ETOBICOKE 4.16 kV 3.99ETCAF2 REDCLIFF MS Y 98 2130 Kipling Ave ETOBICOKE 4.16 kV 1.32ETCAF3 REDCLIFF MS Y 99 2130 Kipling Ave ETOBICOKE 4.16 kV 0.43ETCAF4 REDCLIFF MS Y 100 2130 Kipling Ave ETOBICOKE 4.16 kV 1.77ETCAF5 REDCLIFF MS Y 101 2130 Kipling Ave ETOBICOKE 4.16 kV 2.3ETBQF2 WESTMORE MS N 102 127 Westmore Rd ETOBICOKE 13.8 kV 3.07ETD6M1 WOODBRIDGE TS Y 103 5839 HWY#7(1km EAST OF HWY#27) ETOBICOKE 27 6 kV 3 31ETD6M1 WOODBRIDGE TS Y 103 5839 HWY#7(1km EAST OF HWY#27) ETOBICOKE 27.6 kV 3.31ETD6M4 WOODBRIDGE TS Y 104 5839 HWY#7(1km EAST OF HWY#27) ETOBICOKE 27.6 kV 5.68ETYJF1 CHALLENGE MS Y 105 196 Bethridge Rd ETOBICOKE 4.16 kV 2ETYJF3 CHALLENGE MS Y 106 196 Bethridge Rd ETOBICOKE 4.16 kV 2.48ETYJF4 CHALLENGE MS Y 107 196 Bethridge Rd ETOBICOKE 4.16 kV 2.06ETYCF1 TAYSHAM MS Y 108 153 Taysham Crescent ETOBICOKE 4.16 kV 1.13ETYCF2 TAYSHAM MS Y 109 153 Taysham Crescent ETOBICOKE 4.16 kV 0.68ETYCF3 TAYSHAM MS Y 110 153 Taysham Crescent ETOBICOKE 4.16 kV 4.94ETAQF1 ANNABELLE MS Y 111 1 Annabelle Dr ETOBICOKE 4.16 kV 1.41ETAQF2 ANNABELLE MS Y 112 1 Annabelle Dr ETOBICOKE 4.16 kV 1.73ETAQF3 ANNABELLE MS Y 113 1 Annabelle Dr ETOBICOKE 4.16 kV 2.15ETAQF4 ANNABELLE MS Y 114 1 Annabelle Dr ETOBICOKE 4.16 kV 0.93ETPFF1 DELAMERE MS Y 115 2094 Martin Grove Rd ETOBICOKE 4.16 kV 1.87ETPFF2 DELAMERE MS Y 116 2094 Martin Grove Rd ETOBICOKE 4.16 kV 1.77
Page 4 of 31
Toronto Hydro-Electric System LimitedEB-2009-0139
Exhibit R1Tab 11
Schedule 26Appendix A
Filed: 2009 Nov 30Page 5 of 31
Circuit Substation Name
ALB Yes or
No Priority Substation Address Former Municipality VoltageCircuit
Length (Km)Approx. # of Units
Quote(Standard Prunning)
Price Form 12008 Maintenance Pruning Circuit List and Quotation
ETPFF3 DELAMERE MS Y 117 2094 Martin Grove Rd ETOBICOKE 4.16 kV 0.37ETKGF1 TIDEMORE MS Y 118 307 Rexdale Blvd ETOBICOKE 4.16 kV 1.31ETKGF2 TIDEMORE MS Y 119 307 Rexdale Blvd ETOBICOKE 4.16 kV 0.89ETKGF3 TIDEMORE MS Y 120 307 Rexdale Blvd ETOBICOKE 4.16 kV 1.39ETKGF4 TIDEMORE MS Y 121 307 Rexdale Blvd ETOBICOKE 4.16 kV 2.81NYSS38F1 BURBANK MS N 122 165 Burbank Dr NORTH YORK 4.16 kV 0.46ETDBF3 EVANS MS N 123 194 Evans Ave ETOBICOKE 4.16 kV 0.05YK88M12 RICHVIEW TS N 124 65 Kelfield St YORK 27.6 kV 22.61NYSS63F1 ESTELLE MS N 125 639 Conacher Dr NORTH YORK 4.16 kV 3.67EY53M3 BERMONDSEY I TS N 126 178 Bermondsey Rd. EAST YORK 27.6 kV 6.31EY53M7 BERMONDSEY I TS N 127 179 Bermondsey Rd. EAST YORK 27.6 kV 18.28EY34M1 LEASIDE TS N 128 1080 Millwood Ave. EAST YORK 27.6 kV 13.94EY34M2 LEASIDE TS N 129 1080 Millwood Ave. EAST YORK 27.6 kV 14.8EY34M3 LEASIDE TS N 130 1080 Millwood Ave. EAST YORK 27.6 kV 4.71EY34M4 LEASIDE TS N 131 1080 Millwood Ave. EAST YORK 27.6 kV 31.51EY34M8 LEASIDE TS N 132 1080 Millwood Ave EAST YORK 27 6 kV 15 13EY34M8 LEASIDE TS N 132 1080 Millwood Ave. EAST YORK 27.6 kV 15.13TOB102KS KEELE & ST. CLAIR MS N 133 1860 St Clair Ave W TORONTO 4.16 kV 0.2TOB1KS KEELE & ST. CLAIR MS N 134 1860 St Clair Ave W TORONTO 4.16 kV 2.43TOB2KS KEELE & ST. CLAIR MS N 135 1860 St Clair Ave W TORONTO 4.16 kV 2.55TOB3KS KEELE & ST. CLAIR MS N 136 1860 St Clair Ave W TORONTO 4.16 kV 0.19TOB4KS KEELE & ST. CLAIR MS N 137 1860 St Clair Ave W TORONTO 4.16 kV 2.56TOB5KS KEELE & ST. CLAIR MS N 138 1860 St Clair Ave W TORONTO 4.16 kV 0.04NY34M5 LEASIDE TS N 139 1080 Millwood Ave. NORTH YORK 27.6 kV 4.56NY34M6 LEASIDE TS N 140 1080 Millwood Ave. NORTH YORK 27.6 kV 12.4NY34M7 LEASIDE TS N 141 1080 Millwood Ave. NORTH YORK 27.6 kV 18.15SCGF1 PROGRESS MARKHAM MS N 142 895 Progress Ave SCARBOROUGH 4.16 kV 0.7SCGF2 PROGRESS MARKHAM MS N 143 895 Progress Ave SCARBOROUGH 4.16 kV 0.8SCGF3 PROGRESS MARKHAM MS N 144 895 Progress Ave SCARBOROUGH 4.16 kV 1.11EY43M21 WARDEN TS N 145 699 Warden Ave EAST YORK 27.6 kV 3.96
Page 5 of 31
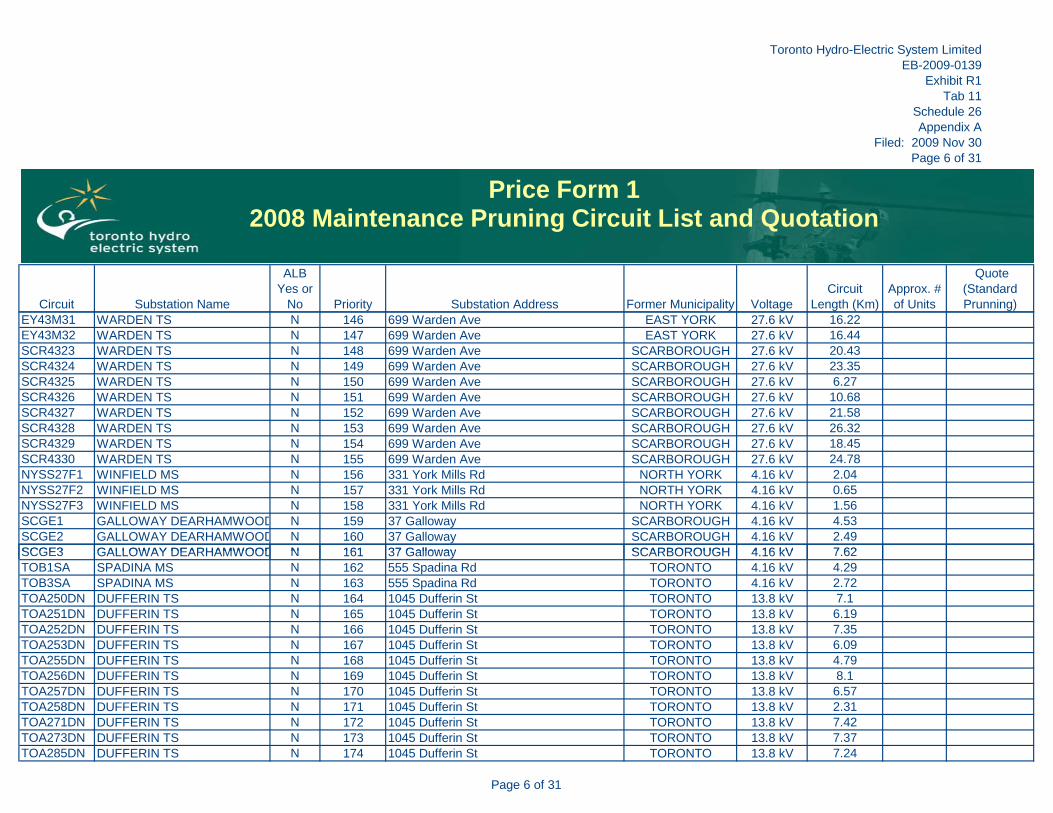
Toronto Hydro-Electric System LimitedEB-2009-0139
Exhibit R1Tab 11
Schedule 26Appendix A
Filed: 2009 Nov 30Page 6 of 31
Circuit Substation Name
ALB Yes or
No Priority Substation Address Former Municipality VoltageCircuit
Length (Km)Approx. # of Units
Quote(Standard Prunning)
Price Form 12008 Maintenance Pruning Circuit List and Quotation
EY43M31 WARDEN TS N 146 699 Warden Ave EAST YORK 27.6 kV 16.22EY43M32 WARDEN TS N 147 699 Warden Ave EAST YORK 27.6 kV 16.44SCR4323 WARDEN TS N 148 699 Warden Ave SCARBOROUGH 27.6 kV 20.43SCR4324 WARDEN TS N 149 699 Warden Ave SCARBOROUGH 27.6 kV 23.35SCR4325 WARDEN TS N 150 699 Warden Ave SCARBOROUGH 27.6 kV 6.27SCR4326 WARDEN TS N 151 699 Warden Ave SCARBOROUGH 27.6 kV 10.68SCR4327 WARDEN TS N 152 699 Warden Ave SCARBOROUGH 27.6 kV 21.58SCR4328 WARDEN TS N 153 699 Warden Ave SCARBOROUGH 27.6 kV 26.32SCR4329 WARDEN TS N 154 699 Warden Ave SCARBOROUGH 27.6 kV 18.45SCR4330 WARDEN TS N 155 699 Warden Ave SCARBOROUGH 27.6 kV 24.78NYSS27F1 WINFIELD MS N 156 331 York Mills Rd NORTH YORK 4.16 kV 2.04NYSS27F2 WINFIELD MS N 157 331 York Mills Rd NORTH YORK 4.16 kV 0.65NYSS27F3 WINFIELD MS N 158 331 York Mills Rd NORTH YORK 4.16 kV 1.56SCGE1 GALLOWAY DEARHAMWOOD N 159 37 Galloway SCARBOROUGH 4.16 kV 4.53SCGE2 GALLOWAY DEARHAMWOOD N 160 37 Galloway SCARBOROUGH 4.16 kV 2.49SCGE3 GALLOWAY DEARHAMWOOD N 161 37 Galloway SCARBOROUGH 4 16 kV 7 62SCGE3 GALLOWAY DEARHAMWOOD N 161 37 Galloway SCARBOROUGH 4.16 kV 7.62TOB1SA SPADINA MS N 162 555 Spadina Rd TORONTO 4.16 kV 4.29TOB3SA SPADINA MS N 163 555 Spadina Rd TORONTO 4.16 kV 2.72TOA250DN DUFFERIN TS N 164 1045 Dufferin St TORONTO 13.8 kV 7.1TOA251DN DUFFERIN TS N 165 1045 Dufferin St TORONTO 13.8 kV 6.19TOA252DN DUFFERIN TS N 166 1045 Dufferin St TORONTO 13.8 kV 7.35TOA253DN DUFFERIN TS N 167 1045 Dufferin St TORONTO 13.8 kV 6.09TOA255DN DUFFERIN TS N 168 1045 Dufferin St TORONTO 13.8 kV 4.79TOA256DN DUFFERIN TS N 169 1045 Dufferin St TORONTO 13.8 kV 8.1TOA257DN DUFFERIN TS N 170 1045 Dufferin St TORONTO 13.8 kV 6.57TOA258DN DUFFERIN TS N 171 1045 Dufferin St TORONTO 13.8 kV 2.31TOA271DN DUFFERIN TS N 172 1045 Dufferin St TORONTO 13.8 kV 7.42TOA273DN DUFFERIN TS N 173 1045 Dufferin St TORONTO 13.8 kV 7.37TOA285DN DUFFERIN TS N 174 1045 Dufferin St TORONTO 13.8 kV 7.24
Page 6 of 31
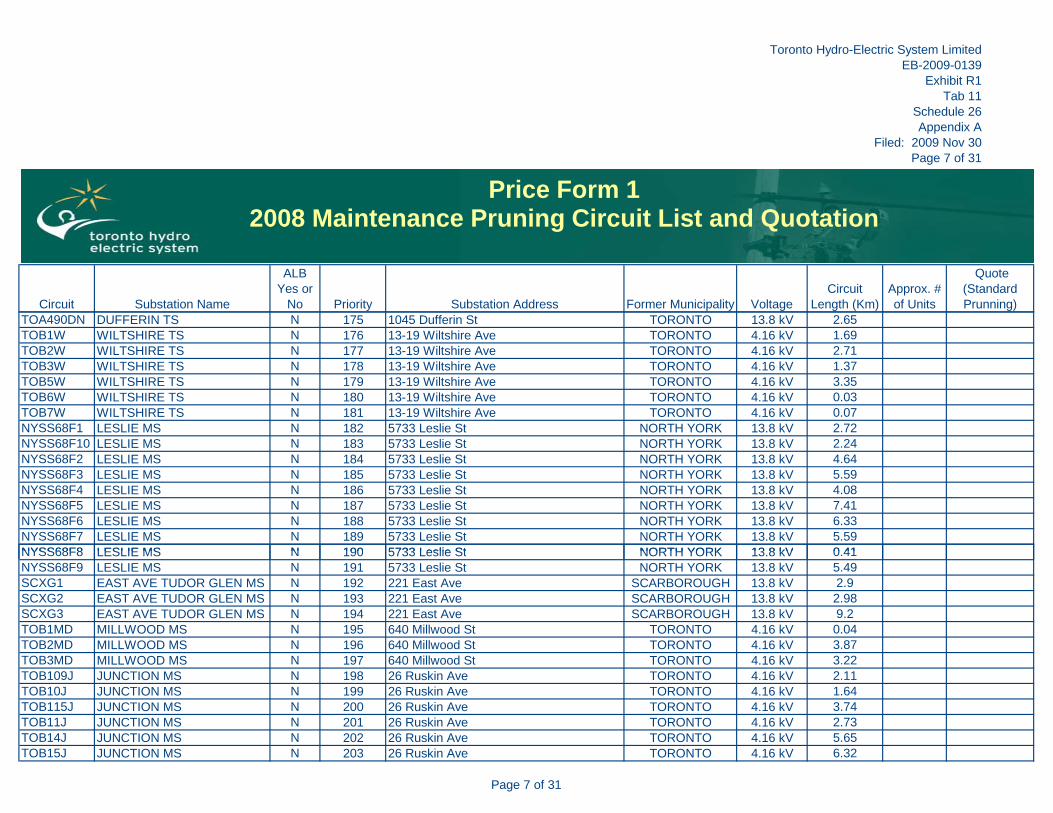
Toronto Hydro-Electric System LimitedEB-2009-0139
Exhibit R1Tab 11
Schedule 26Appendix A
Filed: 2009 Nov 30Page 7 of 31
Circuit Substation Name
ALB Yes or
No Priority Substation Address Former Municipality VoltageCircuit
Length (Km)Approx. # of Units
Quote(Standard Prunning)
Price Form 12008 Maintenance Pruning Circuit List and Quotation
TOA490DN DUFFERIN TS N 175 1045 Dufferin St TORONTO 13.8 kV 2.65TOB1W WILTSHIRE TS N 176 13-19 Wiltshire Ave TORONTO 4.16 kV 1.69TOB2W WILTSHIRE TS N 177 13-19 Wiltshire Ave TORONTO 4.16 kV 2.71TOB3W WILTSHIRE TS N 178 13-19 Wiltshire Ave TORONTO 4.16 kV 1.37TOB5W WILTSHIRE TS N 179 13-19 Wiltshire Ave TORONTO 4.16 kV 3.35TOB6W WILTSHIRE TS N 180 13-19 Wiltshire Ave TORONTO 4.16 kV 0.03TOB7W WILTSHIRE TS N 181 13-19 Wiltshire Ave TORONTO 4.16 kV 0.07NYSS68F1 LESLIE MS N 182 5733 Leslie St NORTH YORK 13.8 kV 2.72NYSS68F10 LESLIE MS N 183 5733 Leslie St NORTH YORK 13.8 kV 2.24NYSS68F2 LESLIE MS N 184 5733 Leslie St NORTH YORK 13.8 kV 4.64NYSS68F3 LESLIE MS N 185 5733 Leslie St NORTH YORK 13.8 kV 5.59NYSS68F4 LESLIE MS N 186 5733 Leslie St NORTH YORK 13.8 kV 4.08NYSS68F5 LESLIE MS N 187 5733 Leslie St NORTH YORK 13.8 kV 7.41NYSS68F6 LESLIE MS N 188 5733 Leslie St NORTH YORK 13.8 kV 6.33NYSS68F7 LESLIE MS N 189 5733 Leslie St NORTH YORK 13.8 kV 5.59NYSS68F8 LESLIE MS N 190 5733 Leslie St NORTH YORK 13 8 kV 0 41NYSS68F8 LESLIE MS N 190 5733 Leslie St NORTH YORK 13.8 kV 0.41NYSS68F9 LESLIE MS N 191 5733 Leslie St NORTH YORK 13.8 kV 5.49SCXG1 EAST AVE TUDOR GLEN MS N 192 221 East Ave SCARBOROUGH 13.8 kV 2.9SCXG2 EAST AVE TUDOR GLEN MS N 193 221 East Ave SCARBOROUGH 13.8 kV 2.98SCXG3 EAST AVE TUDOR GLEN MS N 194 221 East Ave SCARBOROUGH 13.8 kV 9.2TOB1MD MILLWOOD MS N 195 640 Millwood St TORONTO 4.16 kV 0.04TOB2MD MILLWOOD MS N 196 640 Millwood St TORONTO 4.16 kV 3.87TOB3MD MILLWOOD MS N 197 640 Millwood St TORONTO 4.16 kV 3.22TOB109J JUNCTION MS N 198 26 Ruskin Ave TORONTO 4.16 kV 2.11TOB10J JUNCTION MS N 199 26 Ruskin Ave TORONTO 4.16 kV 1.64TOB115J JUNCTION MS N 200 26 Ruskin Ave TORONTO 4.16 kV 3.74TOB11J JUNCTION MS N 201 26 Ruskin Ave TORONTO 4.16 kV 2.73TOB14J JUNCTION MS N 202 26 Ruskin Ave TORONTO 4.16 kV 5.65TOB15J JUNCTION MS N 203 26 Ruskin Ave TORONTO 4.16 kV 6.32
Page 7 of 31
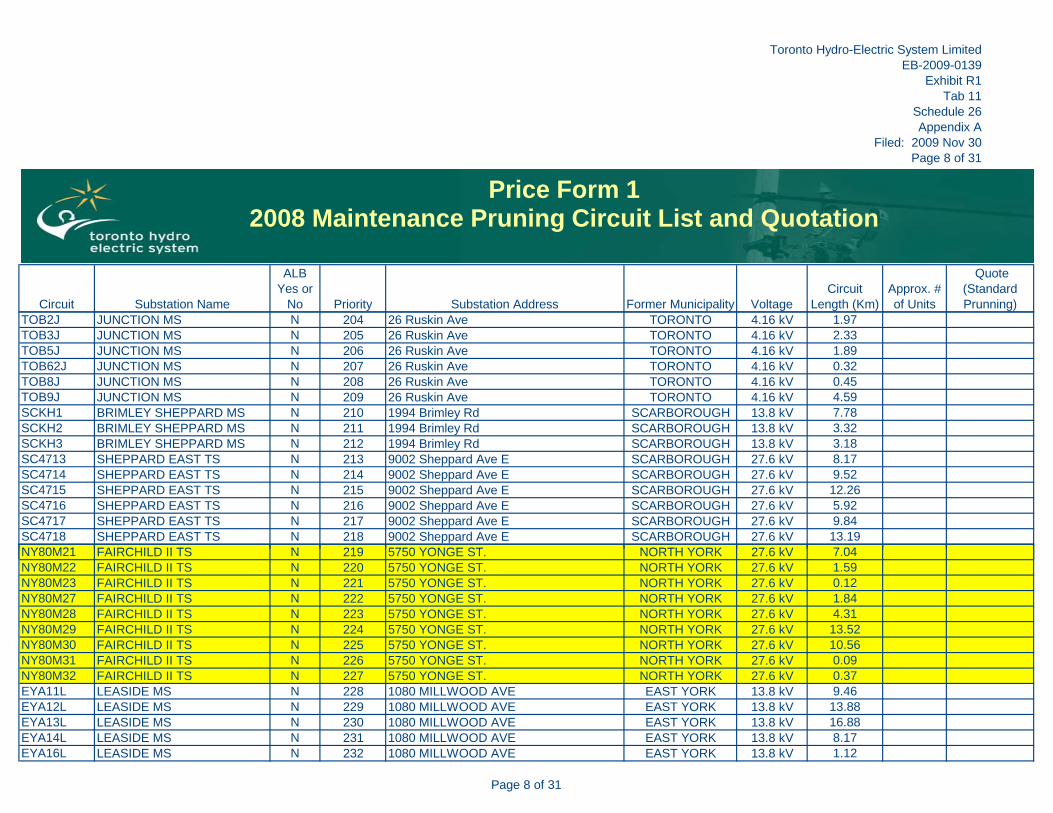
Toronto Hydro-Electric System LimitedEB-2009-0139
Exhibit R1Tab 11
Schedule 26Appendix A
Filed: 2009 Nov 30Page 8 of 31
Circuit Substation Name
ALB Yes or
No Priority Substation Address Former Municipality VoltageCircuit
Length (Km)Approx. # of Units
Quote(Standard Prunning)
Price Form 12008 Maintenance Pruning Circuit List and Quotation
TOB2J JUNCTION MS N 204 26 Ruskin Ave TORONTO 4.16 kV 1.97TOB3J JUNCTION MS N 205 26 Ruskin Ave TORONTO 4.16 kV 2.33TOB5J JUNCTION MS N 206 26 Ruskin Ave TORONTO 4.16 kV 1.89TOB62J JUNCTION MS N 207 26 Ruskin Ave TORONTO 4.16 kV 0.32TOB8J JUNCTION MS N 208 26 Ruskin Ave TORONTO 4.16 kV 0.45TOB9J JUNCTION MS N 209 26 Ruskin Ave TORONTO 4.16 kV 4.59SCKH1 BRIMLEY SHEPPARD MS N 210 1994 Brimley Rd SCARBOROUGH 13.8 kV 7.78SCKH2 BRIMLEY SHEPPARD MS N 211 1994 Brimley Rd SCARBOROUGH 13.8 kV 3.32SCKH3 BRIMLEY SHEPPARD MS N 212 1994 Brimley Rd SCARBOROUGH 13.8 kV 3.18SC4713 SHEPPARD EAST TS N 213 9002 Sheppard Ave E SCARBOROUGH 27.6 kV 8.17SC4714 SHEPPARD EAST TS N 214 9002 Sheppard Ave E SCARBOROUGH 27.6 kV 9.52SC4715 SHEPPARD EAST TS N 215 9002 Sheppard Ave E SCARBOROUGH 27.6 kV 12.26SC4716 SHEPPARD EAST TS N 216 9002 Sheppard Ave E SCARBOROUGH 27.6 kV 5.92SC4717 SHEPPARD EAST TS N 217 9002 Sheppard Ave E SCARBOROUGH 27.6 kV 9.84SC4718 SHEPPARD EAST TS N 218 9002 Sheppard Ave E SCARBOROUGH 27.6 kV 13.19NY80M21 FAIRCHILD II TS N 219 5750 YONGE ST NORTH YORK 27 6 kV 7 04NY80M21 FAIRCHILD II TS N 219 5750 YONGE ST. NORTH YORK 27.6 kV 7.04NY80M22 FAIRCHILD II TS N 220 5750 YONGE ST. NORTH YORK 27.6 kV 1.59NY80M23 FAIRCHILD II TS N 221 5750 YONGE ST. NORTH YORK 27.6 kV 0.12NY80M27 FAIRCHILD II TS N 222 5750 YONGE ST. NORTH YORK 27.6 kV 1.84NY80M28 FAIRCHILD II TS N 223 5750 YONGE ST. NORTH YORK 27.6 kV 4.31NY80M29 FAIRCHILD II TS N 224 5750 YONGE ST. NORTH YORK 27.6 kV 13.52NY80M30 FAIRCHILD II TS N 225 5750 YONGE ST. NORTH YORK 27.6 kV 10.56NY80M31 FAIRCHILD II TS N 226 5750 YONGE ST. NORTH YORK 27.6 kV 0.09NY80M32 FAIRCHILD II TS N 227 5750 YONGE ST. NORTH YORK 27.6 kV 0.37EYA11L LEASIDE MS N 228 1080 MILLWOOD AVE EAST YORK 13.8 kV 9.46EYA12L LEASIDE MS N 229 1080 MILLWOOD AVE EAST YORK 13.8 kV 13.88EYA13L LEASIDE MS N 230 1080 MILLWOOD AVE EAST YORK 13.8 kV 16.88EYA14L LEASIDE MS N 231 1080 MILLWOOD AVE EAST YORK 13.8 kV 8.17EYA16L LEASIDE MS N 232 1080 MILLWOOD AVE EAST YORK 13.8 kV 1.12
Page 8 of 31
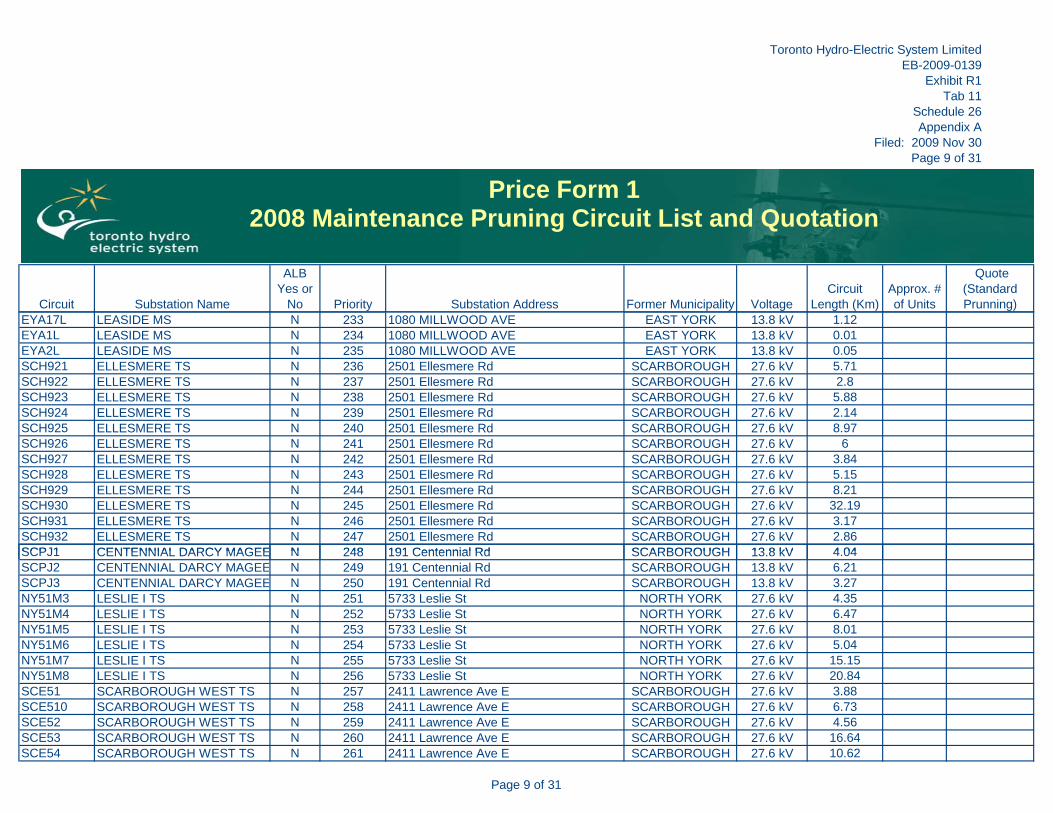
Toronto Hydro-Electric System LimitedEB-2009-0139
Exhibit R1Tab 11
Schedule 26Appendix A
Filed: 2009 Nov 30Page 9 of 31
Circuit Substation Name
ALB Yes or
No Priority Substation Address Former Municipality VoltageCircuit
Length (Km)Approx. # of Units
Quote(Standard Prunning)
Price Form 12008 Maintenance Pruning Circuit List and Quotation
EYA17L LEASIDE MS N 233 1080 MILLWOOD AVE EAST YORK 13.8 kV 1.12EYA1L LEASIDE MS N 234 1080 MILLWOOD AVE EAST YORK 13.8 kV 0.01EYA2L LEASIDE MS N 235 1080 MILLWOOD AVE EAST YORK 13.8 kV 0.05SCH921 ELLESMERE TS N 236 2501 Ellesmere Rd SCARBOROUGH 27.6 kV 5.71SCH922 ELLESMERE TS N 237 2501 Ellesmere Rd SCARBOROUGH 27.6 kV 2.8SCH923 ELLESMERE TS N 238 2501 Ellesmere Rd SCARBOROUGH 27.6 kV 5.88SCH924 ELLESMERE TS N 239 2501 Ellesmere Rd SCARBOROUGH 27.6 kV 2.14SCH925 ELLESMERE TS N 240 2501 Ellesmere Rd SCARBOROUGH 27.6 kV 8.97SCH926 ELLESMERE TS N 241 2501 Ellesmere Rd SCARBOROUGH 27.6 kV 6SCH927 ELLESMERE TS N 242 2501 Ellesmere Rd SCARBOROUGH 27.6 kV 3.84SCH928 ELLESMERE TS N 243 2501 Ellesmere Rd SCARBOROUGH 27.6 kV 5.15SCH929 ELLESMERE TS N 244 2501 Ellesmere Rd SCARBOROUGH 27.6 kV 8.21SCH930 ELLESMERE TS N 245 2501 Ellesmere Rd SCARBOROUGH 27.6 kV 32.19SCH931 ELLESMERE TS N 246 2501 Ellesmere Rd SCARBOROUGH 27.6 kV 3.17SCH932 ELLESMERE TS N 247 2501 Ellesmere Rd SCARBOROUGH 27.6 kV 2.86SCPJ1 CENTENNIAL DARCY MAGEE N 248 191 Centennial Rd SCARBOROUGH 13 8 kV 4 04SCPJ1 CENTENNIAL DARCY MAGEE N 248 191 Centennial Rd SCARBOROUGH 13.8 kV 4.04SCPJ2 CENTENNIAL DARCY MAGEE N 249 191 Centennial Rd SCARBOROUGH 13.8 kV 6.21SCPJ3 CENTENNIAL DARCY MAGEE N 250 191 Centennial Rd SCARBOROUGH 13.8 kV 3.27NY51M3 LESLIE I TS N 251 5733 Leslie St NORTH YORK 27.6 kV 4.35NY51M4 LESLIE I TS N 252 5733 Leslie St NORTH YORK 27.6 kV 6.47NY51M5 LESLIE I TS N 253 5733 Leslie St NORTH YORK 27.6 kV 8.01NY51M6 LESLIE I TS N 254 5733 Leslie St NORTH YORK 27.6 kV 5.04NY51M7 LESLIE I TS N 255 5733 Leslie St NORTH YORK 27.6 kV 15.15NY51M8 LESLIE I TS N 256 5733 Leslie St NORTH YORK 27.6 kV 20.84SCE51 SCARBOROUGH WEST TS N 257 2411 Lawrence Ave E SCARBOROUGH 27.6 kV 3.88SCE510 SCARBOROUGH WEST TS N 258 2411 Lawrence Ave E SCARBOROUGH 27.6 kV 6.73SCE52 SCARBOROUGH WEST TS N 259 2411 Lawrence Ave E SCARBOROUGH 27.6 kV 4.56SCE53 SCARBOROUGH WEST TS N 260 2411 Lawrence Ave E SCARBOROUGH 27.6 kV 16.64SCE54 SCARBOROUGH WEST TS N 261 2411 Lawrence Ave E SCARBOROUGH 27.6 kV 10.62
Page 9 of 31
Toronto Hydro-Electric System LimitedEB-2009-0139
Exhibit R1Tab 11
Schedule 26Appendix A
Filed: 2009 Nov 30Page 10 of 31
Circuit Substation Name
ALB Yes or
No Priority Substation Address Former Municipality VoltageCircuit
Length (Km)Approx. # of Units
Quote(Standard Prunning)
Price Form 12008 Maintenance Pruning Circuit List and Quotation
SCE55 SCARBOROUGH WEST TS N 262 2411 Lawrence Ave E SCARBOROUGH 27.6 kV 5.31SCE56 SCARBOROUGH WEST TS N 263 2411 Lawrence Ave E SCARBOROUGH 27.6 kV 17.12SCE58 SCARBOROUGH WEST TS N 264 2411 Lawrence Ave E SCARBOROUGH 27.6 kV 12.41SCE59 SCARBOROUGH WEST TS N 265 2411 Lawrence Ave E SCARBOROUGH 27.6 kV 7.19NY80M1 FAIRCHILD I TS N 266 5750 YONGE ST. NORTH YORK 27.6 kV 20.9NY80M10 FAIRCHILD I TS N 267 5750 YONGE ST. NORTH YORK 27.6 kV 11.83NY80M2 FAIRCHILD I TS N 268 5750 YONGE ST. NORTH YORK 27.6 kV 14.8NY80M3 FAIRCHILD I TS N 269 5750 YONGE ST. NORTH YORK 27.6 kV 5.49NY80M4 FAIRCHILD I TS N 270 5750 YONGE ST. NORTH YORK 27.6 kV 16.17NY80M5 FAIRCHILD I TS N 271 5750 YONGE ST. NORTH YORK 27.6 kV 11.09NY80M6 FAIRCHILD I TS N 272 5750 YONGE ST. NORTH YORK 27.6 kV 21.46NY80M7 FAIRCHILD I TS N 273 5750 YONGE ST. NORTH YORK 27.6 kV 3.89NY80M8 FAIRCHILD I TS N 274 5750 YONGE ST. NORTH YORK 27.6 kV 9.02NY80M9 FAIRCHILD I TS N 275 5750 YONGE ST. NORTH YORK 27.6 kV 5.46SCYG1 MARKHAM PANDORA MS N 276 920 Markham Rd SCARBOROUGH 4.16 kV 2.59SCYG2 MARKHAM PANDORA MS N 277 920 Markham Rd SCARBOROUGH 4 16 kV 3 13SCYG2 MARKHAM PANDORA MS N 277 920 Markham Rd SCARBOROUGH 4.16 kV 3.13SCYG3 MARKHAM PANDORA MS N 278 920 Markham Rd SCARBOROUGH 4.16 kV 2.46NYSS46F2 LESMILL MS N 279 1857 Leslie St NORTH YORK 4.16 kV 2.8NYSS46F3 LESMILL MS N 280 1857 Leslie St NORTH YORK 4.16 kV 2.12TOA202BN BASIN TS N 281 23-25 Basin St TORONTO 13.8 kV 9.11TOA203BN BASIN TS N 282 23-25 Basin St TORONTO 13.8 kV 11.08TOA204BN BASIN TS N 283 23-25 Basin St TORONTO 13.8 kV 5.24SCRJ1 MORNINGSIDE CORONATION N 284 160 Morningside Ave SCARBOROUGH 4.16 kV 4.06SCRJ2 MORNINGSIDE CORONATION N 285 160 Morningside Ave SCARBOROUGH 4.16 kV 5.44SCRJ3 MORNINGSIDE CORONATION N 286 160 Morningside Ave SCARBOROUGH 4.16 kV 2.68SCUA1 KINGSTON MCCOWAN MS N 287 160 Morningside Ave SCARBOROUGH 4.16 kV 4.61
Page 10 of 31
Toronto Hydro-Electric System LimitedEB-2009-0139
Exhibit R1Tab 11
Schedule 26Appendix A
Filed: 2009 Nov 30Page 11 of 31
Circuit Substation Name Priority Substation Address Former Municipality VoltageCircuit
Length (Km)Approx. # of Units
Quote(Standard Prunning)
Quote(Storm
Hardening)NYSS33F1 PEMBERTON MS 1 85 Pemberton Ave NORTH YORK 4.16 kV 1.39NYSS33F2 PEMBERTON MS 2 85 Pemberton Ave NORTH YORK 4.16 kV 4.06NYSS33F3 PEMBERTON MS 3 85 Pemberton Ave NORTH YORK 4.16 kV 1.28SCSA1 KINGSTON MORNINGSIDE MS 4 4446 Kingston Rd SCARBOROUGH 4.16 kV 4.67SCSA2 KINGSTON MORNINGSIDE MS 5 4446 Kingston Rd SCARBOROUGH 4.16 kV 5.84SCSA3 KINGSTON MORNINGSIDE MS 6 4446 Kingston Rd SCARBOROUGH 4.16 kV 1.76ET88M1 RICHVIEW TS 7 65 Kelfield St ETOBICOKE 27.6 kV 7.95ET88M11 RICHVIEW TS 8 65 Kelfield St ETOBICOKE 27.6 kV 11.89ET88M13 RICHVIEW TS 9 65 Kelfield St ETOBICOKE 27.6 kV 9.75ET88M14 RICHVIEW TS 10 65 Kelfield St ETOBICOKE 27.6 kV 8.06ET88M15 RICHVIEW TS 11 65 Kelfield St ETOBICOKE 27.6 kV 10.26ET88M16 RICHVIEW TS 12 65 Kelfield St ETOBICOKE 27.6 kV 6.09ET88M17 RICHVIEW TS 13 65 Kelfield St ETOBICOKE 27.6 kV 6.68ET88M18 RICHVIEW TS 14 65 Kelfield St ETOBICOKE 27.6 kV 11.32ET88M2 RICHVIEW TS 15 65 Kelfield St ETOBICOKE 27.6 kV 5.35ET88M3 RICHVIEW TS 16 65 Kelfield St ETOBICOKE 27.6 kV 5.81ET88M43 RICHVIEW TS 17 65 Kelfield St ETOBICOKE 27.6 kV 9.74
Price Form 12008 Maintenance Pruning Circuit List and Quotation
Price Form 12009 Maintenance Pruning Circuit List and Quotation
ET88M44 RICHVIEW TS 18 65 Kelfield St ETOBICOKE 27.6 kV 4.17ET88M45 RICHVIEW TS 19 65 Kelfield St ETOBICOKE 27.6 kV 17.18ET88M46 RICHVIEW TS 20 65 Kelfield St ETOBICOKE 27.6 kV 12.76ET88M6 RICHVIEW TS 21 65 Kelfield St ETOBICOKE 27.6 kV 4.42ET88M8 RICHVIEW TS 22 65 Kelfield St ETOBICOKE 27.6 kV 4.66TOB109DA DANFORTH MS 23 2357 Danforth Ave TORONTO 4.16 kV 0.41TOB1DA DANFORTH MS 24 2357 Danforth Ave TORONTO 4.16 kV 1.95TOB2DA DANFORTH MS 25 2357 Danforth Ave TORONTO 4.16 kV 0.98TOB4DA DANFORTH MS 26 2357 Danforth Ave TORONTO 4.16 kV 1.45TOB6DA DANFORTH MS 27 2357 Danforth Ave TORONTO 4.16 kV 0.07TOB7DA DANFORTH MS 28 2357 Danforth Ave TORONTO 4.16 kV 3.78TOB8DA DANFORTH MS 29 2357 Danforth Ave TORONTO 4.16 kV 0.2TOB9DA DANFORTH MS 30 2357 Danforth Ave TORONTO 4.16 kV 4.83TOB2RD RUNNYMEDE MS 31 518 Runneymede Rd TORONTO 4.16 kV 2.05
Price Form 12008 Maintenance Pruning Circuit List and Quotation
Price Form 12009 Maintenance Pruning Circuit List and Quotation
Page 11 of 31
Toronto Hydro-Electric System LimitedEB-2009-0139
Exhibit R1Tab 11
Schedule 26Appendix A
Filed: 2009 Nov 30Page 12 of 31
Circuit Substation Name Priority Substation Address Former Municipality VoltageCircuit
Length (Km)Approx. # of Units
Quote(Standard Prunning)
Quote(Storm
Hardening)
Price Form 12008 Maintenance Pruning Circuit List and Quotation
Price Form 12009 Maintenance Pruning Circuit List and Quotation
TOB3RD RUNNYMEDE MS 32 518 Runneymede Rd TORONTO 4.16 kV 0.93TOB4RD RUNNYMEDE MS 33 518 Runneymede Rd TORONTO 4.16 kV 5.64TOB5RD RUNNYMEDE MS 34 518 Runneymede Rd TORONTO 4.16 kV 1.94TOB6RD RUNNYMEDE MS 35 518 Runneymede Rd TORONTO 4.16 kV 1.56ETWFF1 HUNTING RIDGE MS 36 63 Hunting Ridge ETOBICOKE 4.16 kV 1.45ETWFF2 HUNTING RIDGE MS 37 63 Hunting Ridge ETOBICOKE 4.16 kV 0.45ETWFF3 HUNTING RIDGE MS 38 63 Hunting Ridge ETOBICOKE 4.16 kV 0.44TOB1KY KINGSWAY MS 39 South Kingsway at Armadale Ave. TORONTO 4.16 kV 3.68ETMLF4 FIELDGATE MS 40 10 Willowridge Rd ETOBICOKE 4.16 kV 2.01NYSS21F1 NORTHDALE MS 41 58 Northdale Rd NORTH YORK 4.16 kV 2.19NYSS21F3 NORTHDALE MS 42 58 Northdale Rd NORTH YORK 4.16 kV 2.7NY51M21 LESLIE II TS 43 5733 Leslie St NORTH YORK 27.6 kV 24.8NY51M22 LESLIE II TS 44 5733 Leslie St NORTH YORK 27.6 kV 0.79NY51M23 LESLIE II TS 45 5733 Leslie St NORTH YORK 27.6 kV 3.03NY51M24 LESLIE II TS 46 5733 Leslie St NORTH YORK 27.6 kV 1.73NY51M25 LESLIE II TS 47 5733 Leslie St NORTH YORK 27.6 kV 3.65NY51M26 LESLIE II TS 48 5733 Leslie St NORTH YORK 27.6 kV 3.49NY51M27 LESLIE II TS 49 5733 Leslie St NORTH YORK 27.6 kV 3.79NY51M28 LESLIE II TS 50 5733 Leslie St NORTH YORK 27.6 kV 4.48NY51M29 LESLIE II TS 51 5733 Leslie St NORTH YORK 27.6 kV 4.46NY51M30 LESLIE II TS 52 5733 Leslie St NORTH YORK 27.6 kV 4.06NY51M31 LESLIE II TS 53 5733 Leslie St NORTH YORK 27.6 kV 1.54NY51M32 LESLIE II TS 54 5733 Leslie St NORTH YORK 27.6 kV 2.57ETRBF1 WESTMOUNT MS 55 174 Dixon Rd ETOBICOKE 4.16 kV 0.85ETRBF2 WESTMOUNT MS 56 174 Dixon Rd ETOBICOKE 4.16 kV 2.43ETRBF3 WESTMOUNT MS 57 174 Dixon Rd ETOBICOKE 4.16 kV 5.4TOB1QU QUEENSWAY MS 58 5 Southport St TORONTO 4.16 kV 1.07TOB2QU QUEENSWAY MS 59 5 Southport St TORONTO 4.16 kV 3.29ETJDF1 DUNSANY MS 60 64 Dunsany Crescent ETOBICOKE 4.16 kV 2.44ETJDF2 DUNSANY MS 61 64 Dunsany Crescent ETOBICOKE 4.16 kV 2.61ETJDF3 DUNSANY MS 62 64 Dunsany Crescent ETOBICOKE 4.16 kV 0.84
Page 12 of 31

Toronto Hydro-Electric System LimitedEB-2009-0139
Exhibit R1Tab 11
Schedule 26Appendix A
Filed: 2009 Nov 30Page 13 of 31
Circuit Substation Name Priority Substation Address Former Municipality VoltageCircuit
Length (Km)Approx. # of Units
Quote(Standard Prunning)
Quote(Storm
Hardening)
Price Form 12008 Maintenance Pruning Circuit List and Quotation
Price Form 12009 Maintenance Pruning Circuit List and Quotation
ETHDF1 HARTSDALE MS 63 191 The Westway ETOBICOKE 4.16 kV 0.99ETHDF2 HARTSDALE MS 64 191 The Westway ETOBICOKE 4.16 kV 3.8ETHDF3 HARTSDALE MS 65 191 The Westway ETOBICOKE 4.16 kV 2.13ETTAF1 HIGHBURY MS 66 18 Warbeck Pl ETOBICOKE 4.16 kV 2.93ETTAF2 HIGHBURY MS 67 18 Warbeck Pl ETOBICOKE 4.16 kV 3.72ETTAF3 HIGHBURY MS 68 18 Warbeck Pl ETOBICOKE 4.16 kV 2.28ETTAF4 HIGHBURY MS 69 18 Warbeck Pl ETOBICOKE 4.16 kV 3.55SCGG1 LIVINGSTON GUILDWOOD MS 70 74 Livingston Rd SCARBOROUGH 4.16 kV 6.35SCGG2 LIVINGSTON GUILDWOOD MS 71 74 Livingston Rd SCARBOROUGH 4.16 kV 0.26SCGG3 LIVINGSTON GUILDWOOD MS 72 74 Livingston Rd SCARBOROUGH 4.16 kV 0.36TOB3DN DUFFERIN TS 73 1045 Dufferin St TORONTO 4.16 kV 1.47TOB4DN DUFFERIN TS 74 1045 Dufferin St TORONTO 4.16 kV 0.62TOB5DN DUFFERIN TS 75 1045 Dufferin St TORONTO 4.16 kV 3.62TOB1RK RENNIE PARK MS 76 Rear of Field House TORONTO 4.16 kV 5.46TOB2RK RENNIE PARK MS 77 Rear of Field House TORONTO 4.16 kV 3.96NYSS37F2 DON MILLS WEST MS 78 802 Lawrence Ave E NORTH YORK 4.16 kV 7.33NYSS37F4 DON MILLS WEST MS 79 802 Lawrence Ave E NORTH YORK 4.16 kV 2.14SCTA1 SAUNDERS KINGSTON MS 80 4 Saunders Rd SCARBOROUGH 4.16 kV 1.71SCTA2 SAUNDERS KINGSTON MS 81 4 Saunders Rd SCARBOROUGH 4.16 kV 1.15SCTA3 SAUNDERS KINGSTON MS 82 4 Saunders Rd SCARBOROUGH 4.16 kV 2.79SCDC1 BELLAMY LAWRENCE MS 83 510 Bellamy Rd N SCARBOROUGH 4.16 kV 9.35SCDC2 BELLAMY LAWRENCE MS 84 510 Bellamy Rd N SCARBOROUGH 4.16 kV 5.83SCDC3 BELLAMY LAWRENCE MS 85 510 Bellamy Rd N SCARBOROUGH 4.16 kV 2.6ETEBF1 CHAPMAN MS 86 1 Duffield Rd ETOBICOKE 4.16 kV 4.53ETEBF2 CHAPMAN MS 87 1 Duffield Rd ETOBICOKE 4.16 kV 1.37ETEBF3 CHAPMAN MS 88 1 Duffield Rd ETOBICOKE 4.16 kV 2.93SCUC1 SCARBOROUGH GOLF CLUB R 89 1000 Scarborough Golf Rd SCARBOROUGH 4.16 kV 7.6SCUC2 SCARBOROUGH GOLF CLUB R 90 1000 Scarborough Golf Rd SCARBOROUGH 4.16 kV 0.88SCUC3 SCARBOROUGH GOLF CLUB R 91 1000 Scarborough Golf Rd SCARBOROUGH 4.16 kV 1.89NYSS64F2 RUDDINGTON MS 92 1 Wyvern Rd NORTH YORK 4.16 kV 3.23NYSS64F3 RUDDINGTON MS 93 1 Wyvern Rd NORTH YORK 4.16 kV 1.7
Page 13 of 31
Toronto Hydro-Electric System LimitedEB-2009-0139
Exhibit R1Tab 11
Schedule 26Appendix A
Filed: 2009 Nov 30Page 14 of 31
Circuit Substation Name Priority Substation Address Former Municipality VoltageCircuit
Length (Km)Approx. # of Units
Quote(Standard Prunning)
Quote(Storm
Hardening)
Price Form 12008 Maintenance Pruning Circuit List and Quotation
Price Form 12009 Maintenance Pruning Circuit List and Quotation
SCDJ1 ORTON PARK MERKLEY SQUAR 94 150 Orton Park SCARBOROUGH 4.16 kV 0.87SCDJ2 ORTON PARK MERKLEY SQUAR 95 150 Orton Park SCARBOROUGH 4.16 kV 4.83SCDJ3 ORTON PARK MERKLEY SQUAR 96 150 Orton Park SCARBOROUGH 4.16 kV 3.97EYHF1 STATION H MS 97 Next to 3 Dohme Ave. EAST YORK 4.16 kV 2.27EYHF2 STATION H MS 98 Next to 3 Dohme Ave. EAST YORK 4.16 kV 2.3EYHF3 STATION H MS 99 Next to 3 Dohme Ave. EAST YORK 4.16 kV 0.7EYDF1 STATION D MS 100 Next to 3 Dohme Ave. EAST YORK 4.16 kV 3.26EYDF2 STATION D MS 101 Next to 3 Dohme Ave. EAST YORK 4.16 kV 1.11EYDF3 STATION D MS 102 Next to 3 Dohme Ave. EAST YORK 4.16 kV 1.74ETUFF1 WINDSOR MS 103 298 Dixon Rd ETOBICOKE 4.16 kV 3.3ETUFF2 WINDSOR MS 104 298 Dixon Rd ETOBICOKE 4.16 kV 3.66ETUFF3 WINDSOR MS 105 298 Dixon Rd ETOBICOKE 4.16 kV 0.57ETUFF4 WINDSOR MS 106 298 Dixon Rd ETOBICOKE 4.16 kV 0.57SCEC4 LAWRENCE SCAR GOLF CLUB 107 3782 Lawrence Ave E SCARBOROUGH 4.16 kV 2.37SCEC5 LAWRENCE SCAR GOLF CLUB 108 3782 Lawrence Ave E SCARBOROUGH 4.16 kV 4.34SCEC6 LAWRENCE SCAR GOLF CLUB 109 3782 Lawrence Ave E SCARBOROUGH 4.16 kV 2.31ETVCF1 BLACKFRIAR MS 110 95 Kingsview Blvd ETOBICOKE 4.16 kV 3.04gETVCF2 BLACKFRIAR MS 111 95 Kingsview Blvd ETOBICOKE 4.16 kV 1.15ETVCF3 BLACKFRIAR MS 112 95 Kingsview Blvd ETOBICOKE 4.16 kV 2.61SCEC1 LAWRENCE SCAR GOLF CLUB 113 3782 Lawrence Ave E SCARBOROUGH 4.16 kV 0.56SCEC2 LAWRENCE SCAR GOLF CLUB 114 3782 Lawrence Ave E SCARBOROUGH 4.16 kV 1.57SCEC3 LAWRENCE SCAR GOLF CLUB 115 3782 Lawrence Ave E SCARBOROUGH 4.16 kV 6.29ETFQF1 MOUNTBATTEN MS 116 746 Scarlett Rd ETOBICOKE 4.16 kV 1.13ETFQF2 MOUNTBATTEN MS 117 746 Scarlett Rd ETOBICOKE 4.16 kV 1.2ETFQF3 MOUNTBATTEN MS 118 746 Scarlett Rd ETOBICOKE 4.16 kV 3.59ETFQF4 MOUNTBATTEN MS 119 746 Scarlett Rd ETOBICOKE 4.16 kV 3.57SCFJ1 MARKHAM EGLINTON MS 120 210 Markham Rd SCARBOROUGH 4.16 kV 0.59SCFJ2 MARKHAM EGLINTON MS 121 210 Markham Rd SCARBOROUGH 4.16 kV 1.02SCFJ3 MARKHAM EGLINTON MS 122 210 Markham Rd SCARBOROUGH 4.16 kV 0.11SCDE1 BRIMLEY BERNADINE MS 123 1221 Brimley Rd SCARBOROUGH 4.16 kV 7.85SCDE2 BRIMLEY BERNADINE MS 124 1221 Brimley Rd SCARBOROUGH 4.16 kV 3.26
Page 14 of 31
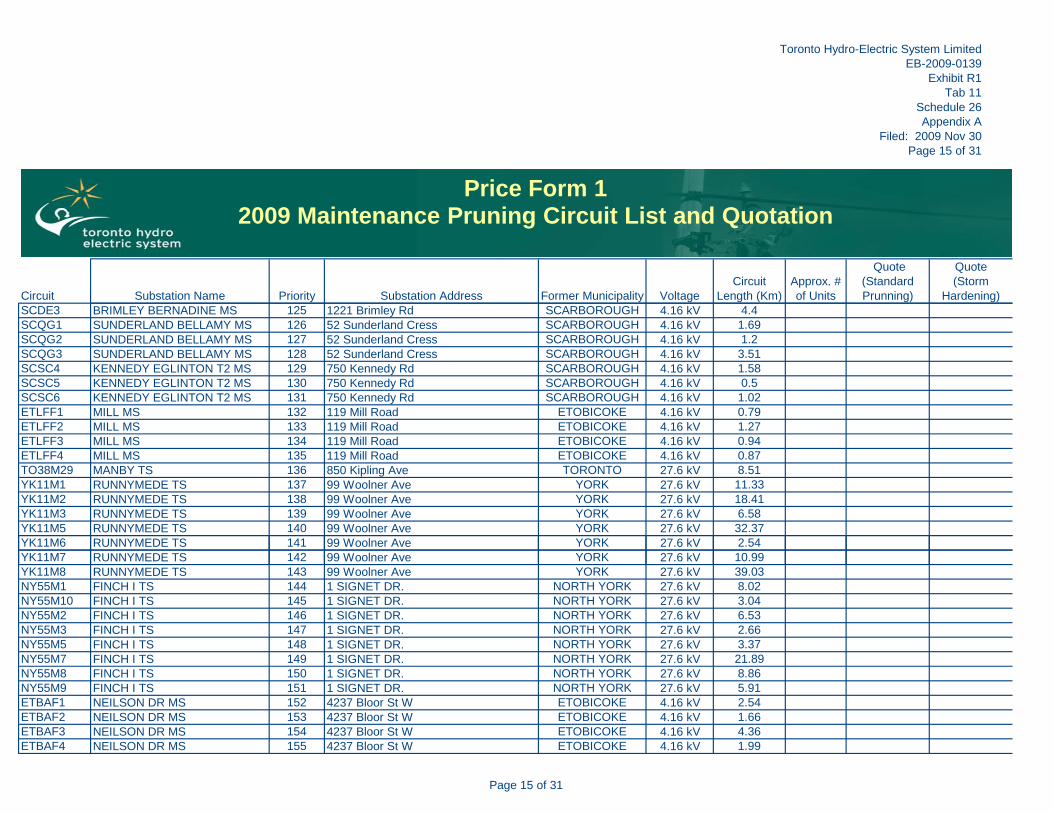
Toronto Hydro-Electric System LimitedEB-2009-0139
Exhibit R1Tab 11
Schedule 26Appendix A
Filed: 2009 Nov 30Page 15 of 31
Circuit Substation Name Priority Substation Address Former Municipality VoltageCircuit
Length (Km)Approx. # of Units
Quote(Standard Prunning)
Quote(Storm
Hardening)
Price Form 12008 Maintenance Pruning Circuit List and Quotation
Price Form 12009 Maintenance Pruning Circuit List and Quotation
SCDE3 BRIMLEY BERNADINE MS 125 1221 Brimley Rd SCARBOROUGH 4.16 kV 4.4SCQG1 SUNDERLAND BELLAMY MS 126 52 Sunderland Cress SCARBOROUGH 4.16 kV 1.69SCQG2 SUNDERLAND BELLAMY MS 127 52 Sunderland Cress SCARBOROUGH 4.16 kV 1.2SCQG3 SUNDERLAND BELLAMY MS 128 52 Sunderland Cress SCARBOROUGH 4.16 kV 3.51SCSC4 KENNEDY EGLINTON T2 MS 129 750 Kennedy Rd SCARBOROUGH 4.16 kV 1.58SCSC5 KENNEDY EGLINTON T2 MS 130 750 Kennedy Rd SCARBOROUGH 4.16 kV 0.5SCSC6 KENNEDY EGLINTON T2 MS 131 750 Kennedy Rd SCARBOROUGH 4.16 kV 1.02ETLFF1 MILL MS 132 119 Mill Road ETOBICOKE 4.16 kV 0.79ETLFF2 MILL MS 133 119 Mill Road ETOBICOKE 4.16 kV 1.27ETLFF3 MILL MS 134 119 Mill Road ETOBICOKE 4.16 kV 0.94ETLFF4 MILL MS 135 119 Mill Road ETOBICOKE 4.16 kV 0.87TO38M29 MANBY TS 136 850 Kipling Ave TORONTO 27.6 kV 8.51YK11M1 RUNNYMEDE TS 137 99 Woolner Ave YORK 27.6 kV 11.33YK11M2 RUNNYMEDE TS 138 99 Woolner Ave YORK 27.6 kV 18.41YK11M3 RUNNYMEDE TS 139 99 Woolner Ave YORK 27.6 kV 6.58YK11M5 RUNNYMEDE TS 140 99 Woolner Ave YORK 27.6 kV 32.37YK11M6 RUNNYMEDE TS 141 99 Woolner Ave YORK 27.6 kV 2.54YK11M7 RUNNYMEDE TS 142 99 Woolner Ave YORK 27.6 kV 10.99YK11M8 RUNNYMEDE TS 143 99 Woolner Ave YORK 27.6 kV 39.03NY55M1 FINCH I TS 144 1 SIGNET DR. NORTH YORK 27.6 kV 8.02NY55M10 FINCH I TS 145 1 SIGNET DR. NORTH YORK 27.6 kV 3.04NY55M2 FINCH I TS 146 1 SIGNET DR. NORTH YORK 27.6 kV 6.53NY55M3 FINCH I TS 147 1 SIGNET DR. NORTH YORK 27.6 kV 2.66NY55M5 FINCH I TS 148 1 SIGNET DR. NORTH YORK 27.6 kV 3.37NY55M7 FINCH I TS 149 1 SIGNET DR. NORTH YORK 27.6 kV 21.89NY55M8 FINCH I TS 150 1 SIGNET DR. NORTH YORK 27.6 kV 8.86NY55M9 FINCH I TS 151 1 SIGNET DR. NORTH YORK 27.6 kV 5.91ETBAF1 NEILSON DR MS 152 4237 Bloor St W ETOBICOKE 4.16 kV 2.54ETBAF2 NEILSON DR MS 153 4237 Bloor St W ETOBICOKE 4.16 kV 1.66ETBAF3 NEILSON DR MS 154 4237 Bloor St W ETOBICOKE 4.16 kV 4.36ETBAF4 NEILSON DR MS 155 4237 Bloor St W ETOBICOKE 4.16 kV 1.99
Page 15 of 31
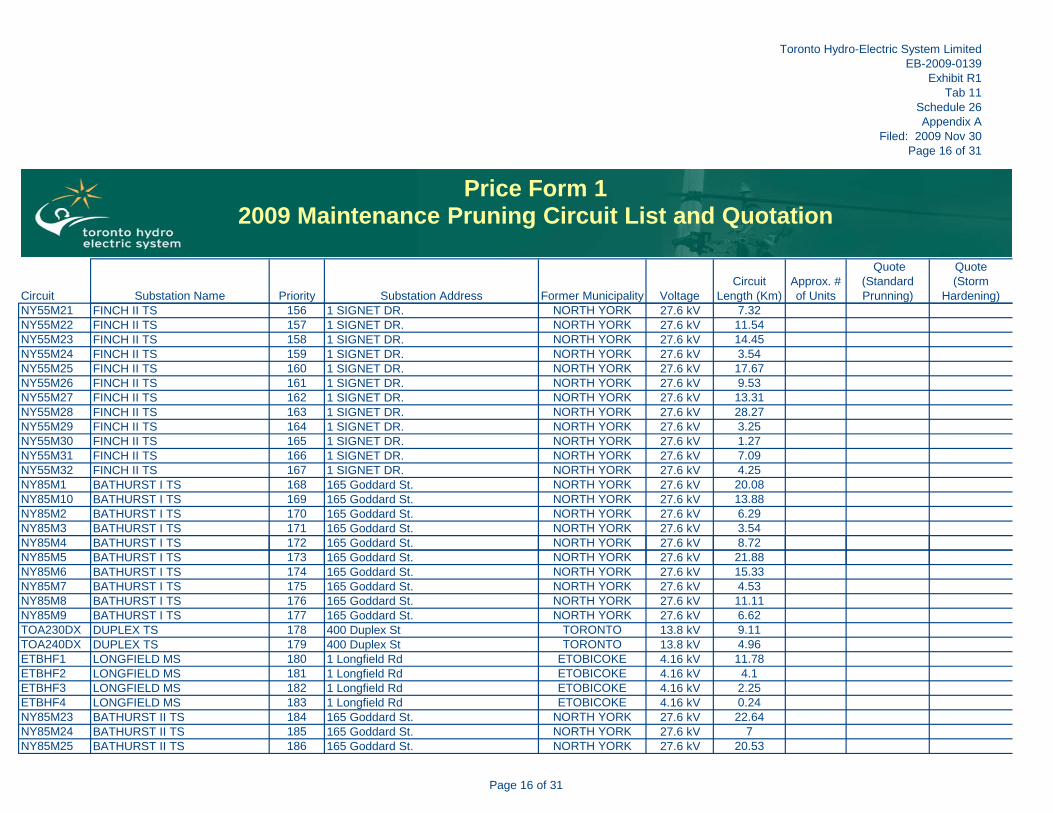
Toronto Hydro-Electric System LimitedEB-2009-0139
Exhibit R1Tab 11
Schedule 26Appendix A
Filed: 2009 Nov 30Page 16 of 31
Circuit Substation Name Priority Substation Address Former Municipality VoltageCircuit
Length (Km)Approx. # of Units
Quote(Standard Prunning)
Quote(Storm
Hardening)
Price Form 12008 Maintenance Pruning Circuit List and Quotation
Price Form 12009 Maintenance Pruning Circuit List and Quotation
NY55M21 FINCH II TS 156 1 SIGNET DR. NORTH YORK 27.6 kV 7.32NY55M22 FINCH II TS 157 1 SIGNET DR. NORTH YORK 27.6 kV 11.54NY55M23 FINCH II TS 158 1 SIGNET DR. NORTH YORK 27.6 kV 14.45NY55M24 FINCH II TS 159 1 SIGNET DR. NORTH YORK 27.6 kV 3.54NY55M25 FINCH II TS 160 1 SIGNET DR. NORTH YORK 27.6 kV 17.67NY55M26 FINCH II TS 161 1 SIGNET DR. NORTH YORK 27.6 kV 9.53NY55M27 FINCH II TS 162 1 SIGNET DR. NORTH YORK 27.6 kV 13.31NY55M28 FINCH II TS 163 1 SIGNET DR. NORTH YORK 27.6 kV 28.27NY55M29 FINCH II TS 164 1 SIGNET DR. NORTH YORK 27.6 kV 3.25NY55M30 FINCH II TS 165 1 SIGNET DR. NORTH YORK 27.6 kV 1.27NY55M31 FINCH II TS 166 1 SIGNET DR. NORTH YORK 27.6 kV 7.09NY55M32 FINCH II TS 167 1 SIGNET DR. NORTH YORK 27.6 kV 4.25NY85M1 BATHURST I TS 168 165 Goddard St. NORTH YORK 27.6 kV 20.08NY85M10 BATHURST I TS 169 165 Goddard St. NORTH YORK 27.6 kV 13.88NY85M2 BATHURST I TS 170 165 Goddard St. NORTH YORK 27.6 kV 6.29NY85M3 BATHURST I TS 171 165 Goddard St. NORTH YORK 27.6 kV 3.54NY85M4 BATHURST I TS 172 165 Goddard St. NORTH YORK 27.6 kV 8.72NY85M5 BATHURST I TS 173 165 Goddard St. NORTH YORK 27.6 kV 21.88NY85M6 BATHURST I TS 174 165 Goddard St. NORTH YORK 27.6 kV 15.33NY85M7 BATHURST I TS 175 165 Goddard St. NORTH YORK 27.6 kV 4.53NY85M8 BATHURST I TS 176 165 Goddard St. NORTH YORK 27.6 kV 11.11NY85M9 BATHURST I TS 177 165 Goddard St. NORTH YORK 27.6 kV 6.62TOA230DX DUPLEX TS 178 400 Duplex St TORONTO 13.8 kV 9.11TOA240DX DUPLEX TS 179 400 Duplex St TORONTO 13.8 kV 4.96ETBHF1 LONGFIELD MS 180 1 Longfield Rd ETOBICOKE 4.16 kV 11.78ETBHF2 LONGFIELD MS 181 1 Longfield Rd ETOBICOKE 4.16 kV 4.1ETBHF3 LONGFIELD MS 182 1 Longfield Rd ETOBICOKE 4.16 kV 2.25ETBHF4 LONGFIELD MS 183 1 Longfield Rd ETOBICOKE 4.16 kV 0.24NY85M23 BATHURST II TS 184 165 Goddard St. NORTH YORK 27.6 kV 22.64NY85M24 BATHURST II TS 185 165 Goddard St. NORTH YORK 27.6 kV 7NY85M25 BATHURST II TS 186 165 Goddard St. NORTH YORK 27.6 kV 20.53
Page 16 of 31
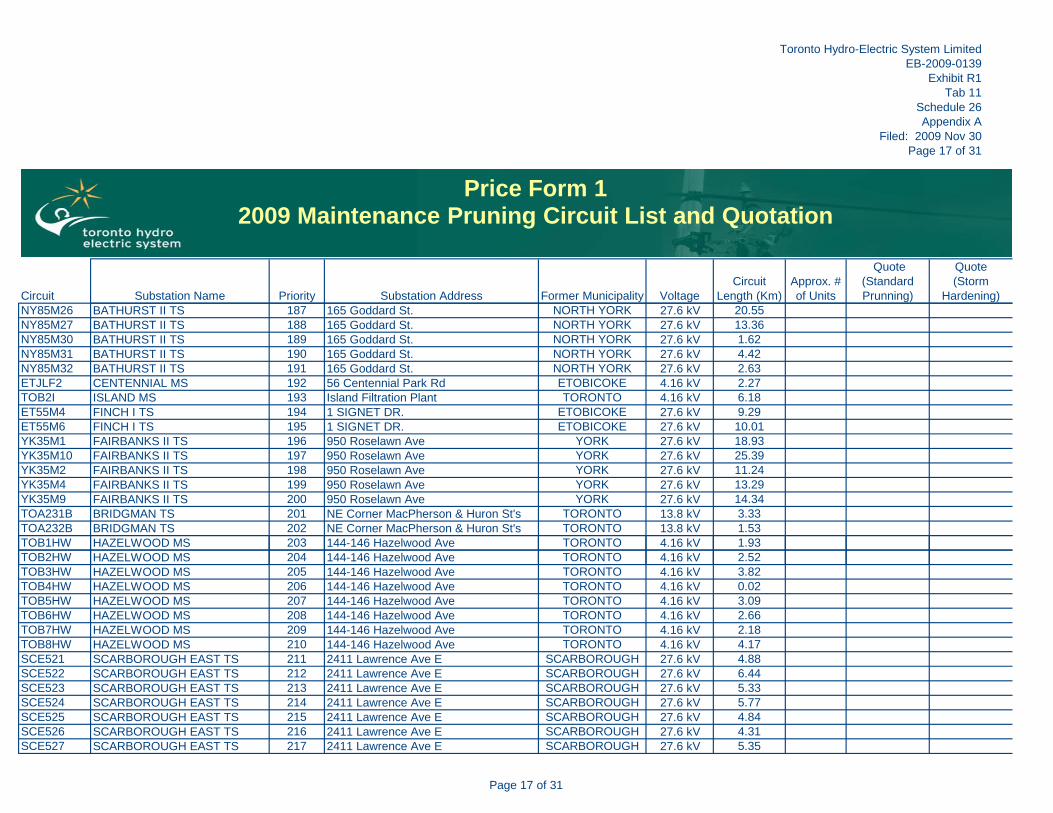
Toronto Hydro-Electric System LimitedEB-2009-0139
Exhibit R1Tab 11
Schedule 26Appendix A
Filed: 2009 Nov 30Page 17 of 31
Circuit Substation Name Priority Substation Address Former Municipality VoltageCircuit
Length (Km)Approx. # of Units
Quote(Standard Prunning)
Quote(Storm
Hardening)
Price Form 12008 Maintenance Pruning Circuit List and Quotation
Price Form 12009 Maintenance Pruning Circuit List and Quotation
NY85M26 BATHURST II TS 187 165 Goddard St. NORTH YORK 27.6 kV 20.55NY85M27 BATHURST II TS 188 165 Goddard St. NORTH YORK 27.6 kV 13.36NY85M30 BATHURST II TS 189 165 Goddard St. NORTH YORK 27.6 kV 1.62NY85M31 BATHURST II TS 190 165 Goddard St. NORTH YORK 27.6 kV 4.42NY85M32 BATHURST II TS 191 165 Goddard St. NORTH YORK 27.6 kV 2.63ETJLF2 CENTENNIAL MS 192 56 Centennial Park Rd ETOBICOKE 4.16 kV 2.27TOB2I ISLAND MS 193 Island Filtration Plant TORONTO 4.16 kV 6.18ET55M4 FINCH I TS 194 1 SIGNET DR. ETOBICOKE 27.6 kV 9.29ET55M6 FINCH I TS 195 1 SIGNET DR. ETOBICOKE 27.6 kV 10.01YK35M1 FAIRBANKS II TS 196 950 Roselawn Ave YORK 27.6 kV 18.93YK35M10 FAIRBANKS II TS 197 950 Roselawn Ave YORK 27.6 kV 25.39YK35M2 FAIRBANKS II TS 198 950 Roselawn Ave YORK 27.6 kV 11.24YK35M4 FAIRBANKS II TS 199 950 Roselawn Ave YORK 27.6 kV 13.29YK35M9 FAIRBANKS II TS 200 950 Roselawn Ave YORK 27.6 kV 14.34TOA231B BRIDGMAN TS 201 NE Corner MacPherson & Huron St's TORONTO 13.8 kV 3.33TOA232B BRIDGMAN TS 202 NE Corner MacPherson & Huron St's TORONTO 13.8 kV 1.53TOB1HW HAZELWOOD MS 203 144-146 Hazelwood Ave TORONTO 4.16 kV 1.93TOB2HW HAZELWOOD MS 204 144-146 Hazelwood Ave TORONTO 4.16 kV 2.52TOB3HW HAZELWOOD MS 205 144-146 Hazelwood Ave TORONTO 4.16 kV 3.82TOB4HW HAZELWOOD MS 206 144-146 Hazelwood Ave TORONTO 4.16 kV 0.02TOB5HW HAZELWOOD MS 207 144-146 Hazelwood Ave TORONTO 4.16 kV 3.09TOB6HW HAZELWOOD MS 208 144-146 Hazelwood Ave TORONTO 4.16 kV 2.66TOB7HW HAZELWOOD MS 209 144-146 Hazelwood Ave TORONTO 4.16 kV 2.18TOB8HW HAZELWOOD MS 210 144-146 Hazelwood Ave TORONTO 4.16 kV 4.17SCE521 SCARBOROUGH EAST TS 211 2411 Lawrence Ave E SCARBOROUGH 27.6 kV 4.88SCE522 SCARBOROUGH EAST TS 212 2411 Lawrence Ave E SCARBOROUGH 27.6 kV 6.44SCE523 SCARBOROUGH EAST TS 213 2411 Lawrence Ave E SCARBOROUGH 27.6 kV 5.33SCE524 SCARBOROUGH EAST TS 214 2411 Lawrence Ave E SCARBOROUGH 27.6 kV 5.77SCE525 SCARBOROUGH EAST TS 215 2411 Lawrence Ave E SCARBOROUGH 27.6 kV 4.84SCE526 SCARBOROUGH EAST TS 216 2411 Lawrence Ave E SCARBOROUGH 27.6 kV 4.31SCE527 SCARBOROUGH EAST TS 217 2411 Lawrence Ave E SCARBOROUGH 27.6 kV 5.35
Page 17 of 31
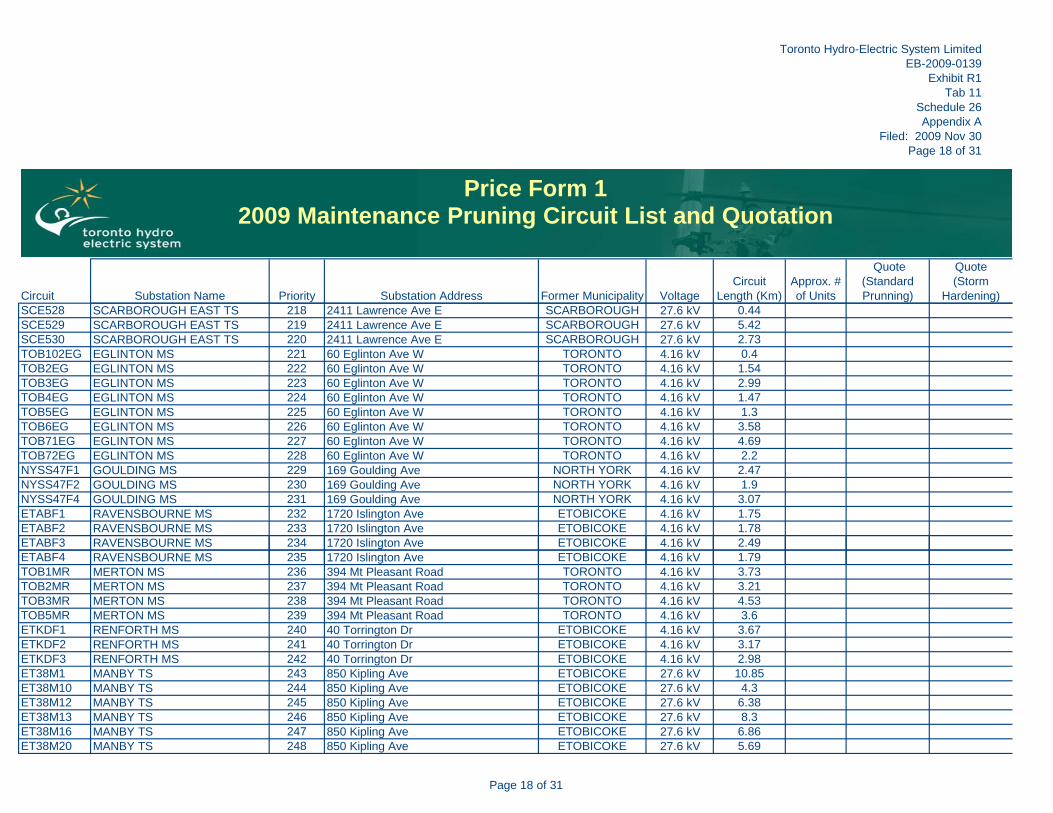
Toronto Hydro-Electric System LimitedEB-2009-0139
Exhibit R1Tab 11
Schedule 26Appendix A
Filed: 2009 Nov 30Page 18 of 31
Circuit Substation Name Priority Substation Address Former Municipality VoltageCircuit
Length (Km)Approx. # of Units
Quote(Standard Prunning)
Quote(Storm
Hardening)
Price Form 12008 Maintenance Pruning Circuit List and Quotation
Price Form 12009 Maintenance Pruning Circuit List and Quotation
SCE528 SCARBOROUGH EAST TS 218 2411 Lawrence Ave E SCARBOROUGH 27.6 kV 0.44SCE529 SCARBOROUGH EAST TS 219 2411 Lawrence Ave E SCARBOROUGH 27.6 kV 5.42SCE530 SCARBOROUGH EAST TS 220 2411 Lawrence Ave E SCARBOROUGH 27.6 kV 2.73TOB102EG EGLINTON MS 221 60 Eglinton Ave W TORONTO 4.16 kV 0.4TOB2EG EGLINTON MS 222 60 Eglinton Ave W TORONTO 4.16 kV 1.54TOB3EG EGLINTON MS 223 60 Eglinton Ave W TORONTO 4.16 kV 2.99TOB4EG EGLINTON MS 224 60 Eglinton Ave W TORONTO 4.16 kV 1.47TOB5EG EGLINTON MS 225 60 Eglinton Ave W TORONTO 4.16 kV 1.3TOB6EG EGLINTON MS 226 60 Eglinton Ave W TORONTO 4.16 kV 3.58TOB71EG EGLINTON MS 227 60 Eglinton Ave W TORONTO 4.16 kV 4.69TOB72EG EGLINTON MS 228 60 Eglinton Ave W TORONTO 4.16 kV 2.2NYSS47F1 GOULDING MS 229 169 Goulding Ave NORTH YORK 4.16 kV 2.47NYSS47F2 GOULDING MS 230 169 Goulding Ave NORTH YORK 4.16 kV 1.9NYSS47F4 GOULDING MS 231 169 Goulding Ave NORTH YORK 4.16 kV 3.07ETABF1 RAVENSBOURNE MS 232 1720 Islington Ave ETOBICOKE 4.16 kV 1.75ETABF2 RAVENSBOURNE MS 233 1720 Islington Ave ETOBICOKE 4.16 kV 1.78ETABF3 RAVENSBOURNE MS 234 1720 Islington Ave ETOBICOKE 4.16 kV 2.49gETABF4 RAVENSBOURNE MS 235 1720 Islington Ave ETOBICOKE 4.16 kV 1.79TOB1MR MERTON MS 236 394 Mt Pleasant Road TORONTO 4.16 kV 3.73TOB2MR MERTON MS 237 394 Mt Pleasant Road TORONTO 4.16 kV 3.21TOB3MR MERTON MS 238 394 Mt Pleasant Road TORONTO 4.16 kV 4.53TOB5MR MERTON MS 239 394 Mt Pleasant Road TORONTO 4.16 kV 3.6ETKDF1 RENFORTH MS 240 40 Torrington Dr ETOBICOKE 4.16 kV 3.67ETKDF2 RENFORTH MS 241 40 Torrington Dr ETOBICOKE 4.16 kV 3.17ETKDF3 RENFORTH MS 242 40 Torrington Dr ETOBICOKE 4.16 kV 2.98ET38M1 MANBY TS 243 850 Kipling Ave ETOBICOKE 27.6 kV 10.85ET38M10 MANBY TS 244 850 Kipling Ave ETOBICOKE 27.6 kV 4.3ET38M12 MANBY TS 245 850 Kipling Ave ETOBICOKE 27.6 kV 6.38ET38M13 MANBY TS 246 850 Kipling Ave ETOBICOKE 27.6 kV 8.3ET38M16 MANBY TS 247 850 Kipling Ave ETOBICOKE 27.6 kV 6.86ET38M20 MANBY TS 248 850 Kipling Ave ETOBICOKE 27.6 kV 5.69
Page 18 of 31
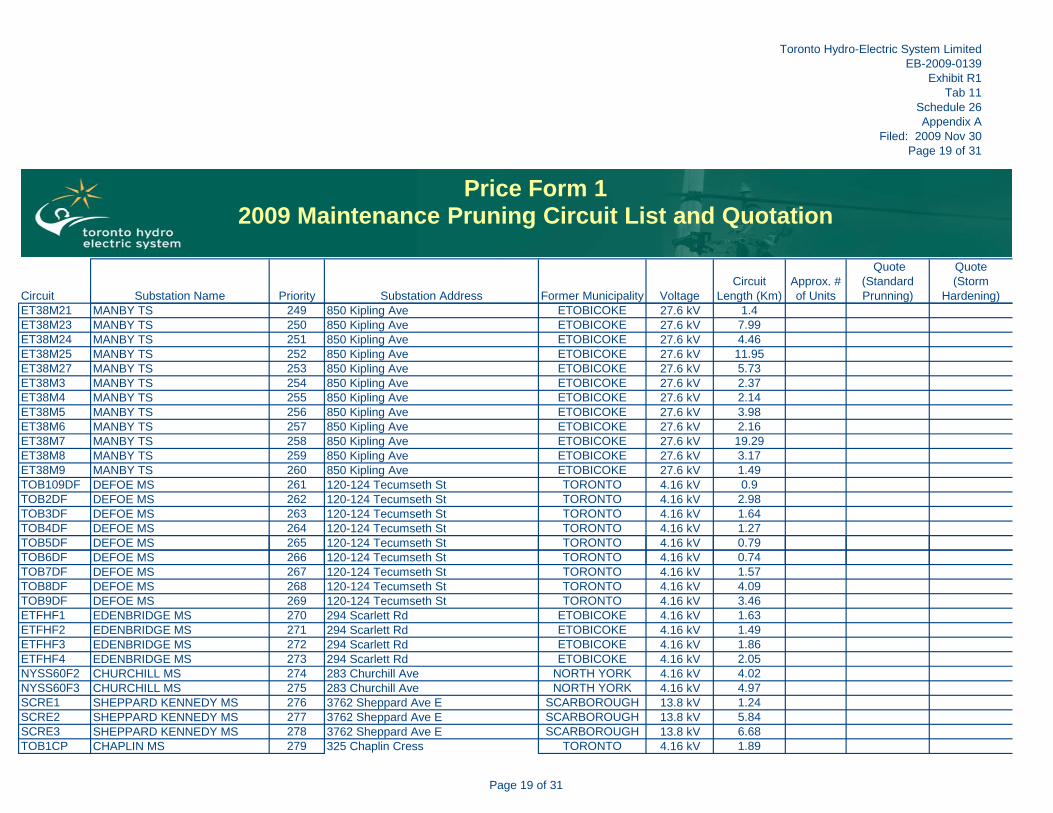
Toronto Hydro-Electric System LimitedEB-2009-0139
Exhibit R1Tab 11
Schedule 26Appendix A
Filed: 2009 Nov 30Page 19 of 31
Circuit Substation Name Priority Substation Address Former Municipality VoltageCircuit
Length (Km)Approx. # of Units
Quote(Standard Prunning)
Quote(Storm
Hardening)
Price Form 12008 Maintenance Pruning Circuit List and Quotation
Price Form 12009 Maintenance Pruning Circuit List and Quotation
ET38M21 MANBY TS 249 850 Kipling Ave ETOBICOKE 27.6 kV 1.4ET38M23 MANBY TS 250 850 Kipling Ave ETOBICOKE 27.6 kV 7.99ET38M24 MANBY TS 251 850 Kipling Ave ETOBICOKE 27.6 kV 4.46ET38M25 MANBY TS 252 850 Kipling Ave ETOBICOKE 27.6 kV 11.95ET38M27 MANBY TS 253 850 Kipling Ave ETOBICOKE 27.6 kV 5.73ET38M3 MANBY TS 254 850 Kipling Ave ETOBICOKE 27.6 kV 2.37ET38M4 MANBY TS 255 850 Kipling Ave ETOBICOKE 27.6 kV 2.14ET38M5 MANBY TS 256 850 Kipling Ave ETOBICOKE 27.6 kV 3.98ET38M6 MANBY TS 257 850 Kipling Ave ETOBICOKE 27.6 kV 2.16ET38M7 MANBY TS 258 850 Kipling Ave ETOBICOKE 27.6 kV 19.29ET38M8 MANBY TS 259 850 Kipling Ave ETOBICOKE 27.6 kV 3.17ET38M9 MANBY TS 260 850 Kipling Ave ETOBICOKE 27.6 kV 1.49TOB109DF DEFOE MS 261 120-124 Tecumseth St TORONTO 4.16 kV 0.9TOB2DF DEFOE MS 262 120-124 Tecumseth St TORONTO 4.16 kV 2.98TOB3DF DEFOE MS 263 120-124 Tecumseth St TORONTO 4.16 kV 1.64TOB4DF DEFOE MS 264 120-124 Tecumseth St TORONTO 4.16 kV 1.27TOB5DF DEFOE MS 265 120-124 Tecumseth St TORONTO 4.16 kV 0.79TOB6DF DEFOE MS 266 120-124 Tecumseth St TORONTO 4.16 kV 0.74TOB7DF DEFOE MS 267 120-124 Tecumseth St TORONTO 4.16 kV 1.57TOB8DF DEFOE MS 268 120-124 Tecumseth St TORONTO 4.16 kV 4.09TOB9DF DEFOE MS 269 120-124 Tecumseth St TORONTO 4.16 kV 3.46ETFHF1 EDENBRIDGE MS 270 294 Scarlett Rd ETOBICOKE 4.16 kV 1.63ETFHF2 EDENBRIDGE MS 271 294 Scarlett Rd ETOBICOKE 4.16 kV 1.49ETFHF3 EDENBRIDGE MS 272 294 Scarlett Rd ETOBICOKE 4.16 kV 1.86ETFHF4 EDENBRIDGE MS 273 294 Scarlett Rd ETOBICOKE 4.16 kV 2.05NYSS60F2 CHURCHILL MS 274 283 Churchill Ave NORTH YORK 4.16 kV 4.02NYSS60F3 CHURCHILL MS 275 283 Churchill Ave NORTH YORK 4.16 kV 4.97SCRE1 SHEPPARD KENNEDY MS 276 3762 Sheppard Ave E SCARBOROUGH 13.8 kV 1.24SCRE2 SHEPPARD KENNEDY MS 277 3762 Sheppard Ave E SCARBOROUGH 13.8 kV 5.84SCRE3 SHEPPARD KENNEDY MS 278 3762 Sheppard Ave E SCARBOROUGH 13.8 kV 6.68TOB1CP CHAPLIN MS 279 325 Chaplin Cress TORONTO 4.16 kV 1.89
Page 19 of 31
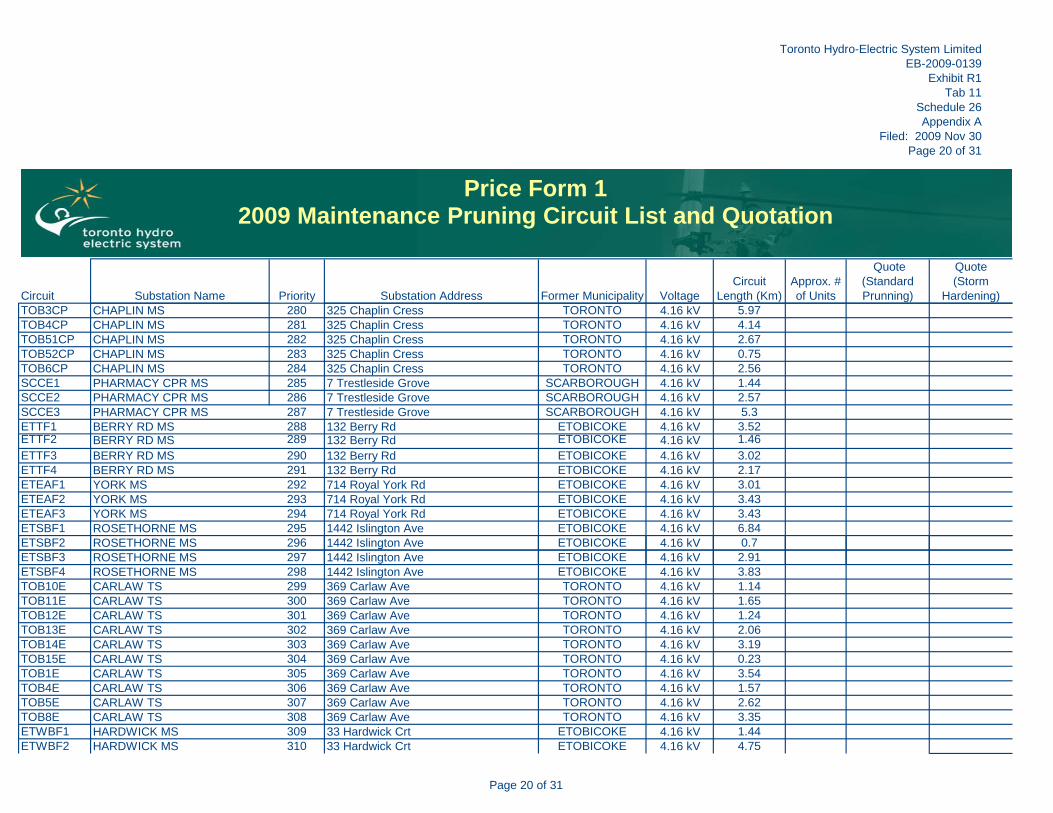
Toronto Hydro-Electric System LimitedEB-2009-0139
Exhibit R1Tab 11
Schedule 26Appendix A
Filed: 2009 Nov 30Page 20 of 31
Circuit Substation Name Priority Substation Address Former Municipality VoltageCircuit
Length (Km)Approx. # of Units
Quote(Standard Prunning)
Quote(Storm
Hardening)
Price Form 12008 Maintenance Pruning Circuit List and Quotation
Price Form 12009 Maintenance Pruning Circuit List and Quotation
TOB3CP CHAPLIN MS 280 325 Chaplin Cress TORONTO 4.16 kV 5.97TOB4CP CHAPLIN MS 281 325 Chaplin Cress TORONTO 4.16 kV 4.14TOB51CP CHAPLIN MS 282 325 Chaplin Cress TORONTO 4.16 kV 2.67TOB52CP CHAPLIN MS 283 325 Chaplin Cress TORONTO 4.16 kV 0.75TOB6CP CHAPLIN MS 284 325 Chaplin Cress TORONTO 4.16 kV 2.56SCCE1 PHARMACY CPR MS 285 7 Trestleside Grove SCARBOROUGH 4.16 kV 1.44SCCE2 PHARMACY CPR MS 286 7 Trestleside Grove SCARBOROUGH 4.16 kV 2.57SCCE3 PHARMACY CPR MS 287 7 Trestleside Grove SCARBOROUGH 4.16 kV 5.3ETTF1 BERRY RD MS 288 132 Berry Rd ETOBICOKE 4.16 kV 3.52ETTF2 BERRY RD MS 289 132 Berry Rd ETOBICOKE 4.16 kV 1.46ETTF3 BERRY RD MS 290 132 Berry Rd ETOBICOKE 4.16 kV 3.02ETTF4 BERRY RD MS 291 132 Berry Rd ETOBICOKE 4.16 kV 2.17ETEAF1 YORK MS 292 714 Royal York Rd ETOBICOKE 4.16 kV 3.01ETEAF2 YORK MS 293 714 Royal York Rd ETOBICOKE 4.16 kV 3.43ETEAF3 YORK MS 294 714 Royal York Rd ETOBICOKE 4.16 kV 3.43ETSBF1 ROSETHORNE MS 295 1442 Islington Ave ETOBICOKE 4.16 kV 6.84ETSBF2 ROSETHORNE MS 296 1442 Islington Ave ETOBICOKE 4.16 kV 0.7gETSBF3 ROSETHORNE MS 297 1442 Islington Ave ETOBICOKE 4.16 kV 2.91ETSBF4 ROSETHORNE MS 298 1442 Islington Ave ETOBICOKE 4.16 kV 3.83TOB10E CARLAW TS 299 369 Carlaw Ave TORONTO 4.16 kV 1.14TOB11E CARLAW TS 300 369 Carlaw Ave TORONTO 4.16 kV 1.65TOB12E CARLAW TS 301 369 Carlaw Ave TORONTO 4.16 kV 1.24TOB13E CARLAW TS 302 369 Carlaw Ave TORONTO 4.16 kV 2.06TOB14E CARLAW TS 303 369 Carlaw Ave TORONTO 4.16 kV 3.19TOB15E CARLAW TS 304 369 Carlaw Ave TORONTO 4.16 kV 0.23TOB1E CARLAW TS 305 369 Carlaw Ave TORONTO 4.16 kV 3.54TOB4E CARLAW TS 306 369 Carlaw Ave TORONTO 4.16 kV 1.57TOB5E CARLAW TS 307 369 Carlaw Ave TORONTO 4.16 kV 2.62TOB8E CARLAW TS 308 369 Carlaw Ave TORONTO 4.16 kV 3.35ETWBF1 HARDWICK MS 309 33 Hardwick Crt ETOBICOKE 4.16 kV 1.44ETWBF2 HARDWICK MS 310 33 Hardwick Crt ETOBICOKE 4.16 kV 4.75
Page 20 of 31
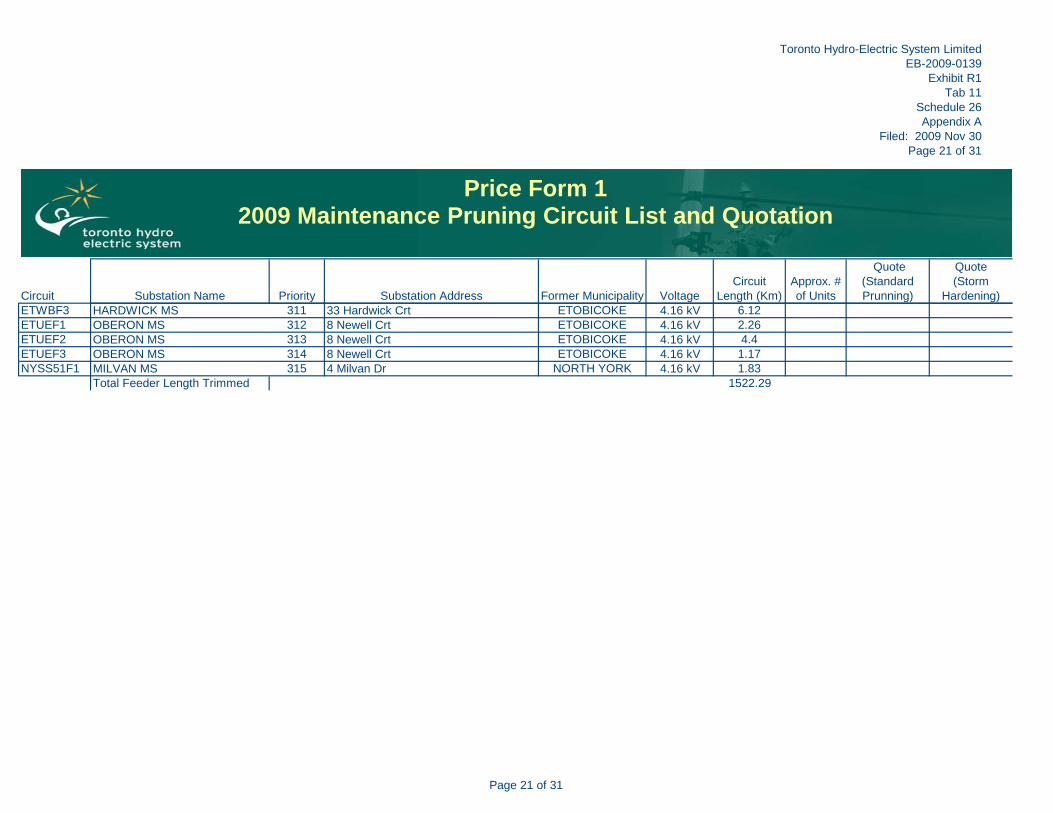
Toronto Hydro-Electric System LimitedEB-2009-0139
Exhibit R1Tab 11
Schedule 26Appendix A
Filed: 2009 Nov 30Page 21 of 31
Circuit Substation Name Priority Substation Address Former Municipality VoltageCircuit
Length (Km)Approx. # of Units
Quote(Standard Prunning)
Quote(Storm
Hardening)
Price Form 12008 Maintenance Pruning Circuit List and Quotation
Price Form 12009 Maintenance Pruning Circuit List and Quotation
ETWBF3 HARDWICK MS 311 33 Hardwick Crt ETOBICOKE 4.16 kV 6.12ETUEF1 OBERON MS 312 8 Newell Crt ETOBICOKE 4.16 kV 2.26ETUEF2 OBERON MS 313 8 Newell Crt ETOBICOKE 4.16 kV 4.4ETUEF3 OBERON MS 314 8 Newell Crt ETOBICOKE 4.16 kV 1.17NYSS51F1 MILVAN MS 315 4 Milvan Dr NORTH YORK 4.16 kV 1.83
Total Feeder Length Trimmed 1522.29
Page 21 of 31
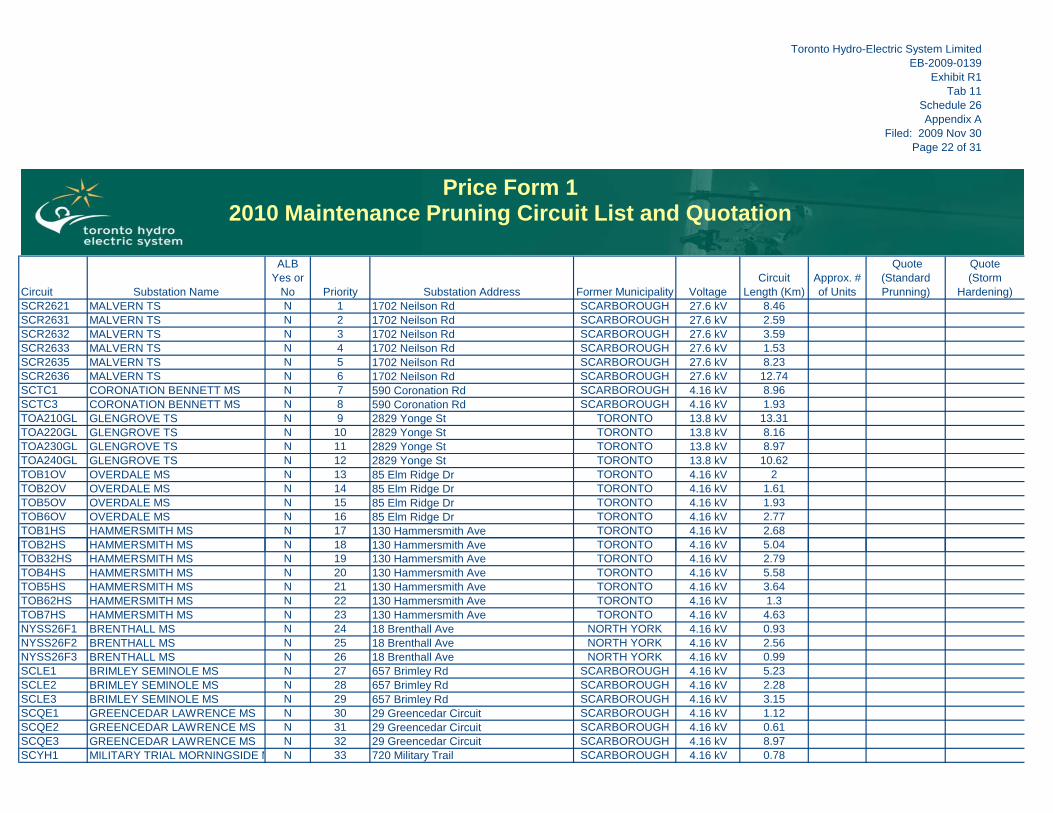
Toronto Hydro-Electric System LimitedEB-2009-0139
Exhibit R1Tab 11
Schedule 26Appendix A
Filed: 2009 Nov 30Page 22 of 31
Circuit Substation Name
ALB Yes or
No Priority Substation Address Former Municipality VoltageCircuit
Length (Km)Approx. # of Units
Quote(Standard Prunning)
Quote(Storm
Hardening)SCR2621 MALVERN TS N 1 1702 Neilson Rd SCARBOROUGH 27.6 kV 8.46SCR2631 MALVERN TS N 2 1702 Neilson Rd SCARBOROUGH 27.6 kV 2.59SCR2632 MALVERN TS N 3 1702 Neilson Rd SCARBOROUGH 27.6 kV 3.59SCR2633 MALVERN TS N 4 1702 Neilson Rd SCARBOROUGH 27.6 kV 1.53SCR2635 MALVERN TS N 5 1702 Neilson Rd SCARBOROUGH 27.6 kV 8.23SCR2636 MALVERN TS N 6 1702 Neilson Rd SCARBOROUGH 27.6 kV 12.74SCTC1 CORONATION BENNETT MS N 7 590 Coronation Rd SCARBOROUGH 4.16 kV 8.96SCTC3 CORONATION BENNETT MS N 8 590 Coronation Rd SCARBOROUGH 4.16 kV 1.93TOA210GL GLENGROVE TS N 9 2829 Yonge St TORONTO 13.8 kV 13.31TOA220GL GLENGROVE TS N 10 2829 Yonge St TORONTO 13.8 kV 8.16TOA230GL GLENGROVE TS N 11 2829 Yonge St TORONTO 13.8 kV 8.97TOA240GL GLENGROVE TS N 12 2829 Yonge St TORONTO 13.8 kV 10.62TOB1OV OVERDALE MS N 13 85 Elm Ridge Dr TORONTO 4.16 kV 2TOB2OV OVERDALE MS N 14 85 Elm Ridge Dr TORONTO 4.16 kV 1.61TOB5OV OVERDALE MS N 15 85 Elm Ridge Dr TORONTO 4.16 kV 1.93TOB6OV OVERDALE MS N 16 85 Elm Ridge Dr TORONTO 4.16 kV 2.77TOB1HS HAMMERSMITH MS N 17 130 Hammersmith Ave TORONTO 4.16 kV 2.68TOB2HS HAMMERSMITH MS N 18 130 Hammersmith Ave TORONTO 4.16 kV 5.04
Price Form 12010 Maintenance Pruning Circuit List and Quotation
Price Form 12008 Maintenance Pruning Circuit List and Quotation
Price Form 12010 Maintenance Pruning Circuit List and Quotation
TOB32HS HAMMERSMITH MS N 19 130 Hammersmith Ave TORONTO 4.16 kV 2.79TOB4HS HAMMERSMITH MS N 20 130 Hammersmith Ave TORONTO 4.16 kV 5.58TOB5HS HAMMERSMITH MS N 21 130 Hammersmith Ave TORONTO 4.16 kV 3.64TOB62HS HAMMERSMITH MS N 22 130 Hammersmith Ave TORONTO 4.16 kV 1.3TOB7HS HAMMERSMITH MS N 23 130 Hammersmith Ave TORONTO 4.16 kV 4.63NYSS26F1 BRENTHALL MS N 24 18 Brenthall Ave NORTH YORK 4.16 kV 0.93NYSS26F2 BRENTHALL MS N 25 18 Brenthall Ave NORTH YORK 4.16 kV 2.56NYSS26F3 BRENTHALL MS N 26 18 Brenthall Ave NORTH YORK 4.16 kV 0.99SCLE1 BRIMLEY SEMINOLE MS N 27 657 Brimley Rd SCARBOROUGH 4.16 kV 5.23SCLE2 BRIMLEY SEMINOLE MS N 28 657 Brimley Rd SCARBOROUGH 4.16 kV 2.28SCLE3 BRIMLEY SEMINOLE MS N 29 657 Brimley Rd SCARBOROUGH 4.16 kV 3.15SCQE1 GREENCEDAR LAWRENCE MS N 30 29 Greencedar Circuit SCARBOROUGH 4.16 kV 1.12SCQE2 GREENCEDAR LAWRENCE MS N 31 29 Greencedar Circuit SCARBOROUGH 4.16 kV 0.61SCQE3 GREENCEDAR LAWRENCE MS N 32 29 Greencedar Circuit SCARBOROUGH 4.16 kV 8.97SCYH1 MILITARY TRIAL MORNINGSIDE M N 33 720 Military Trail SCARBOROUGH 4.16 kV 0.78
Price Form 12010 Maintenance Pruning Circuit List and Quotation
Price Form 12008 Maintenance Pruning Circuit List and Quotation
Price Form 12010 Maintenance Pruning Circuit List and Quotation
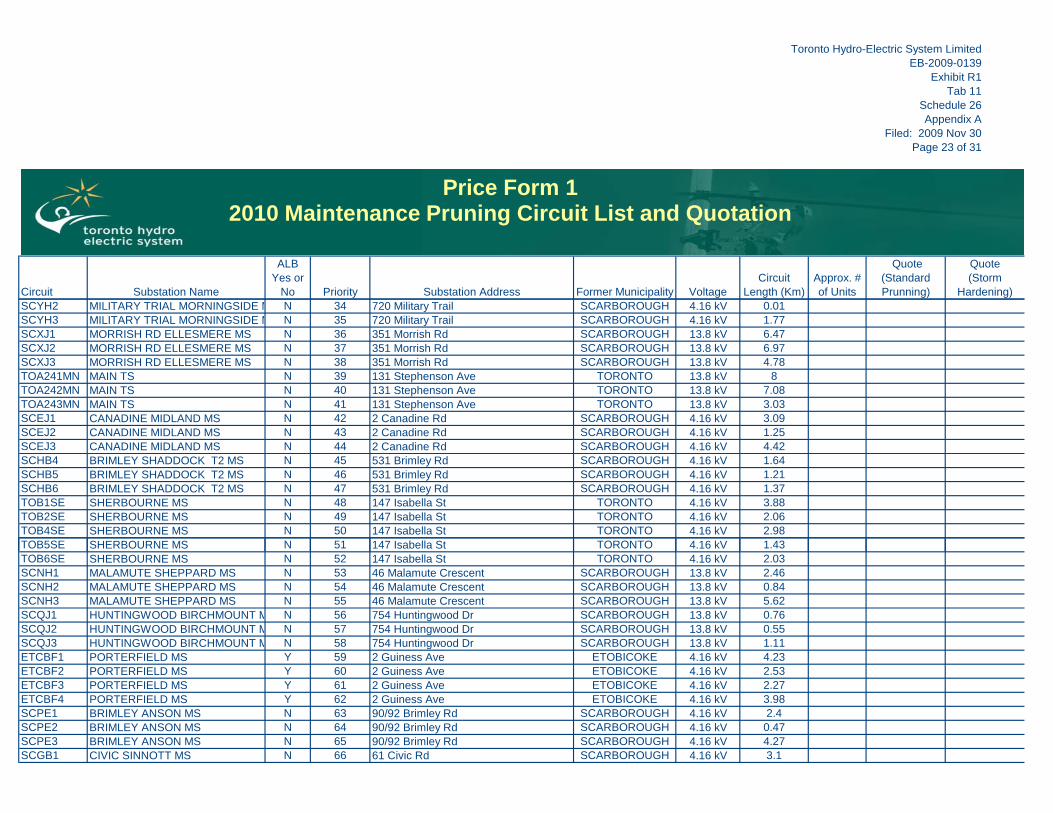
Toronto Hydro-Electric System LimitedEB-2009-0139
Exhibit R1Tab 11
Schedule 26Appendix A
Filed: 2009 Nov 30Page 23 of 31
Circuit Substation Name
ALB Yes or
No Priority Substation Address Former Municipality VoltageCircuit
Length (Km)Approx. # of Units
Quote(Standard Prunning)
Quote(Storm
Hardening)
Price Form 12010 Maintenance Pruning Circuit List and Quotation
Price Form 12008 Maintenance Pruning Circuit List and Quotation
Price Form 12010 Maintenance Pruning Circuit List and Quotation
SCYH2 MILITARY TRIAL MORNINGSIDE M N 34 720 Military Trail SCARBOROUGH 4.16 kV 0.01SCYH3 MILITARY TRIAL MORNINGSIDE M N 35 720 Military Trail SCARBOROUGH 4.16 kV 1.77SCXJ1 MORRISH RD ELLESMERE MS N 36 351 Morrish Rd SCARBOROUGH 13.8 kV 6.47SCXJ2 MORRISH RD ELLESMERE MS N 37 351 Morrish Rd SCARBOROUGH 13.8 kV 6.97SCXJ3 MORRISH RD ELLESMERE MS N 38 351 Morrish Rd SCARBOROUGH 13.8 kV 4.78TOA241MN MAIN TS N 39 131 Stephenson Ave TORONTO 13.8 kV 8TOA242MN MAIN TS N 40 131 Stephenson Ave TORONTO 13.8 kV 7.08TOA243MN MAIN TS N 41 131 Stephenson Ave TORONTO 13.8 kV 3.03SCEJ1 CANADINE MIDLAND MS N 42 2 Canadine Rd SCARBOROUGH 4.16 kV 3.09SCEJ2 CANADINE MIDLAND MS N 43 2 Canadine Rd SCARBOROUGH 4.16 kV 1.25SCEJ3 CANADINE MIDLAND MS N 44 2 Canadine Rd SCARBOROUGH 4.16 kV 4.42SCHB4 BRIMLEY SHADDOCK T2 MS N 45 531 Brimley Rd SCARBOROUGH 4.16 kV 1.64SCHB5 BRIMLEY SHADDOCK T2 MS N 46 531 Brimley Rd SCARBOROUGH 4.16 kV 1.21SCHB6 BRIMLEY SHADDOCK T2 MS N 47 531 Brimley Rd SCARBOROUGH 4.16 kV 1.37TOB1SE SHERBOURNE MS N 48 147 Isabella St TORONTO 4.16 kV 3.88TOB2SE SHERBOURNE MS N 49 147 Isabella St TORONTO 4.16 kV 2.06TOB4SE SHERBOURNE MS N 50 147 Isabella St TORONTO 4.16 kV 2.98TOB5SE SHERBOURNE MS N 51 147 Isabella St TORONTO 4.16 kV 1.43TOB6SE SHERBOURNE MS N 52 147 Isabella St TORONTO 4.16 kV 2.03SCNH1 MALAMUTE SHEPPARD MS N 53 46 Malamute Crescent SCARBOROUGH 13.8 kV 2.46SCNH2 MALAMUTE SHEPPARD MS N 54 46 Malamute Crescent SCARBOROUGH 13.8 kV 0.84SCNH3 MALAMUTE SHEPPARD MS N 55 46 Malamute Crescent SCARBOROUGH 13.8 kV 5.62SCQJ1 HUNTINGWOOD BIRCHMOUNT M N 56 754 Huntingwood Dr SCARBOROUGH 13.8 kV 0.76SCQJ2 HUNTINGWOOD BIRCHMOUNT M N 57 754 Huntingwood Dr SCARBOROUGH 13.8 kV 0.55SCQJ3 HUNTINGWOOD BIRCHMOUNT M N 58 754 Huntingwood Dr SCARBOROUGH 13.8 kV 1.11ETCBF1 PORTERFIELD MS Y 59 2 Guiness Ave ETOBICOKE 4.16 kV 4.23ETCBF2 PORTERFIELD MS Y 60 2 Guiness Ave ETOBICOKE 4.16 kV 2.53ETCBF3 PORTERFIELD MS Y 61 2 Guiness Ave ETOBICOKE 4.16 kV 2.27ETCBF4 PORTERFIELD MS Y 62 2 Guiness Ave ETOBICOKE 4.16 kV 3.98SCPE1 BRIMLEY ANSON MS N 63 90/92 Brimley Rd SCARBOROUGH 4.16 kV 2.4SCPE2 BRIMLEY ANSON MS N 64 90/92 Brimley Rd SCARBOROUGH 4.16 kV 0.47SCPE3 BRIMLEY ANSON MS N 65 90/92 Brimley Rd SCARBOROUGH 4.16 kV 4.27SCGB1 CIVIC SINNOTT MS N 66 61 Civic Rd SCARBOROUGH 4.16 kV 3.1
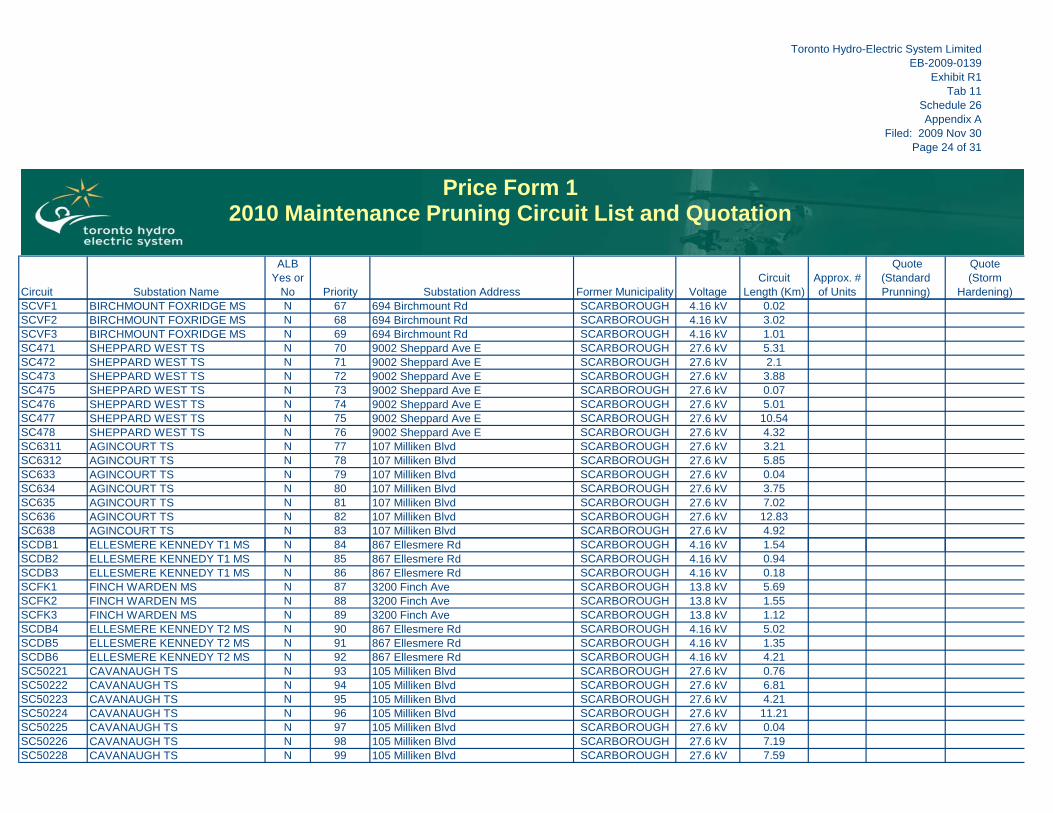
Toronto Hydro-Electric System LimitedEB-2009-0139
Exhibit R1Tab 11
Schedule 26Appendix A
Filed: 2009 Nov 30Page 24 of 31
Circuit Substation Name
ALB Yes or
No Priority Substation Address Former Municipality VoltageCircuit
Length (Km)Approx. # of Units
Quote(Standard Prunning)
Quote(Storm
Hardening)
Price Form 12010 Maintenance Pruning Circuit List and Quotation
Price Form 12008 Maintenance Pruning Circuit List and Quotation
Price Form 12010 Maintenance Pruning Circuit List and Quotation
SCVF1 BIRCHMOUNT FOXRIDGE MS N 67 694 Birchmount Rd SCARBOROUGH 4.16 kV 0.02SCVF2 BIRCHMOUNT FOXRIDGE MS N 68 694 Birchmount Rd SCARBOROUGH 4.16 kV 3.02SCVF3 BIRCHMOUNT FOXRIDGE MS N 69 694 Birchmount Rd SCARBOROUGH 4.16 kV 1.01SC471 SHEPPARD WEST TS N 70 9002 Sheppard Ave E SCARBOROUGH 27.6 kV 5.31SC472 SHEPPARD WEST TS N 71 9002 Sheppard Ave E SCARBOROUGH 27.6 kV 2.1SC473 SHEPPARD WEST TS N 72 9002 Sheppard Ave E SCARBOROUGH 27.6 kV 3.88SC475 SHEPPARD WEST TS N 73 9002 Sheppard Ave E SCARBOROUGH 27.6 kV 0.07SC476 SHEPPARD WEST TS N 74 9002 Sheppard Ave E SCARBOROUGH 27.6 kV 5.01SC477 SHEPPARD WEST TS N 75 9002 Sheppard Ave E SCARBOROUGH 27.6 kV 10.54SC478 SHEPPARD WEST TS N 76 9002 Sheppard Ave E SCARBOROUGH 27.6 kV 4.32SC6311 AGINCOURT TS N 77 107 Milliken Blvd SCARBOROUGH 27.6 kV 3.21SC6312 AGINCOURT TS N 78 107 Milliken Blvd SCARBOROUGH 27.6 kV 5.85SC633 AGINCOURT TS N 79 107 Milliken Blvd SCARBOROUGH 27.6 kV 0.04SC634 AGINCOURT TS N 80 107 Milliken Blvd SCARBOROUGH 27.6 kV 3.75SC635 AGINCOURT TS N 81 107 Milliken Blvd SCARBOROUGH 27.6 kV 7.02SC636 AGINCOURT TS N 82 107 Milliken Blvd SCARBOROUGH 27.6 kV 12.83SC638 AGINCOURT TS N 83 107 Milliken Blvd SCARBOROUGH 27.6 kV 4.92SCDB1 ELLESMERE KENNEDY T1 MS N 84 867 Ellesmere Rd SCARBOROUGH 4.16 kV 1.54SCDB2 ELLESMERE KENNEDY T1 MS N 85 867 Ellesmere Rd SCARBOROUGH 4.16 kV 0.94SCDB3 ELLESMERE KENNEDY T1 MS N 86 867 Ellesmere Rd SCARBOROUGH 4.16 kV 0.18SCFK1 FINCH WARDEN MS N 87 3200 Finch Ave SCARBOROUGH 13.8 kV 5.69SCFK2 FINCH WARDEN MS N 88 3200 Finch Ave SCARBOROUGH 13.8 kV 1.55SCFK3 FINCH WARDEN MS N 89 3200 Finch Ave SCARBOROUGH 13.8 kV 1.12SCDB4 ELLESMERE KENNEDY T2 MS N 90 867 Ellesmere Rd SCARBOROUGH 4.16 kV 5.02SCDB5 ELLESMERE KENNEDY T2 MS N 91 867 Ellesmere Rd SCARBOROUGH 4.16 kV 1.35SCDB6 ELLESMERE KENNEDY T2 MS N 92 867 Ellesmere Rd SCARBOROUGH 4.16 kV 4.21SC50221 CAVANAUGH TS N 93 105 Milliken Blvd SCARBOROUGH 27.6 kV 0.76SC50222 CAVANAUGH TS N 94 105 Milliken Blvd SCARBOROUGH 27.6 kV 6.81SC50223 CAVANAUGH TS N 95 105 Milliken Blvd SCARBOROUGH 27.6 kV 4.21SC50224 CAVANAUGH TS N 96 105 Milliken Blvd SCARBOROUGH 27.6 kV 11.21SC50225 CAVANAUGH TS N 97 105 Milliken Blvd SCARBOROUGH 27.6 kV 0.04SC50226 CAVANAUGH TS N 98 105 Milliken Blvd SCARBOROUGH 27.6 kV 7.19SC50228 CAVANAUGH TS N 99 105 Milliken Blvd SCARBOROUGH 27.6 kV 7.59
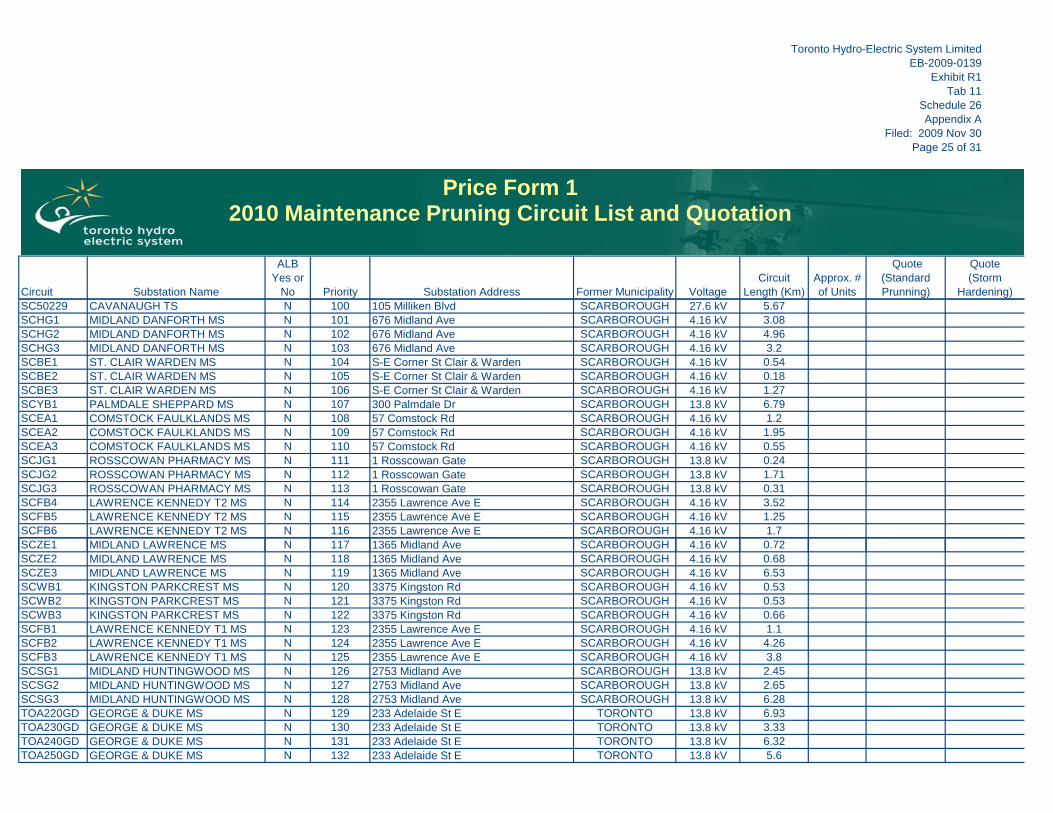
Toronto Hydro-Electric System LimitedEB-2009-0139
Exhibit R1Tab 11
Schedule 26Appendix A
Filed: 2009 Nov 30Page 25 of 31
Circuit Substation Name
ALB Yes or
No Priority Substation Address Former Municipality VoltageCircuit
Length (Km)Approx. # of Units
Quote(Standard Prunning)
Quote(Storm
Hardening)
Price Form 12010 Maintenance Pruning Circuit List and Quotation
Price Form 12008 Maintenance Pruning Circuit List and Quotation
Price Form 12010 Maintenance Pruning Circuit List and Quotation
SC50229 CAVANAUGH TS N 100 105 Milliken Blvd SCARBOROUGH 27.6 kV 5.67SCHG1 MIDLAND DANFORTH MS N 101 676 Midland Ave SCARBOROUGH 4.16 kV 3.08SCHG2 MIDLAND DANFORTH MS N 102 676 Midland Ave SCARBOROUGH 4.16 kV 4.96SCHG3 MIDLAND DANFORTH MS N 103 676 Midland Ave SCARBOROUGH 4.16 kV 3.2SCBE1 ST. CLAIR WARDEN MS N 104 S-E Corner St Clair & Warden SCARBOROUGH 4.16 kV 0.54SCBE2 ST. CLAIR WARDEN MS N 105 S-E Corner St Clair & Warden SCARBOROUGH 4.16 kV 0.18SCBE3 ST. CLAIR WARDEN MS N 106 S-E Corner St Clair & Warden SCARBOROUGH 4.16 kV 1.27SCYB1 PALMDALE SHEPPARD MS N 107 300 Palmdale Dr SCARBOROUGH 13.8 kV 6.79SCEA1 COMSTOCK FAULKLANDS MS N 108 57 Comstock Rd SCARBOROUGH 4.16 kV 1.2SCEA2 COMSTOCK FAULKLANDS MS N 109 57 Comstock Rd SCARBOROUGH 4.16 kV 1.95SCEA3 COMSTOCK FAULKLANDS MS N 110 57 Comstock Rd SCARBOROUGH 4.16 kV 0.55SCJG1 ROSSCOWAN PHARMACY MS N 111 1 Rosscowan Gate SCARBOROUGH 13.8 kV 0.24SCJG2 ROSSCOWAN PHARMACY MS N 112 1 Rosscowan Gate SCARBOROUGH 13.8 kV 1.71SCJG3 ROSSCOWAN PHARMACY MS N 113 1 Rosscowan Gate SCARBOROUGH 13.8 kV 0.31SCFB4 LAWRENCE KENNEDY T2 MS N 114 2355 Lawrence Ave E SCARBOROUGH 4.16 kV 3.52SCFB5 LAWRENCE KENNEDY T2 MS N 115 2355 Lawrence Ave E SCARBOROUGH 4.16 kV 1.25SCFB6 LAWRENCE KENNEDY T2 MS N 116 2355 Lawrence Ave E SCARBOROUGH 4.16 kV 1.7SCZE1 MIDLAND LAWRENCE MS N 117 1365 Midland Ave SCARBOROUGH 4.16 kV 0.72SCZE2 MIDLAND LAWRENCE MS N 118 1365 Midland Ave SCARBOROUGH 4.16 kV 0.68SCZE3 MIDLAND LAWRENCE MS N 119 1365 Midland Ave SCARBOROUGH 4.16 kV 6.53SCWB1 KINGSTON PARKCREST MS N 120 3375 Kingston Rd SCARBOROUGH 4.16 kV 0.53SCWB2 KINGSTON PARKCREST MS N 121 3375 Kingston Rd SCARBOROUGH 4.16 kV 0.53SCWB3 KINGSTON PARKCREST MS N 122 3375 Kingston Rd SCARBOROUGH 4.16 kV 0.66SCFB1 LAWRENCE KENNEDY T1 MS N 123 2355 Lawrence Ave E SCARBOROUGH 4.16 kV 1.1SCFB2 LAWRENCE KENNEDY T1 MS N 124 2355 Lawrence Ave E SCARBOROUGH 4.16 kV 4.26SCFB3 LAWRENCE KENNEDY T1 MS N 125 2355 Lawrence Ave E SCARBOROUGH 4.16 kV 3.8SCSG1 MIDLAND HUNTINGWOOD MS N 126 2753 Midland Ave SCARBOROUGH 13.8 kV 2.45SCSG2 MIDLAND HUNTINGWOOD MS N 127 2753 Midland Ave SCARBOROUGH 13.8 kV 2.65SCSG3 MIDLAND HUNTINGWOOD MS N 128 2753 Midland Ave SCARBOROUGH 13.8 kV 6.28TOA220GD GEORGE & DUKE MS N 129 233 Adelaide St E TORONTO 13.8 kV 6.93TOA230GD GEORGE & DUKE MS N 130 233 Adelaide St E TORONTO 13.8 kV 3.33TOA240GD GEORGE & DUKE MS N 131 233 Adelaide St E TORONTO 13.8 kV 6.32TOA250GD GEORGE & DUKE MS N 132 233 Adelaide St E TORONTO 13.8 kV 5.6
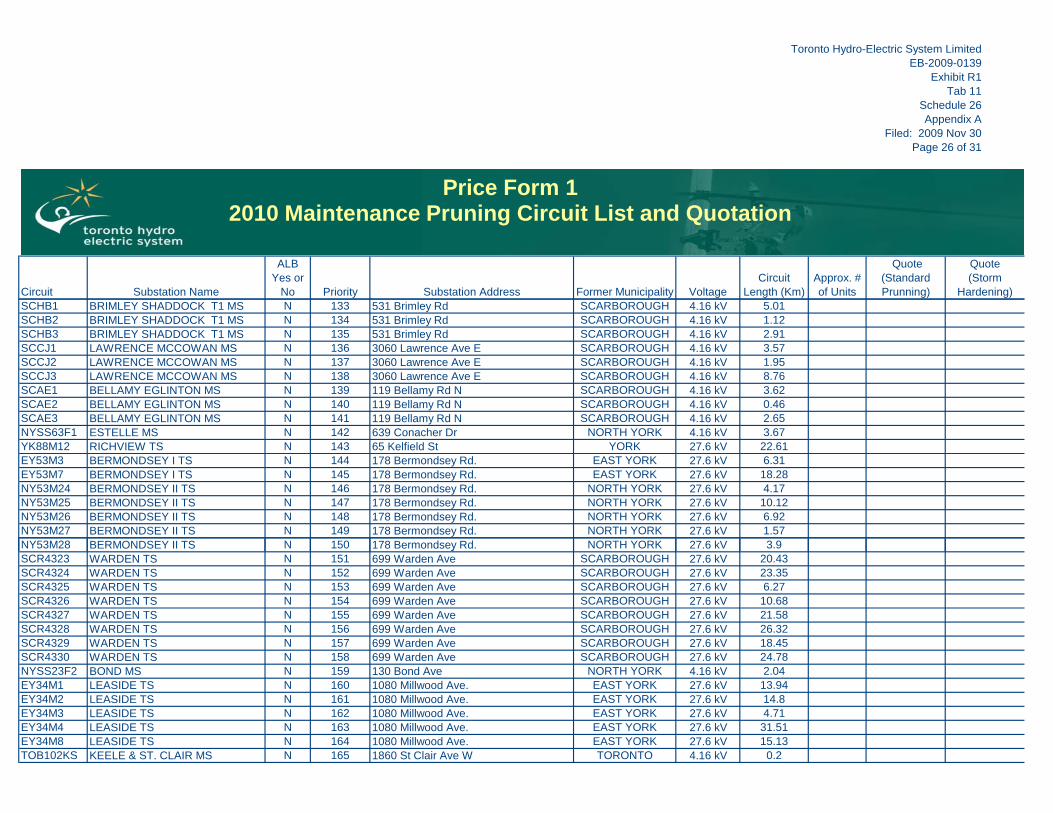
Toronto Hydro-Electric System LimitedEB-2009-0139
Exhibit R1Tab 11
Schedule 26Appendix A
Filed: 2009 Nov 30Page 26 of 31
Circuit Substation Name
ALB Yes or
No Priority Substation Address Former Municipality VoltageCircuit
Length (Km)Approx. # of Units
Quote(Standard Prunning)
Quote(Storm
Hardening)
Price Form 12010 Maintenance Pruning Circuit List and Quotation
Price Form 12008 Maintenance Pruning Circuit List and Quotation
Price Form 12010 Maintenance Pruning Circuit List and Quotation
SCHB1 BRIMLEY SHADDOCK T1 MS N 133 531 Brimley Rd SCARBOROUGH 4.16 kV 5.01SCHB2 BRIMLEY SHADDOCK T1 MS N 134 531 Brimley Rd SCARBOROUGH 4.16 kV 1.12SCHB3 BRIMLEY SHADDOCK T1 MS N 135 531 Brimley Rd SCARBOROUGH 4.16 kV 2.91SCCJ1 LAWRENCE MCCOWAN MS N 136 3060 Lawrence Ave E SCARBOROUGH 4.16 kV 3.57SCCJ2 LAWRENCE MCCOWAN MS N 137 3060 Lawrence Ave E SCARBOROUGH 4.16 kV 1.95SCCJ3 LAWRENCE MCCOWAN MS N 138 3060 Lawrence Ave E SCARBOROUGH 4.16 kV 8.76SCAE1 BELLAMY EGLINTON MS N 139 119 Bellamy Rd N SCARBOROUGH 4.16 kV 3.62SCAE2 BELLAMY EGLINTON MS N 140 119 Bellamy Rd N SCARBOROUGH 4.16 kV 0.46SCAE3 BELLAMY EGLINTON MS N 141 119 Bellamy Rd N SCARBOROUGH 4.16 kV 2.65NYSS63F1 ESTELLE MS N 142 639 Conacher Dr NORTH YORK 4.16 kV 3.67YK88M12 RICHVIEW TS N 143 65 Kelfield St YORK 27.6 kV 22.61EY53M3 BERMONDSEY I TS N 144 178 Bermondsey Rd. EAST YORK 27.6 kV 6.31EY53M7 BERMONDSEY I TS N 145 178 Bermondsey Rd. EAST YORK 27.6 kV 18.28NY53M24 BERMONDSEY II TS N 146 178 Bermondsey Rd. NORTH YORK 27.6 kV 4.17NY53M25 BERMONDSEY II TS N 147 178 Bermondsey Rd. NORTH YORK 27.6 kV 10.12NY53M26 BERMONDSEY II TS N 148 178 Bermondsey Rd. NORTH YORK 27.6 kV 6.92NY53M27 BERMONDSEY II TS N 149 178 Bermondsey Rd. NORTH YORK 27.6 kV 1.57NY53M28 BERMONDSEY II TS N 150 178 Bermondsey Rd. NORTH YORK 27.6 kV 3.9ySCR4323 WARDEN TS N 151 699 Warden Ave SCARBOROUGH 27.6 kV 20.43SCR4324 WARDEN TS N 152 699 Warden Ave SCARBOROUGH 27.6 kV 23.35SCR4325 WARDEN TS N 153 699 Warden Ave SCARBOROUGH 27.6 kV 6.27SCR4326 WARDEN TS N 154 699 Warden Ave SCARBOROUGH 27.6 kV 10.68SCR4327 WARDEN TS N 155 699 Warden Ave SCARBOROUGH 27.6 kV 21.58SCR4328 WARDEN TS N 156 699 Warden Ave SCARBOROUGH 27.6 kV 26.32SCR4329 WARDEN TS N 157 699 Warden Ave SCARBOROUGH 27.6 kV 18.45SCR4330 WARDEN TS N 158 699 Warden Ave SCARBOROUGH 27.6 kV 24.78NYSS23F2 BOND MS N 159 130 Bond Ave NORTH YORK 4.16 kV 2.04EY34M1 LEASIDE TS N 160 1080 Millwood Ave. EAST YORK 27.6 kV 13.94EY34M2 LEASIDE TS N 161 1080 Millwood Ave. EAST YORK 27.6 kV 14.8EY34M3 LEASIDE TS N 162 1080 Millwood Ave. EAST YORK 27.6 kV 4.71EY34M4 LEASIDE TS N 163 1080 Millwood Ave. EAST YORK 27.6 kV 31.51EY34M8 LEASIDE TS N 164 1080 Millwood Ave. EAST YORK 27.6 kV 15.13TOB102KS KEELE & ST. CLAIR MS N 165 1860 St Clair Ave W TORONTO 4.16 kV 0.2
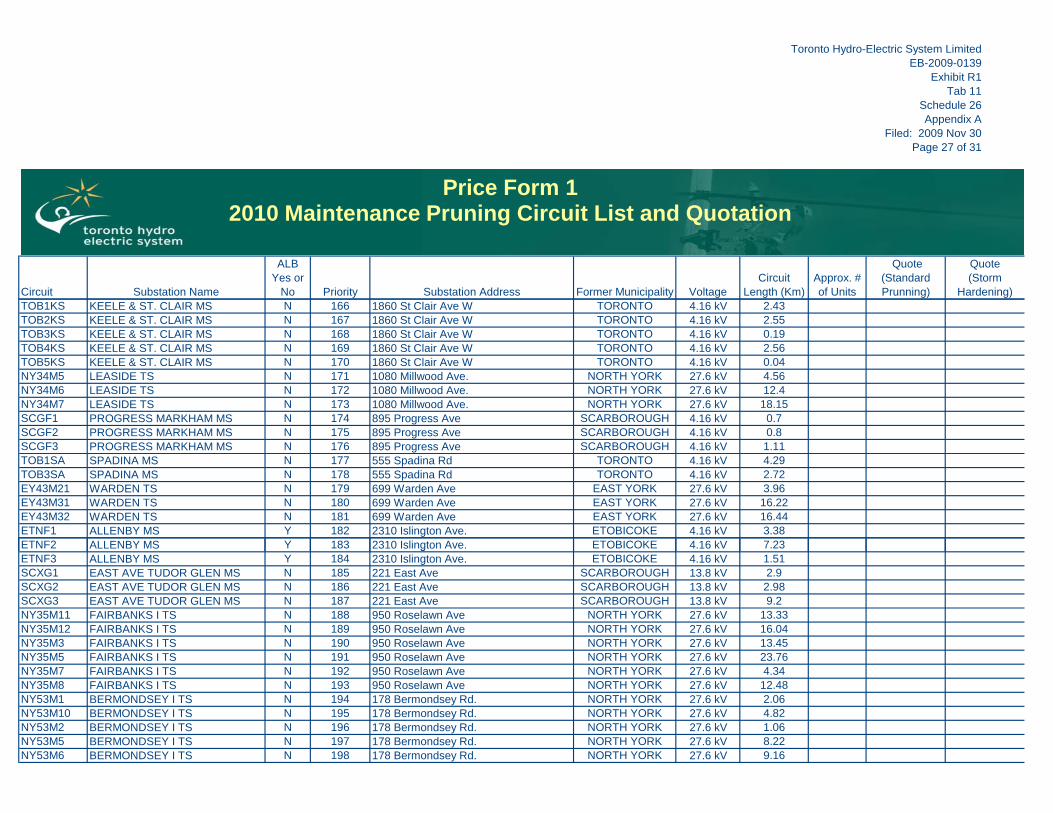
Toronto Hydro-Electric System LimitedEB-2009-0139
Exhibit R1Tab 11
Schedule 26Appendix A
Filed: 2009 Nov 30Page 27 of 31
Circuit Substation Name
ALB Yes or
No Priority Substation Address Former Municipality VoltageCircuit
Length (Km)Approx. # of Units
Quote(Standard Prunning)
Quote(Storm
Hardening)
Price Form 12010 Maintenance Pruning Circuit List and Quotation
Price Form 12008 Maintenance Pruning Circuit List and Quotation
Price Form 12010 Maintenance Pruning Circuit List and Quotation
TOB1KS KEELE & ST. CLAIR MS N 166 1860 St Clair Ave W TORONTO 4.16 kV 2.43TOB2KS KEELE & ST. CLAIR MS N 167 1860 St Clair Ave W TORONTO 4.16 kV 2.55TOB3KS KEELE & ST. CLAIR MS N 168 1860 St Clair Ave W TORONTO 4.16 kV 0.19TOB4KS KEELE & ST. CLAIR MS N 169 1860 St Clair Ave W TORONTO 4.16 kV 2.56TOB5KS KEELE & ST. CLAIR MS N 170 1860 St Clair Ave W TORONTO 4.16 kV 0.04NY34M5 LEASIDE TS N 171 1080 Millwood Ave. NORTH YORK 27.6 kV 4.56NY34M6 LEASIDE TS N 172 1080 Millwood Ave. NORTH YORK 27.6 kV 12.4NY34M7 LEASIDE TS N 173 1080 Millwood Ave. NORTH YORK 27.6 kV 18.15SCGF1 PROGRESS MARKHAM MS N 174 895 Progress Ave SCARBOROUGH 4.16 kV 0.7SCGF2 PROGRESS MARKHAM MS N 175 895 Progress Ave SCARBOROUGH 4.16 kV 0.8SCGF3 PROGRESS MARKHAM MS N 176 895 Progress Ave SCARBOROUGH 4.16 kV 1.11TOB1SA SPADINA MS N 177 555 Spadina Rd TORONTO 4.16 kV 4.29TOB3SA SPADINA MS N 178 555 Spadina Rd TORONTO 4.16 kV 2.72EY43M21 WARDEN TS N 179 699 Warden Ave EAST YORK 27.6 kV 3.96EY43M31 WARDEN TS N 180 699 Warden Ave EAST YORK 27.6 kV 16.22EY43M32 WARDEN TS N 181 699 Warden Ave EAST YORK 27.6 kV 16.44ETNF1 ALLENBY MS Y 182 2310 Islington Ave. ETOBICOKE 4.16 kV 3.38ETNF2 ALLENBY MS Y 183 2310 Islington Ave. ETOBICOKE 4.16 kV 7.23gETNF3 ALLENBY MS Y 184 2310 Islington Ave. ETOBICOKE 4.16 kV 1.51SCXG1 EAST AVE TUDOR GLEN MS N 185 221 East Ave SCARBOROUGH 13.8 kV 2.9SCXG2 EAST AVE TUDOR GLEN MS N 186 221 East Ave SCARBOROUGH 13.8 kV 2.98SCXG3 EAST AVE TUDOR GLEN MS N 187 221 East Ave SCARBOROUGH 13.8 kV 9.2NY35M11 FAIRBANKS I TS N 188 950 Roselawn Ave NORTH YORK 27.6 kV 13.33NY35M12 FAIRBANKS I TS N 189 950 Roselawn Ave NORTH YORK 27.6 kV 16.04NY35M3 FAIRBANKS I TS N 190 950 Roselawn Ave NORTH YORK 27.6 kV 13.45NY35M5 FAIRBANKS I TS N 191 950 Roselawn Ave NORTH YORK 27.6 kV 23.76NY35M7 FAIRBANKS I TS N 192 950 Roselawn Ave NORTH YORK 27.6 kV 4.34NY35M8 FAIRBANKS I TS N 193 950 Roselawn Ave NORTH YORK 27.6 kV 12.48NY53M1 BERMONDSEY I TS N 194 178 Bermondsey Rd. NORTH YORK 27.6 kV 2.06NY53M10 BERMONDSEY I TS N 195 178 Bermondsey Rd. NORTH YORK 27.6 kV 4.82NY53M2 BERMONDSEY I TS N 196 178 Bermondsey Rd. NORTH YORK 27.6 kV 1.06NY53M5 BERMONDSEY I TS N 197 178 Bermondsey Rd. NORTH YORK 27.6 kV 8.22NY53M6 BERMONDSEY I TS N 198 178 Bermondsey Rd. NORTH YORK 27.6 kV 9.16
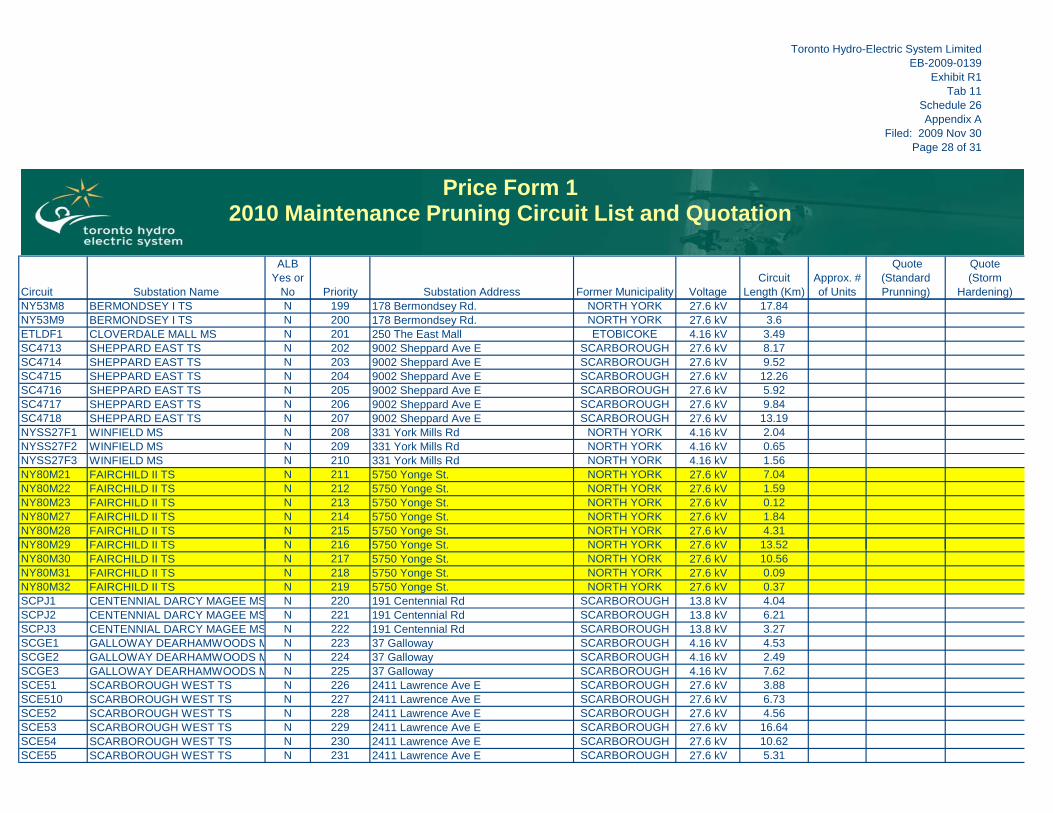
Toronto Hydro-Electric System LimitedEB-2009-0139
Exhibit R1Tab 11
Schedule 26Appendix A
Filed: 2009 Nov 30Page 28 of 31
Circuit Substation Name
ALB Yes or
No Priority Substation Address Former Municipality VoltageCircuit
Length (Km)Approx. # of Units
Quote(Standard Prunning)
Quote(Storm
Hardening)
Price Form 12010 Maintenance Pruning Circuit List and Quotation
Price Form 12008 Maintenance Pruning Circuit List and Quotation
Price Form 12010 Maintenance Pruning Circuit List and Quotation
NY53M8 BERMONDSEY I TS N 199 178 Bermondsey Rd. NORTH YORK 27.6 kV 17.84NY53M9 BERMONDSEY I TS N 200 178 Bermondsey Rd. NORTH YORK 27.6 kV 3.6ETLDF1 CLOVERDALE MALL MS N 201 250 The East Mall ETOBICOKE 4.16 kV 3.49SC4713 SHEPPARD EAST TS N 202 9002 Sheppard Ave E SCARBOROUGH 27.6 kV 8.17SC4714 SHEPPARD EAST TS N 203 9002 Sheppard Ave E SCARBOROUGH 27.6 kV 9.52SC4715 SHEPPARD EAST TS N 204 9002 Sheppard Ave E SCARBOROUGH 27.6 kV 12.26SC4716 SHEPPARD EAST TS N 205 9002 Sheppard Ave E SCARBOROUGH 27.6 kV 5.92SC4717 SHEPPARD EAST TS N 206 9002 Sheppard Ave E SCARBOROUGH 27.6 kV 9.84SC4718 SHEPPARD EAST TS N 207 9002 Sheppard Ave E SCARBOROUGH 27.6 kV 13.19NYSS27F1 WINFIELD MS N 208 331 York Mills Rd NORTH YORK 4.16 kV 2.04NYSS27F2 WINFIELD MS N 209 331 York Mills Rd NORTH YORK 4.16 kV 0.65NYSS27F3 WINFIELD MS N 210 331 York Mills Rd NORTH YORK 4.16 kV 1.56NY80M21 FAIRCHILD II TS N 211 5750 Yonge St. NORTH YORK 27.6 kV 7.04NY80M22 FAIRCHILD II TS N 212 5750 Yonge St. NORTH YORK 27.6 kV 1.59NY80M23 FAIRCHILD II TS N 213 5750 Yonge St. NORTH YORK 27.6 kV 0.12NY80M27 FAIRCHILD II TS N 214 5750 Yonge St. NORTH YORK 27.6 kV 1.84NY80M28 FAIRCHILD II TS N 215 5750 Yonge St. NORTH YORK 27.6 kV 4.31NY80M29 FAIRCHILD II TS N 216 5750 Yonge St. NORTH YORK 27.6 kV 13.52gNY80M30 FAIRCHILD II TS N 217 5750 Yonge St. NORTH YORK 27.6 kV 10.56NY80M31 FAIRCHILD II TS N 218 5750 Yonge St. NORTH YORK 27.6 kV 0.09NY80M32 FAIRCHILD II TS N 219 5750 Yonge St. NORTH YORK 27.6 kV 0.37SCPJ1 CENTENNIAL DARCY MAGEE MS N 220 191 Centennial Rd SCARBOROUGH 13.8 kV 4.04SCPJ2 CENTENNIAL DARCY MAGEE MS N 221 191 Centennial Rd SCARBOROUGH 13.8 kV 6.21SCPJ3 CENTENNIAL DARCY MAGEE MS N 222 191 Centennial Rd SCARBOROUGH 13.8 kV 3.27SCGE1 GALLOWAY DEARHAMWOODS M N 223 37 Galloway SCARBOROUGH 4.16 kV 4.53SCGE2 GALLOWAY DEARHAMWOODS M N 224 37 Galloway SCARBOROUGH 4.16 kV 2.49SCGE3 GALLOWAY DEARHAMWOODS M N 225 37 Galloway SCARBOROUGH 4.16 kV 7.62SCE51 SCARBOROUGH WEST TS N 226 2411 Lawrence Ave E SCARBOROUGH 27.6 kV 3.88SCE510 SCARBOROUGH WEST TS N 227 2411 Lawrence Ave E SCARBOROUGH 27.6 kV 6.73SCE52 SCARBOROUGH WEST TS N 228 2411 Lawrence Ave E SCARBOROUGH 27.6 kV 4.56SCE53 SCARBOROUGH WEST TS N 229 2411 Lawrence Ave E SCARBOROUGH 27.6 kV 16.64SCE54 SCARBOROUGH WEST TS N 230 2411 Lawrence Ave E SCARBOROUGH 27.6 kV 10.62SCE55 SCARBOROUGH WEST TS N 231 2411 Lawrence Ave E SCARBOROUGH 27.6 kV 5.31
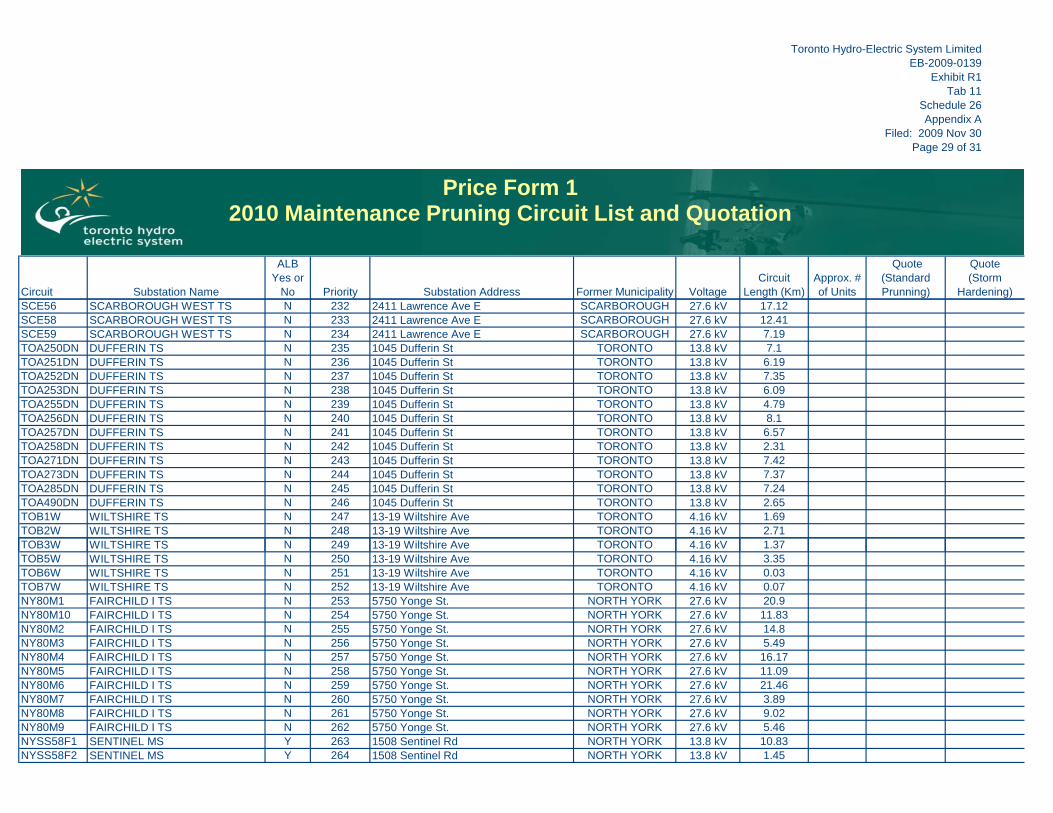
Toronto Hydro-Electric System LimitedEB-2009-0139
Exhibit R1Tab 11
Schedule 26Appendix A
Filed: 2009 Nov 30Page 29 of 31
Circuit Substation Name
ALB Yes or
No Priority Substation Address Former Municipality VoltageCircuit
Length (Km)Approx. # of Units
Quote(Standard Prunning)
Quote(Storm
Hardening)
Price Form 12010 Maintenance Pruning Circuit List and Quotation
Price Form 12008 Maintenance Pruning Circuit List and Quotation
Price Form 12010 Maintenance Pruning Circuit List and Quotation
SCE56 SCARBOROUGH WEST TS N 232 2411 Lawrence Ave E SCARBOROUGH 27.6 kV 17.12SCE58 SCARBOROUGH WEST TS N 233 2411 Lawrence Ave E SCARBOROUGH 27.6 kV 12.41SCE59 SCARBOROUGH WEST TS N 234 2411 Lawrence Ave E SCARBOROUGH 27.6 kV 7.19TOA250DN DUFFERIN TS N 235 1045 Dufferin St TORONTO 13.8 kV 7.1TOA251DN DUFFERIN TS N 236 1045 Dufferin St TORONTO 13.8 kV 6.19TOA252DN DUFFERIN TS N 237 1045 Dufferin St TORONTO 13.8 kV 7.35TOA253DN DUFFERIN TS N 238 1045 Dufferin St TORONTO 13.8 kV 6.09TOA255DN DUFFERIN TS N 239 1045 Dufferin St TORONTO 13.8 kV 4.79TOA256DN DUFFERIN TS N 240 1045 Dufferin St TORONTO 13.8 kV 8.1TOA257DN DUFFERIN TS N 241 1045 Dufferin St TORONTO 13.8 kV 6.57TOA258DN DUFFERIN TS N 242 1045 Dufferin St TORONTO 13.8 kV 2.31TOA271DN DUFFERIN TS N 243 1045 Dufferin St TORONTO 13.8 kV 7.42TOA273DN DUFFERIN TS N 244 1045 Dufferin St TORONTO 13.8 kV 7.37TOA285DN DUFFERIN TS N 245 1045 Dufferin St TORONTO 13.8 kV 7.24TOA490DN DUFFERIN TS N 246 1045 Dufferin St TORONTO 13.8 kV 2.65TOB1W WILTSHIRE TS N 247 13-19 Wiltshire Ave TORONTO 4.16 kV 1.69TOB2W WILTSHIRE TS N 248 13-19 Wiltshire Ave TORONTO 4.16 kV 2.71TOB3W WILTSHIRE TS N 249 13-19 Wiltshire Ave TORONTO 4.16 kV 1.37TOB5W WILTSHIRE TS N 250 13-19 Wiltshire Ave TORONTO 4.16 kV 3.35TOB6W WILTSHIRE TS N 251 13-19 Wiltshire Ave TORONTO 4.16 kV 0.03TOB7W WILTSHIRE TS N 252 13-19 Wiltshire Ave TORONTO 4.16 kV 0.07NY80M1 FAIRCHILD I TS N 253 5750 Yonge St. NORTH YORK 27.6 kV 20.9NY80M10 FAIRCHILD I TS N 254 5750 Yonge St. NORTH YORK 27.6 kV 11.83NY80M2 FAIRCHILD I TS N 255 5750 Yonge St. NORTH YORK 27.6 kV 14.8NY80M3 FAIRCHILD I TS N 256 5750 Yonge St. NORTH YORK 27.6 kV 5.49NY80M4 FAIRCHILD I TS N 257 5750 Yonge St. NORTH YORK 27.6 kV 16.17NY80M5 FAIRCHILD I TS N 258 5750 Yonge St. NORTH YORK 27.6 kV 11.09NY80M6 FAIRCHILD I TS N 259 5750 Yonge St. NORTH YORK 27.6 kV 21.46NY80M7 FAIRCHILD I TS N 260 5750 Yonge St. NORTH YORK 27.6 kV 3.89NY80M8 FAIRCHILD I TS N 261 5750 Yonge St. NORTH YORK 27.6 kV 9.02NY80M9 FAIRCHILD I TS N 262 5750 Yonge St. NORTH YORK 27.6 kV 5.46NYSS58F1 SENTINEL MS Y 263 1508 Sentinel Rd NORTH YORK 13.8 kV 10.83NYSS58F2 SENTINEL MS Y 264 1508 Sentinel Rd NORTH YORK 13.8 kV 1.45
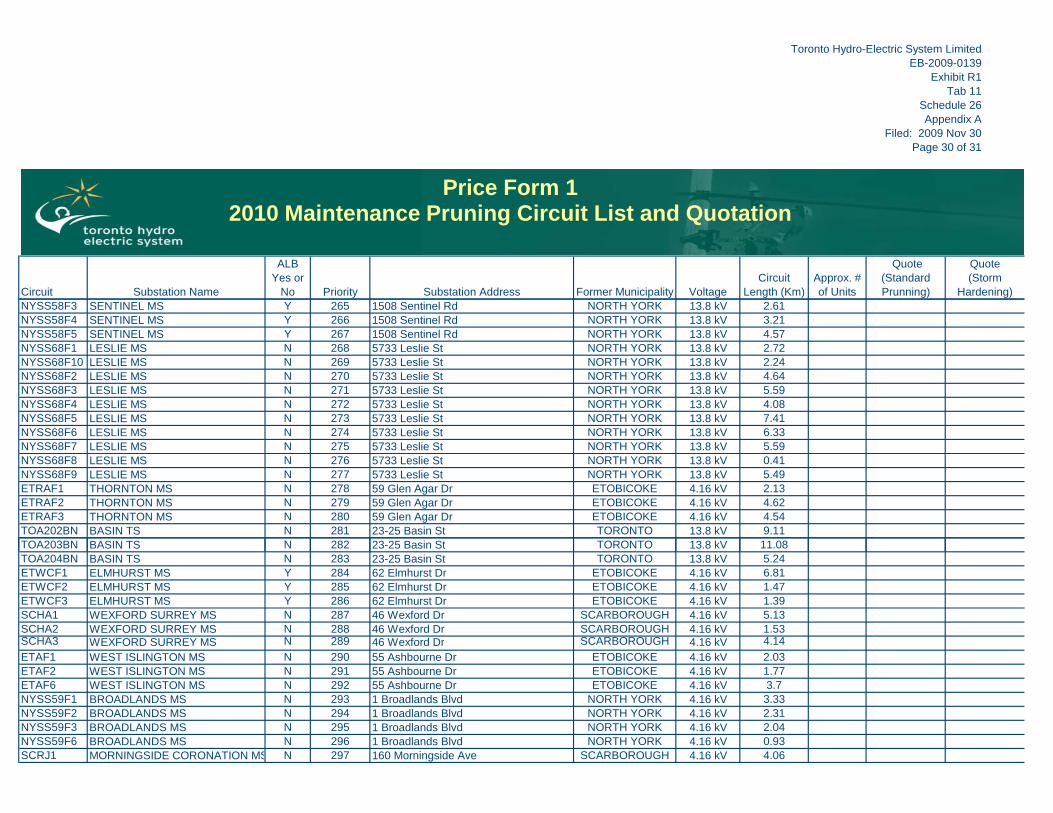
Toronto Hydro-Electric System LimitedEB-2009-0139
Exhibit R1Tab 11
Schedule 26Appendix A
Filed: 2009 Nov 30Page 30 of 31
Circuit Substation Name
ALB Yes or
No Priority Substation Address Former Municipality VoltageCircuit
Length (Km)Approx. # of Units
Quote(Standard Prunning)
Quote(Storm
Hardening)
Price Form 12010 Maintenance Pruning Circuit List and Quotation
Price Form 12008 Maintenance Pruning Circuit List and Quotation
Price Form 12010 Maintenance Pruning Circuit List and Quotation
NYSS58F3 SENTINEL MS Y 265 1508 Sentinel Rd NORTH YORK 13.8 kV 2.61NYSS58F4 SENTINEL MS Y 266 1508 Sentinel Rd NORTH YORK 13.8 kV 3.21NYSS58F5 SENTINEL MS Y 267 1508 Sentinel Rd NORTH YORK 13.8 kV 4.57NYSS68F1 LESLIE MS N 268 5733 Leslie St NORTH YORK 13.8 kV 2.72NYSS68F10 LESLIE MS N 269 5733 Leslie St NORTH YORK 13.8 kV 2.24NYSS68F2 LESLIE MS N 270 5733 Leslie St NORTH YORK 13.8 kV 4.64NYSS68F3 LESLIE MS N 271 5733 Leslie St NORTH YORK 13.8 kV 5.59NYSS68F4 LESLIE MS N 272 5733 Leslie St NORTH YORK 13.8 kV 4.08NYSS68F5 LESLIE MS N 273 5733 Leslie St NORTH YORK 13.8 kV 7.41NYSS68F6 LESLIE MS N 274 5733 Leslie St NORTH YORK 13.8 kV 6.33NYSS68F7 LESLIE MS N 275 5733 Leslie St NORTH YORK 13.8 kV 5.59NYSS68F8 LESLIE MS N 276 5733 Leslie St NORTH YORK 13.8 kV 0.41NYSS68F9 LESLIE MS N 277 5733 Leslie St NORTH YORK 13.8 kV 5.49ETRAF1 THORNTON MS N 278 59 Glen Agar Dr ETOBICOKE 4.16 kV 2.13ETRAF2 THORNTON MS N 279 59 Glen Agar Dr ETOBICOKE 4.16 kV 4.62ETRAF3 THORNTON MS N 280 59 Glen Agar Dr ETOBICOKE 4.16 kV 4.54TOA202BN BASIN TS N 281 23-25 Basin St TORONTO 13.8 kV 9.11TOA203BN BASIN TS N 282 23-25 Basin St TORONTO 13.8 kV 11.08TOA204BN BASIN TS N 283 23-25 Basin St TORONTO 13.8 kV 5.24ETWCF1 ELMHURST MS Y 284 62 Elmhurst Dr ETOBICOKE 4.16 kV 6.81ETWCF2 ELMHURST MS Y 285 62 Elmhurst Dr ETOBICOKE 4.16 kV 1.47ETWCF3 ELMHURST MS Y 286 62 Elmhurst Dr ETOBICOKE 4.16 kV 1.39SCHA1 WEXFORD SURREY MS N 287 46 Wexford Dr SCARBOROUGH 4.16 kV 5.13SCHA2 WEXFORD SURREY MS N 288 46 Wexford Dr SCARBOROUGH 4.16 kV 1.53SCHA3 WEXFORD SURREY MS N 289 46 Wexford Dr SCARBOROUGH 4.16 kV 4.14ETAF1 WEST ISLINGTON MS N 290 55 Ashbourne Dr ETOBICOKE 4.16 kV 2.03ETAF2 WEST ISLINGTON MS N 291 55 Ashbourne Dr ETOBICOKE 4.16 kV 1.77ETAF6 WEST ISLINGTON MS N 292 55 Ashbourne Dr ETOBICOKE 4.16 kV 3.7NYSS59F1 BROADLANDS MS N 293 1 Broadlands Blvd NORTH YORK 4.16 kV 3.33NYSS59F2 BROADLANDS MS N 294 1 Broadlands Blvd NORTH YORK 4.16 kV 2.31NYSS59F3 BROADLANDS MS N 295 1 Broadlands Blvd NORTH YORK 4.16 kV 2.04NYSS59F6 BROADLANDS MS N 296 1 Broadlands Blvd NORTH YORK 4.16 kV 0.93SCRJ1 MORNINGSIDE CORONATION MS N 297 160 Morningside Ave SCARBOROUGH 4.16 kV 4.06
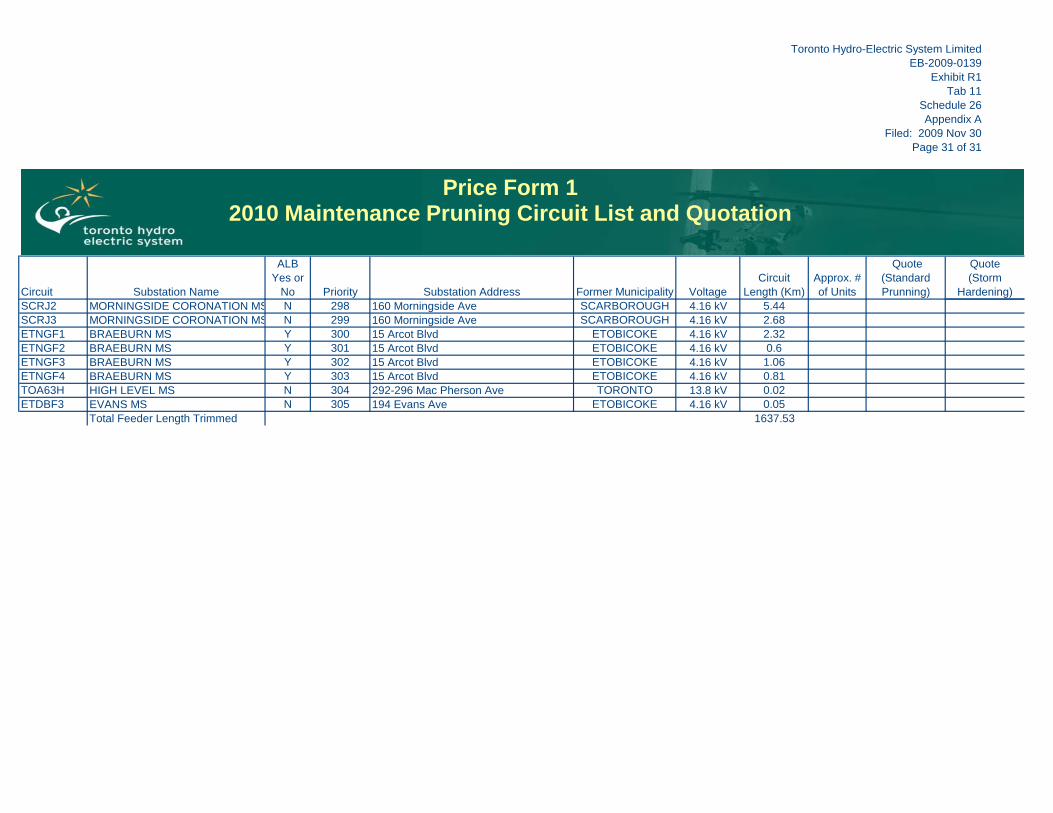
Toronto Hydro-Electric System LimitedEB-2009-0139
Exhibit R1Tab 11
Schedule 26Appendix A
Filed: 2009 Nov 30Page 31 of 31
Circuit Substation Name
ALB Yes or
No Priority Substation Address Former Municipality VoltageCircuit
Length (Km)Approx. # of Units
Quote(Standard Prunning)
Quote(Storm
Hardening)
Price Form 12010 Maintenance Pruning Circuit List and Quotation
Price Form 12008 Maintenance Pruning Circuit List and Quotation
Price Form 12010 Maintenance Pruning Circuit List and Quotation
SCRJ2 MORNINGSIDE CORONATION MS N 298 160 Morningside Ave SCARBOROUGH 4.16 kV 5.44SCRJ3 MORNINGSIDE CORONATION MS N 299 160 Morningside Ave SCARBOROUGH 4.16 kV 2.68ETNGF1 BRAEBURN MS Y 300 15 Arcot Blvd ETOBICOKE 4.16 kV 2.32ETNGF2 BRAEBURN MS Y 301 15 Arcot Blvd ETOBICOKE 4.16 kV 0.6ETNGF3 BRAEBURN MS Y 302 15 Arcot Blvd ETOBICOKE 4.16 kV 1.06ETNGF4 BRAEBURN MS Y 303 15 Arcot Blvd ETOBICOKE 4.16 kV 0.81TOA63H HIGH LEVEL MS N 304 292-296 Mac Pherson Ave TORONTO 13.8 kV 0.02ETDBF3 EVANS MS N 305 194 Evans Ave ETOBICOKE 4.16 kV 0.05
Total Feeder Length Trimmed 1637.53
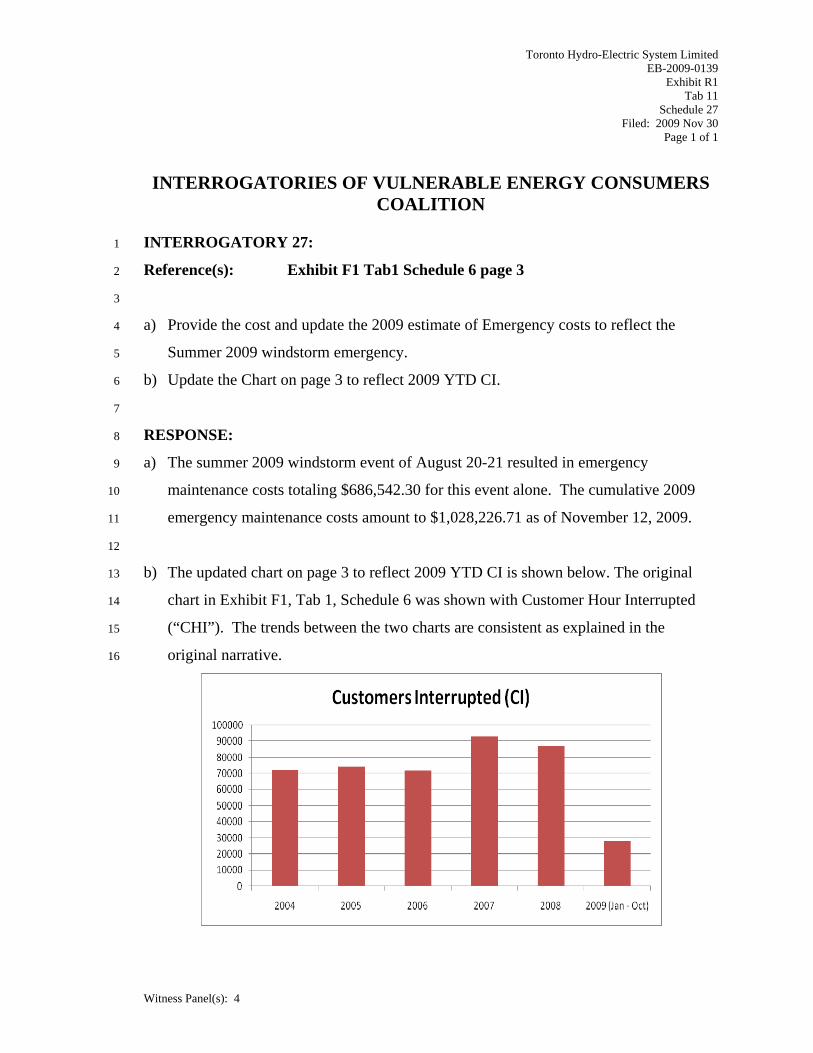
Toronto Hydro-Electric System Limited EB-2009-0139
Exhibit R1 Tab 11
Schedule 27 Filed: 2009 Nov 30
Page 1 of 1
INTERROGATORIES OF VULNERABLE ENERGY CONSUMERS COALITION
Witness Panel(s): 4
INTERROGATORY 27: 1
Reference(s): Exhibit F1 Tab1 Schedule 6 page 3 2
3
a) Provide the cost and update the 2009 estimate of Emergency costs to reflect the 4
Summer 2009 windstorm emergency. 5
b) Update the Chart on page 3 to reflect 2009 YTD CI. 6
7
RESPONSE: 8
a) The summer 2009 windstorm event of August 20-21 resulted in emergency 9
maintenance costs totaling $686,542.30 for this event alone. The cumulative 2009 10
emergency maintenance costs amount to $1,028,226.71 as of November 12, 2009. 11
12
b) The updated chart on page 3 to reflect 2009 YTD CI is shown below. The original 13
chart in Exhibit F1, Tab 1, Schedule 6 was shown with Customer Hour Interrupted 14
(“CHI”). The trends between the two charts are consistent as explained in the 15
original narrative. 16
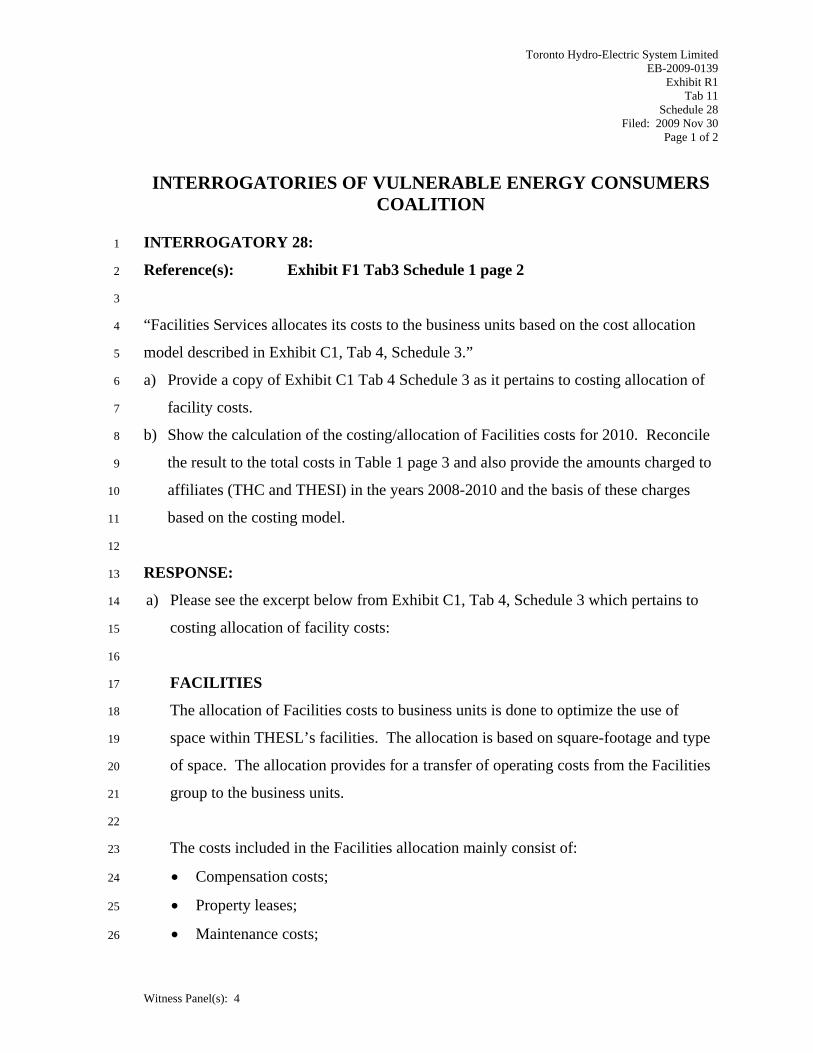
Toronto Hydro-Electric System Limited EB-2009-0139
Exhibit R1 Tab 11
Schedule 28 Filed: 2009 Nov 30
Page 1 of 2
INTERROGATORIES OF VULNERABLE ENERGY CONSUMERS COALITION
Witness Panel(s): 4
INTERROGATORY 28: 1
Reference(s): Exhibit F1 Tab3 Schedule 1 page 2 2
3
“Facilities Services allocates its costs to the business units based on the cost allocation 4
model described in Exhibit C1, Tab 4, Schedule 3.” 5
a) Provide a copy of Exhibit C1 Tab 4 Schedule 3 as it pertains to costing allocation of 6
facility costs. 7
b) Show the calculation of the costing/allocation of Facilities costs for 2010. Reconcile 8
the result to the total costs in Table 1 page 3 and also provide the amounts charged to 9
affiliates (THC and THESI) in the years 2008-2010 and the basis of these charges 10
based on the costing model. 11
12
RESPONSE: 13
a) Please see the excerpt below from Exhibit C1, Tab 4, Schedule 3 which pertains to 14
costing allocation of facility costs: 15
16
FACILITIES 17
The allocation of Facilities costs to business units is done to optimize the use of 18
space within THESL’s facilities. The allocation is based on square-footage and type 19
of space. The allocation provides for a transfer of operating costs from the Facilities 20
group to the business units. 21
22
The costs included in the Facilities allocation mainly consist of: 23
• Compensation costs; 24
• Property leases; 25
• Maintenance costs; 26

Toronto Hydro-Electric System Limited EB-2009-0139
Exhibit R1 Tab 11
Schedule 28 Filed: 2009 Nov 30
Page 2 of 2
INTERROGATORIES OF VULNERABLE ENERGY CONSUMERS COALITION
Witness Panel(s): 4
• Facilities overhead; 1
• Utilities costs; and 2
• Property taxes. 3
4
Facilities costs allocated to unregulated affiliates include a component for 5
depreciation and return on assets. 6
7
b) Please see Appendix A of this Schedule. 8
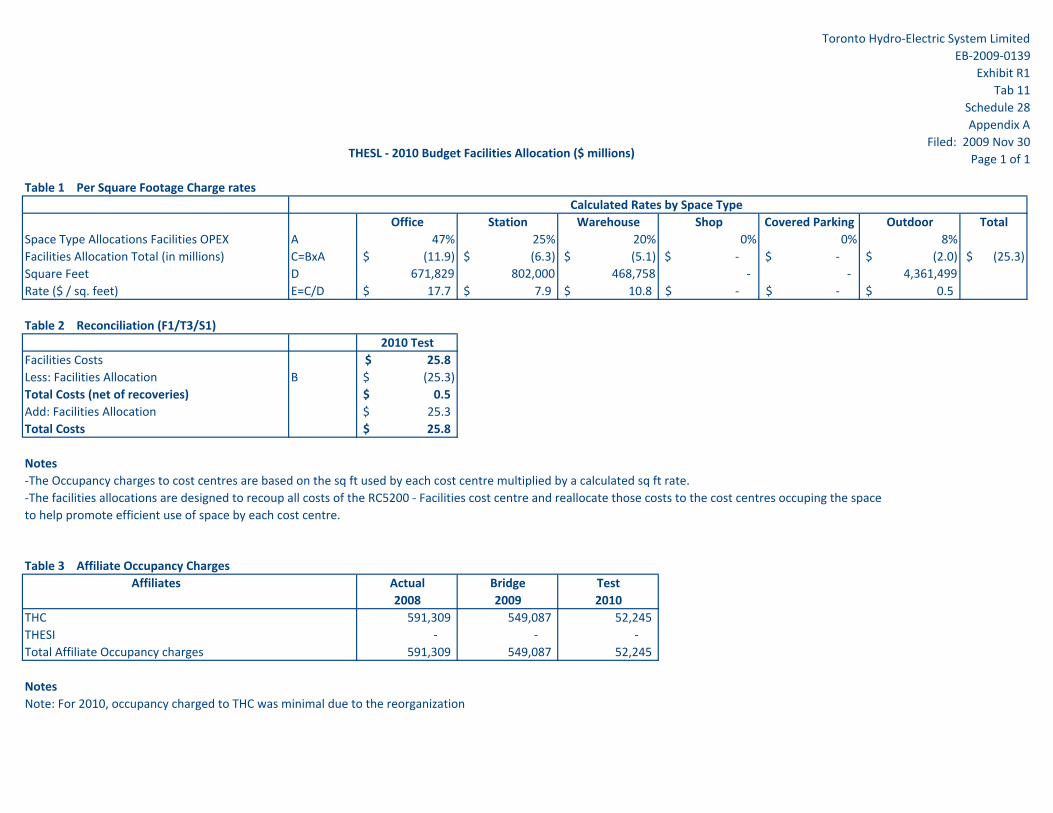
Toronto Hydro‐Electric System LimitedEB‐2009‐0139
Exhibit R1Tab 11
Schedule 28Appendix A
Filed: 2009 Nov 30Page 1 of 1
Table 1 Per Square Footage Charge rates
Office Station Warehouse Shop Covered Parking Outdoor TotalSpace Type Allocations Facilities OPEX A 47% 25% 20% 0% 0% 8%Facilities Allocation Total (in millions) C=BxA (11.9)$ (6.3)$ (5.1)$ ‐$ ‐$ (2.0)$ (25.3)$ Square Feet D 671,829 802,000 468,758 ‐ ‐ 4,361,499 Rate ($ / sq. feet) E=C/D 17.7$ 7.9$ 10.8$ ‐$ ‐$ 0.5$
Table 2 Reconciliation (F1/T3/S1)2010 Test
Facilities Costs 25.8$ Less: Facilities Allocation B (25.3)$ Total Costs (net of recoveries) 0.5$ Add: Facilities Allocation 25.3$ Total Costs 25.8$
Notes‐The Occupancy charges to cost centres are based on the sq ft used by each cost centre multiplied by a calculated sq ft rate.‐The facilities allocations are designed to recoup all costs of the RC5200 ‐ Facilities cost centre and reallocate those costs to the cost centres occuping the spaceto help promote efficient use of space by each cost centre.
Table 3 Affiliate Occupancy ChargesAffiliates Actual Bridge Test
2008 2009 2010THC 591,309 549,087 52,245 THESI ‐ ‐ ‐ Total Affiliate Occupancy charges 591,309 549,087 52,245
NotesNote: For 2010, occupancy charged to THC was minimal due to the reorganization
Calculated Rates by Space Type
THESL ‐ 2010 Budget Facilities Allocation ($ millions)
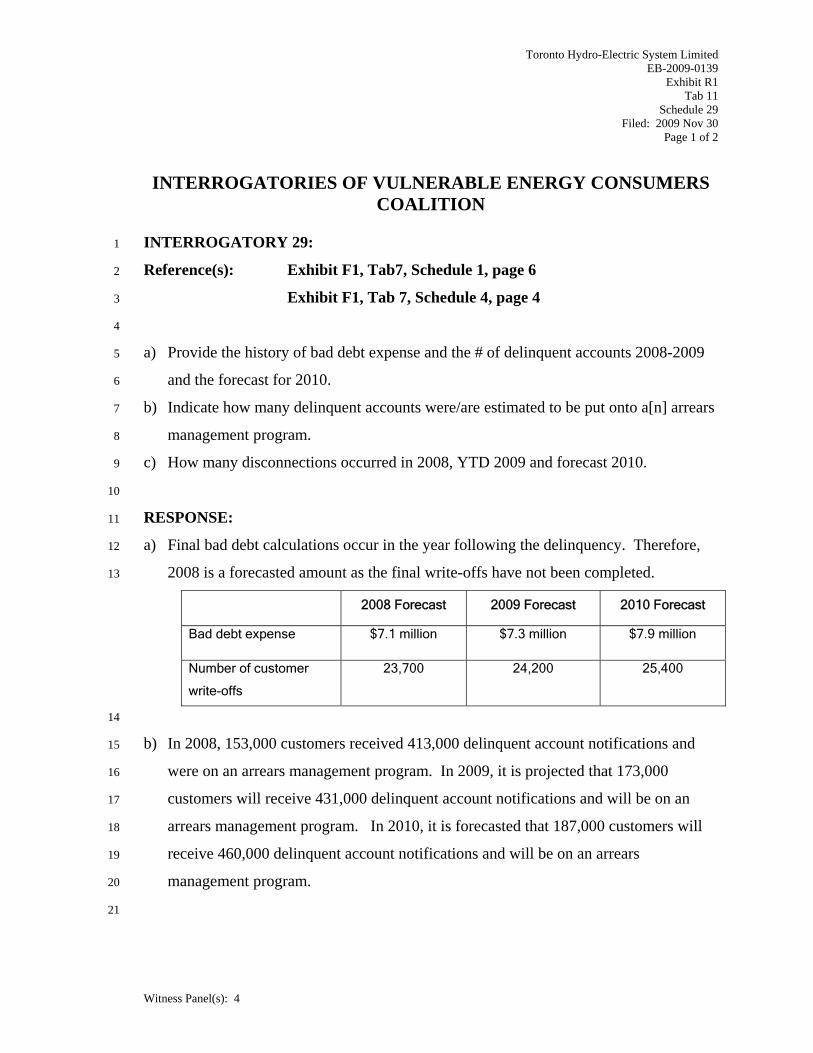
Toronto Hydro-Electric System Limited EB-2009-0139
Exhibit R1 Tab 11
Schedule 29 Filed: 2009 Nov 30
Page 1 of 2
INTERROGATORIES OF VULNERABLE ENERGY CONSUMERS COALITION
Witness Panel(s): 4
INTERROGATORY 29: 1
Reference(s): Exhibit F1, Tab7, Schedule 1, page 6 2
Exhibit F1, Tab 7, Schedule 4, page 4 3
4
a) Provide the history of bad debt expense and the # of delinquent accounts 2008-2009 5
and the forecast for 2010. 6
b) Indicate how many delinquent accounts were/are estimated to be put onto a[n] arrears 7
management program. 8
c) How many disconnections occurred in 2008, YTD 2009 and forecast 2010. 9
10
RESPONSE: 11
a) Final bad debt calculations occur in the year following the delinquency. Therefore, 12
2008 is a forecasted amount as the final write-offs have not been completed. 13
2008 Forecast 2009 Forecast 2010 Forecast
Bad debt expense $7.1 million $7.3 million $7.9 million
Number of customer
write-offs
23,700 24,200 25,400
14
b) In 2008, 153,000 customers received 413,000 delinquent account notifications and 15
were on an arrears management program. In 2009, it is projected that 173,000 16
customers will receive 431,000 delinquent account notifications and will be on an 17
arrears management program. In 2010, it is forecasted that 187,000 customers will 18
receive 460,000 delinquent account notifications and will be on an arrears 19
management program. 20
21
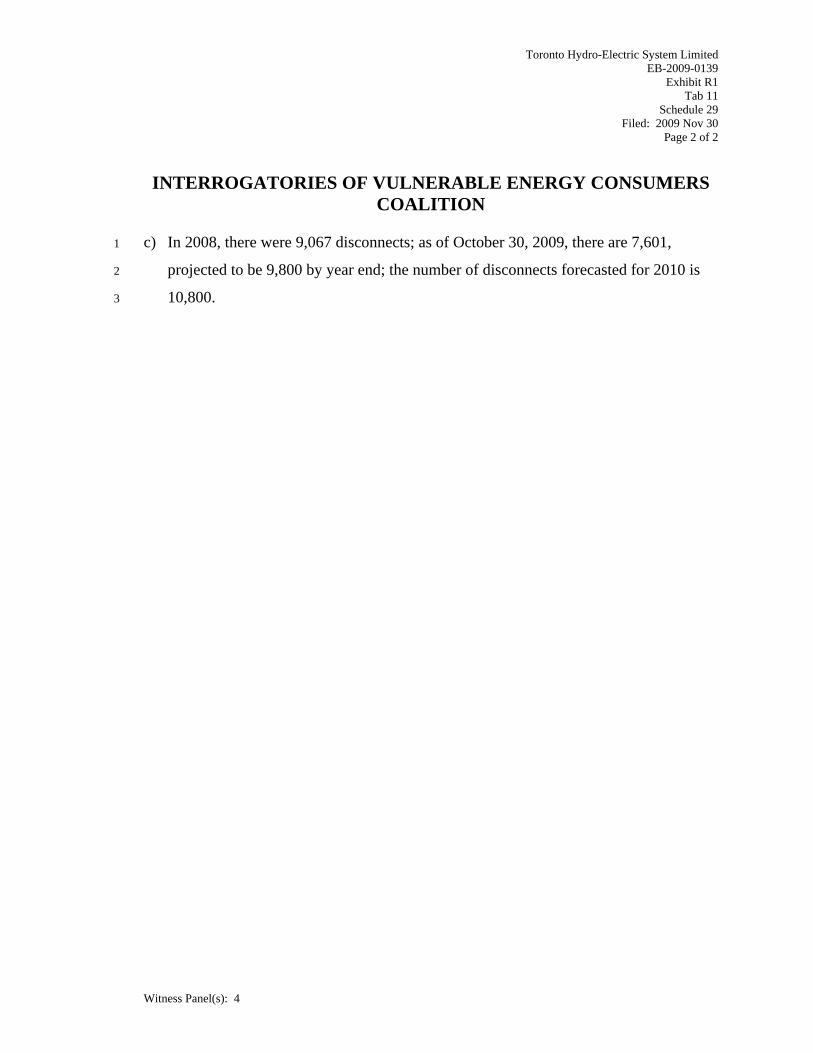
Toronto Hydro-Electric System Limited EB-2009-0139
Exhibit R1 Tab 11
Schedule 29 Filed: 2009 Nov 30
Page 2 of 2
INTERROGATORIES OF VULNERABLE ENERGY CONSUMERS COALITION
Witness Panel(s): 4
c) In 2008, there were 9,067 disconnects; as of October 30, 2009, there are 7,601, 1
projected to be 9,800 by year end; the number of disconnects forecasted for 2010 is 2
10,800. 3

Toronto Hydro-Electric System Limited EB-2009-0139
Exhibit R1 Tab 11
Schedule 30 Filed: 2009 Nov 30
Page 1 of 1
INTERROGATORIES OF VULNERABLE ENERGY CONSUMERS COALITION
Witness Panel(s): 4
INTERROGATORY 30: 1
Reference(s): Exhibit F2 Tab2 Schedule1 page 1-2 2
3
a) Provide a schedule that shows the increase in 2010 in-house costs resulting from 4
repatriation of Governance Responsibility Centre A&G functions from THC to 5
THESL. For payroll related costs indicate the number of FTEs. 6
b) Compare this cost to and reconcile with the reduction in affiliate charges from THC. 7
8
RESPONSE: 9
a) See Appendix A of this Schedule. 10
11
b) See Appendix A of this Schedule. 12
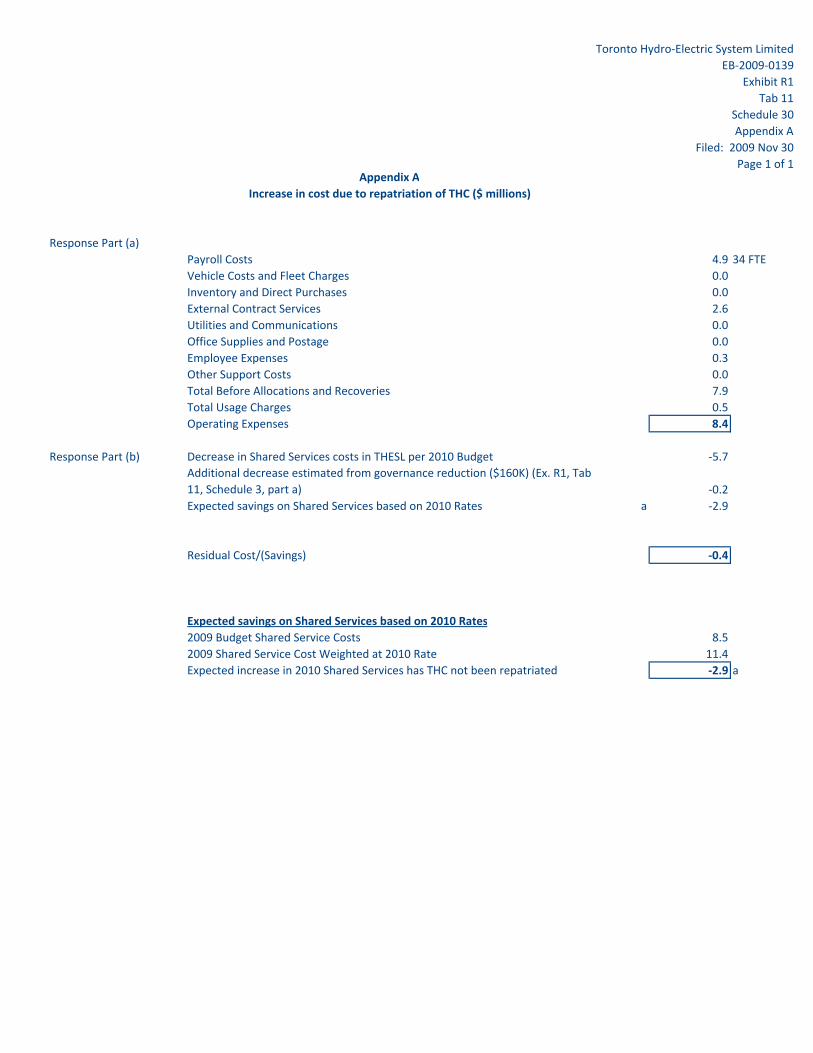
Toronto Hydro‐Electric System LimitedEB‐2009‐0139
Exhibit R1Tab 11
Schedule 30Appendix A
Filed: 2009 Nov 30Page 1 of 1
Response Part (a)Payroll Costs 4.9 34 FTEVehicle Costs and Fleet Charges 0.0Inventory and Direct Purchases 0.0External Contract Services 2.6Utilities and Communications 0.0Office Supplies and Postage 0.0Employee Expenses 0.3Other Support Costs 0.0Total Before Allocations and Recoveries 7.9Total Usage Charges 0.5Operating Expenses 8.4
Response Part (b) Decrease in Shared Services costs in THESL per 2010 Budget ‐5.7Additional decrease estimated from governance reduction ($160K) (Ex. R1, Tab 11, Schedule 3, part a) ‐0.2Expected savings on Shared Services based on 2010 Rates a ‐2.9
Residual Cost/(Savings) ‐0.4
Expected savings on Shared Services based on 2010 Rates2009 Budget Shared Service Costs 8.52009 Shared Service Cost Weighted at 2010 Rate 11.4Expected increase in 2010 Shared Services has THC not been repatriated ‐2.9 a
Appendix AIncrease in cost due to repatriation of THC ($ millions)

Toronto Hydro-Electric System Limited EB-2009-0139
Exhibit R1 Tab 11
Schedule 31 Filed: 2009 Nov 30
Page 1 of 1
INTERROGATORIES OF VULNERABLE ENERGY CONSUMERS COALITION
Witness Panel(s): 4
INTERROGATORY 31: 1
Reference(s): Exhibit F2 Tab3 Schedule1 page 1 2
3
a) Provide the A&G amount included in the 2010 budget for the Low Income Energy 4
Assistance Program and provide a breakdown of the amount. 5
b) Given that LEAP has been delayed/postponed what treatment of these costs does 6
THESL suggest as appropriate? 7
8
RESPONSE: 9
a) Please refer to the response to Board Staff interrogatory #25. 10
11
b) THESL has not incurred any costs as the LEAP program has not been implemented. 12
THESL will make an adjustment to remove the excess $500,000 at the time of rate 13
finalization. 14
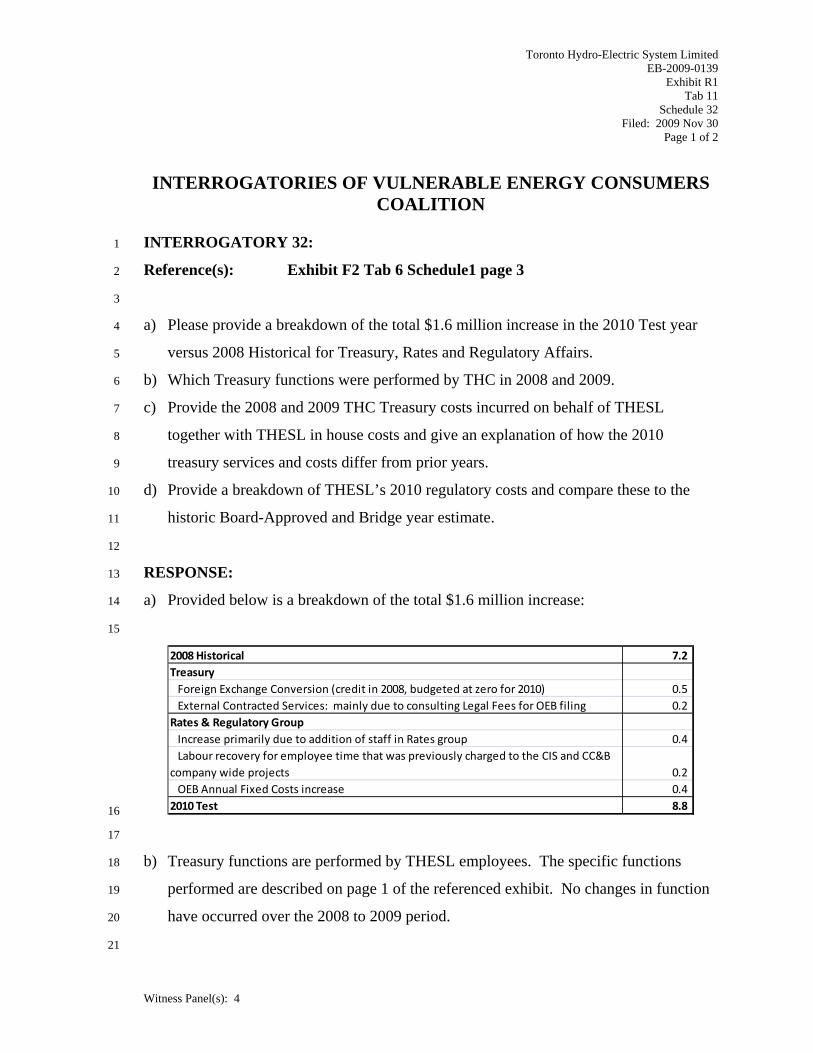
Toronto Hydro-Electric System Limited EB-2009-0139
Exhibit R1 Tab 11
Schedule 32 Filed: 2009 Nov 30
Page 1 of 2
INTERROGATORIES OF VULNERABLE ENERGY CONSUMERS COALITION
Witness Panel(s): 4
INTERROGATORY 32: 1
Reference(s): Exhibit F2 Tab 6 Schedule1 page 3 2
3
a) Please provide a breakdown of the total $1.6 million increase in the 2010 Test year 4
versus 2008 Historical for Treasury, Rates and Regulatory Affairs. 5
b) Which Treasury functions were performed by THC in 2008 and 2009. 6
c) Provide the 2008 and 2009 THC Treasury costs incurred on behalf of THESL 7
together with THESL in house costs and give an explanation of how the 2010 8
treasury services and costs differ from prior years. 9
d) Provide a breakdown of THESL’s 2010 regulatory costs and compare these to the 10
historic Board-Approved and Bridge year estimate. 11
12
RESPONSE: 13
a) Provided below is a breakdown of the total $1.6 million increase: 14
15
2008 Historical 7.2 Treasury Foreign Exchange Conversion (credit in 2008, budgeted at zero for 2010) 0.5 External Contracted Services: mainly due to consulting Legal Fees for OEB filing 0.2 Rates & Regulatory Group Increase primarily due to addition of staff in Rates group 0.4 Labour recovery for employee time that was previously charged to the CIS and CC&B company wide projects 0.2 OEB Annual Fixed Costs increase 0.4 2010 Test 8.8 16
17
b) Treasury functions are performed by THESL employees. The specific functions 18
performed are described on page 1 of the referenced exhibit. No changes in function 19
have occurred over the 2008 to 2009 period. 20
21

Toronto Hydro-Electric System Limited EB-2009-0139
Exhibit R1 Tab 11
Schedule 32 Filed: 2009 Nov 30
Page 2 of 2
INTERROGATORIES OF VULNERABLE ENERGY CONSUMERS COALITION
Witness Panel(s): 4
c) Treasury functions are performed by THESL employees. There are no Treasury costs 1
in THC in 2008 or 2009. 2
3
d) Please see response to Board Staff interrogatory # 27 b). 4
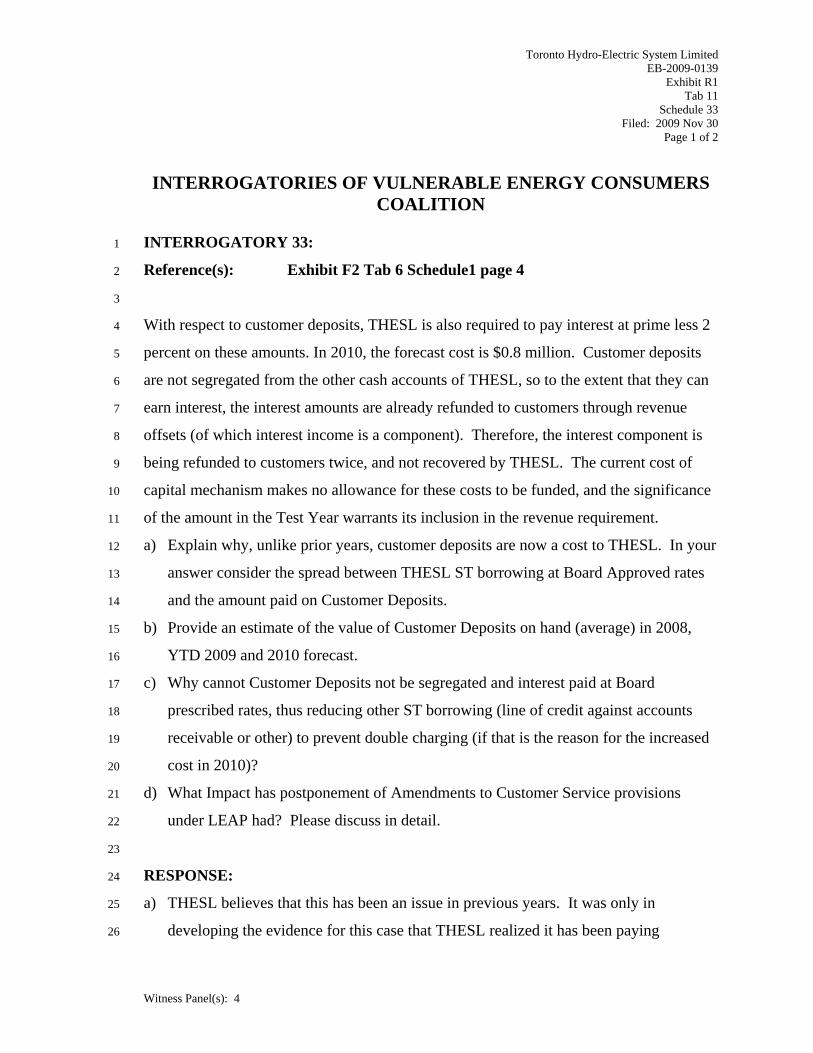
Toronto Hydro-Electric System Limited EB-2009-0139
Exhibit R1 Tab 11
Schedule 33 Filed: 2009 Nov 30
Page 1 of 2
INTERROGATORIES OF VULNERABLE ENERGY CONSUMERS COALITION
Witness Panel(s): 4
INTERROGATORY 33: 1
Reference(s): Exhibit F2 Tab 6 Schedule1 page 4 2
3
With respect to customer deposits, THESL is also required to pay interest at prime less 2 4
percent on these amounts. In 2010, the forecast cost is $0.8 million. Customer deposits 5
are not segregated from the other cash accounts of THESL, so to the extent that they can 6
earn interest, the interest amounts are already refunded to customers through revenue 7
offsets (of which interest income is a component). Therefore, the interest component is 8
being refunded to customers twice, and not recovered by THESL. The current cost of 9
capital mechanism makes no allowance for these costs to be funded, and the significance 10
of the amount in the Test Year warrants its inclusion in the revenue requirement. 11
a) Explain why, unlike prior years, customer deposits are now a cost to THESL. In your 12
answer consider the spread between THESL ST borrowing at Board Approved rates 13
and the amount paid on Customer Deposits. 14
b) Provide an estimate of the value of Customer Deposits on hand (average) in 2008, 15
YTD 2009 and 2010 forecast. 16
c) Why cannot Customer Deposits not be segregated and interest paid at Board 17
prescribed rates, thus reducing other ST borrowing (line of credit against accounts 18
receivable or other) to prevent double charging (if that is the reason for the increased 19
cost in 2010)? 20
d) What Impact has postponement of Amendments to Customer Service provisions 21
under LEAP had? Please discuss in detail. 22
23
RESPONSE: 24
a) THESL believes that this has been an issue in previous years. It was only in 25
developing the evidence for this case that THESL realized it has been paying 26
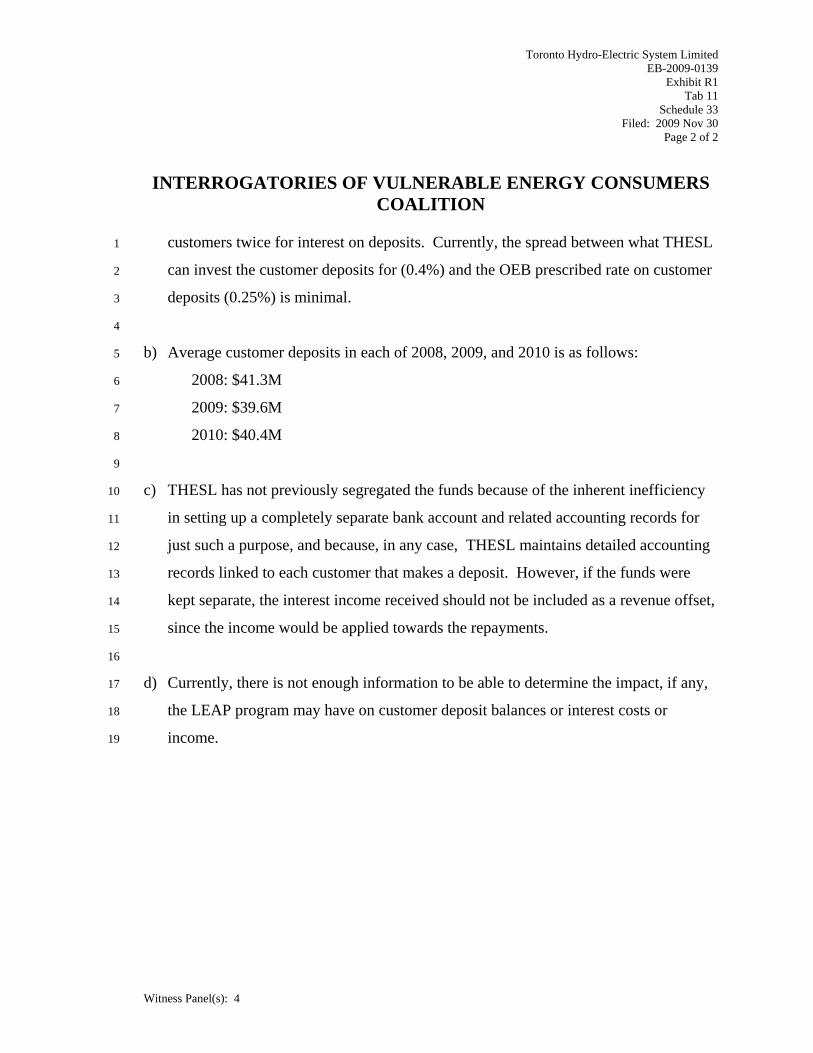
Toronto Hydro-Electric System Limited EB-2009-0139
Exhibit R1 Tab 11
Schedule 33 Filed: 2009 Nov 30
Page 2 of 2
INTERROGATORIES OF VULNERABLE ENERGY CONSUMERS COALITION
Witness Panel(s): 4
customers twice for interest on deposits. Currently, the spread between what THESL 1
can invest the customer deposits for (0.4%) and the OEB prescribed rate on customer 2
deposits (0.25%) is minimal. 3
4
b) Average customer deposits in each of 2008, 2009, and 2010 is as follows: 5
2008: $41.3M 6
2009: $39.6M 7
2010: $40.4M 8
9
c) THESL has not previously segregated the funds because of the inherent inefficiency 10
in setting up a completely separate bank account and related accounting records for 11
just such a purpose, and because, in any case, THESL maintains detailed accounting 12
records linked to each customer that makes a deposit. However, if the funds were 13
kept separate, the interest income received should not be included as a revenue offset, 14
since the income would be applied towards the repayments. 15
16
d) Currently, there is not enough information to be able to determine the impact, if any, 17
the LEAP program may have on customer deposit balances or interest costs or 18
income. 19
Toronto Hydro-Electric System Limited EB-2009-0139
Exhibit R1 Tab 11
Schedule 34 Filed: 2009 Nov 30
Page 1 of 2
INTERROGATORIES OF VULNERABLE ENERGY CONSUMERS COALITION
Witness Panel(s): 3
INTERROGATORY 34: 1
Reference(s): Exhibit G1 Tab1 Schedule 1 page 1 2
3
The Board in its June 16, 2009 SG Guidelines provided for Deferral Accounts for 4
renewable Generation Connection and Smart Grid Development Expenditures for 5
recording incremental investments or expenses. 6
a) Has THESL established or is requesting a GEA Deferral Account or GEA funding 7
adder? 8
b) Why should THESL recover the $9,770, 000 in capital costs and $450, 000 operating 9
costs in 2010 rates, as opposed to recording in a Deferral account (with without GEA 10
rate adder)? Please explain whether the proposed regulatory treatment conforms to 11
the Board’s Guidelines. 12
c) Is/will THESL seeking to allocate GEA initiatives only to its ratepayers (or 13
otherwise- as per Reg. 330). If not please indicate the amount to be recovered under 14
the Reg. and whether this is incremental to the costs to be recovered from THESL 15
ratepayers. 16
17
RESPONSE: 18
a) THESL has not established and is not requesting a GEA Deferral Account or funding 19
adder for its proposed GEA investments. Rather, THESL is requesting that its 20
specific and incremental Smart Grid investments be recovered through rates effective 21
May 1, 2010. 22
23
b) On page 2 of G-2009-0087, Guidelines: Deemed Conditions of Licence: Distribution 24
System Planning from June 16 2009, the Board states, “Distributors may make 25
expenditures relating to renewable generation connections and smart grid 26

Toronto Hydro-Electric System Limited EB-2009-0139
Exhibit R1 Tab 11
Schedule 34 Filed: 2009 Nov 30
Page 2 of 2
INTERROGATORIES OF VULNERABLE ENERGY CONSUMERS COALITION
Witness Panel(s): 3
development that they consider appropriate without a Board-approved plan or a 1
funding adder. The prudence of those expenditures and recovery of their cost will be 2
subject to a Board review in the normal course.” THESL considers its 2010 EDR 3
application to be an appropriate forum for the Board to test the prudence of its 4
proposed 2010 smart grid investments. 5
6
c) THESL is seeking to allocate GEA initiatives only to its ratepayers. None of the 7
costs will be allocated to provincial ratepayers as per Reg. 330. 8
Toronto Hydro-Electric System Limited EB-2009-0139
Exhibit R1 Tab 11
Schedule 35 Filed: 2009 Nov 30
Page 1 of 4
INTERROGATORIES OF VULNERABLE ENERGY CONSUMERS COALITION
Witness Panel(s): 3
INTERROGATORY 35: 1
Reference(s): Exhibit G1 Tab 1 Schedule 1 Pages 7-12 and Tables 2 and 3 2
3
The three-year plan of the smart grid roadmap is intended to establish Toronto’s Smart 4
Community, which is a demonstration area where prioritized initiatives can be tested, 5
processes developed, customer acceptance understood, and operating procedures created. 6
Expected benefits will be demonstrated, measured, and used to support potential full 7
scale deployment. 8
a) Explain why customer satisfaction seems to be the last phase of the Road Map Figure 9
1 i.e., Customers (other than the few participating in demonstrations) will be paying 10
big cost increases for years but it appears that broad based customer benefits will not 11
occur until late in the plan? Perhaps Figure 1 needs to be revised – please comment. 12
b) Provide details of how benefits in each category will be forecast, tracked and 13
assessed. 14
c) Is there a Business Case, including a Benefits Realization Plan. If so provide a copy. 15
d) How many of the projects (e.g., automatic fault recovery) are in the 10 year capital 16
plan? Provide a list and the original time frame for these. 17
e) Since the 3 year plan is predicated on Demonstration, are all the projects in Table 2 18
located in North York? If not indicate which are NY specific and which are system 19
wide. 20
f) Are all the projects in Table 3 based on demonstration in North York? If not indicate 21
which are NY specific and which are system wide. 22
g) Indicate whether THESL employees will participate as end users in demonstration 23
projects or whether all demonstration participants will be non-employees. 24
h) How will participants in demonstrations be selected? Provide the screening/selection 25
criteria and differentiate as needed for each type of project. 26
Toronto Hydro-Electric System Limited EB-2009-0139
Exhibit R1 Tab 11
Schedule 35 Filed: 2009 Nov 30
Page 2 of 4
INTERROGATORIES OF VULNERABLE ENERGY CONSUMERS COALITION
Witness Panel(s): 3
1
RESPONSE: 2
a) Customer satisfaction is not the last phase of the roadmap in Figure 1 of Exhibit G1, 3
Tab 1, Schedule 1, page 9. Initiatives relating to the three objective areas – climate 4
protection, energy security, and customer satisfaction – are developed simultaneously 5
under the time periods of 3, 3-10, and 10-25 year plans. 6
7
b) Benefits in each category will be assessed based on the demonstration projects’ 8
outcome. They will form an integral part of the economic assessment of the 9
deployment projects essential for evaluating their business cases. These benefits will 10
be defined by use cases and forecasted based on past performance and the design of 11
the new technology. A benefits realization plan will also be developed to define the 12
mechanism for tracking and assessing these benefits as they are realized. 13
14
c) Each of the smart grid projects has been subject to a business case analysis. THESL’s 15
efforts have been dedicated to actively explore the needs of developing the smart grid 16
in compliance with provincial mandate and in meeting utility and distributed 17
generation requirements. THESL also has the responsibility to explore, be 18
familiarized with, and apply new technologies considering the uniqueness of its 19
customer base and infrastructure. However the projects have not gone through an 20
economic assessment as explicit benefits and costs have yet to be measured. The 21
primarily purpose of the demonstration is to learn about the technology, its impact to 22
THESL operations, and to collect information which will enable THESL to further 23
evaluate the potentials of project deployment. 24
25
The value proposition and rationale for each of the 2010 initiatives are discussed in 26
Toronto Hydro-Electric System Limited EB-2009-0139
Exhibit R1 Tab 11
Schedule 35 Filed: 2009 Nov 30
Page 3 of 4
INTERROGATORIES OF VULNERABLE ENERGY CONSUMERS COALITION
Witness Panel(s): 3
Exhibit G1, Tab 1, Schedules 2 and 3., Each project is fully aligned with the smart 1
grid objectives as described in Exhibit G1, Tab 1, Schedule 1, page 5. 2
3
d) All smart grid operations projects as listed in Exhibit G1, Tab 1, Schedule 1, Table 2 4
are included in the ten-year capital plan, with the timeline provided in Exhibit D1, 5
Tab 8, Schedule 10, Table 12. 6
7
e) All smart grid operations projects as listed in Exhibit G1, Tab 1, Schedule 1, Table 2, 8
other than the secondary network automation and environmental projection initiative, 9
are located in the Smart Community area in North York. The secondary network 10
automation initiative is located in former Toronto. The environmental protection 11
initiative is studies based and demonstrations are only deployed as needed by the 12
study. No initiatives are deployed system-wide. 13
14
f) Not all of the IT&S projects, listed in Table 3, are based on the demonstration area in 15
North York. Some of these projects will require changes in the back-office and some 16
are system-wide applicable such as: 17
1. Integration Architecture and Design; 18
2. Internal Network Readiness; 19
3. Smart Grid Network Security; and 20
4. Some customer-facing pilots. 21
22
g) Demonstration participants must be a THESL customer with a smart meter and high 23
speed internet access. Programs will be open to both THESL employees and non-24
employees. 25
26

Toronto Hydro-Electric System Limited EB-2009-0139
Exhibit R1 Tab 11
Schedule 35 Filed: 2009 Nov 30
Page 4 of 4
INTERROGATORIES OF VULNERABLE ENERGY CONSUMERS COALITION
Witness Panel(s): 3
h) Participants will be enrolled on a volunteer basis, based on the criteria identified in 1
part g) as well as on geography. 2

Toronto Hydro-Electric System Limited EB-2009-0139
Exhibit R1 Tab 11
Schedule 36 Filed: 2009 Nov 30
Page 1 of 1
INTERROGATORIES OF VULNERABLE ENERGY CONSUMERS COALITION
Witness Panel(s): 3
INTERROGATORY 36: 1
Reference(s): Exhibit G1 Tab 1 Schedule 1 Page 11 2
3
In its SG Guidelines issued June 16, 2009 the Board stated that if LDCs conduct or 4
commission smart grid pilots/studies they should not duplicate efforts elsewhere in North 5
America and should explore cost sharing partnerships. 6
a) Provide a copy of the referenced report Connecting the Smart Grid. 7
b) Did THESL coordinate its SG work with Hydro One or other GTA utilities? Please 8
describe the collaboration. 9
10
RESPONSE: 11
a) Refer to Appendix A for report. 12
13
b) THESL has been and will continue to be coordinating with distributors and 14
transmitters with regard to Smart Grid initiatives, through ongoing discussions and 15
collaborations at the Ontario Smart Grid Forum, Electricity Distributors Association, 16
Canadian Electricity Association, CEATI, Utilities Telecom Council, and Institute of 17
Electrical and Electronics Engineers. Moreover THESL will continue to actively 18
participate at various conferences and seminars to share results and lessons learned. 19
CONNECTING THE SMART GRID
STRATEGIC DEPLOYMENT OF TORONTO’S ELECTRICITY NETWORK OF THE FUTURE
March 20 2009
acrespo
Typewritten Text
Toronto Hydro-Electric System Limited EB-2009-0139 Exhibit R1 Tab 11 Schedule 36 Appendix A Filed: 2009 Nov 30 (73 pages)
TABLE OF CONTENTS EXECUTIVE SUMMARY ................................................................................................ 1 1 INTRODUCTION .................................................................................................. 10 2 DEFINING THE SMART GRID VISION
2.1 Defining Toronto Hydro’s Smart Grid ..................................................................... 14 2.2 Smart Grid Building Blocks ...................................................................................... 19 2.3 Toronto Hydro’s Involvement in the Smart Grid .................................................... 23 2.4 Illustrating the Vision: Day in the Life of a Future Customer ................................. 25 3 THE CASE FOR CHANGE
3.1 Drivers for Change .................................................................................................. 28 3.2 The Value Proposition ............................................................................................. 35 4 VISION, MISSION, OBJECTIVES AND STRATEGIC PRINCIPLES
4.1 Vision and Mission .................................................................................................. 39 4.2 Objectives ................................................................................................................ 40 4.3 Strategic Principles .................................................................................................. 42 4.4 Alignment with Toronto Hydro’s Strategic Business Priorities ............................... 44 5 STRATEGIC ROADMAP
5.1 Roadmap Development Process ............................................................................. 45 5.2 Smart Grid Roadmap Highlights .............................................................................. 47 5.3 3 Year Plan ............................................................................................................... 48 5.4 3 to 10 Year Plan ..................................................................................................... 53 5.5 10 to 25 Year Plan ................................................................................................... 56 5.6 Synergistic Vignettes ............................................................................................... 58 5.7 Innovation Support Structure ................................................................................. 61 6 KEY RECOMMENDATIONS .............................................................................. 63 7 A CALL TO ACTION ............................................................................................. 65 APPENDICES Appendix A: Mapping Smart Grid Initiatives with Strategic Objectives .......................... 66 Appendix B: Smart Grid Initiatives Required in Synergistic Vignettes ............................. 69
Connecting the Smart Grid: Strategic Deployment of Toronto’s Electricity Network of the Future 1
EXECUTIVE SUMMARY
Electricity has been a primary driver for change in the 20th century. Toronto’s electricity network (the “grid”) has been built to service the City of Toronto for over 95 years, providing a fundamental necessity of life, for comfort, security, entertainment, and upholding the economy in this financial capital of Canada. Our society has become increasingly dependent on reliable, high quality electricity, and this has made the electricity grid a critical and necessary infrastructure. However, the electric grid cannot be assumed to continue delivering its services indefinitely without a significant change. The grid is faced with an abundance of risks that are increasing in size, scale, and complexity. The infrastructure is aging and demands are increasing, making it ever more difficult to maintain reliability and integrity after years of underinvestment. Simultaneously, customers in the digital era are accustomed to highly reliable, real time services, with abundant information exchange, options, control, and instant feedback. Additionally, customer loads have increased substantially with little additional investment in the existing distribution infrastructure. Finally, environmental protection has become a key priority in the political agenda and in the minds of the public. These growing pressures are now presenting a convergence of risks that overlays all of a utility’s strategic decisions regarding the future. It is calling for an immense task for innovative alternatives and creative problem solving. It requires a shift in the industry that requires everyone’s collaborative efforts. This effort, coined as “smart grid”, is a paradigm shift that represents the single greatest transformation in the history of the electric utility, an evolution of how it functions in its social, economical and environmental contexts. The vision is here, and the challenge now lies in translating that vision into action. The grid must be strategically renewed and prudently invested, applying innovative concepts and technologies, to deliver the service that is needed in the 21st century. Defining the Smart Grid A smart grid can be defined as the strategic application of advanced information, communications, and electrical/electronics technology, to optimize the operation and control of the electric infrastructure, to meet customer requirements and enhance their experience, and to promote environmental sustainability. It refers to a network of intelligence, through smart systems, smart processes, and smart people. It is not a one‐time installation program, but a continuously evolving grid, keeping abreast of technological advances and seeking opportunities for the betterment of the grid. Smart
Connecting the Smart Grid: Strategic Deployment of Toronto’s Electricity Network of the Future 2
grid is also about being connected, connecting the grid with its customers, new technologies, and the environment.
The Case for Change The vision of smart grid is based on the realities that the electricity industry is facing today. Utilities must respond to these realities to continue providing services for its customers, the society, and the environment. The key drivers for change include:
• The Ontario Green Energy Act – provincial initiative that can enable Ontario to become a North American leader in renewable energy and green economy.
• City of Toronto’s Climate Change Plan – commitment for Toronto to become the renewable energy capital of Canada.
• Electrification of transportation – shift in the transportation industry to plug‐in electric and hybrid electric vehicles (PHEVs), as well as expansion of electric public transit.
• Energy security – a convergence of risks with an aging infrastructure, congestion, price volatility, system losses, cyber and physical security risks, and need for workforce renewal.
• Customer expectations in a digital era – focus on community values and environmental actions, need for tools to manage electricity use, preferences to install distributed generation, need for consistent high power quality to meet digital electronics requirements, and the demand for better experience with the utility.
Toronto’s smart grid is seen as the plug that connects environmentally mindful customers to the grid in a digital era. Benefits of the smart grid, summarized at a high level, include:
• Customer benefits – access to timely information, control, and options to better manage their energy use and carbon footprint, as well as improved experience with the utility.
• Social and economic benefits – job creation, economic growth through infrastructure investments, opportunities for coordination and shared services, and increase in public safety and quality of life.
• Environmental benefits – cultivate culture of conservation, promote green generation, and reduced environmental footprint.
• Utility benefits – improved reliability, “digital grade” power quality, ensuring security of supply, better management of assets, operational efficiencies, accommodate distributed energies, deferral of infrastructure expansions, improved revenue management, and protection against security threats.

Connecting the Smart Grid: Strategic Deployment of Toronto’s Electricity Network of the Future 3
Challenges and Costs of Deployment While the smart grid has significant potential to deliver value, it represents a significant endeavour. Research and development is needed to break through knowledge and technology barriers. Technology solutions will take time to develop, mature, and be ready for commercialization. Communication and engineering standards will need to converge. Building Toronto Hydro’s smart grid will require a framework of intelligence, energy, communications, strategy, legislation, regulation, and stakeholders’ commitment. A coordinated innovation effort will consist of a solid integration and synchronization of decentralized systems, processes and organizational structure. The workforce will require new competencies. Security measures must be put in place. Business processes, operating procedures, and work protection will have to incorporate the new paradigm of a smart grid. Progressive and timely legislation and regulation will be instrumental towards its success. Disincentives from rates must be removed to recognize the benefits of conservation and energy efficiency, as well as accounting for socioeconomic and environmental factors. Customer education and adoption of new technologies will further need to be assisted by retailers and service providers. Utilities will have to approach customers with transparency and address their specific yet evolving needs. The costs and time required, as well as the benefits attained, will depend on the scope and pace of implementation, technology trends, and customer acceptance and adoption, and is thus not straightforward to quantify. Costs and benefits are typically shared amongst a wide mix of projects rather than in isolation, investments are made to account for future requirements, and benefits often extend into socioeconomic and environmental contexts. Careful investments and guiding strategies will be utilized to mitigate the risks of initial deployments and ensure that early benefits are attained. Given that investments in the Advanced Metering Infrastructure (AMI) have been mandated by the government, and that some of the building blocks for the smart grid are already in progress and maturing within Toronto Hydro, it is expected that additional costs for smart grid deployment will include incremental spending to accelerate maturing of the in‐progress building blocks, implementation of new smart grid solutions, and in integrating various programs/solutions.
Connecting the Smart Grid: Strategic Deployment of Toronto’s Electricity Network of the Future 4
Vision and Mission The vision for smart grid is an intelligent, continually innovative electricity network. Intelligence refers to the “smartness” of the grid, including self‐healing, robustness, fast, reliable, and having optimized solutions. This smartness is harnessed through continual innovation, where new solutions and methods are strategically applied to the electric system and its services. In addition, the mission is to modernize to deliver value in meeting customer needs and expectations of the 21st century. This includes modernizing the infrastructure, communications, and even processes, culture, and the services it provides to customers.
Smart Grid Objectives Toronto’s smart grid has three key objectives. The first objective is in climate protection and sustainable energy, in particular to meet the requirements of the Ontario Green Energy and Green Economy Act, City of Toronto’s Climate Change, Clean Air, and Sustainable Energy Action Plan, and Canada’s Kyoto Protocol targets. We need to achieve the following:
1. Targeted reduction of environmental footprint, working towards a zero carbon, zero waste organization by closely monitoring, tracking, and controlling our and helping our customers manage their environmental footprint.
2. Accommodate a large variety and high penetration of distributed generation and storage options.
3. Provide customers with programs and streamlined processes for the connection of renewables, clean generation, and conservation efforts.
4. Support the reliable connection of microgrids, community energy, and virtual power plants in the Toronto Hydro system.
5. Enable an electrified transportation infrastructure, including full and plug‐in electric hybrid vehicles, subway systems, and electric trains.
The second objective is to ensure energy security, to deliver electricity that is safe, reliable, and efficient. Thus we need to:
1. Invest prudently in an aging infrastructure to manage risks and to provide high levels of reliability.
2. Provide the visibility and control throughout the network, working towards a self healing and fault anticipatory network, and connect high levels of distributed energy sources.
3. Monitor and manage power quality levels and its impact to customers. 4. Improve the efficiency and effectiveness of utility operations. 5. Incorporate physical and cyber security measures.
Connecting the Smart Grid: Strategic Deployment of Toronto’s Electricity Network of the Future 5
The third objective is to provide customer satisfaction in the 21st century. Smart grid opens up new and exciting opportunities for us to work together with our customers, who value trust, service excellence, transparency, performance, and reasonable rates. Thus, the utility should:
1. Provide timely information that empowers actions and improves experience with the utility, such as their environmental footprint, energy consumption, outage and restoration notifications, costs and cost projections, budget constraints, utility programs.
2. Offer new forms of communications for customers to have readily available access to utility information, such as web services, email notifications, text messages, online chat‐rooms, blogs, and through in‐home devices. Multilingual services are also required.
3. Enable energy management controls such as in‐home displays, smart thermostats, and smart home appliances, with intuitive, user friendly interfaces.
4. Provide new forms of customer service models that suit their preferences, such as on‐line self‐services, voice recognition systems, changing billing payment periods, and prepayment options.
5. Offer advices on conservation and saving costs, reducing carbon footprint. Rewards for conserving. Allows integration of renewable energies and plug‐in hybrid vehicles with simplified processes.
6. Potentially provide incentives and financial support to sustain reduced energy consumption and environmental footprint, especially for low income households.
Strategic Principles Strategic principles are simple, understandable, actionable statements that reflect an organization’s strategy to achieve a vision. It should empower all stakeholders to move towards the smart grid vision.
The first strategic principle is to harness innovation – throughout the grid. This calls for innovation through applying intelligence in the system – intelligent people, intelligent business processes, and intelligent technologies. This intelligence is to be applied throughout the grid, creating an “end‐to‐end” smart system, including beyond the meter to assist customers in conserving, managing energy usage, and incorporating renewable energies, as well as partnering with upstream transmission system and other distribution networks in global optimization. The second strategic principle is to explore synergies by integrating systems. The greatest value from a smart grid is not from the development of independent initiatives, but from the integration of its various technologies and services, and to maximize the use of available data and information. This is a holistic approach to smart grid. The action to realize such synergies comes from integrating systems, such as between people to work
Connecting the Smart Grid: Strategic Deployment of Toronto’s Electricity Network of the Future 6
collaboratively, between strategies and plans for alignment and leverage, between technologies for enhanced functionalities, and between services for added value.
The third strategic principle is to develop an innovation support structure. The true strength of smart grid arises when innovation is accompanied by a support structure. This structure directs, guides, and focuses efforts on constructive innovation and filters out disruptive ones. It also implies the application of business processes management, mechanisms to quickly turn trends into actions, measures to sustain innovation, training and education, stakeholder engagement, and technology support.
Strategic Roadmap The role of the strategic roadmap is to translate the smart grid vision into a set of actionable programs and projects. It was developed based on identifying the infrastructure, services, technologies, research and development efforts, as well as core/baseline business and technical requirements needed to achieve the objectives of the smart grid. Highlights from the roadmap are shown in Figure E1. The 3 year plan of the smart grid roadmap is to establish Toronto’s Smart Community. This is a demonstration area where prioritized initiatives can be tested, processes developed, customer acceptance understood, and operating procedures created. Emphasis will be on maturing and accelerating existing smart grid building blocks, as well as integrating building blocks to realize cross‐functional services, shared costs, and added values. Expected benefits will be demonstrated and measured, and used to support potential full scale deployment. The goal is to generate short term wins, and validate the value of smart grid. Additional opportunities and potentials will also be identified for further demonstration. Results and lessons learned will be shared regularly in various forms of communication, such as white papers, presentations, and online content. Initiatives that were selected as a part of this demonstration area are characterized by relative certainty and value, typically utilizing established, proven technologies to demonstrate immediate value for the customer, society, and the environment. These projects are typically in progress and maturing at Toronto Hydro, or planned to commence in the next three years. For more uncertain initiatives, it is expected that given the pace of industry adoption and effort into advancing smart grid technologies, in 3 years time there will be increased certainly and convergence into technology trends, communication standards, customer responses, and government priorities and regulations.
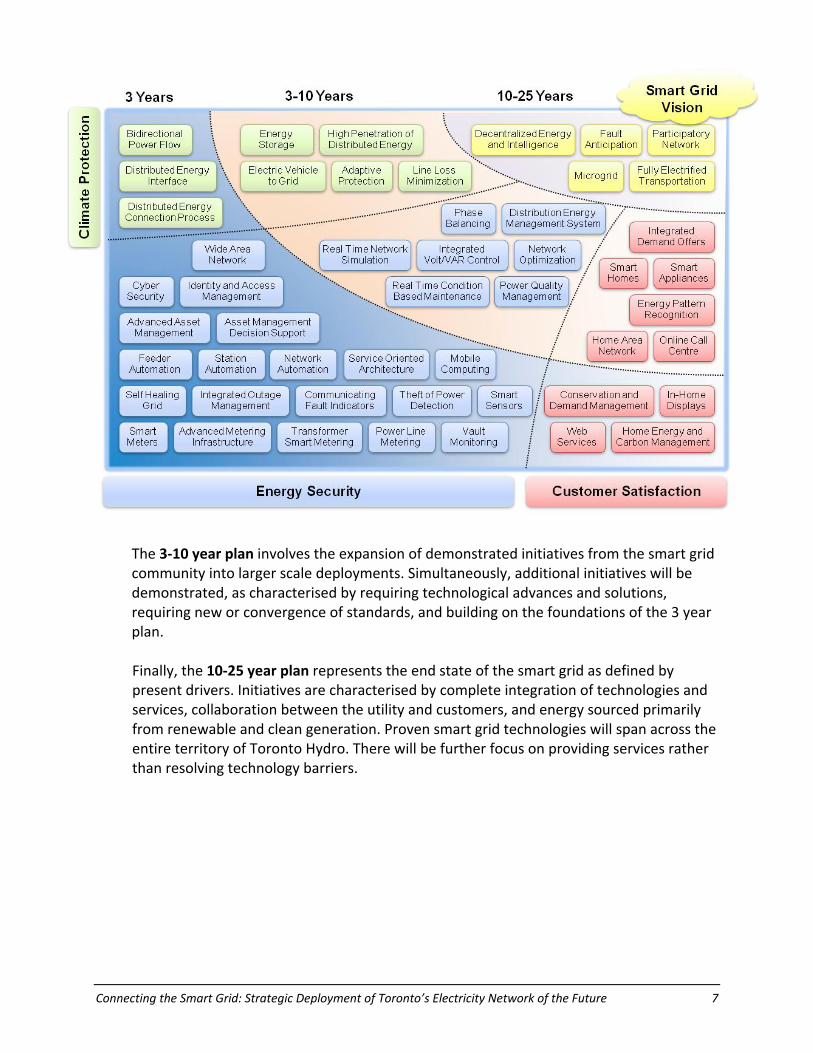
Connecting the Smart Grid: Strategic Deployment of Toronto’s Electricity Network of the Future 7
The 3‐10 year plan involves the expansion of demonstrated initiatives from the smart grid community into larger scale deployments. Simultaneously, additional initiatives will be demonstrated, as characterised by requiring technological advances and solutions, requiring new or convergence of standards, and building on the foundations of the 3 year plan. Finally, the 10‐25 year plan represents the end state of the smart grid as defined by present drivers. Initiatives are characterised by complete integration of technologies and services, collaboration between the utility and customers, and energy sourced primarily from renewable and clean generation. Proven smart grid technologies will span across the entire territory of Toronto Hydro. There will be further focus on providing services rather than resolving technology barriers.
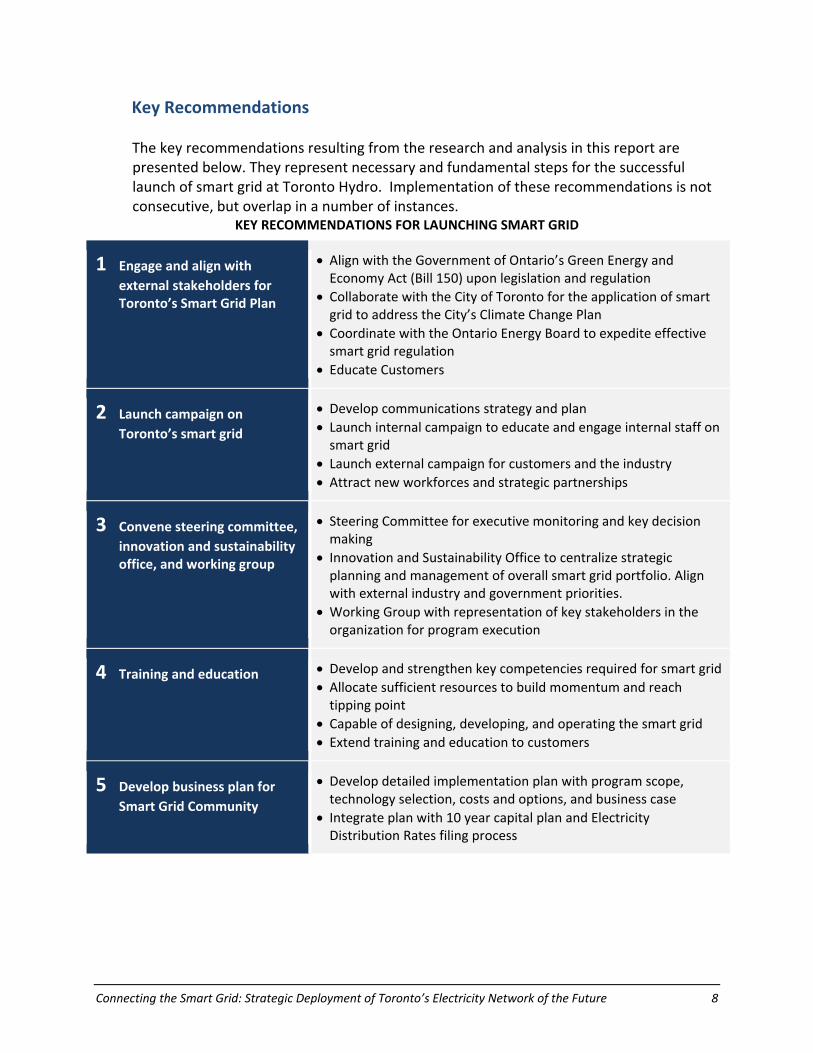
Connecting the Smart Grid: Strategic Deployment of Toronto’s Electricity Network of the Future 8
Key Recommendations
The key recommendations resulting from the research and analysis in this report are presented below. They represent necessary and fundamental steps for the successful launch of smart grid at Toronto Hydro. Implementation of these recommendations is not consecutive, but overlap in a number of instances.
KEY RECOMMENDATIONS FOR LAUNCHING SMART GRID
1 Engage and align with external stakeholders for Toronto’s Smart Grid Plan
• Align with the Government of Ontario’s Green Energy and Economy Act (Bill 150) upon legislation and regulation
• Collaborate with the City of Toronto for the application of smart grid to address the City’s Climate Change Plan
• Coordinate with the Ontario Energy Board to expedite effective smart grid regulation
• Educate Customers
2 Launch campaign on Toronto’s smart grid
• Develop communications strategy and plan • Launch internal campaign to educate and engage internal staff on smart grid
• Launch external campaign for customers and the industry • Attract new workforces and strategic partnerships
3 Convene steering committee, innovation and sustainability office, and working group
• Steering Committee for executive monitoring and key decision making
• Innovation and Sustainability Office to centralize strategic planning and management of overall smart grid portfolio. Align with external industry and government priorities.
• Working Group with representation of key stakeholders in the organization for program execution
4 Training and education • Develop and strengthen key competencies required for smart grid • Allocate sufficient resources to build momentum and reach tipping point
• Capable of designing, developing, and operating the smart grid • Extend training and education to customers
5 Develop business plan for Smart Grid Community
• Develop detailed implementation plan with program scope, technology selection, costs and options, and business case
• Integrate plan with 10 year capital plan and Electricity Distribution Rates filing process

Connecting the Smart Grid: Strategic Deployment of Toronto’s Electricity Network of the Future 9
A Call to Action The City of Toronto has been known as the hub of Canada – the financial hub, the cultural hub, and the entertainment hub. With firm dedication and collaboration from the Ontario government, Toronto government, Toronto Hydro, and other key stakeholders, Toronto can also become the intelligent and sustainable energy hub of Canada. The smart grid is the avenue to make this happen. Through innovation and the strategic application of information, communication, and electronic/electrical technologies, the smart grid can optimize the electric infrastructure in a time of a convergence of risks, enhance customer experience in a digital era, and meet the province and city’s agenda for environmental sustainability and a green economy. Guided by our vision, objectives, strategy, and roadmap, we can realize a path through the challenges of deployment into a future of innovation and sustainability. The recommendations in this report envision actions taken by stakeholders throughout the organization to work collaboratively towards a smart grid. The time is right, and the time is now.
Connecting the Smart Grid: Strategic Deployment of Toronto’s Electricity Network of the Future 10
1 INTRODUCTION
Smart Grid: From Vision to Action
Electricity has been a primary driver for change in the 20th century. Toronto’s electricity network (the “grid”) has been built to service the City of Toronto for over 95 years, providing a fundamental necessity of life, for comfort, security, entertainment, and upholding the economy in this financial capital of Canada. Without electricity, the world will not be as we see it today – subway systems, telecommunications, information technologies, commercial centres, manufacturing industries, entertainment systems, electronic commerce, etc., will no longer perform its function. Our society has become increasingly dependent on reliable, high quality electricity, and this has made the electricity grid a critical and necessary infrastructure. However, the electric grid, which has served the population of Toronto well for many decades, cannot be assumed to continue delivering its services indefinitely without a significant change. Our lights may be on, but the grid is faced with an abundance of risks that are increasing in size, scale, and complexity. The infrastructure is aging and demands are increasing, and it becomes increasing difficult to maintain reliability and integrity after years of underinvestment. There is not much time left before the grid reaches its very limits. This is made difficult by an aging workforce, as well as increasing security concerns. There needs to be renewed focus on the need for sustaining the electrical infrastructure. The status quo is just not enough. Simultaneously, we see significant growths in other industries, which undertook great development driven by innovation and improving customer service. The Information Technology and Telecom explosions of the 1990’s, in particular the rise of the Internet, have changed the way we live and open up vast opportunities for better standards of living. Customers are accustomed to highly reliable, real time services, with abundant information exchange, options, control, and instant feedback. Hence, we’re in a smart era – smart phones, smart computers, smart business, smart cars and smart people. It is time for utilities to come onboard and to offer customers the service they expect in the 21st century. Finally, environmental protection has become a key priority in the political agenda and in the minds of the public. The message is clear, that the effects of climate change have become increasingly evident, and we must act now. The Ontario Government (Ministry of
“We need a 21st century electricity grid that can better meet the changing nature of power consumption in Ontario. A smarter grid is essential to maximizing the energy from Ontario’s abundant natural solar and wind energy”
Premier Dalton McGuinty
Connecting the Smart Grid: Strategic Deployment of Toronto’s Electricity Network of the Future 11
Energy and Infrastructure) has put forward the Green Energy Act to drive a green energy system, while the City of Toronto has defined its Climate Change Plan. These growing pressures are now presenting a convergence of risks that overlays all of a utility’s strategic decisions regarding the future. It is calling for an immense task for innovative alternatives and creative problem solving. It requires a shift in the industry that requires everyone’s collaborative efforts. As described in IBM’s report on Plugging in the Customer, “Collectively, these drivers are overturning traditional assumptions about energy consumers and the fundamental value proposition of the industry itself. Though each of these trends has progressed independently for a time, they have all now reached a point of convergence where each is fuelling the others and the entire combination is catalytic”1. Also, according to CEATI’s Electric Distribution Utility Roadmap, Phase II: Common Infrastructure, “It becomes clear that the industry as a whole could not survive if it chose to remain on the traditional, “Business as Usual” path”2. It is now a time for change. We need a change towards a grid that encourages energy conservation and efficiency, accommodates large amounts of renewable and clean energy sources, and reduces carbon emissions and environment footprint for all. We need a grid that provides information and options to customers to make informed decisions about their energy usage and supports an advanced and electrified transportation system that substitutes electricity for oil. We need a grid that continuously innovates, optimizes the grid’s operation, and enhances system reliability and security. We need a grid that enables a greener economy with greener jobs. To accomplish this, we need a smarter energy grid. Coined as “smart grid”, this is a paradigm shift, a fundamental change in the electric utility business. The smart grid represents the single greatest transformation in the history of the electric utility, an evolution of how it functions in its social, economical and environmental contexts. The vision is here. The perfect storm has arrived. The challenge now lies not in the vision, but in translating vision into action, by navigating a path through this perfect storm. There is no silver bullet, and grid must be strategically renewed and prudently invested, applying innovative concepts and technologies, to deliver the service that is needed in the 21st century.
1 IBM Global Business Services, “Plugging in the Customer,” Available at: http://www‐05.ibm.com/de/energy/pdf/plugging‐in‐the‐consumer.pdf 2 CEATI, “Electric Distribution Roadmap: Common Infrastructure,” Available at: http://www.ceati.com/pdetails.php?id=5962
Connecting the Smart Grid: Strategic Deployment of Toronto’s Electricity Network of the Future 12
Acknowledgements This strategic plan was developed as a collaborate effort of many stakeholders in the organization. The authors would like to acknowledge the following individuals for their valuable contributions:
• Anthony Haines, President • Eduardo Bresani, Chief Information Officer • JS Couillard, Chef Financial Officer • Susan Davidson, Sr. VP, Customer Services • Ivano Labricciosa, VP, Asset Management • Ave Lethbridge, VP, Organizational Effectiveness • Ben LaPianta, VP, Distribution Grid Management • Blair Peberdy, VP, Communications and Public Affairs, Chief Conservation Officer • Dino Priore, VP, Distribution Services • Robert Wong, VP, Business Transformation • Asheef Jamal, Controller • Kah‐Fae Chan, Director, Demand Management • Joyce Mclean, Director, Strategic Issues • Catherine Parry, Director, Marketing, Communications & Public Affairs • Kshamit Dixit, Manager, IT Security • Milorad Dubljevic, Manager, Business Intelligence • Denise Flores, Manager, Stations and Distribution Automation • Thor Hjartarson, Manager, System Reliability Planning • Dave Jutla, Manager, Capacity Planning • Lauren Kirk, Manager, Call Centre • Steve MacDonald, Manager, Metering Technologies • Colin McLorg, Manager, Regulatory Affairs • Evelyn Page, Manager • Francis Szto, Manager, Policy & Standards • Mike Walker, Manager, Enterprise PMO • Glen Winn, Manager, EDR • Sam Zurzolo, Manager, Strategic Planning Support
Furthermore, the authors would like to acknowledge many teams in the organization for their contributions, including but not limited to:
• Call Centre • Conservation and Demand Management • Distribution Grid Operations • Finance • IT&S Enterprise Architecture • Marketing and Communications • Metering Technologies

Connecting the Smart Grid: Strategic Deployment of Toronto’s Electricity Network of the Future 13
• Policy and Standards • Regulatory • Stations and Distribution Automation • System Reliability Planning
Connecting the Smart Grid: Strategic Deployment of Toronto’s Electricity Network of the Future 14
2 DEFINING THE SMART GRID VISION 2.1 DEFINING TORONTO HYDRO’S SMART GRID
In February of 2009, the Ontario Ministry of Energy and Infrastructure introduced Bill 150, the Green Energy Act, to the Legislative Assembly of Ontario. The act defines the smart grid as follows:
“Smart grid” means the advanced information exchange systems and equipment that when utilized together improve the flexibility, security, reliability, efficiency and safety of the integrated power system and distribution systems, particularly for the purposes of,
a) Enabling the increased use of renewable energy sources and technology, including generation facilities connected to the distribution system;
b) Expanding opportunities to provide demand response, price information and load control to electricity customers;
c) Accommodating the use of emerging, innovative and energy‐saving technologies and system control applications; or
d) Supporting other objectives that may be prescribed by regulation.
Hence, the following observations can be made about the province’s view of the smart grid:
• Smart grid is the use of advanced information exchange systems and equipment in the electrical grid
• It’s objective is to improve the flexibility, security, reliability, efficiency, and safety of the grid
• This applies both to the integrated (bulk) power system, the distribution system, and end use
• It is applied for the purpose of increasing the use of renewable generation, for conservation, and providing customers with information and empowering them with energy controls and information to manage their energy consumption
• It serves as a platform to support further and emerging applications that may be prescribed by regulation
It is commonly described that the “smart grid” means different things to different people. Hence it is vital to understand its definition as it relates to the unique context of the City of Toronto. Applying the government’s definition of the smart grid, Toronto Hydro has developed the following definition:
A smart grid can be defined as the strategic application of advanced information, communications, and electrical/electronics technology, to optimize
the operation and control of the electric infrastructure, to meet customer
Connecting the Smart Grid: Strategic Deployment of Toronto’s Electricity Network of the Future 15
requirements and enhance their experience, and to promote environmental sustainability.
In this definition, the following should be noted:
• It refers to smart systems, smart processes, and smart people, working together to realize the new paradigm of a truly “smart” grid
• The term smart utility can be used synonymously to the smart grid, expanding from its focus on technology alone
• It is also not a one‐time installation program, but a continuously evolving grid, keeping abreast of advances in the industry and seeking opportunities for the betterment of the grid
Smart Grid as a Network of Intelligence A smart grid can be visualized as a network of intelligence through connecting building blocks in the grid. This is illustrated in Figure 1, which divides the path of intelligence into the three areas of Customer/Field, Communications, and the Office. Each contains a set of “building blocks” which participate in this flow of intelligence. Customer and Field devices generate data, which is transferred through communication channels into the Office. Office contains intelligent process and applications that translate data into useful information, and is relayed to people who receives the information and is translated into knowledge. This knowledge can then be used to make intelligent business decisions, which in turn is returned to the grid as grid intelligence and control. Note, in some cases, people may only be informed and based on established algorithms/logic, actions may be directly communicated back to grid intelligence. This architecture exemplifies how a smart grid can utilize smart systems, processes, and people to optimize the grid. There are, of course, more complex dynamics of the flow of intelligence within the system, such as:
• Distributed intelligence within the field without human intervention • Strategic decisions made to enable a policy directive (e.g. use of green energy) • Customers managing their own energy usage through information made available
to them from in‐home devices Nevertheless, a smart grid highlights the value‐add of intelligence throughout the energy delivery chain, whether the intelligence is centrally managed by the utility or distributed throughout the grid.
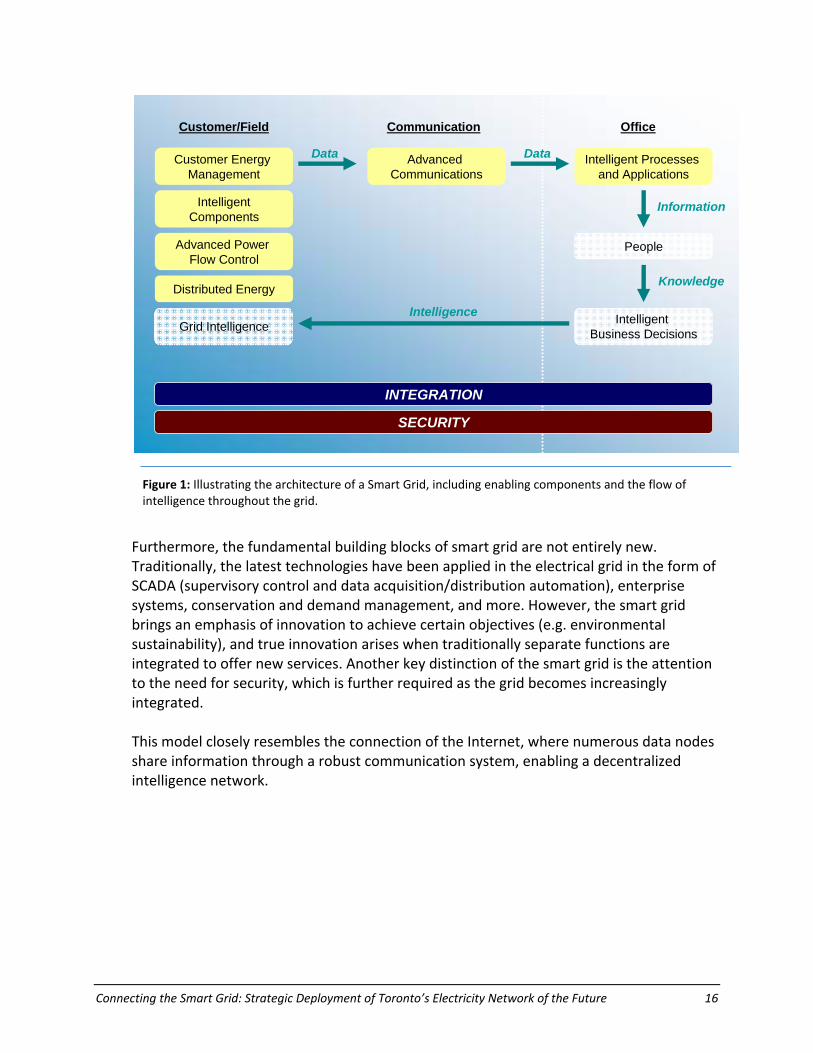
Connecting the Smart Grid: Strategic Deployment of Toronto’s Electricity Network of the Future 16
This architecture exemplifies how a smart grid can utilize smart systems, processes, and people to optimize the grid. There are, of course, more complex dynamics of the flow of intelligence within the system, such as: Furthermore, the fundamental building blocks of smart grid are not entirely new. Traditionally, the latest technologies have been applied in the electrical grid in the form of SCADA (supervisory control and data acquisition/distribution automation), enterprise systems, conservation and demand management, and more. However, the smart grid brings an emphasis of innovation to achieve certain objectives (e.g. environmental sustainability), and true innovation arises when traditionally separate functions are integrated to offer new services. Another key distinction of the smart grid is the attention to the need for security, which is further required as the grid becomes increasingly integrated. This model closely resembles the connection of the Internet, where numerous data nodes share information through a robust communication system, enabling a decentralized intelligence network.
IntelligentComponents
Advanced Communications
Distributed Energy
Intelligent Processes and Applications
Customer Energy Management
Advanced Power Flow Control
Customer/Field Communication Office
Data
Information
People
Knowledge
Intelligent Business DecisionsGrid Intelligence
Data
Intelligence
INTEGRATION
SECURITY
Figure 1: Illustrating the architecture of a Smart Grid, including enabling components and the flow of intelligence throughout the grid.
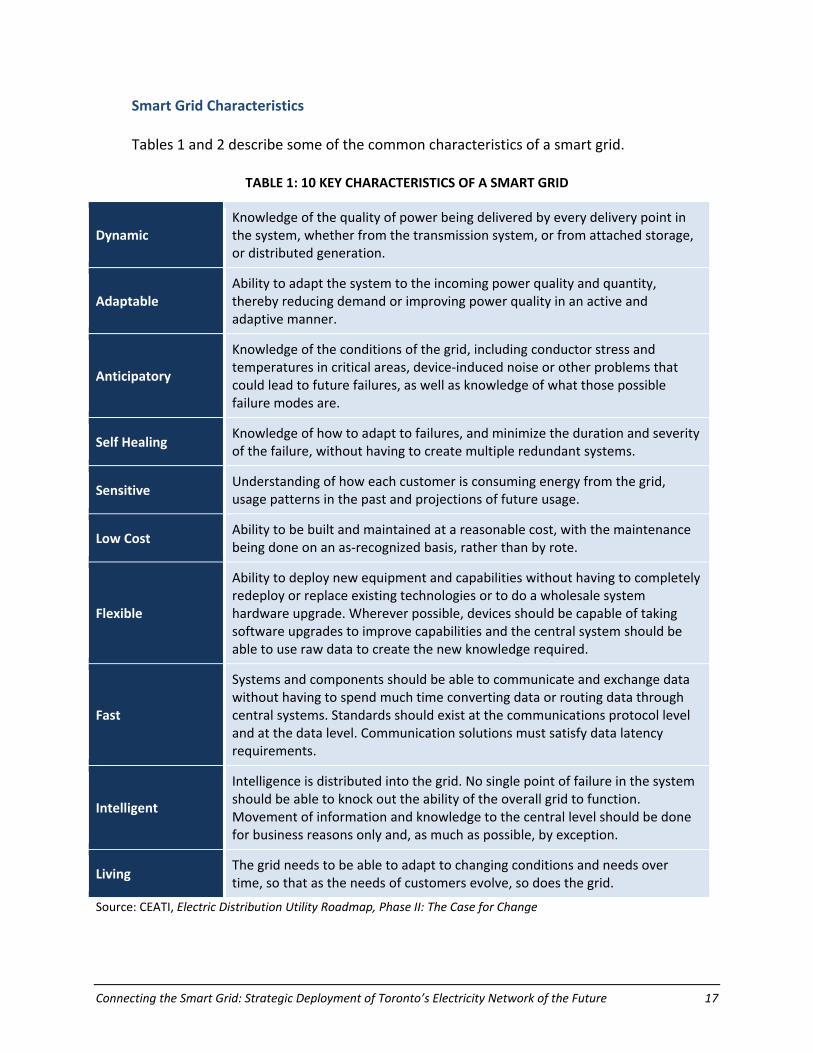
Connecting the Smart Grid: Strategic Deployment of Toronto’s Electricity Network of the Future 17
Smart Grid Characteristics Tables 1 and 2 describe some of the common characteristics of a smart grid.
TABLE 1: 10 KEY CHARACTERISTICS OF A SMART GRID
Dynamic Knowledge of the quality of power being delivered by every delivery point in the system, whether from the transmission system, or from attached storage, or distributed generation.
Adaptable Ability to adapt the system to the incoming power quality and quantity, thereby reducing demand or improving power quality in an active and adaptive manner.
Anticipatory
Knowledge of the conditions of the grid, including conductor stress and temperatures in critical areas, device‐induced noise or other problems that could lead to future failures, as well as knowledge of what those possible failure modes are.
Self Healing Knowledge of how to adapt to failures, and minimize the duration and severity of the failure, without having to create multiple redundant systems.
Sensitive Understanding of how each customer is consuming energy from the grid, usage patterns in the past and projections of future usage.
Low Cost Ability to be built and maintained at a reasonable cost, with the maintenance being done on an as‐recognized basis, rather than by rote.
Flexible
Ability to deploy new equipment and capabilities without having to completely redeploy or replace existing technologies or to do a wholesale system hardware upgrade. Wherever possible, devices should be capable of taking software upgrades to improve capabilities and the central system should be able to use raw data to create the new knowledge required.
Fast
Systems and components should be able to communicate and exchange data without having to spend much time converting data or routing data through central systems. Standards should exist at the communications protocol level and at the data level. Communication solutions must satisfy data latency requirements.
Intelligent
Intelligence is distributed into the grid. No single point of failure in the system should be able to knock out the ability of the overall grid to function. Movement of information and knowledge to the central level should be done for business reasons only and, as much as possible, by exception.
Living The grid needs to be able to adapt to changing conditions and needs over time, so that as the needs of customers evolve, so does the grid.
Source: CEATI, Electric Distribution Utility Roadmap, Phase II: The Case for Change
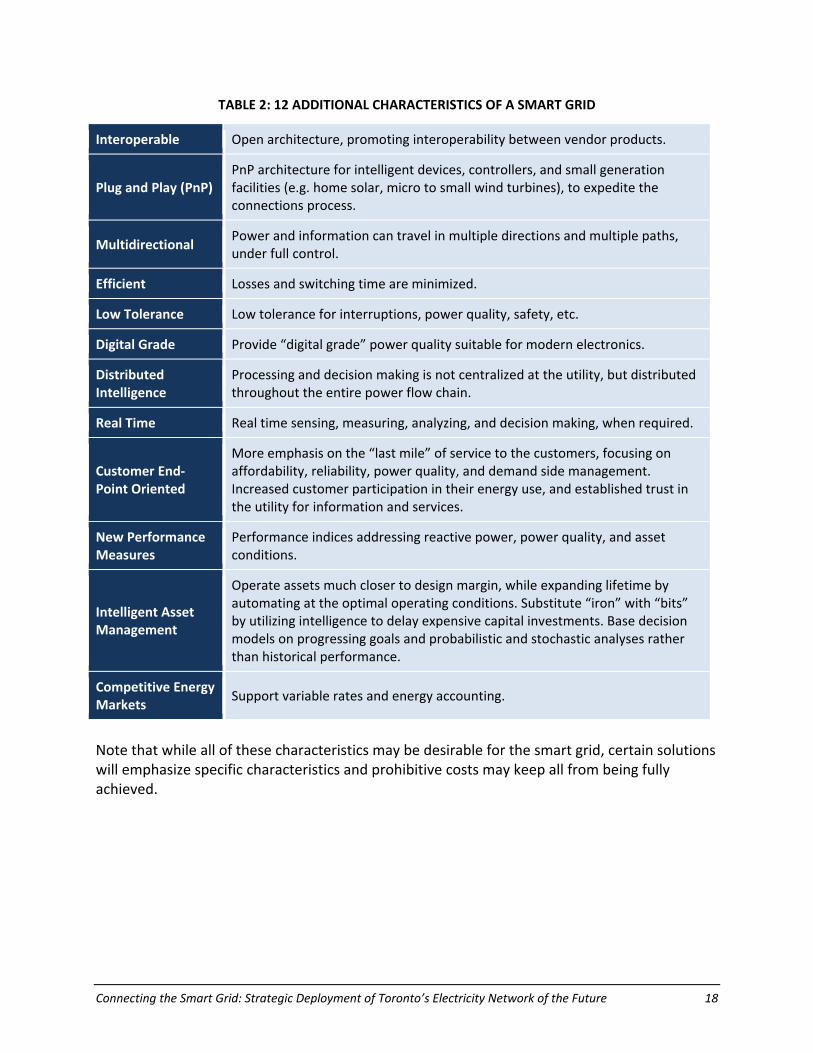
Connecting the Smart Grid: Strategic Deployment of Toronto’s Electricity Network of the Future 18
TABLE 2: 12 ADDITIONAL CHARACTERISTICS OF A SMART GRID
Interoperable Open architecture, promoting interoperability between vendor products.
Plug and Play (PnP) PnP architecture for intelligent devices, controllers, and small generation facilities (e.g. home solar, micro to small wind turbines), to expedite the connections process.
Multidirectional Power and information can travel in multiple directions and multiple paths, under full control.
Efficient Losses and switching time are minimized.
Low Tolerance Low tolerance for interruptions, power quality, safety, etc.
Digital Grade Provide “digital grade” power quality suitable for modern electronics.
Distributed Intelligence
Processing and decision making is not centralized at the utility, but distributed throughout the entire power flow chain.
Real Time Real time sensing, measuring, analyzing, and decision making, when required.
Customer End‐Point Oriented
More emphasis on the “last mile” of service to the customers, focusing on affordability, reliability, power quality, and demand side management. Increased customer participation in their energy use, and established trust in the utility for information and services.
New Performance Measures
Performance indices addressing reactive power, power quality, and asset conditions.
Intelligent Asset Management
Operate assets much closer to design margin, while expanding lifetime by automating at the optimal operating conditions. Substitute “iron” with “bits” by utilizing intelligence to delay expensive capital investments. Base decision models on progressing goals and probabilistic and stochastic analyses rather than historical performance.
Competitive Energy Markets
Support variable rates and energy accounting.
Note that while all of these characteristics may be desirable for the smart grid, certain solutions will emphasize specific characteristics and prohibitive costs may keep all from being fully achieved.
Connecting the Smart Grid: Strategic Deployment of Toronto’s Electricity Network of the Future 19
2.2 SMART GRID BUILDING BLOCKS Smart grid is composed of an integration of building blocks, each of which carries its key characteristics. These building blocks include:
• Customer Energy Management • Intelligent Components • Advanced Power Flow Control • Distributed Energy • Advanced Communications • Intelligent Processes and Applications
This section discusses the smart grid vision along each building block. Customer Energy Management Traditionally the only feedback to a customer regarding its energy usage is a bill at the end of the billing cycle, typically 30 to 60 days after the period in which they consumed the electricity. They are uninformed regarding their energy usage, how they can save electricity and thus their costs, as well as the impact of their energy use to the environment. Moreover they did not necessarily have the tools to allow them to obtain this information, save costs, or reduce their environmental footprint. With the advent of a smart grid, customers will have the tools and information available to become more aware in their energy usage and enabled to make informed decisions. They will have access to multiple communication channels to access utility information. They will be offered a variety of options to manage and control their energy usage. They will become more aware of their environment impact and are encouraged to think in carbon footprints. The vision is in moving towards a “participatory network”, as described in IBM’s report on Plugging in the Customer3. This is a dynamic energy ecosystem where customers and utilities work together, sharing responsibilities and benefits, to achieve core objectives such as maintaining quality of life, reducing costs, and minimizing environmental impact.
Intelligent Components Intelligent components form the fundamental intelligent building block of the smart grid. They can be distributed sensors, providing visibility throughout the grid. They further generate data and have communication capabilities amongst each other and back to the office for centralized processing and control.
3 IBM Global Business Services, “Plugging in the Customer,” Available at: http://www‐05.ibm.com/de/energy/pdf/plugging‐in‐the‐consumer.pdf
Connecting the Smart Grid: Strategic Deployment of Toronto’s Electricity Network of the Future 20
They enable utility operators to gain visibility into the grid, perform conditions‐based monitoring, provide alarms of vault floods, fires and intrusion, anticipate faults through identifying fault signatures, etc., and make localized intelligent decisions on the course of actions and perform diagnostics. This also includes components that incorporate the latest advances in materials engineering and equipment design, such as superconductivity and advanced power electronics. A recent example of intelligent components are smart meters, which are distributed units throughout the grid, and capable of mutual communication with a backhaul for central processing. They enable local monitoring of power usage, with ever growing capabilities such as remote disconnect, power quality measurement, load control, detection of meter tampering, and even as gateways into a home area network (HAN). They are fully scalable to multi‐million meter deployments, allow open, two‐way communications. When integrated with other systems such as back‐office meter data management, they can enable a wide array of other functions, such as outage and restoration notification, energy loss calculations and demand management. Advanced Power Flow Control When intelligent components are integrated and used in conjunction with high voltage equipment, they can be utilized for advanced power flow control. Examples include:
• Self‐healing grid – automatic fault detection, location, isolation, sectionalisation, and restoration to minimize the impact of an outage.
• Integrated Volt/VAR Control (IVVC) – integrated operation of reactive compensators (e.g. capacitor banks), voltage regulators, and tap changers to control the system’s voltage and reactive power, optimizing voltage profile and minimizing energy loss.
• Load balancing – monitoring and control of the loading between phases and feeders, and redirecting loads for phase balancing and away from congested areas, to lower losses and increase system capacity.
• Power conditioning – use of controllable reactive power compensating devices to restore the system’s power quality. Examples include DSTATCOMs (Dynamic Static Compensators) and SVCs (Static VAR Compensators), which are being used on the transmission systems today. Potentially distributed energy sources, in particular inverter‐based generation, can be set to inject controllable reactive power to condition the system. This also implies the need for a broader use of solid‐state power electronics into the electrical system.
Connecting the Smart Grid: Strategic Deployment of Toronto’s Electricity Network of the Future 21
Distributed Energy A primary driver for the smart grid is the decentralization of energy generation. Moving from a traditional vertical utility, where generation is centralized, to a largely decentralized generation network is a primary driver for the smart grid. Distributed generation (DG) consists largely on alternative energy sources, including photovoltaic (PV), wind, biogas, biomass, fuel cells, combined heat and power (CHP), and geothermal. Other sources such as concentrated solar, tidal and wave are also in research and pilot phases. The benefits of utilizing DG includes locating generating sources close to demand, thus minimizing line losses, supporting clean and renewable energy sources, relieving distribution and transmission system congestion, and enabling customers to own generation and profit from selling excess power back into the grid.
However, distributed generation only paints half the picture. The majority of alternative energies are intermittent in nature, due to their dependency on intermittent sources of “fuel”, such as solar and wind, and thus cannot ensure consistent levels of supply. This poses an enormous challenge with matching energy supply and demand, as well in sizing the supporting distribution network. The greatest opportunity to mitigate these challenges lies in the use of distributed storage (DS). Storage options include large scale battery storage (e.g. sodium sulphur), capacitors, pumped water, flywheels, compressed air, thermal, hydrogen, superconducting magnetic energy storage (SMES), and batteries in electric/plug‐in hybrid electric vehicles. The use of storage can buffer variations in intermittent supply and demand, significantly improving supply dependency and predictability, as well as reducing the need to curtail and redirect load, or require the development of additional fossil generation as back‐up. Combining distributed generation and distributed storage, we get distributed energy. Further mechanisms can be in place to mitigate the intermittency of alternative sources. This includes accurate generation and load forecasting, controllable demand response, and intelligent switching to direct the flow of energy. A further challenge to the successful operation of a distributed network is its design and operation. The electric distribution system was designed for unidirectional power flow from the transmission transfer stations. Hence, its line capacities as well as protection system – which are critical towards the safe and secure operation of the grid – will fail under a high penetration of distributed generation. Moreover, distributed generation also have the potential of being “islanded” from the main grid, where they are disconnected from the grid yet continues to generate into a local area. This can pose significant safety and operational risks. To mitigate this will require advances in distribution system analytics (e.g. simulation software), infrastructure upgrades, adaptive protection devices and control schemes. Utilities will likely have to take a phased approach towards a high penetration of DG as solutions are made available and they gain experience into understanding the operation of a fully decentralized network. Research through

Connecting the Smart Grid: Strategic Deployment of Toronto’s Electricity Network of the Future 22
partnerships with universities and national labs will also drive advances in the knowledge base. Combining distributed generation, storage, and design and operational advancements, we have an intelligent distributed grid – a decentralized, efficient, clean, network that accommodates a large variety of energy generation and storage options. Advanced Communications In order for smart grid to become a network of intelligence, communication systems must be present to serve as the “glue” to connect all sources of intelligence together. In society, communications are critical to exchange ideas, build relationships, and empower actions. This has proven to be true from the phenomenal success of the Internet, where billions of people are interconnected in a fast, secure, and reliable network. Communications will serve a similar purpose for an integrated operation of the smart grid. The characteristics of a communications network has been outlined in the previous section – open standards, interoperable, two‐way, high bandwidth, and low latency networks. To make it all work together, devices have to be plug‐and‐play to simplify process. This is enabled by standardization. It is recognized that viable plug‐and‐play of devices, applications, etc., will require a significant effort, and openness and interoperability are key to achieving it. Many network solutions are available, such as radio, microwave, satellite, fibre optics, cable, power line carrier/broadband over power line, telephone lines, cellular, and much more to come. However, experience tells us that there is not one, single medium that will cover all forms of communications. There are pros and cons to each, and suitable for various operations in the network. Even the Internet is connected through a vast array of communications technologies and topologies. The future will likely be a hybrid of various solutions, each implemented in its most suitable area. The key is interoperability amongst the various technologies and systems.
Intelligent Processes and Applications The smart grid will consist of both decentralized and centralized processing. While intelligent components and advanced power flow control are supported by distributed intelligence throughout the grid, network and customer data will likely be backhauled to the distribution utility, where centralized processes and applications will translate them into information, knowledge, and actions.
Connecting the Smart Grid: Strategic Deployment of Toronto’s Electricity Network of the Future 23
Process and applications are what converts from a “smart distribution grid” into a “smart utility”. They include:
• Robust business processes in planning, design, operation, and construction. Processes will govern the success of data detection, collection, transmission, analysis, and interpretation for decision making and deriving actions.
• Back office applications, such as customer information systems (CIS), outage management systems (OMS), distribution management systems (DMS), geographical information systems (GIS), enterprise resource planning (ERP), meter data management (MDM), and many more.
• Integration layers to connect back office applications, such as business intelligence (BI), enterprise data warehouse (EDW), service oriented architecture (SOA), and enterprise service busses (ESB).
• “Defence in depth” (DOD) security built into every process and application, coordinating with security mechanisms throughout the field and at the customer’s premise, architected and implemented from the enterprise level.
2.3 TORONTO HYDRO’S INVOLVEMENT IN THE SMART GRID
Toronto Hydro has excelled and demonstrated leadership in developing a firm foundation for the smart grid. It has an extensive portfolio of smart grid building blocks, as illustrated in Figure 2. Toronto’s smart grid will expand from this extensive portfolio of building blocks. While individual building blocks will continue to develop and mature, integration and security efforts have already begun. The smart grid will continue to discover new potentials of integrating systems and services for added benefits.
Figure 2: Toronto Hydro’s current Smart Grid portfolio
Business Intelligence(BI)
Distribution Automation
Customer/Field Communication Office
Distribution Transformer Monitoring
TOU Data Presentment Website
Service Oriented Architecture (SOA)
AdvancedAsset Management
Smart Meters
Distributed Generation
PeakSaver
PowerShift
Mobile Computing
Conservation Programs
Advanced Metering Infrastructure (AMI)
WAN
SCADAOMS/DMS
GIS
CIS
ERP
INTEGRATION
Operational Data Store (ODS)
SECURITY
Connecting the Smart Grid: Strategic Deployment of Toronto’s Electricity Network of the Future 24
Table 3 highlights several key initiatives that Toronto Hydro has undertaken that establish a firm foundation for the development of a smart grid.
TABLE 3: HIGHLIGHTS FROM TORONTO HYDRO’S SMART GRID PORTFOLIO
Building Block Function Highlights
Advanced Metering Infrastructure (AMI)
Network of sensors at every customer point. Utilities can gain unprecedented understanding of what the customer is experiencing.
• Over 567,000 installed, 80% done • Reading over 402,000 meters daily • By 2010 all customers will have a smart meter
Customer Web Portal
Web interface with the customer for providing information and services.
• Information to customers enables conservation and cost savings.
• Allows customers to compare their bill under fixed prices and TOU rates.
• A computerized “BOT” interacts with the customer in different ways.
• Web self‐servicing strategy
Conservation and Demand Management (CDM)
Reduce energy use and free up congestion in the infrastructure. “Negawatts” instead of megawatts.
• 1,150,000 compact florescent lamps distributed since initiation. 77,620 more to be distributed in 2009.
• 26,446 inefficient room air conditions retired. 4,000 more to be retired in 2009.
• Over 48,000 peaksavers, equating to 50MW of dispatchable load.
• 326 PowerShift customers combine peaksaver with TOU
• Summer Savings provides 10% credit reward for 140,000 residential and commercial customers who reduce their electricity usage more than 10%. 88,000MWh and 83MW reduced in 2007.
• Business Incentive Program (BIP) provides incentive for businesses to install energy efficient equipment.
Distributed Generation
Enable cleaner forms of electricity generation, and generating close to the load for reducing losses.
• Over 89MW of distributed generation • Studies of the integration of DG into Toronto Hydro’s
electric system
Distribution Automation
Providing visibility and control throughout the system.
• Over 400 intelligent switches, “self‐healing” ready for automatic fault detection, isolation, and restoration.
• Transformer smart meter pilot monitors the loads on transformers. Enables loss detection and better management of transformer assets.
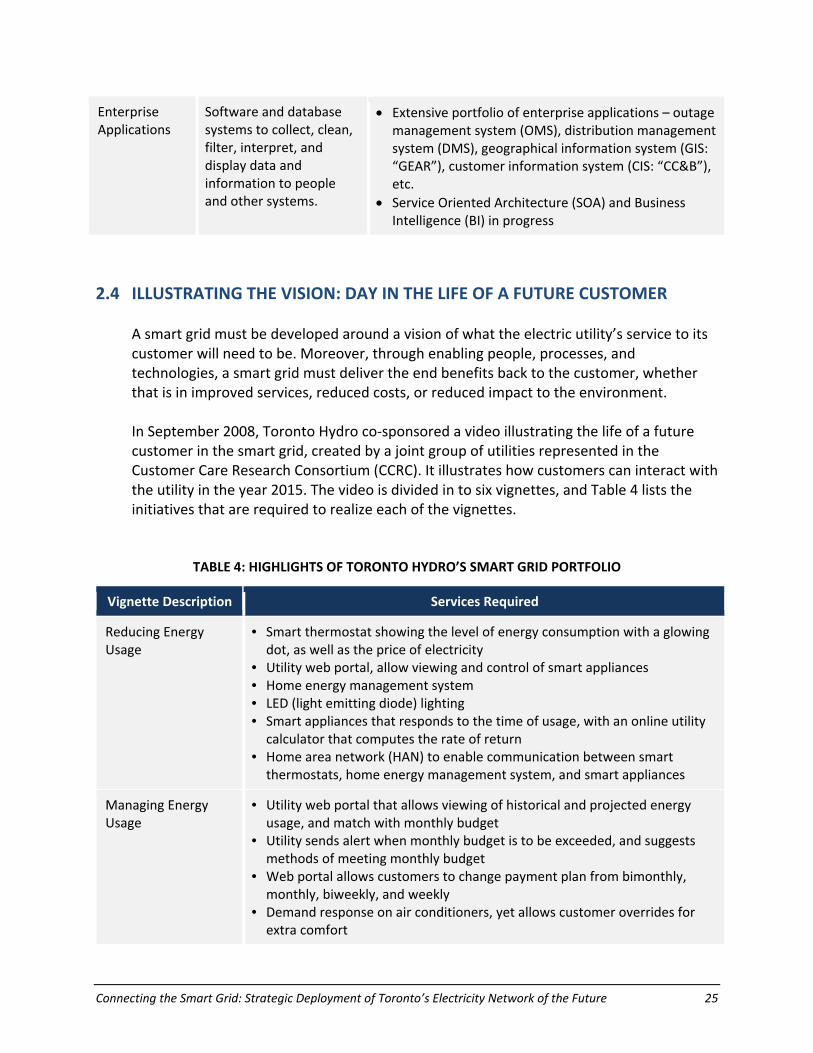
Connecting the Smart Grid: Strategic Deployment of Toronto’s Electricity Network of the Future 25
Enterprise Applications
Software and database systems to collect, clean, filter, interpret, and display data and information to people and other systems.
• Extensive portfolio of enterprise applications – outage management system (OMS), distribution management system (DMS), geographical information system (GIS: “GEAR”), customer information system (CIS: “CC&B”), etc.
• Service Oriented Architecture (SOA) and Business Intelligence (BI) in progress
2.4 ILLUSTRATING THE VISION: DAY IN THE LIFE OF A FUTURE CUSTOMER
A smart grid must be developed around a vision of what the electric utility’s service to its customer will need to be. Moreover, through enabling people, processes, and technologies, a smart grid must deliver the end benefits back to the customer, whether that is in improved services, reduced costs, or reduced impact to the environment. In September 2008, Toronto Hydro co‐sponsored a video illustrating the life of a future customer in the smart grid, created by a joint group of utilities represented in the Customer Care Research Consortium (CCRC). It illustrates how customers can interact with the utility in the year 2015. The video is divided in to six vignettes, and Table 4 lists the initiatives that are required to realize each of the vignettes.
TABLE 4: HIGHLIGHTS OF TORONTO HYDRO’S SMART GRID PORTFOLIO
Vignette Description Services Required
Reducing Energy Usage
• Smart thermostat showing the level of energy consumption with a glowing dot, as well as the price of electricity
• Utility web portal, allow viewing and control of smart appliances • Home energy management system • LED (light emitting diode) lighting • Smart appliances that responds to the time of usage, with an online utility calculator that computes the rate of return
• Home area network (HAN) to enable communication between smart thermostats, home energy management system, and smart appliances
Managing Energy Usage
• Utility web portal that allows viewing of historical and projected energy usage, and match with monthly budget
• Utility sends alert when monthly budget is to be exceeded, and suggests methods of meeting monthly budget
• Web portal allows customers to change payment plan from bimonthly, monthly, biweekly, and weekly
• Demand response on air conditioners, yet allows customer overrides for extra comfort
Connecting the Smart Grid: Strategic Deployment of Toronto’s Electricity Network of the Future 26
• Online customer service representative
Technology and Self Generation
• Plug‐in hybrid vehicle charging dock in the garage • Solar panels on roof, export power into the grid. The customer can choose to donate a certain portion of its energy output to a nearby senior’s home
• Energy management system on computer • An orb that changes color according to the energy consumed/supplied. Red indicates net consumption, green indicates net generation
• Customized billing reports
New Customer Connection
• Smart appliances • Home area network that communicates with the utility network • Master controller for control of smart appliances, and serves as communications portal with the utility
• Configuration of the smart home through asking simple questions to the customer
• Option to purchase power from green generation sources • Option for utility to optimize usage of certain appliances to minimize energy bill or to environmental impact
Providing Financial Assistance
• Energy forecasts and matching with monthly budget, to avoid unexpected costs on the customer’s bill at the end of the month
• A gaming console that also serves as a home energy management system, with a rebate available from the utility
• Online tutorial on how to use her new gaming console/home energy management system
• Financial service agents
Responding to a Power Outage
• Utility representative notifies the customer on the customer’s mobile device on the outage, what’s happening behind the scene, and how long the outage will last
• Self‐healing smart grid pinpoints the outage, and reroutes electricity back to customers
• Utility program enables customer to gain information on the outage status of other family members as well

Connecting the Smart Grid: Strategic Deployment of Toronto’s Electricity Network of the Future 27
What is the Customer’s Vision of the Future Utility? In December 2008, the Customer Care Research Consortium conducted two focused group research projects in the Washington DC area, to understand their expectations of the future utility and study their responses to this smart grid video. When participants were asked about their expectations of the electric utility in the year 2015, their general responses include:
• More renewable energies. Solar and wind should be prevalent and cheaper • Smarter infrastructure, in terms of smart meters, in‐home smart appliances, and
more efficient grids • Rates must be reasonable • Intelligent communications via text message, email, etc. • Online tools to manage energy usage • Rewards for conserving
Following this, the smart grid video was shown to the focused groups to assess their responses. Though they value the specific services shown such as in‐home displays and outage notification, they were expecting the utility to have offered these services by now, as the technologies are already readily available and commonly used in other industries. They also demonstrated an overall scepticism and cynicism towards the costs of implementation and the utility’s ability to deliver this vision. Introducing behavioural science into the focus group research, psychologist and social research scientist John Marshall Roberts then applied an established value‐based framework, based on the works of psychologist Claire W. Graves, to understand the customers’ responses. It was found that though the customers share the same vision of the future as the utility, the services and communication messages from their electricity providers must relate to the core values of its customers, such as reliability, cost, transparency, financial aid to the poor, and environmental impact. By understanding its customer demographics, thus their values, the utility will be able to provide solutions, direct messages, and empower action to realize this common vision of the future.
Connecting the Smart Grid: Strategic Deployment of Toronto’s Electricity Network of the Future 28
3 THE CASE FOR CHANGE
The vision of smart grid is based on the realities that the electricity industry is facing today. Utilities must respond to these realities to continue providing its services for its customers, the society, and the environment. At a high level, the smart grid focuses on an integration of current strategies to fulfill environmental plans, address energy security concerns, and meet customer expectations. The message is very clear: it is a time of change.
3.1 DRIVERS FOR CHANGE The Ontario Green Energy Act (GEA) Around the world, policymakers are responding to environmental changes with new energy policies and legislation. The Green Energy and Green Economy Act (short titled “Green Energy Act”) was introduced into legislation as Bill 150 in February of 2009. This is part of Ontario’s plan to become a leader in renewable energy and green economy in North America. Once passed, it would:
• “Spark growths in clean and renewable sources of energy such as wind, solar, hydro, biomass, and biogas in Ontario
• Create the potential for savings and better managed household energy expenditures through a series of conservation measures
• Create 50,000 jobs for Ontarians in its first three years”4
Highlights of the act as it relates to the role of the distribution company include:
• Definitions for “smart grid” and “renewable energy source” • Obligation for transmitters and distributors to provide priority connection access
to their systems, for renewable energy generation facilities that meet technical, economic and other regulatory requirements
4 http://www.mei.gov.on.ca/english/energy/gea/
“There exists today a global race to establish the policies, attract the investment and build the foundation for the green economy that is sure to sustain future prosperity and progress. It is a race Ontario is determined to win. This proposed legislation would help Ontario become the preferred destination for green jobs, green investment and green energy.” “Our ambition is to increase the standards of living and quality of life for all Ontario’s families. That is best achieved by creating the conditions for green economic growth.”
George Smitherman, Deputy Premier and Minister of Energy and Infrastructure
Connecting the Smart Grid: Strategic Deployment of Toronto’s Electricity Network of the Future 29
• Feed‐in tariff program that guarantees specific rates for energy generated from renewable energy sources
• One‐stop streamlined approvals process, providing service guarantees for renewable projects
• Provide municipalities with the ability to generate up to 10 megawatts of electricity
• Creation of a renewable energy co‐operative, restricted to generating and selling electricity from renewable energy sources
• Streamlining of municipal approvals for renewable energy generation facilities, including the elimination of any requirement to comply with a municipal official plan or zoning by‐law
• Permit a distributor to own a renewable energy generation facility that does not exceed 10 megawatts (or such other capacity prescribed by regulations), a generation facility that uses technology that produced power and thermal energy from a single source, or an energy storage facility
• Local Distribution Companies (LDCs) will be required to prepare plans and seek the Board’s approval for the expansion or reinforcement of its distribution system for the connection of renewable energy generation facilities and for the development and implementation of the smart grid
• Amendments to the Ontario Energy Board Act, 1998, requiring the Board to take steps as specified in relation to the “establishment, implementation promotion” of a smart grid
The Green Energy Act has the potential of creating the single largest transformation of the electric industry since it was first constructed. To respond to this call for action, a smart grid must be created, overlaying the power delivery infrastructure with a high speed, two way, robust, and secure information, communications, and intelligence network. The customers will further have to be empowered with information and tools to participate in conservation and renewable energy initiatives.
“In 1999, the German government made available low‐interest loans for renewable electricity generation equipment. The following year, they put in place the Renewable Energy Sources Act (EEG), which allowed homeowners and farmers to connect their power systems to the grid and provided them a fair price for their surplus electricity. While this created some additional interest, an amendment to the EEG in 2004 boosted power sell‐back prices by 25 percent, causing investment to skyrocket. Between 1999 and 2003, the number of residential installations of photovoltaic power systems grew steadily at a CAGR of 88 percent, but in 2004, installations shot up by 233 percent. In 2006, Germans invested more than US$10 billion in new sources of renewable energy, setting a world record. Germany now operates more wind‐powered generation, more solar systems and more biogas plants than any other nation worldwide.” IBM Global Business Services, Plugging in the Consumer
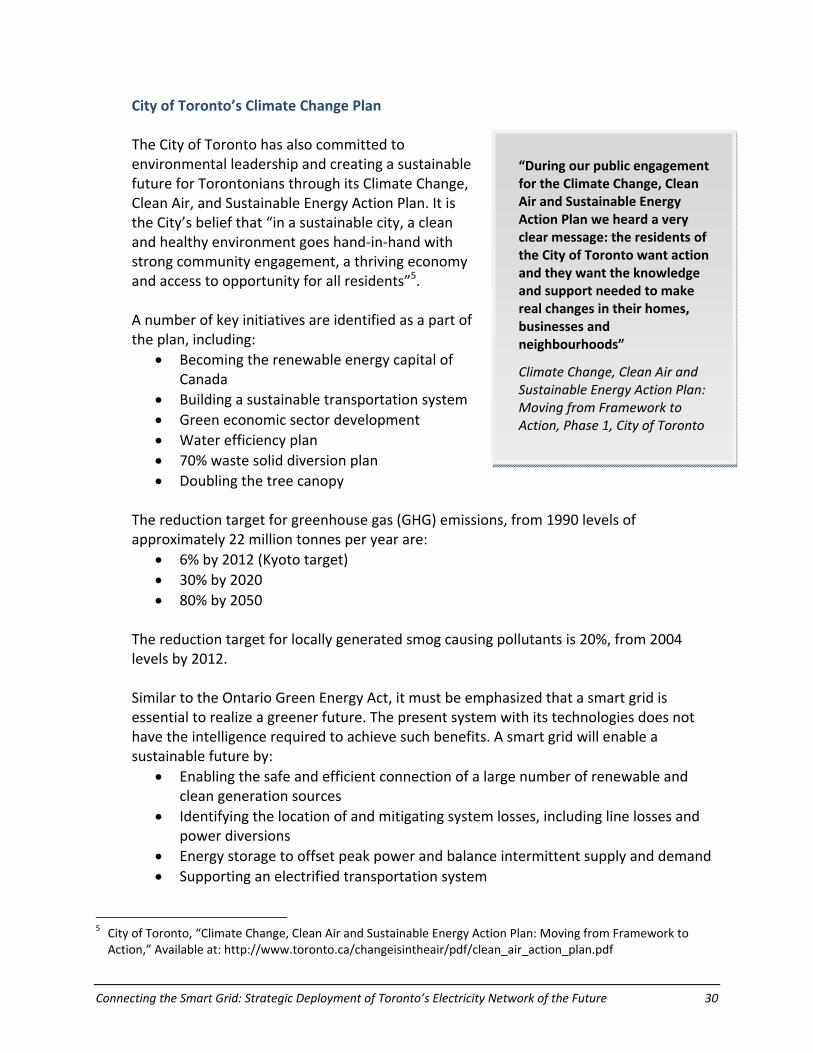
Connecting the Smart Grid: Strategic Deployment of Toronto’s Electricity Network of the Future 30
City of Toronto’s Climate Change Plan The City of Toronto has also committed to environmental leadership and creating a sustainable future for Torontonians through its Climate Change, Clean Air, and Sustainable Energy Action Plan. It is the City’s belief that “in a sustainable city, a clean and healthy environment goes hand‐in‐hand with strong community engagement, a thriving economy and access to opportunity for all residents”5. A number of key initiatives are identified as a part of the plan, including:
• Becoming the renewable energy capital of Canada
• Building a sustainable transportation system • Green economic sector development • Water efficiency plan • 70% waste solid diversion plan • Doubling the tree canopy
The reduction target for greenhouse gas (GHG) emissions, from 1990 levels of approximately 22 million tonnes per year are:
• 6% by 2012 (Kyoto target) • 30% by 2020 • 80% by 2050
The reduction target for locally generated smog causing pollutants is 20%, from 2004 levels by 2012. Similar to the Ontario Green Energy Act, it must be emphasized that a smart grid is essential to realize a greener future. The present system with its technologies does not have the intelligence required to achieve such benefits. A smart grid will enable a sustainable future by:
• Enabling the safe and efficient connection of a large number of renewable and clean generation sources
• Identifying the location of and mitigating system losses, including line losses and power diversions
• Energy storage to offset peak power and balance intermittent supply and demand • Supporting an electrified transportation system
5 City of Toronto, “Climate Change, Clean Air and Sustainable Energy Action Plan: Moving from Framework to Action,” Available at: http://www.toronto.ca/changeisintheair/pdf/clean_air_action_plan.pdf
“During our public engagement for the Climate Change, Clean Air and Sustainable Energy Action Plan we heard a very clear message: the residents of the City of Toronto want action and they want the knowledge and support needed to make real changes in their homes, businesses and neighbourhoods”
Climate Change, Clean Air and Sustainable Energy Action Plan: Moving from Framework to Action, Phase 1, City of Toronto

Connecting the Smart Grid: Strategic Deployment of Toronto’s Electricity Network of the Future 31
• Providing customers with the information and tools to manage and conserve electricity
Electrification of Transportation The electrification of transportation represents one of the greatest shifts in the transportation industry following the invention of the internal combustion engine. Governments and customers are looking upon a new generation of plug in electric/hybrid electric vehicles as the solution to reduce dependency on foreign oil, reduce impact to the environment and provide economic stimulus. According to the US Department of Energy, it is estimated that US power plants may meet the power requirements of 73% of the nation’s light vehicles if they were replaced by plug‐ins charging at off‐peak times. This means a reduction of oil consumption by 6.2 million barrels per day and the elimination of 52% current imports6. Nevertheless, transitioning to a “plugged in” electric transportation infrastructure presents a vast challenge for both the electricity and automobile industries. Challenges include:
• Need for a standardize plug for charging • Metering and standardized communications required for cross‐geographical billing • Impacts to system power quality as vehicles charge or export back to the grid • Stress to the grid as vehicles charge during non‐peak hours • Challenges in predicting demand
Intelligence is essential for the grid to accommodate a high penetration of electrified vehicles:
• Smart chargers and enhanced battery storage, with two‐way communications between to vehicle and the grid for sensing pricing and other signals
• Utility systems to coordinate variable supply and demand • Power quality conditioners to enable a large penetration of plugged in vehicles • Potential for utilizing vehicle’s storage devices to export power back into the grid
(“vehicle‐to‐grid”, or V2G), especially during critical peak periods In addition to the automobile industry, other areas of the transportation section are also becoming increasingly electrified. With the TransitCity plan, the Toronto Transit Commission (TTC) is determined to expand its light rail:
The Toronto Transit City Light Rail Plan is an exciting initiative that will revolutionize transit and transportation across Toronto. Its far‐reaching lines will revitalize neighbourhoods, spur economic growth and clean the air we breathe.
6 US Department of Energy, “The Smart Grid: An Introduction,” Available at: http://www.oe.energy.gov/DocumentsandMedia/DOE_SG_Book_Single_Pages.pdf
Connecting the Smart Grid: Strategic Deployment of Toronto’s Electricity Network of the Future 32
Seven new Light Rail Transit (LRT) lines will bring reliable, fast, quiet and comfortable transit service to many Toronto neighbourhoods. Transit City has been strongly endorsed by the TTC, the City of Toronto, and Metrolinx, the regional transportation agency. The Province of Ontario has announced funding for the construction of the lines and they are incorporated into the Regional Transportation Plan recently proposed by Metrolinx.7
Furthermore, the Government of Ontario has announced the Move2020 plan in June 2007, committing to launch a $17.5 billion rapid transit action plan for the Greater Toronto Area and Hamilton, tackling gridlock, creating 175,000 jobs, and strengthening the economy. In this plan, the government recommended building 902 kilometres of new and improved rapid transit, as well as electrifying the GO Lakeshore line.8 Such vast electrification of public transit will imply further congestion of the electric infrastructure, demanding generation, transmission and distribution upgrades. Intelligence in the system is needed to provide effective execution of infrastructure upgrades and management of assets, and to maintain a reliable electric network. To reduce the need for long distance electricity transmission and distribution, providing generation close to demand through a distributed generation architecture will ensure that losses and environmental impact are kept to a minimum when transportation switches from fossil‐fuel to electricity as a fuel. Energy Security Constructed predominantly in the early to mid 1900’s, the electric power system has been recognized as one of the most significant engineering developments of the 20th century. But this complex infrastructure is old and continues to age at a fast pace. Significant portions of the distribution system have reached advanced deterioration and end of life stages, and it is becoming increasing difficult to keep up with the needs for capital investment. An aging infrastructure represents higher operational and maintenance costs and more importantly, lower reliability and power quality. Moreover, the increased number of major blackouts the industry has begun to raise attention on electric infrastructure investments. Toronto is a growing city with a growing demand for electricity. As the demands on electricity grow it stresses on the capacity of grid elements and increases risks with decreased operating margins and reduced contingencies. Siting new equipment is also extremely difficult as overhead and underground land uses are nearly at full occupancy. There is an urgent need to enable customer participation in conservation and time of use
7 http://www3.ttc.ca/About_the_TTC/Projects_and_initiatives/Transit_city/index.jsp 8 http://www.premier.gov.on.ca/news/Product.asp?ProductID=1383

Connecting the Smart Grid: Strategic Deployment of Toronto’s Electricity Network of the Future 33
efforts, to offset or delay the need to build and site new infrastructure, while the utility optimizes the distribution of electricity and use of the assets. The price of electricity is influenced by supply and demand. However, once electricity is generated it must be consumed, as the system is limited in its ability to store excess capacity . Hence generation, transmission and distribution capacities have to be scaled to accommodate the highest demand, and a significant portion of system capacities are merely utilized in a few days of the year. While the customer pays fixed electricity rates, the true costs of electricity in the market has become very volatile as consumptions are not well controlled. The traditional vertically integrated electric system is further not designed for efficient operation, especially during peak periods. Significant line losses and lack of detection of power diversions imply that a large majority of energy generated is wasted and never delivered to the end customer. If the grid were just 5% more efficient, the energy savings would equate to permanently eliminating the fuel and greenhouse gas emissions from 53 million cars9. In addition to high losses, the use of spinning reserves to meet peak demands implies further impact to the environment. Moreover, with the advent of the digital and connected era, the grid is becoming more susceptible to cyber security risks. The installation of large numbers of communicating devices also increases the number of access points and thus making the grid more vulnerable. The threat of terrorism, copper theft, and vandalism present a further risk for the grid. Reduction of system vulnerability and prompt identification of threats is essential. In addition to infrastructure challenges, the electricity sector is facing high retirement rates, exposing the organization to significant risks in this time of change in renewing and upgrading the infrastructure. It is expected that the industry will need to incur additional expenditures to replace and train skilled workforces, requiring both specialists in traditional and new fields, as well as generalists with diverse skills sets. Currently it requires approximately five years to train trades employees on the job. These risks, including aging infrastructure, congestion, price volatility, system losses, security risks, and need for workforce renewal compound to create a future of uncertainty. This results in high unknowns for the future including future investment requirements. Nevertheless, as Peter Drucker writes, “the best way to predict the future is to create it”. With strategic investments, embedding intelligence into the system, pursing new technologies such as energy storage, empowering customers for energy management and more, the future can become more certain, and utilities will be able to mitigate the risks associated with this changing industry.
9 US Department of Energy, “The Smart Grid: An Introduction,” Available at: http://www.oe.energy.gov/DocumentsandMedia/DOE_SG_Book_Single_Pages.pdf

Connecting the Smart Grid: Strategic Deployment of Toronto’s Electricity Network of the Future 34
Customer Expectations in a Digital Era The expectations of customers have changed dramatically in the digital era. Customers now recognize community values and environmental actions on par with traditional values like customer service and reliability. It is well understood that environmental problems are highly associated with energy problems. Customers want to be more aware of their environment footprint in both their electricity and transportation uses. They are interested in renewable energy options and more familiar with the environmental practices of energy providers. The customer of today wants to have a more active role on how to control their electricity use to mitigate environmental damage. Corporations outside the utility industry are also very aware of their environmental impact and implementing measures to reduce their footprint. This is reflected in the recent applications of corporate responsibility reports and will be accelerated once a carbon cap and trade system is in place. In times of rising energy costs, there is further a high motivation for conservation and consumption management through greater awareness and better technologies. For examples, consumers will choose to use power at off‐peak times and be rewarded for it with a lower rate. They will be able to find out hour by hour the units of power they’ve used, what they cost, and how to use less without compromising their quality of life. The coming of the digital age has further influenced consumers’ views, behaviours and expectations. In light of these changes utilities will need a radical shift. Today, the electricity system is primarily a vehicle for moving electricity from the generation source to the costumer. In order to respond to new customer demands utilities should engage a new era of technology and telecommunications. As described in Section 2.2, the vision is to move towards a participatory network, with the utilities and customers sharing responsibilities and benefits, to achieve core objectives such as maintaining quality of life, reducing costs, and minimizing environmental impact. Utilities must be prepared to adapt to these new trends and provide new services. The challenge is to connect its operations with customer experience. The smart grid will allow end‐users of electricity to ensure their involvement in deciding how and when they use energy. With the application of new technologies the grid will enable two‐way flows of electricity and information, empowering them with control to make informed energy choices to benefit them, the infrastructure, and the environment.
Connecting the Smart Grid: Strategic Deployment of Toronto’s Electricity Network of the Future 35
3.2 THE VALUE PROPOSITION
Toronto Hydro’s smart grid is the plug that connects environmentally mindful consumers to the grid in a digital era
The smart grid is an essential component to carry the traditional electric infrastructure in the direction that society would like to go in the 21st century. This section explores the benefits and challenges that the smart grid will bring. Customer Benefits The smart grid connects consumers to the grid not only to improve the customer experience but also to excel their participation in the grid:
• Access to timely information to make informed decisions on their energy use, such as interval usage data, price, fuel mix, carbon footprint, and utility offers. Enables awareness of energy use and its relation to carbon footprint.
• Greater control through tools and devices to conserve electricity and reduce costs, such as energy efficient appliances, high efficiency lighting, promotional pricing models, home automation, demand response units, energy audits, and insulation upgrades. Automation and configuration allow customers to set preferences according to their lifestyles.
• Manage their electricity usage with an energy budget dashboard, including historical usage, projections, as well as alerts and alarms to notify excessive usage.
• New modes of communication such as in‐home energy displays, web portals, smart thermostats, email, media players, mobile phones, and online call centre.
• Provide better experience with the utility, such as through self servicing models which enable customers to manage their accounts online.
• Set preferences over their billing, such as information displayed, billing cycles, or prepaid plans.
• Improvements in grid reliability and power quality through monitoring and controls.
• Receive outage notifications from the utility, cause of outage, immediate actions, time to restoration, tips on what to do, and restoration notification.
• Opportunities to generate and sell electricity back into the grid. • Mechanisms to contribute towards the environment, such as signals and programs
to limit the use of coal generation, decide on a preferred fuel mix, and renewable self generation.
• Support the connection and billing management of full electric or plug‐in hybrid electric vehicles.
Connecting the Smart Grid: Strategic Deployment of Toronto’s Electricity Network of the Future 36
Social and Economic Benefits The smart grid supports social and economic growth by:
• Job creation through the design, construction, operation, and support of a renewed infrastructure. For example, the Green Energy Act forecasts the creation of 50,000 high paying jobs in Ontario in the first three years, while Ontario’s Move2020 plan estimates a further 175,000 jobs in the expansion of the transportation infrastructure, largely supported by the electric system.
• Stir economical growth through global investments, ensuring security of supply, job creation, and increasing competitiveness by enabling the national economy to lead in the development of renewal energy solutions.
• Opportunities for the enhanced coordination of utilities and efficiencies in the development of shared services, such as in public telecommunications bandwidth.
• Increase in public safety and quality of life by investing in an aging infrastructure, supporting safe operation of distributed generation, and creating an environmentally sustainable future.
• Promoting cleaner air, better water, and fewer wastes for generations to come, such as through the use of renewable energies, conservation, and electric vehicles.
• Reduce dependence on oil and encourage the use of alternative fuels. • Commercialization of energy efficiency, renewable energies, and electric vehicles
will bring opportunities for increased economic activities. • Relieving gridlock through expansion of electrified public transit systems.
Environmental Benefits The smart grid can deliver and realize enormous environmental benefits:
• Promote use of energy generation and conservation for residential and commercial buildings will contribute to the reduction of the carbon footprint as well as the reduction in costs and energy consumption.
• Reduction in the generation of CO2 and pollutants into the environment with the displacement of centralized plants with distributed generation, offering cleaner and renewable fuel sources and minimizing line loss. Peak demand reduction and energy storage also reduce the need for peaking power plants and spinning reserves.
• Design and construction of buildings will meet environmental regulations as well as include technological breakthroughs for energy renewal and conservation.
• Having alternative renewable sources of electricity like solar, wind and geothermal will lessen the necessity for power generation plants of the 21st century and therefore, reducing environmental impact and the risks associated with global warming.

Connecting the Smart Grid: Strategic Deployment of Toronto’s Electricity Network of the Future 37
Utility Benefits The smart grid enables utilities to meet the needs and demand of the electric infrastructure:
• Ensure reliability in the generation and distribution of electricity through the use of innovative technologies, such as outage management systems, power quality monitors, and automated switching.
• Provide “digital grade” power quality through monitors, analyzers, and conditioners.
• Ensure security of energy supply through conservation, infrastructure expansions, rerouting of power, loss reduction, and distributed generation.
• Improved equipment monitoring increases asset utilization and reduces operating margins.
• Operational improvements in monitoring, control, and mobile workforce support • Provide intelligence and control capabilities to accommodate a high penetration of
distributed generation and electrified vehicles. • Allow deferral of infrastructure investments through distributed generation,
storage, conservation, and peak demand reduction. • Consideration to physical and cyber security will ensure that the grid is protected
and resilient to attacks. Challenges and Costs of Deployment While the smart grid has significant potential to deliver value, it represents a significant endeavour. Research and development is needed to break through knowledge and technology barriers. Technology solutions will take time to develop, mature, and be ready for commercialization. Communication and engineering standards will need to converge. Building Toronto Hydro’s smart grid will require a framework of intelligence, energy, communications, strategy, legislation, regulation, and stakeholders’ commitment. Business models should have a solid foundation for decision making to ensure ongoing commitment to innovation. A coordinated innovation effort will consist of a solid integration and synchronization of decentralized systems, processes and organizational structure. The workforce will require new competencies, while not drawing resources away in a time of renewal of aging infrastructure. Security measures must be put in place. Business processes, operating procedures, and work protection will have to incorporate the new paradigm of a smart grid. Progressive and timely legislation and regulation will be instrumental towards its success. Disincentives from rates must be removed to recognize the benefits of conservation and energy efficiency, as well as accounting for socioeconomic and environmental factors.

Connecting the Smart Grid: Strategic Deployment of Toronto’s Electricity Network of the Future 38
Customer education and adoption of new technologies will further need to be assisted by retailers and service providers. Utilities will have to approach customers with transparency and address their specific yet evolving needs. The costs and time required, as well as the benefits attained, will depend on the scope and pace of implementation, technology trends, and customer acceptance, and is thus not straightforward to quantify. Costs and benefits are typically shared amongst a wide mix of projects rather than in isolation. Investments are made to account for future requirements, and benefits often extend into socioeconomic and environmental contexts and to improve customer experience. Careful investments and guiding strategies can be utilized to mitigate the risks of initial deployments and ensure that early benefits are attained. Given that investments in the Advanced Metering Infrastructure (AMI) have been mandated by the government, and that some of the building blocks for the smart grid are already in progress and maturing within Toronto Hydro, it is expected that additional costs for smart grid deployment will be incremental spending to accelerate maturing of in‐progress building blocks, implementation of new smart grid solutions, and in integrating various programs/solutions. The Ontario Smart Grid Forum report states that “overcoming these challenges will require innovation, investment, creativity and hard work, but if Ontario is to realize a sustainable future and continue to grow and prosper, the transformation of its electricity infrastructure is essential.” Toronto Hydro is responding to the call for action to create a better future for the environment, customers, and the electricity infrastructure. Considering the solid foundation that has already been developed and the commitment towards this endeavour, Toronto Hydro is determined to thrive in its smart grid deployment.
Connecting the Smart Grid: Strategic Deployment of Toronto’s Electricity Network of the Future 39
4 VISION, MISSION, OBJECTIVES AND STRATEGIC PRINCIPLES
A clear vision of the smart grid has been defined and illustrated. This vision has been grounded upon the central belief that it will provide prosperity and benefits to the people of Toronto, the electric infrastructure, and the environment. Yet a vision must lead to actions. How well the utility navigates through this perfect storm will depend on how it strategically applies its resources, competencies, and capabilities to accomplish its vision, leading to real and tangible results. This chapter will lay the foundation for this voyage, including:
• Vision and mission statements to identify where we must go and what we must do
• Specific objectives to define what we want to achieve • Strategic principles to guide our scope, priorities, and how to achieve our
objectives 4.1 VISION AND MISSION
The vision statement reflects the essence of Toronto Hydro’s goal towards a smart grid and a Smart Utility:
Vision: An intelligent, continually innovative electricity network
This vision illustrates the smart grid as an electricity network with two traits. The first is intelligence, referring to the “smartness” of the grid, including self‐healing, robustness, fast, reliable, and having optimized solutions. The second trait is a continual innovation, defining the smart grid as a paradigm rather than a technology, a direction rather than project. The core of this direction is innovation, where new solutions and methods are strategically applied to the electric system and its services. It’s a continuously advancing utility, keeping up with the needs of its customers and applying new technologies and methods in its solutions. In other words, this vision statement describes the paradigm of smart grid as innovation through applied intelligence. The smart grid mission statement describes the task to accomplish our vision:
Mission: Modernize to deliver value in meeting customer needs and expectations of the 21st century
Connecting the Smart Grid: Strategic Deployment of Toronto’s Electricity Network of the Future 40
Thus the mission is to modernize. This includes modernizing the infrastructure, communications, and even processes, culture, and the services it provides to customers. This modernization is necessary in order to deliver value in the 21st century, including value to our customers, shareholders, staff, and the environment. Modernization is the first step towards innovation.
4.2 OBJECTIVES
The Case for Change in developing the smart grid system has outlined three key drivers for smart grid. It is also through these drivers that our objectives are set. Objective #1: Climate Protection and Sustainable Energy As an energy company, Toronto Hydro has the social responsibility to become an organization that values climate protection and environmental sustainability. This will require a close partnership with our customers, the governments, as well as other agencies and organizations to make this a priority.
In particular, Toronto Hydro can have a substantial contribution meeting the following government targets in the area of climate protection:
City of Toronto’s Climate Change, Clean Air, and Sustainable Energy Action Plan (the Climate Plan) of July 2007
6% greenhouse gas (GHG) and 20% smog reduction by 2012 30% GHG reduction by 2020 80% GHG reduction by 2050
Federal Government’s targets
Kyoto Protocol targets: reduce CO2 emissions by 6% below 1990 levels between 2008‐2012
Upcoming carbon cap and trade system Further targets are expected to be set by the Ontario government as a result of the Green Energy Act. For Toronto Hydro to effectively meet these targets and become environmentally sustainable, we need to achieve the following:
1. Targeted reduction of environmental footprint, working towards a zero carbon, zero waste organization by closely monitoring, tracking, and controlling our environmental footprint and helping our customers manage their environmental footprint

Connecting the Smart Grid: Strategic Deployment of Toronto’s Electricity Network of the Future 41
2. An infrastructure that accommodates a variety and high penetration of distributed generation and storage options.
3. Provide customers with programs and streamlined processes for the connection of renewables, clean generation, and conservation efforts.
4. An infrastructure that supports the reliable connection of microgrids, community energy, and virtual power plants in the Toronto Hydro system.
5. Support an electrified transportation infrastructure, including full and plug‐in electric hybrid vehicles, subway systems, and electric trains.
Objective #2: Energy Security It is the mandate of Toronto Hydro to deliver electricity to our customers that is safe, reliable, and efficient. As the infrastructure ages and approaches the end of its useful life, utilities must sustain the operation of this infrastructure. At the same time, utilities are faced with new expectations from their customers and regulatory environments. To achieve energy security, we need to:
1. Invest prudently in an aging infrastructure to manage risks and to provide high levels of reliability.
2. Provide the visibility and control throughout the network, working towards a self healing and fault anticipatory network, and connect high levels of distributed energy sources.
3. Monitor and manage power quality levels and its impact to customers. 4. Improve the efficiency and effectiveness of utility operations. 5. Incorporate Physical and cyber security measures.
Objective #3: Customer Satisfaction in the 21st Century The smart grid opens up new and exciting opportunities for us to work together with our customers, who value trust, service excellence, transparency, performance, and reasonable rates. Customers also expect “digital grade” power quality and new modes of communication in the 21st century, comparable to the services they receive in the industries such as Telecom and Internet Service Providers. The utility must understand customer expectations, and provide information, tools, options, and controls to meet them. To achieve customer satisfaction in the 21st century, we need to:
1. Provide timely information that empowers actions and improves experience with the utility, such as their environmental footprint, energy consumption management, outage and restoration notifications, costs and cost projections, budget constraints, utility programs.
Connecting the Smart Grid: Strategic Deployment of Toronto’s Electricity Network of the Future 42
2. Offer new forms of communications for customers to have timely access to utility information, such as web services, email notifications, text messages, online chat‐rooms, blogs, and through in‐home devices. Multilingual services are also required.
3. Enable energy management controls such as in‐home displays, smart thermostats, and smart home appliances, with intuitive, user friendly interfaces.
4. Provide new forms of customer service models that suit their preferences, such as on‐line self‐services, voice recognition systems, changing billing payment periods, and prepayment options.
5. Offer advices on conservation and saving costs, reducing carbon footprint. Rewards for conserving. Allows integration of renewable energies and plug‐in hybrid vehicles with simplified processes.
6. Potentially provide incentives and financial support to sustain reduced energy consumption and environmental footprint, especially for low income households.
4.3 STRATEGIC PRINCIPLES
Strategic principles are simple, understandable, actionable statements that reflect an organization’s strategy to achieve a vision. It should empower stakeholders to move towards the smart grid vision. This section presents three strategic principles, developed based on industry needs, utility trends, and the strategic position that the organization decides to adopt to implement a smart grid.
Strategy #1: Harness innovation – throughout the grid This strategy defines the action and breadth of Toronto Hydro’s smart grid. As described in the vision and mission statements, the action for deploying a smart grid is in modernization, by harnessing innovation through applying intelligence in the system – intelligent people, intelligent business processes, and intelligent technologies. Hence, in this strategy smart grid is defined not as a technology portfolio, but a paradigm of innovation, a continuous process of improving through innovating. It is about evolving and keeping abreast of advances in other industries, such as the information technology and telecom industries, and offering comparable services to customers. It is about being a “smart utility”, and offering “smart energy”. This action is to be applied throughout the grid, creating an “end‐to‐end” smart grid. This means that the smart grid will have coverage throughout the electricity network:
• Applying smart grid inside the medium voltage distribution network • Enabling and providing solutions beyond to the meter to assist customers in
conserving, managing energy usage, and incorporating renewable energies

Connecting the Smart Grid: Strategic Deployment of Toronto’s Electricity Network of the Future 43
• Partnering with upstream transmission system and other distribution networks in global optimization
As one of the largest distribution utilities in Canada, and responsible for operating the electricity network in the mega‐urban financial hub of the City of Toronto, Toronto Hydro is committed to develop an end‐to‐end smart grid. Strategy #2: Explore synergies by integrating systems The greatest value from a smart grid is not from the development of independent initiatives, but from the integration of its various technologies and services, and to maximize the use of available data and information. This strategy emphasizes that true innovation arises when synergies between various systems and services are explored. This is a holistic approach to smart grid, by focusing on integrating various building blocks to realize new values and services. The action to realize such synergies comes from the second half of the strategy – integrating systems:
• Between people to work collaboratively • Between strategies and plans for alignment and leverage • Between technologies for enhanced functionalities • Between services for added value
Strategy #3: Develop an Innovation Support Structure
The true strength of this smart grid arises when innovation is accompanied by a support structure. It includes:
• Strategic planning to direct, guide, and focus efforts on constructive innovation, while filtering disruptive ones that don’t show true value
• Business processes alignment and management • Mechanisms to quickly turn trends into actions • Measures to sustain innovation and avoid innovation fatigue • Education and training of resources • Customer, government, and regulatory engagement • Technology support, such as bidirectional communications and power flow
Connecting the Smart Grid: Strategic Deployment of Toronto’s Electricity Network of the Future 44
4.4 ALIGNMENT WITH TORONTO HYDRO’S STRATEGIC BUSINESS PRIORITIES Toronto Hydro has four business pillars. A smart grid will support and strengthen each of these pillars moving forward. These pillars include:
• Provide a safe and healthy work environment • Modernize our utility • Deliver superior customer service • Maintain financial strength
Additionally, it has been the organization’s priority to work closely with the City to help implement its Climate Change, Clean Air, and Sustainable Energy Action Plan (Climate Change Plan). A mapping of each of the smart grid objectives that have a direct relationship to these strategic business priorities are listed in Table 5.
TABLE 5: ALIGNMENT OF SMART GRID OBJECTIVE AREAS WITH STRATEGIC BUSINESS PRIORITIES
Smart Grid Objective Areas Health and Safety
Modernize Our Utility
Customer Satisfaction
Financial Strength
Climate Change
1 Climate Protection and Sustainable Energy
1.1 Zero carbon, zero waste
1.2 Distributed generation and storage
1.3 Streamlined process
1.4 Microgrids, community energy, and virtual power plants
1.5 Electrified transportation
2 Energy Security
2.1 Invest in aging infrastructure
2.2 Manage power quality
2.3 Visibility and control throughout
2.4 Improve utility operations
2.5 Physical and cyber security
3 Customer Satisfaction
3.1 Timely information
3.2 New forms of communication
3.3 Energy controls
3.4 New customer service models
3.5 Advices from utility
3.6 Incentives and financial support
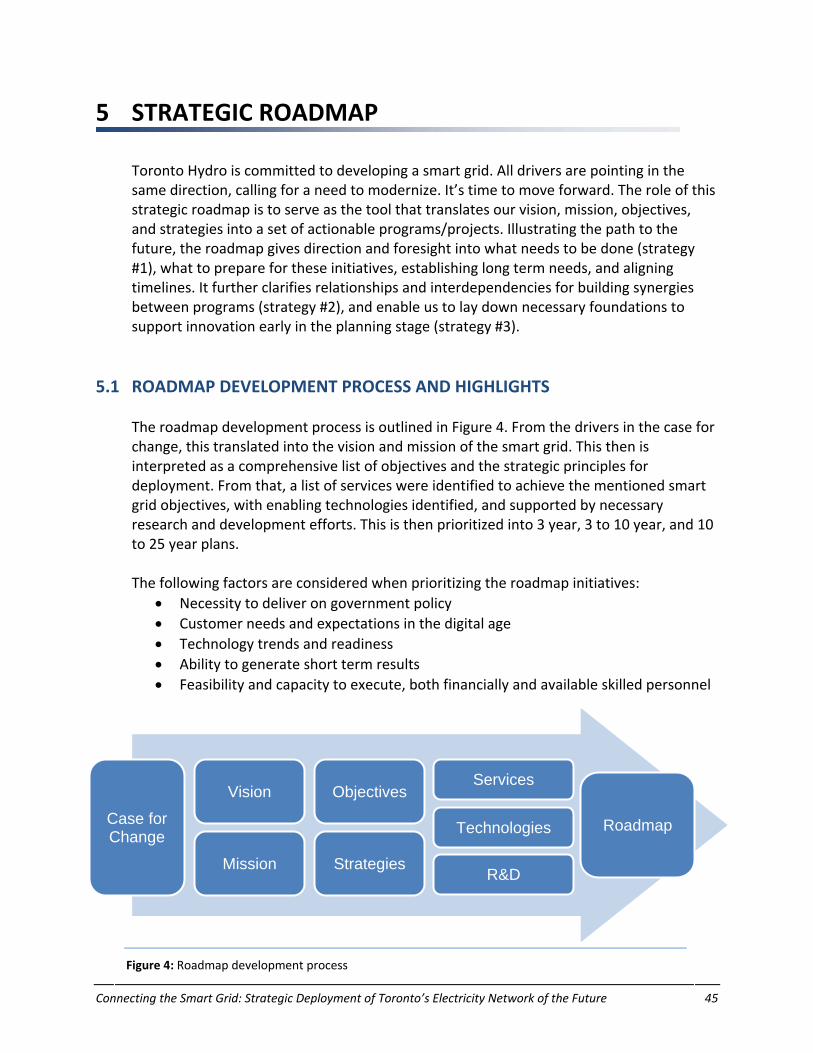
Connecting the Smart Grid: Strategic Deployment of Toronto’s Electricity Network of the Future 45
5 STRATEGIC ROADMAP
Toronto Hydro is committed to developing a smart grid. All drivers are pointing in the same direction, calling for a need to modernize. It’s time to move forward. The role of this strategic roadmap is to serve as the tool that translates our vision, mission, objectives, and strategies into a set of actionable programs/projects. Illustrating the path to the future, the roadmap gives direction and foresight into what needs to be done (strategy #1), what to prepare for these initiatives, establishing long term needs, and aligning timelines. It further clarifies relationships and interdependencies for building synergies between programs (strategy #2), and enable us to lay down necessary foundations to support innovation early in the planning stage (strategy #3).
5.1 ROADMAP DEVELOPMENT PROCESS AND HIGHLIGHTS The roadmap development process is outlined in Figure 4. From the drivers in the case for change, this translated into the vision and mission of the smart grid. This then is interpreted as a comprehensive list of objectives and the strategic principles for deployment. From that, a list of services were identified to achieve the mentioned smart grid objectives, with enabling technologies identified, and supported by necessary research and development efforts. This is then prioritized into 3 year, 3 to 10 year, and 10 to 25 year plans. The following factors are considered when prioritizing the roadmap initiatives:
• Necessity to deliver on government policy • Customer needs and expectations in the digital age • Technology trends and readiness • Ability to generate short term results • Feasibility and capacity to execute, both financially and available skilled personnel
Figure 4: Roadmap development process
Case for Change Technologies Roadmap
Strategies
Services
R&D
Objectives
Mission
Vision

Connecting the Smart Grid: Strategic Deployment of Toronto’s Electricity Network of the Future 46
The following critical assumptions are also made: • Government and regulatory support • Workforce knowledge transfer • Core business is maintained • No disruptive game‐changers
This roadmap can then be used to drill down on the requirements of individual initiatives, through models such as use cases. Moreover, this is intended to be a living roadmap. While it has the potential to bring significant value to the infrastructure, society, and the environment, smart grid is not risk free. Many technologies and standards are still in their early stages of development, and not all will move into commercialization or reach a suitable price point for mass deployment. As seen in the later sections, this proposed roadmap attempts to recognize such risks and incorporate measures to ensure that its promises and value are realized. Nevertheless the roadmap will evolve with lessons learned from the initial stages of deployment, and as needs, technologies, and priorities change over time. What are needed are regular reviews, adequate research, innovative strategies, and mechanisms to quickly turn new trends into actions.
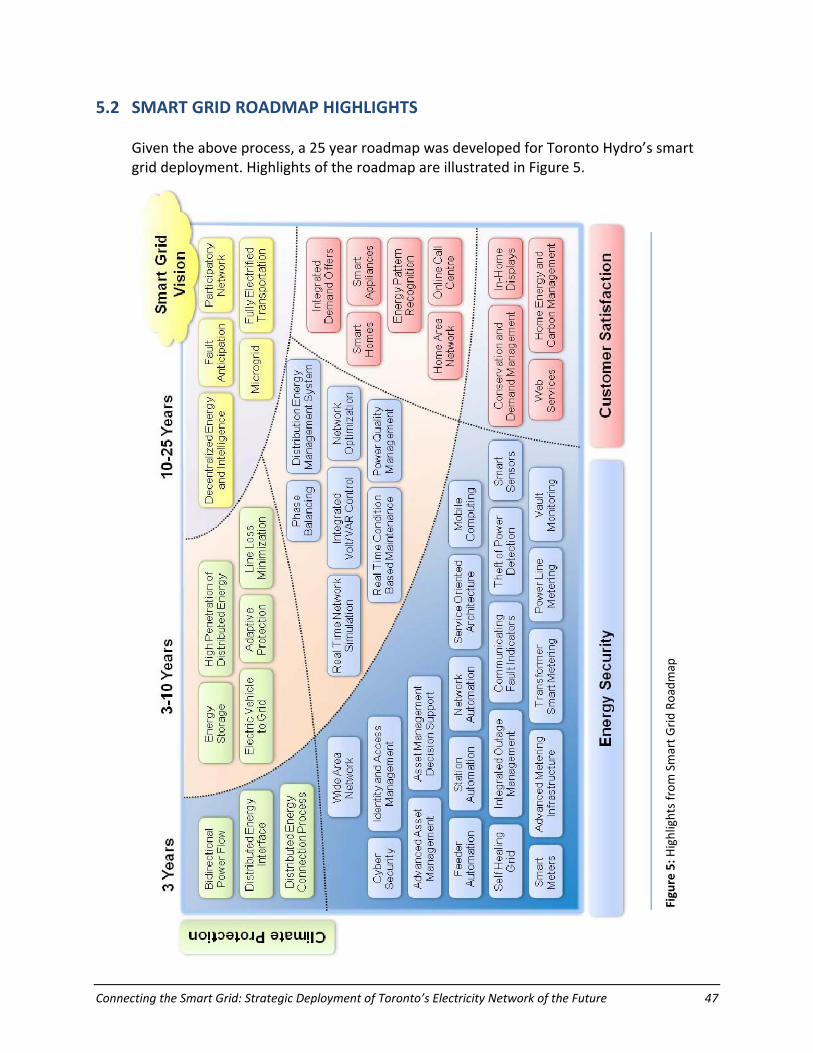
Connecting the Smart Grid: Strategic Deployment of Toronto’s Electricity Network of the Future 47
5.2 SMART GRID ROADMAP HIGHLIGHTS Given the above process, a 25 year roadmap was developed for Toronto Hydro’s smart grid deployment. Highlights of the roadmap are illustrated in Figure 5.
Figure 5: H
ighlights from
Smart G
rid Ro
admap
Connecting the Smart Grid: Strategic Deployment of Toronto’s Electricity Network of the Future 48
5.3 3 YEAR PLAN: DEMONSTRATING TORONTO’S SMART GRID COMMUNITY The first 3 years of the smart grid roadmap is to materialize the smart grid vision and strategy and translate into actions, through the establishment of Toronto’s Smart Community. The Smart Grid Community is a demonstration area where technologies can be tested, processes developed, customer acceptance understood, and operating procedures written. The innovation effort will begin, and all three strategic principles will be used to guide its implementation. Toronto Hydro’s leadership and expertise will be leveraged to:
• Maturing existing smart grid building blocks • Commit to and accelerate planned building blocks • Integrating our building blocks to realize cross‐functional services, shared costs,
and added values Functional strategies such as for communications, distribution equipments, and customer engagements will be developed to guide this effort. Opportunities to attract new workforces and partnerships will also be explored. The size and scale of this demonstration is currently proposed to include 2 substations, 10 feeders, and approximately 25,000 customers. The location of this demonstration area as well as its detailed scope will be determined in a separate detailed plan. However, the following factors will be considered in determining the demonstration area:
• Reliability performance • Feeder proximity • System operational flexibility • Smart grid devices installed • Communications coverage • Customer diversity
Expected benefits will be demonstrated and measured, and used to support potential full scale deployment. The goal is to generate short term wins, and validate the true value of smart grid. Additional opportunities and potentials will also be identified for further piloting. Results and lessons learned will be shared regularly in various forms of communication, such as white papers, presentations, and online content. Initiatives that were selected as a part of this demonstration are characterized by relative certainty and value, typically utilizing established, proven technologies to demonstrate immediate value for the customer, society, and the environment. These projects are typically in progress and maturing at Toronto Hydro, or planned to commence in the next three years. The smart grid community will accelerate their maturity, and explore areas of integration to provide new services.
Connecting the Smart Grid: Strategic Deployment of Toronto’s Electricity Network of the Future 49
For more uncertain initiatives, it is expected that given the pace of industry adoption and effort into advancing smart grid technologies, in 3 years time there will be increased certainty and convergence into technology trends, communication standards, customer responses, and government priorities/regulations. This certainty and understanding of the state and direction of smart grid will enable Toronto Hydro to embark on further demonstrations and larger scale deployments following the 3 years. The following tables describe the services, technologies, and research and development efforts that encompass the 3 year plan. R&D efforts are used to support the services and technologies in this time frame, or to prepare for the 3‐10 year plan.
TABLE 6: 3 YEAR PLAN – SMART GRID SERVICES
Smart Grid Service Service Description
Bidirectional Power Flow Support
Infrastructure will support the two‐way flow of power, such as in terms of generation, load and short circuit capacity, protection and control, stability, and supply/demand balance.
Distributed Energy Interface Support
Support any interface between distributed energy sources and the grid, such as inverter‐based, synchronous, or induction, along with communications and controls.
Distributed Energy Connection Process
Streamline the connection process of distributed energy, including generation and storage, enabling customers to install clean and green energy sources with minimal hassle and in short timing.
System Loss Detection Sensors, communications, and processing to calculate location of system losses (primarily focused on non‐theft losses).
Grid‐Wide Communications
Secure, high bandwidth, low latency, robust, two‐way communications network that can enable all smart grid devices to speak to each other and to back office systems.
Self‐Healing Grid Automatic fault detection, location, sectionalisation, isolation, and restoration to restore as many customers as soon as possible in the event of an outage.
Vault Monitoring Communicating grid sensors that can monitor the condition inside vaults and report back alarms and statuses to the utility.
Theft of Power Detection Devices or programs which can identify locations of power theft. Examples include transformer and customer smart metering, and usage pattern recognition.
Advanced Asset Management
Advanced asset management models to optimize and mitigate risks in an aging yet evolving infrastructure.
Mobile Workforce Support
Supply workforce with mobile computing and information capabilities for effective and efficient work execution.
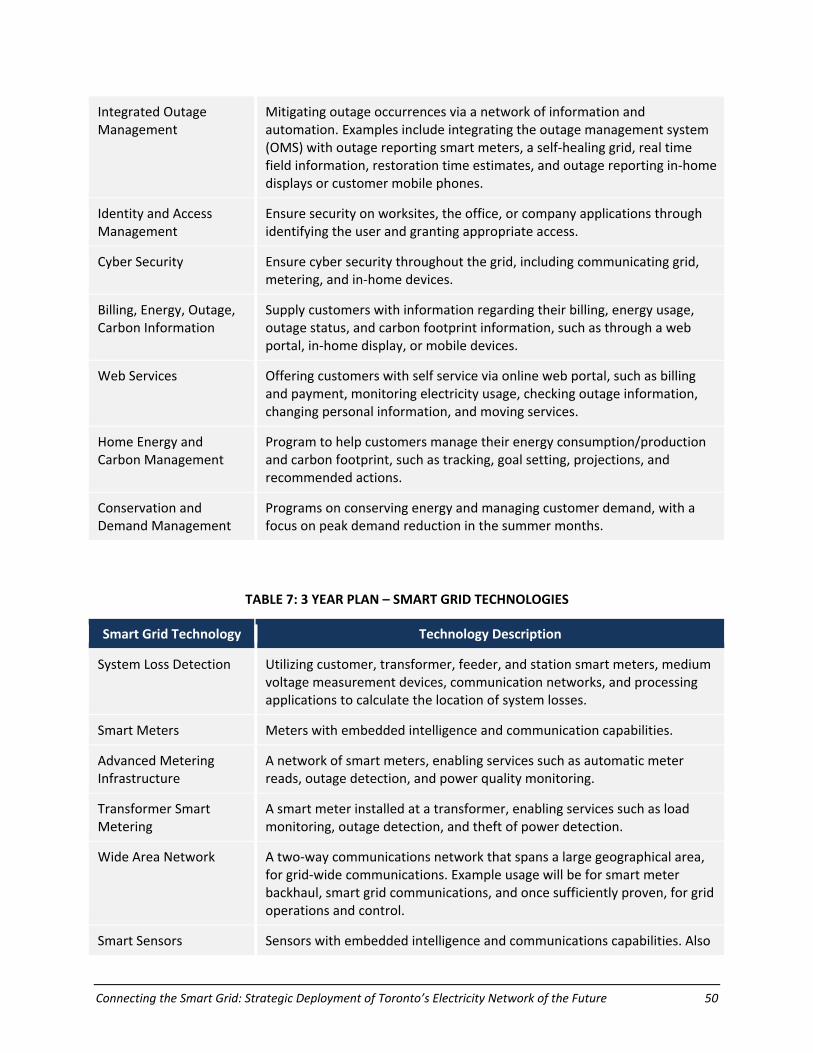
Connecting the Smart Grid: Strategic Deployment of Toronto’s Electricity Network of the Future 50
Integrated Outage Management
Mitigating outage occurrences via a network of information and automation. Examples include integrating the outage management system (OMS) with outage reporting smart meters, a self‐healing grid, real time field information, restoration time estimates, and outage reporting in‐home displays or customer mobile phones.
Identity and Access Management
Ensure security on worksites, the office, or company applications through identifying the user and granting appropriate access.
Cyber Security Ensure cyber security throughout the grid, including communicating grid, metering, and in‐home devices.
Billing, Energy, Outage, Carbon Information
Supply customers with information regarding their billing, energy usage, outage status, and carbon footprint information, such as through a web portal, in‐home display, or mobile devices.
Web Services Offering customers with self service via online web portal, such as billing and payment, monitoring electricity usage, checking outage information, changing personal information, and moving services.
Home Energy and Carbon Management
Program to help customers manage their energy consumption/production and carbon footprint, such as tracking, goal setting, projections, and recommended actions.
Conservation and Demand Management
Programs on conserving energy and managing customer demand, with a focus on peak demand reduction in the summer months.
TABLE 7: 3 YEAR PLAN – SMART GRID TECHNOLOGIES
Smart Grid Technology Technology Description
System Loss Detection Utilizing customer, transformer, feeder, and station smart meters, medium voltage measurement devices, communication networks, and processing applications to calculate the location of system losses.
Smart Meters Meters with embedded intelligence and communication capabilities.
Advanced Metering Infrastructure
A network of smart meters, enabling services such as automatic meter reads, outage detection, and power quality monitoring.
Transformer Smart Metering
A smart meter installed at a transformer, enabling services such as load monitoring, outage detection, and theft of power detection.
Wide Area Network A two‐way communications network that spans a large geographical area, for grid‐wide communications. Example usage will be for smart meter backhaul, smart grid communications, and once sufficiently proven, for grid operations and control.
Smart Sensors Sensors with embedded intelligence and communications capabilities. Also
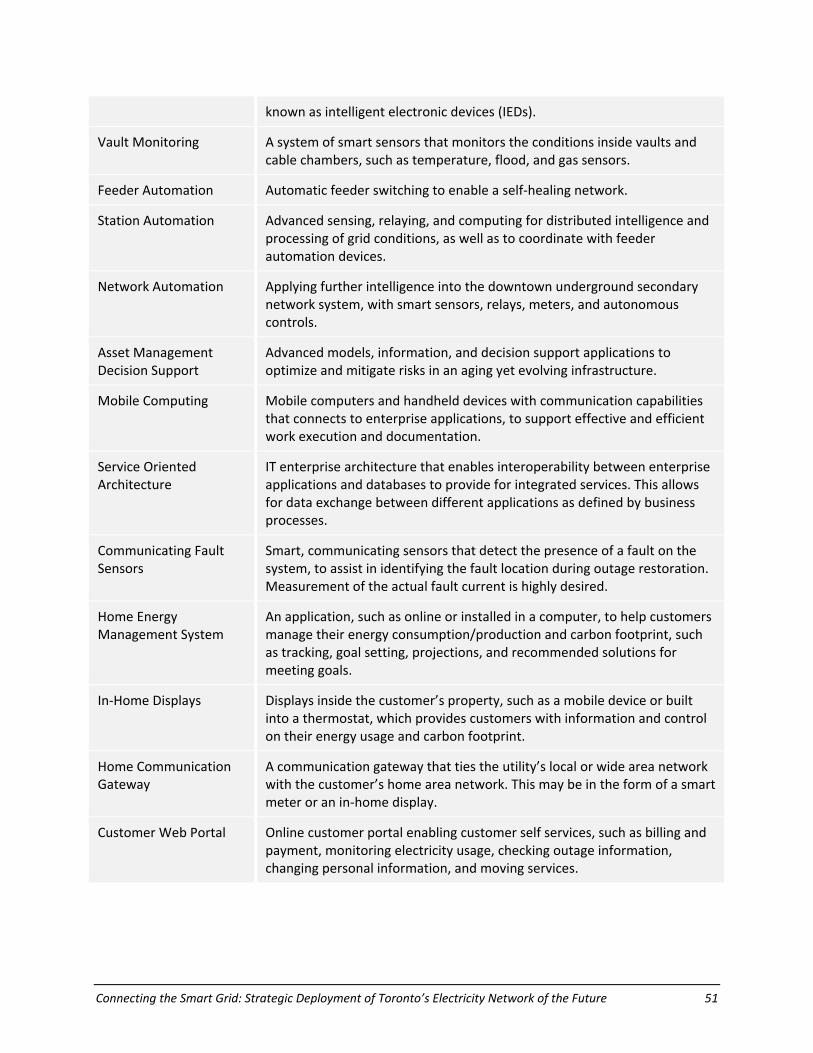
Connecting the Smart Grid: Strategic Deployment of Toronto’s Electricity Network of the Future 51
known as intelligent electronic devices (IEDs).
Vault Monitoring A system of smart sensors that monitors the conditions inside vaults and cable chambers, such as temperature, flood, and gas sensors.
Feeder Automation Automatic feeder switching to enable a self‐healing network.
Station Automation Advanced sensing, relaying, and computing for distributed intelligence and processing of grid conditions, as well as to coordinate with feeder automation devices.
Network Automation Applying further intelligence into the downtown underground secondary network system, with smart sensors, relays, meters, and autonomous controls.
Asset Management Decision Support
Advanced models, information, and decision support applications to optimize and mitigate risks in an aging yet evolving infrastructure.
Mobile Computing Mobile computers and handheld devices with communication capabilities that connects to enterprise applications, to support effective and efficient work execution and documentation.
Service Oriented Architecture
IT enterprise architecture that enables interoperability between enterprise applications and databases to provide for integrated services. This allows for data exchange between different applications as defined by business processes.
Communicating Fault Sensors
Smart, communicating sensors that detect the presence of a fault on the system, to assist in identifying the fault location during outage restoration. Measurement of the actual fault current is highly desired.
Home Energy Management System
An application, such as online or installed in a computer, to help customers manage their energy consumption/production and carbon footprint, such as tracking, goal setting, projections, and recommended solutions for meeting goals.
In‐Home Displays Displays inside the customer’s property, such as a mobile device or built into a thermostat, which provides customers with information and control on their energy usage and carbon footprint.
Home Communication Gateway
A communication gateway that ties the utility’s local or wide area network with the customer’s home area network. This may be in the form of a smart meter or an in‐home display.
Customer Web Portal Online customer portal enabling customer self services, such as billing and payment, monitoring electricity usage, checking outage information, changing personal information, and moving services.
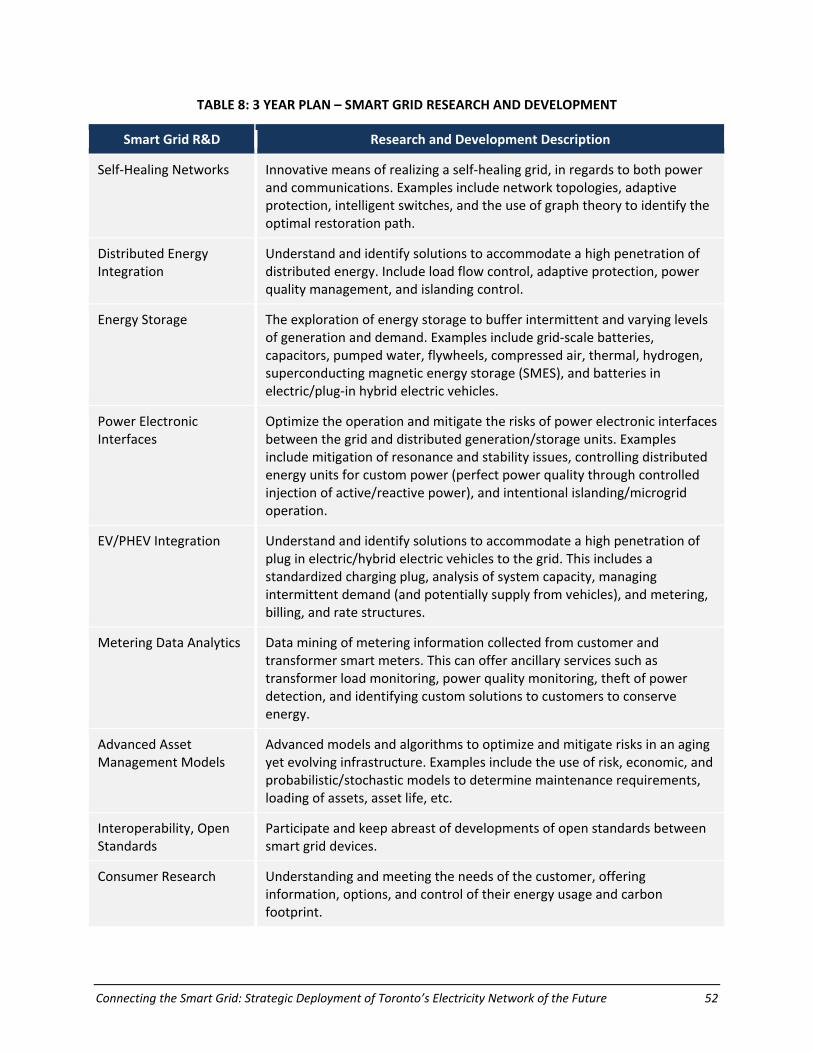
Connecting the Smart Grid: Strategic Deployment of Toronto’s Electricity Network of the Future 52
TABLE 8: 3 YEAR PLAN – SMART GRID RESEARCH AND DEVELOPMENT
Smart Grid R&D Research and Development Description
Self‐Healing Networks Innovative means of realizing a self‐healing grid, in regards to both power and communications. Examples include network topologies, adaptive protection, intelligent switches, and the use of graph theory to identify the optimal restoration path.
Distributed Energy Integration
Understand and identify solutions to accommodate a high penetration of distributed energy. Include load flow control, adaptive protection, power quality management, and islanding control.
Energy Storage The exploration of energy storage to buffer intermittent and varying levels of generation and demand. Examples include grid‐scale batteries, capacitors, pumped water, flywheels, compressed air, thermal, hydrogen, superconducting magnetic energy storage (SMES), and batteries in electric/plug‐in hybrid electric vehicles.
Power Electronic Interfaces
Optimize the operation and mitigate the risks of power electronic interfaces between the grid and distributed generation/storage units. Examples include mitigation of resonance and stability issues, controlling distributed energy units for custom power (perfect power quality through controlled injection of active/reactive power), and intentional islanding/microgrid operation.
EV/PHEV Integration Understand and identify solutions to accommodate a high penetration of plug in electric/hybrid electric vehicles to the grid. This includes a standardized charging plug, analysis of system capacity, managing intermittent demand (and potentially supply from vehicles), and metering, billing, and rate structures.
Metering Data Analytics Data mining of metering information collected from customer and transformer smart meters. This can offer ancillary services such as transformer load monitoring, power quality monitoring, theft of power detection, and identifying custom solutions to customers to conserve energy.
Advanced Asset Management Models
Advanced models and algorithms to optimize and mitigate risks in an aging yet evolving infrastructure. Examples include the use of risk, economic, and probabilistic/stochastic models to determine maintenance requirements, loading of assets, asset life, etc.
Interoperability, Open Standards
Participate and keep abreast of developments of open standards between smart grid devices.
Consumer Research Understanding and meeting the needs of the customer, offering information, options, and control of their energy usage and carbon footprint.
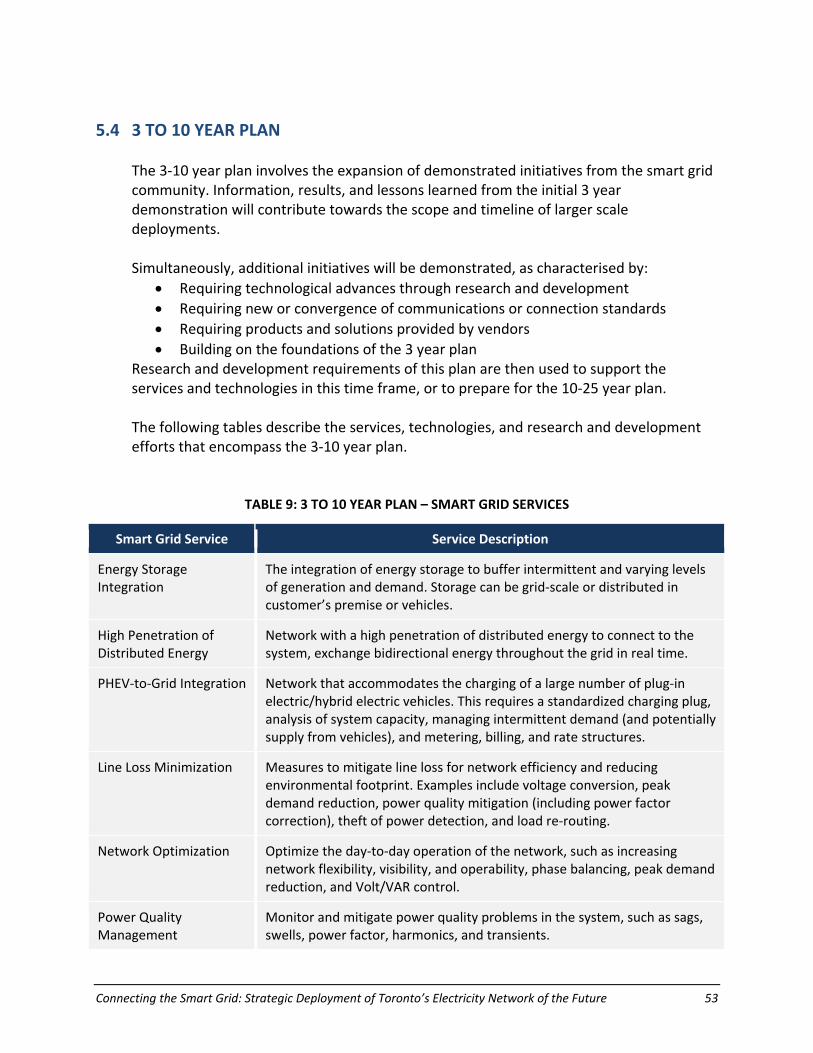
Connecting the Smart Grid: Strategic Deployment of Toronto’s Electricity Network of the Future 53
5.4 3 TO 10 YEAR PLAN
The 3‐10 year plan involves the expansion of demonstrated initiatives from the smart grid community. Information, results, and lessons learned from the initial 3 year demonstration will contribute towards the scope and timeline of larger scale deployments. Simultaneously, additional initiatives will be demonstrated, as characterised by:
• Requiring technological advances through research and development • Requiring new or convergence of communications or connection standards • Requiring products and solutions provided by vendors • Building on the foundations of the 3 year plan
Research and development requirements of this plan are then used to support the services and technologies in this time frame, or to prepare for the 10‐25 year plan. The following tables describe the services, technologies, and research and development efforts that encompass the 3‐10 year plan.
TABLE 9: 3 TO 10 YEAR PLAN – SMART GRID SERVICES
Smart Grid Service Service Description
Energy Storage Integration
The integration of energy storage to buffer intermittent and varying levels of generation and demand. Storage can be grid‐scale or distributed in customer’s premise or vehicles.
High Penetration of Distributed Energy
Network with a high penetration of distributed energy to connect to the system, exchange bidirectional energy throughout the grid in real time.
PHEV‐to‐Grid Integration Network that accommodates the charging of a large number of plug‐in electric/hybrid electric vehicles. This requires a standardized charging plug, analysis of system capacity, managing intermittent demand (and potentially supply from vehicles), and metering, billing, and rate structures.
Line Loss Minimization Measures to mitigate line loss for network efficiency and reducing environmental footprint. Examples include voltage conversion, peak demand reduction, power quality mitigation (including power factor correction), theft of power detection, and load re‐routing.
Network Optimization Optimize the day‐to‐day operation of the network, such as increasing network flexibility, visibility, and operability, phase balancing, peak demand reduction, and Volt/VAR control.
Power Quality Management
Monitor and mitigate power quality problems in the system, such as sags, swells, power factor, harmonics, and transients.
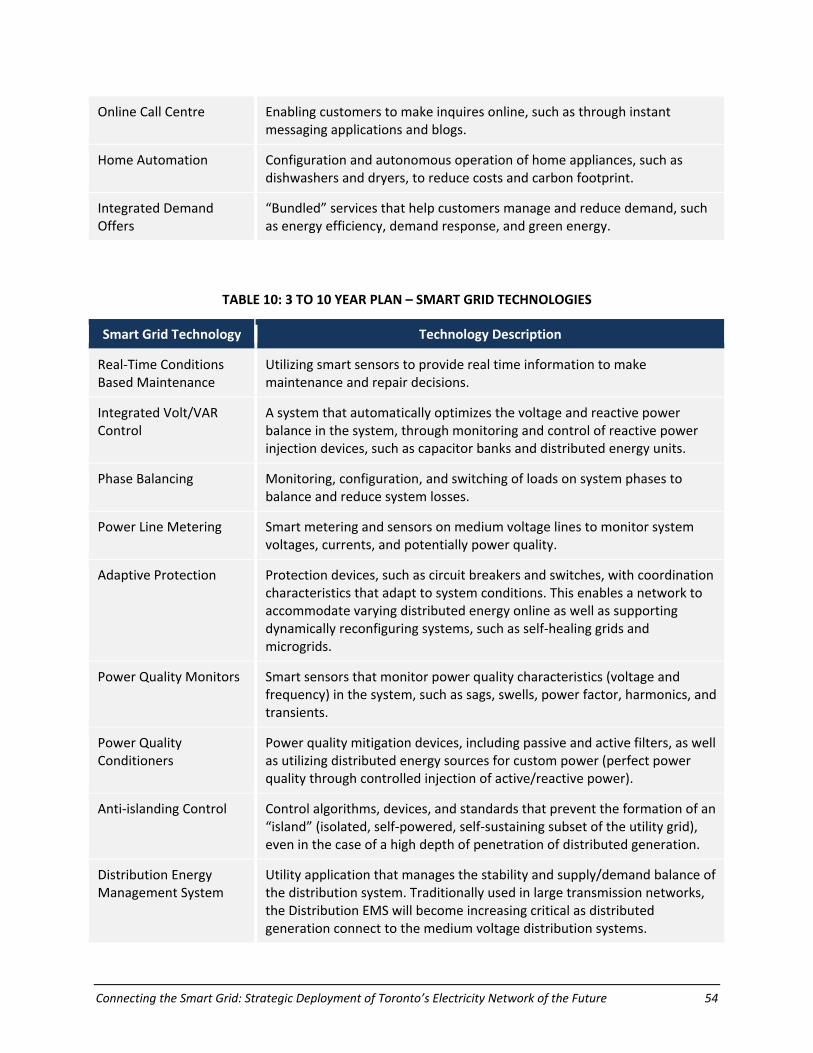
Connecting the Smart Grid: Strategic Deployment of Toronto’s Electricity Network of the Future 54
Online Call Centre Enabling customers to make inquires online, such as through instant messaging applications and blogs.
Home Automation Configuration and autonomous operation of home appliances, such as dishwashers and dryers, to reduce costs and carbon footprint.
Integrated Demand Offers
“Bundled” services that help customers manage and reduce demand, such as energy efficiency, demand response, and green energy.
TABLE 10: 3 TO 10 YEAR PLAN – SMART GRID TECHNOLOGIES
Smart Grid Technology Technology Description
Real‐Time Conditions Based Maintenance
Utilizing smart sensors to provide real time information to make maintenance and repair decisions.
Integrated Volt/VAR Control
A system that automatically optimizes the voltage and reactive power balance in the system, through monitoring and control of reactive power injection devices, such as capacitor banks and distributed energy units.
Phase Balancing Monitoring, configuration, and switching of loads on system phases to balance and reduce system losses.
Power Line Metering Smart metering and sensors on medium voltage lines to monitor system voltages, currents, and potentially power quality.
Adaptive Protection Protection devices, such as circuit breakers and switches, with coordination characteristics that adapt to system conditions. This enables a network to accommodate varying distributed energy online as well as supporting dynamically reconfiguring systems, such as self‐healing grids and microgrids.
Power Quality Monitors Smart sensors that monitor power quality characteristics (voltage and frequency) in the system, such as sags, swells, power factor, harmonics, and transients.
Power Quality Conditioners
Power quality mitigation devices, including passive and active filters, as well as utilizing distributed energy sources for custom power (perfect power quality through controlled injection of active/reactive power).
Anti‐islanding Control Control algorithms, devices, and standards that prevent the formation of an “island” (isolated, self‐powered, self‐sustaining subset of the utility grid), even in the case of a high depth of penetration of distributed generation.
Distribution Energy Management System
Utility application that manages the stability and supply/demand balance of the distribution system. Traditionally used in large transmission networks, the Distribution EMS will become increasing critical as distributed generation connect to the medium voltage distribution systems.
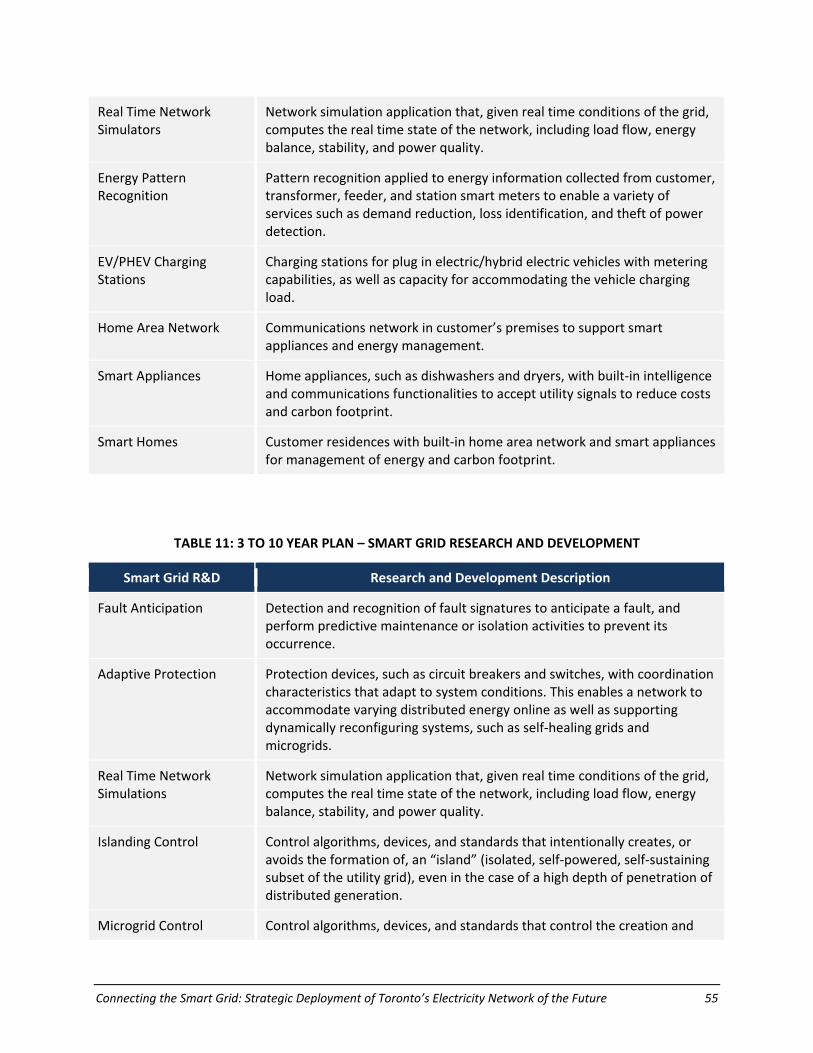
Connecting the Smart Grid: Strategic Deployment of Toronto’s Electricity Network of the Future 55
Real Time Network Simulators
Network simulation application that, given real time conditions of the grid, computes the real time state of the network, including load flow, energy balance, stability, and power quality.
Energy Pattern Recognition
Pattern recognition applied to energy information collected from customer, transformer, feeder, and station smart meters to enable a variety of services such as demand reduction, loss identification, and theft of power detection.
EV/PHEV Charging Stations
Charging stations for plug in electric/hybrid electric vehicles with metering capabilities, as well as capacity for accommodating the vehicle charging load.
Home Area Network Communications network in customer’s premises to support smart appliances and energy management.
Smart Appliances Home appliances, such as dishwashers and dryers, with built‐in intelligence and communications functionalities to accept utility signals to reduce costs and carbon footprint.
Smart Homes Customer residences with built‐in home area network and smart appliances for management of energy and carbon footprint.
TABLE 11: 3 TO 10 YEAR PLAN – SMART GRID RESEARCH AND DEVELOPMENT
Smart Grid R&D Research and Development Description
Fault Anticipation Detection and recognition of fault signatures to anticipate a fault, and perform predictive maintenance or isolation activities to prevent its occurrence.
Adaptive Protection Protection devices, such as circuit breakers and switches, with coordination characteristics that adapt to system conditions. This enables a network to accommodate varying distributed energy online as well as supporting dynamically reconfiguring systems, such as self‐healing grids and microgrids.
Real Time Network Simulations
Network simulation application that, given real time conditions of the grid, computes the real time state of the network, including load flow, energy balance, stability, and power quality.
Islanding Control Control algorithms, devices, and standards that intentionally creates, or avoids the formation of, an “island” (isolated, self‐powered, self‐sustaining subset of the utility grid), even in the case of a high depth of penetration of distributed generation.
Microgrid Control Control algorithms, devices, and standards that control the creation and

Connecting the Smart Grid: Strategic Deployment of Toronto’s Electricity Network of the Future 56
operation of a microgrid embedded in the utility grid. This can take the form of a Virtual Power Plant (coordination of resources from a group of distributed generation), community power (group of customers managing their own power), and intentional islands.
Data Mining Mining of a utility’s information rich enterprise databases to identify new potentials for improving the system or assisting the customer in energy/carbon management. Possible sources include metering, asset conditions, and operational information.
Weather, Supply, Demand Forecasts
Perform weather, supply, and demand forecasts to predict system behaviour and manage the varying levels of generation and load.
5.5 10 TO 25 YEAR PLAN
The 10‐25 year plan is characterised by complete integration of technologies and services, maturing of technologies and services that were deployed in the first 10 years, collaboration between the utility and customers, and energy sourced primarily from renewable and clean generation. Proven smart grid technologies will span across the entire territory of Toronto Hydro. There will be further focus on providing services rather than resolving technology barriers. New initiatives in this plan require the most significant amount of research and development, and have a comparable degree of uncertainty as seen in this stage of deployment. However the services that they enable represent the end state of the smart grid as defined by present drivers. The following tables describe the services, technologies, and research and development efforts that encompass the 10‐25 year plan.
TABLE 12: 10 TO 25 YEAR PLAN – SMART GRID SERVICES
Smart Grid Service Service Description
Fully Distributed Energy and Intelligence
A network in which energy and intelligence are completely distributed amongst the network and coordinated with centralized sources and controls. A network where energy is generated and consumed locally, while centralized sources are only used as reserve. Network data and decision making are also localized for optimal timing and performance, while centralized processing are only used for high level monitoring and controls.
Fully Electrified Transportation
A network where all modes of transportation, personal vehicles and public transit (including subway and trains), are electrified and “plugged in” to the
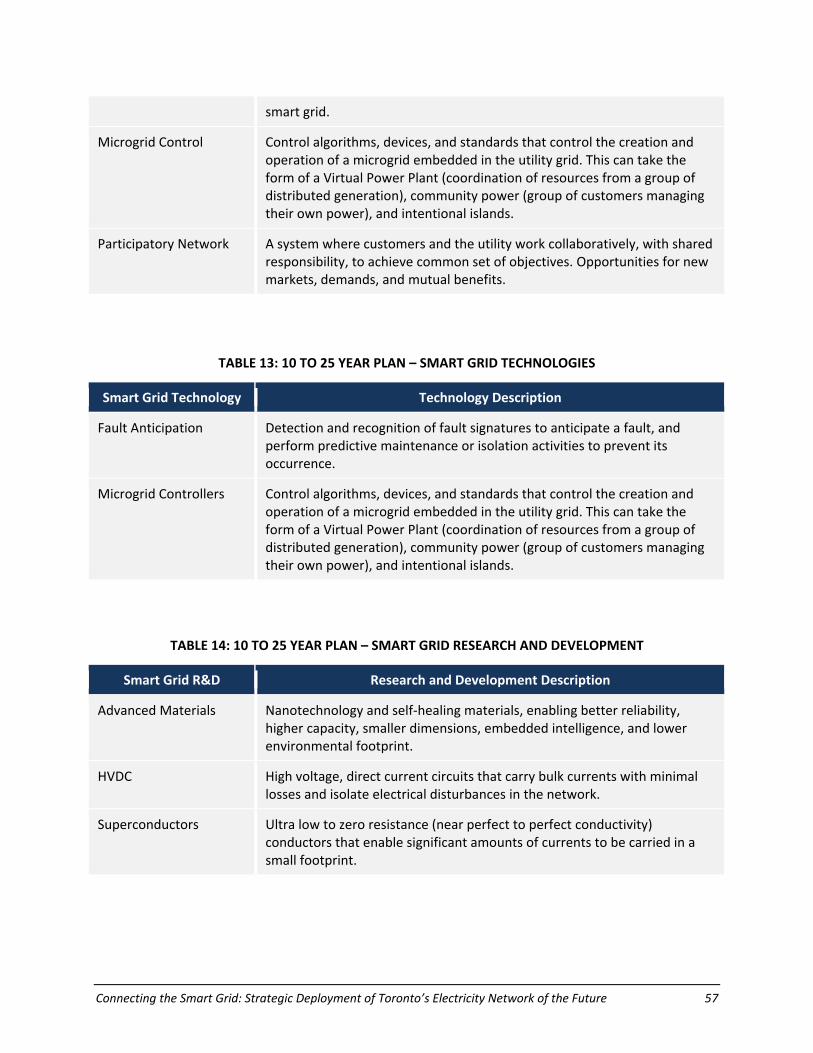
Connecting the Smart Grid: Strategic Deployment of Toronto’s Electricity Network of the Future 57
smart grid.
Microgrid Control Control algorithms, devices, and standards that control the creation and operation of a microgrid embedded in the utility grid. This can take the form of a Virtual Power Plant (coordination of resources from a group of distributed generation), community power (group of customers managing their own power), and intentional islands.
Participatory Network A system where customers and the utility work collaboratively, with shared responsibility, to achieve common set of objectives. Opportunities for new markets, demands, and mutual benefits.
TABLE 13: 10 TO 25 YEAR PLAN – SMART GRID TECHNOLOGIES
Smart Grid Technology Technology Description
Fault Anticipation Detection and recognition of fault signatures to anticipate a fault, and perform predictive maintenance or isolation activities to prevent its occurrence.
Microgrid Controllers Control algorithms, devices, and standards that control the creation and operation of a microgrid embedded in the utility grid. This can take the form of a Virtual Power Plant (coordination of resources from a group of distributed generation), community power (group of customers managing their own power), and intentional islands.
TABLE 14: 10 TO 25 YEAR PLAN – SMART GRID RESEARCH AND DEVELOPMENT
Smart Grid R&D Research and Development Description
Advanced Materials Nanotechnology and self‐healing materials, enabling better reliability, higher capacity, smaller dimensions, embedded intelligence, and lower environmental footprint.
HVDC High voltage, direct current circuits that carry bulk currents with minimal losses and isolate electrical disturbances in the network.
Superconductors Ultra low to zero resistance (near perfect to perfect conductivity) conductors that enable significant amounts of currents to be carried in a small footprint.
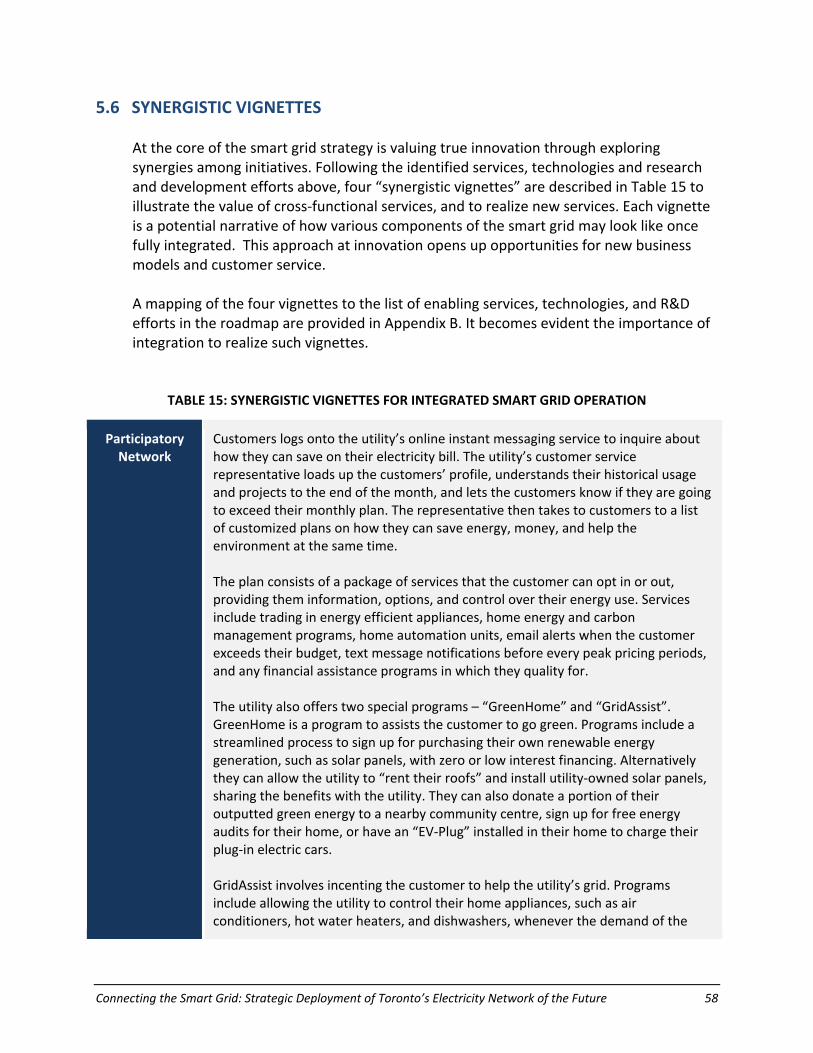
Connecting the Smart Grid: Strategic Deployment of Toronto’s Electricity Network of the Future 58
5.6 SYNERGISTIC VIGNETTES
At the core of the smart grid strategy is valuing true innovation through exploring synergies among initiatives. Following the identified services, technologies and research and development efforts above, four “synergistic vignettes” are described in Table 15 to illustrate the value of cross‐functional services, and to realize new services. Each vignette is a potential narrative of how various components of the smart grid may look like once fully integrated. This approach at innovation opens up opportunities for new business models and customer service. A mapping of the four vignettes to the list of enabling services, technologies, and R&D efforts in the roadmap are provided in Appendix B. It becomes evident the importance of integration to realize such vignettes.
TABLE 15: SYNERGISTIC VIGNETTES FOR INTEGRATED SMART GRID OPERATION
Participatory Network
Customers logs onto the utility’s online instant messaging service to inquire about how they can save on their electricity bill. The utility’s customer service representative loads up the customers’ profile, understands their historical usage and projects to the end of the month, and lets the customers know if they are going to exceed their monthly plan. The representative then takes to customers to a list of customized plans on how they can save energy, money, and help the environment at the same time. The plan consists of a package of services that the customer can opt in or out, providing them information, options, and control over their energy use. Services include trading in energy efficient appliances, home energy and carbon management programs, home automation units, email alerts when the customer exceeds their budget, text message notifications before every peak pricing periods, and any financial assistance programs in which they quality for. The utility also offers two special programs – “GreenHome” and “GridAssist”. GreenHome is a program to assists the customer to go green. Programs include a streamlined process to sign up for purchasing their own renewable energy generation, such as solar panels, with zero or low interest financing. Alternatively they can allow the utility to “rent their roofs” and install utility‐owned solar panels, sharing the benefits with the utility. They can also donate a portion of their outputted green energy to a nearby community centre, sign up for free energy audits for their home, or have an “EV‐Plug” installed in their home to charge their plug‐in electric cars. GridAssist involves incenting the customer to help the utility’s grid. Programs include allowing the utility to control their home appliances, such as air conditioners, hot water heaters, and dishwashers, whenever the demand of the

Connecting the Smart Grid: Strategic Deployment of Toronto’s Electricity Network of the Future 59
power grid reach too high, or when the level of green energy in the system is too low and more polluting sources of generation will have to come online. Intelligence within the appliances ensures that the level of comfort in the home will not be compromised, and the customers will be given the ability to override the pre‐programmed settings. Throughout the time the utility’s representative stays online and responds to any questions that the customer might have. The customer simply adds any programs they want by “add to cart” and do a “checkout”. They can then print a summary of all the services they signed up for and will be contacted by the utility shortly on what to do next.
Green Society A decentralize generation network powered entirely from renewable and clean energy sources. Each building has become a “positive power plant” by generating both negawatts (conservation) and watts. Through an extensive carbon cap and trade system, society as a whole also becomes carbon neutral, even when considering the full life cycle, including manufacturing and transportation, of its generation sources. The smart grid infrastructure also has the capacity and intelligence to accommodate a wide array of generation options, including various interfaces. Distributed generation, distributed storage facilities, demand response, and intelligent applications ensure that supply and demand are balanced at all times despite the intermittent nature of renewable sources. Smart sensors, adaptive protection devices, sophisticated controls, and an extensive communications network ensure that power quality and system stability are well managed. Community power corporations, microgrids, and virtual power plants are also enabled to better manage the production and use of green energy. Potential, municipalities can become a positive energy source, and optimize their electricity with other districts. Centralized generation continues to exist but as reserves, while transmission systems tie both net positive and negative distribution networks together for energy trading. Mechanisms to promote green energy include zero or low interest financing for renewable generation, carbon cap and trade systems, and streamlined processes. To reduce the risks of financing green energies for customers, utilities and other third parities can enter contractual agreements with the customer to install their own generation while sharing benefits with the customer. Meanwhile, this dynamic, decentralized generation network also supports a fully electrified transportation infrastructure. Electrified vehicles, subway and train systems all plug in into the smart grid both as mobile loads and energy storage units.

Connecting the Smart Grid: Strategic Deployment of Toronto’s Electricity Network of the Future 60
Infrastructure Optimization
Day to day operation of the electric system is optimized with a dynamic, robust, and efficient grid. Safety, reliability, and supply security is ensured at all times. Distributed generation and storage facilities, as well as demand response and plug‐in electric vehicles all work together to ensure supply demand balance. A network of intelligent sensors gives valuable information into the real time condition of the grid and warns of immediate work required. Automated controls perfects grid power quality and minimize the amount of losses, knowing exactly where they are. Valuable asset and grid operating information also flows back to back end intelligent systems to optimize the economic life and performance of assets. Workers are empowered with access to back end enterprise systems, such as maps and asset data, and work paperless to reduce impact on the environment.
Integrated Outage
Restoration
A power outage occurs. Smart meters and communications immediately inform the utility that the customers’ power is out. A self‐healing grid automatically isolates the fault and restores power to as many customers as soon as possible. Distributed generation devices such as customer’s solar panels and electric cars start feeding power to the customers as backup. The utility sends a text message to mobile and in‐home devices acknowledging that the power is out and the utility is doing its best to restore power as quickly as possible. It also provides a best estimate given information captured from the grid and the circuit that was out of how long it will take to restore power. It further offers tips of what to do in the event of an outage. A crew is dispatched from the nearest location to confirm the location and reason for the outage, and provides a further update to the time till restoration. Using advanced tools and equipments, they proceed to remedy the cause of the outage and bring power back as soon as possible. Once power is restored, the utility confirms the restoration to all customers who were out, and sends a text message to their devices informing them of the restoration.
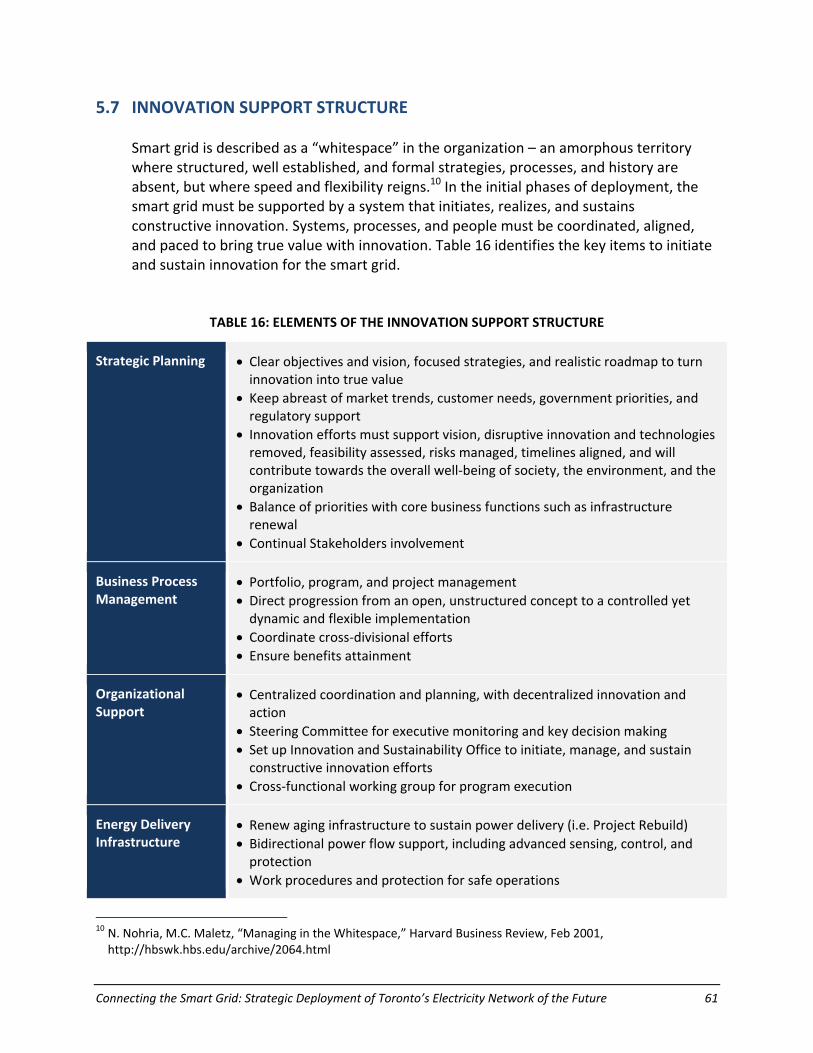
Connecting the Smart Grid: Strategic Deployment of Toronto’s Electricity Network of the Future 61
5.7 INNOVATION SUPPORT STRUCTURE
Smart grid is described as a “whitespace” in the organization – an amorphous territory where structured, well established, and formal strategies, processes, and history are absent, but where speed and flexibility reigns.10 In the initial phases of deployment, the smart grid must be supported by a system that initiates, realizes, and sustains constructive innovation. Systems, processes, and people must be coordinated, aligned, and paced to bring true value with innovation. Table 16 identifies the key items to initiate and sustain innovation for the smart grid.
TABLE 16: ELEMENTS OF THE INNOVATION SUPPORT STRUCTURE
Strategic Planning • Clear objectives and vision, focused strategies, and realistic roadmap to turn innovation into true value
• Keep abreast of market trends, customer needs, government priorities, and regulatory support
• Innovation efforts must support vision, disruptive innovation and technologies removed, feasibility assessed, risks managed, timelines aligned, and will contribute towards the overall well‐being of society, the environment, and the organization
• Balance of priorities with core business functions such as infrastructure renewal
• Continual Stakeholders involvement
Business Process Management
• Portfolio, program, and project management • Direct progression from an open, unstructured concept to a controlled yet dynamic and flexible implementation
• Coordinate cross‐divisional efforts • Ensure benefits attainment
Organizational Support
• Centralized coordination and planning, with decentralized innovation and action
• Steering Committee for executive monitoring and key decision making • Set up Innovation and Sustainability Office to initiate, manage, and sustain constructive innovation efforts
• Cross‐functional working group for program execution
Energy Delivery Infrastructure
• Renew aging infrastructure to sustain power delivery (i.e. Project Rebuild) • Bidirectional power flow support, including advanced sensing, control, and protection
• Work procedures and protection for safe operations
10 N. Nohria, M.C. Maletz, “Managing in the Whitespace,” Harvard Business Review, Feb 2001, http://hbswk.hbs.edu/archive/2064.html
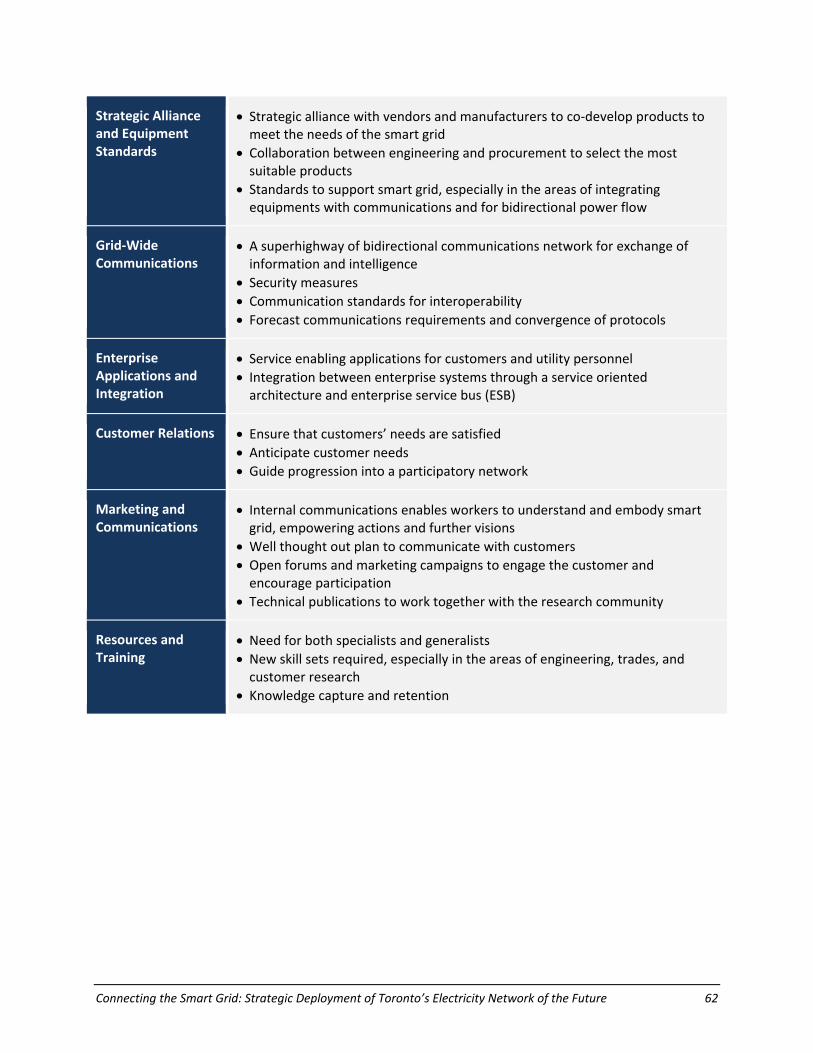
Connecting the Smart Grid: Strategic Deployment of Toronto’s Electricity Network of the Future 62
Strategic Alliance and Equipment Standards
• Strategic alliance with vendors and manufacturers to co‐develop products to meet the needs of the smart grid
• Collaboration between engineering and procurement to select the most suitable products
• Standards to support smart grid, especially in the areas of integrating equipments with communications and for bidirectional power flow
Grid‐Wide Communications
• A superhighway of bidirectional communications network for exchange of information and intelligence
• Security measures • Communication standards for interoperability • Forecast communications requirements and convergence of protocols
Enterprise Applications and Integration
• Service enabling applications for customers and utility personnel • Integration between enterprise systems through a service oriented architecture and enterprise service bus (ESB)
Customer Relations • Ensure that customers’ needs are satisfied • Anticipate customer needs • Guide progression into a participatory network
Marketing and Communications
• Internal communications enables workers to understand and embody smart grid, empowering actions and further visions
• Well thought out plan to communicate with customers • Open forums and marketing campaigns to engage the customer and encourage participation
• Technical publications to work together with the research community
Resources and Training
• Need for both specialists and generalists • New skill sets required, especially in the areas of engineering, trades, and customer research
• Knowledge capture and retention
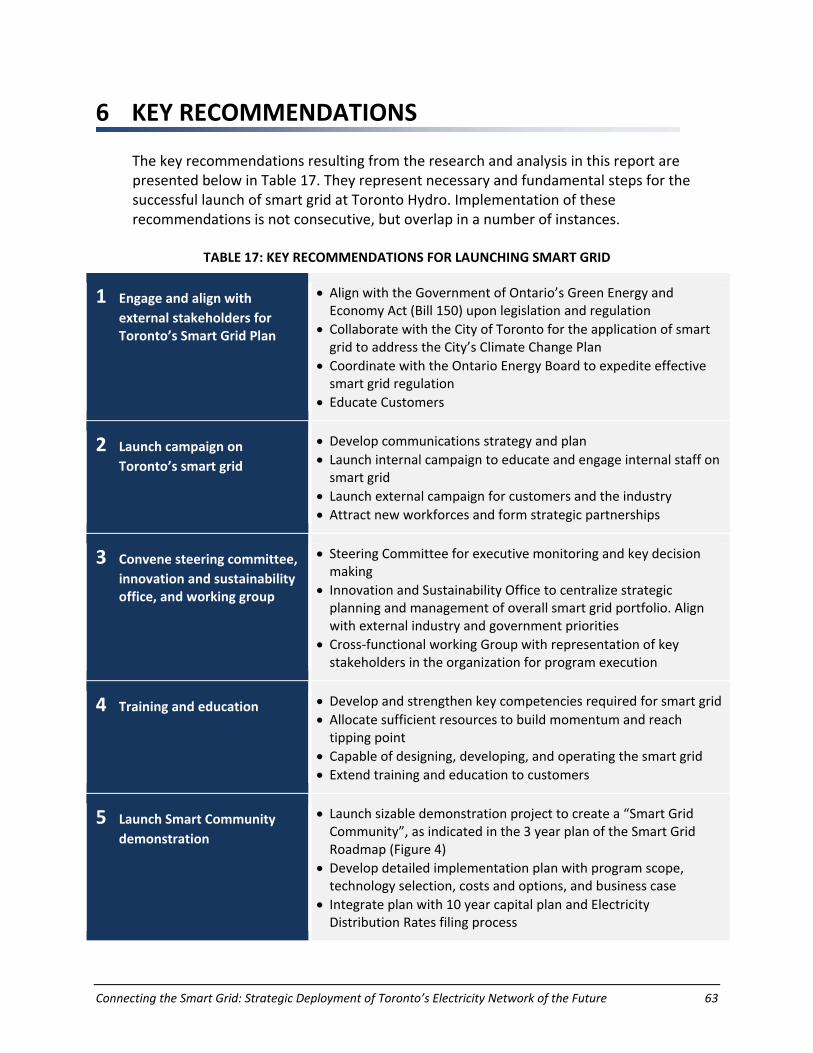
Connecting the Smart Grid: Strategic Deployment of Toronto’s Electricity Network of the Future 63
6 KEY RECOMMENDATIONS
The key recommendations resulting from the research and analysis in this report are presented below in Table 17. They represent necessary and fundamental steps for the successful launch of smart grid at Toronto Hydro. Implementation of these recommendations is not consecutive, but overlap in a number of instances.
TABLE 17: KEY RECOMMENDATIONS FOR LAUNCHING SMART GRID
1 Engage and align with external stakeholders for Toronto’s Smart Grid Plan
• Align with the Government of Ontario’s Green Energy and Economy Act (Bill 150) upon legislation and regulation
• Collaborate with the City of Toronto for the application of smart grid to address the City’s Climate Change Plan
• Coordinate with the Ontario Energy Board to expedite effective smart grid regulation
• Educate Customers
2 Launch campaign on Toronto’s smart grid
• Develop communications strategy and plan • Launch internal campaign to educate and engage internal staff on smart grid
• Launch external campaign for customers and the industry • Attract new workforces and form strategic partnerships
3 Convene steering committee, innovation and sustainability office, and working group
• Steering Committee for executive monitoring and key decision making
• Innovation and Sustainability Office to centralize strategic planning and management of overall smart grid portfolio. Align with external industry and government priorities
• Cross‐functional working Group with representation of key stakeholders in the organization for program execution
4 Training and education • Develop and strengthen key competencies required for smart grid • Allocate sufficient resources to build momentum and reach tipping point
• Capable of designing, developing, and operating the smart grid • Extend training and education to customers
5 Launch Smart Community demonstration
• Launch sizable demonstration project to create a “Smart Grid Community”, as indicated in the 3 year plan of the Smart Grid Roadmap (Figure 4)
• Develop detailed implementation plan with program scope, technology selection, costs and options, and business case
• Integrate plan with 10 year capital plan and Electricity Distribution Rates filing process
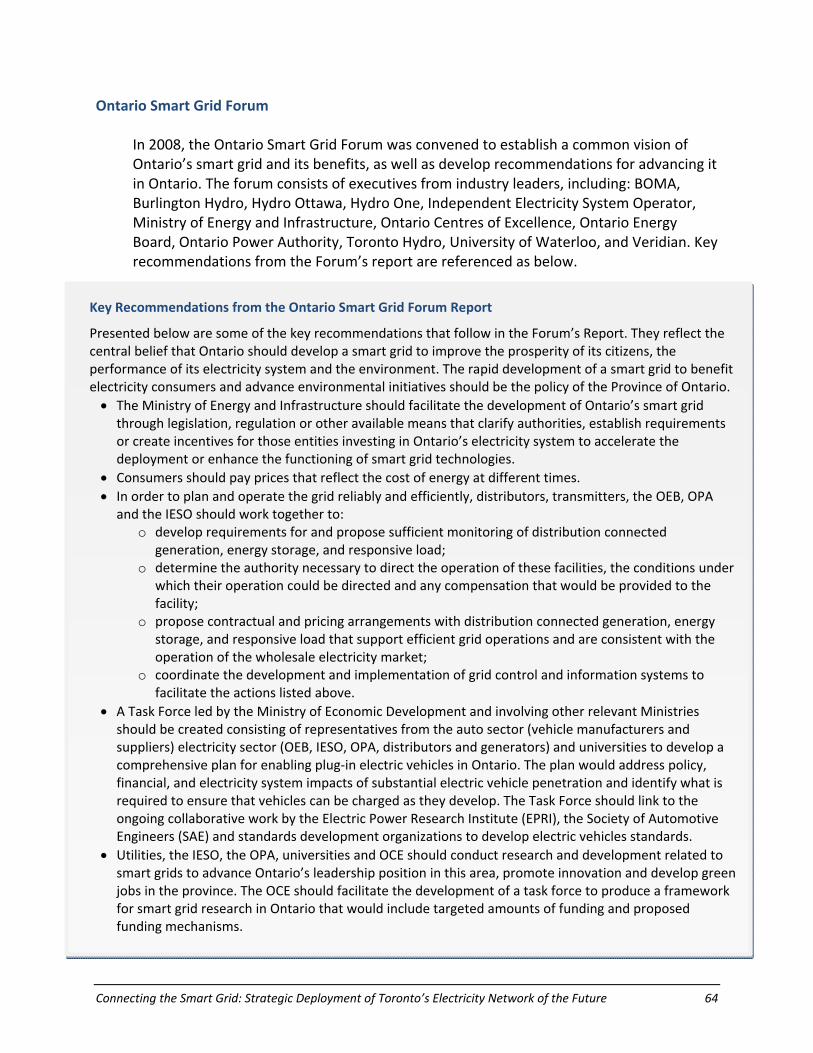
Connecting the Smart Grid: Strategic Deployment of Toronto’s Electricity Network of the Future 64
Ontario Smart Grid Forum In 2008, the Ontario Smart Grid Forum was convened to establish a common vision of Ontario’s smart grid and its benefits, as well as develop recommendations for advancing it in Ontario. The forum consists of executives from industry leaders, including: BOMA, Burlington Hydro, Hydro Ottawa, Hydro One, Independent Electricity System Operator, Ministry of Energy and Infrastructure, Ontario Centres of Excellence, Ontario Energy Board, Ontario Power Authority, Toronto Hydro, University of Waterloo, and Veridian. Key recommendations from the Forum’s report are referenced as below.
Key Recommendations from the Ontario Smart Grid Forum Report
Presented below are some of the key recommendations that follow in the Forum’s Report. They reflect the central belief that Ontario should develop a smart grid to improve the prosperity of its citizens, the performance of its electricity system and the environment. The rapid development of a smart grid to benefit electricity consumers and advance environmental initiatives should be the policy of the Province of Ontario. • The Ministry of Energy and Infrastructure should facilitate the development of Ontario’s smart grid
through legislation, regulation or other available means that clarify authorities, establish requirements or create incentives for those entities investing in Ontario’s electricity system to accelerate the deployment or enhance the functioning of smart grid technologies.
• Consumers should pay prices that reflect the cost of energy at different times. • In order to plan and operate the grid reliably and efficiently, distributors, transmitters, the OEB, OPA
and the IESO should work together to: o develop requirements for and propose sufficient monitoring of distribution connected
generation, energy storage, and responsive load; o determine the authority necessary to direct the operation of these facilities, the conditions under
which their operation could be directed and any compensation that would be provided to the facility;
o propose contractual and pricing arrangements with distribution connected generation, energy storage, and responsive load that support efficient grid operations and are consistent with the operation of the wholesale electricity market;
o coordinate the development and implementation of grid control and information systems to facilitate the actions listed above.
• A Task Force led by the Ministry of Economic Development and involving other relevant Ministries should be created consisting of representatives from the auto sector (vehicle manufacturers and suppliers) electricity sector (OEB, IESO, OPA, distributors and generators) and universities to develop a comprehensive plan for enabling plug‐in electric vehicles in Ontario. The plan would address policy, financial, and electricity system impacts of substantial electric vehicle penetration and identify what is required to ensure that vehicles can be charged as they develop. The Task Force should link to the ongoing collaborative work by the Electric Power Research Institute (EPRI), the Society of Automotive Engineers (SAE) and standards development organizations to develop electric vehicles standards.
• Utilities, the IESO, the OPA, universities and OCE should conduct research and development related to smart grids to advance Ontario’s leadership position in this area, promote innovation and develop green jobs in the province. The OCE should facilitate the development of a task force to produce a framework for smart grid research in Ontario that would include targeted amounts of funding and proposed funding mechanisms.

Connecting the Smart Grid: Strategic Deployment of Toronto’s Electricity Network of the Future 65
7 A CALL TO ACTION
The City of Toronto has been known as the hub of Canada – the financial hub, the cultural hub, and the entertainment hub. With firm dedication and collaboration from the Ontario government, Toronto government, Toronto Hydro, and other key stakeholders, Toronto can also become the intelligent and sustainable energy hub of Canada. The smart grid is the avenue to make this happen. Through innovation and the strategic application of information, communication, and electronic/electrical technologies, the smart grid can optimize the electric infrastructure in a time of a convergence of risks, enhance customer experience in a digital era, and meet the province and city’s agenda for environmental sustainability and a green economy. It is a phenomenal task, but it is necessary. And we’re prepared to lead this effort. It is thus a time for change, for turning vision into action. Guided by our vision, objectives, strategy, and roadmap, we can realize a path through the challenges of deployment into a future of innovation and sustainability. The recommendations in this report envision actions taken by stakeholders throughout the organization to work collaboratively towards a smart grid. This involves initiating the transformation and innovation effort, engaging key stakeholders and customers, convening core groups in commencing smart grid activities, preparing workforce for modernization, and launching Toronto’s Smart Grid Community. The smart grid represents the greatest effort the industry has seen to “plug in” – plug in our customers, plug in the environment, plug in new technologies, and plug in our grid. The time is right, and the time is now.
Connecting the Smart Grid: Strategic Deployment of Toronto’s Electricity Network of the Future 66
APPENDIX A:
MAPPING SMART GRID INITIATIVES WITH STRATEGIC OBJECTIVES
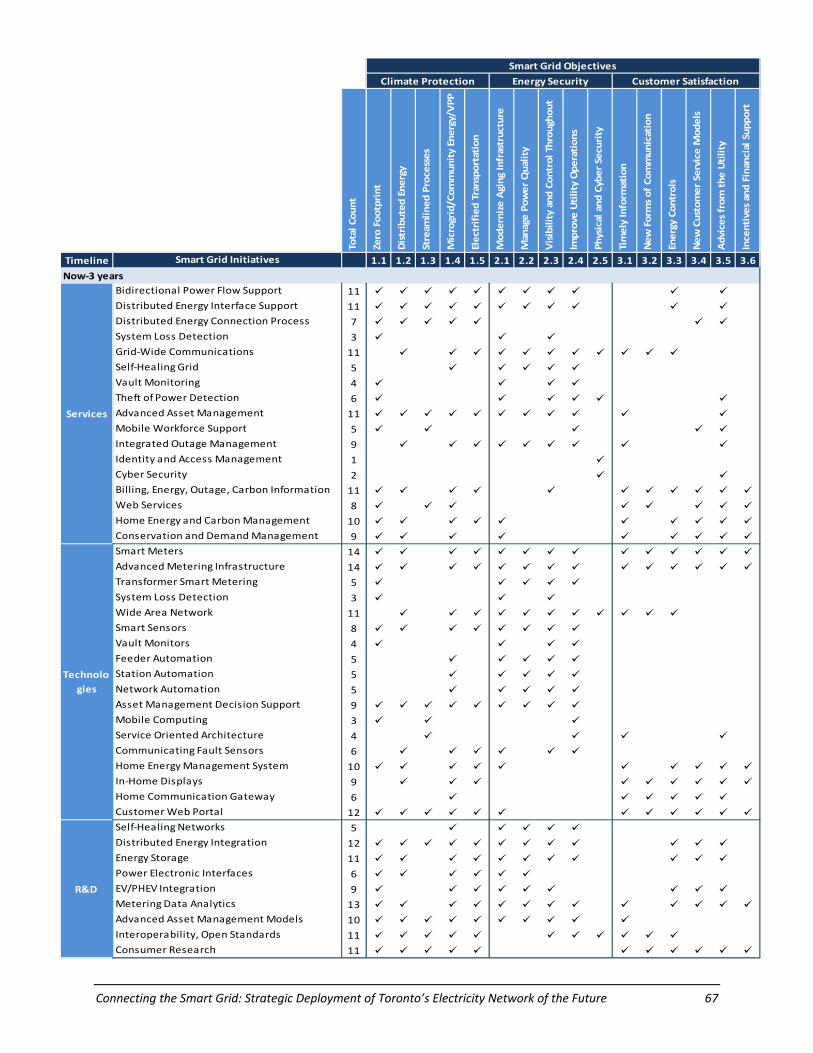
Connecting the Smart Grid: Strategic Deployment of Toronto’s Electricity Network of the Future 67
Total Count
Zero Footprint
Distributed Energy
Stream
lined
Processes
Microgrid/Com
munity Energy/VPP
Electrified Transportation
Modernize Aging Infrastructure
Manage Power Quality
Visibility and
Control Throughout
Improve Utility Operations
Physical and
Cyber Security
Timely Inform
ation
New
Forms of Com
munication
Energy Controls
New
Customer Service M
odels
Advices from the
Utility
Incentives and
Financial Support
Timeline Smart Grid Initiatives 1.1 1.2 1.3 1.4 1.5 2.1 2.2 2.3 2.4 2.5 3.1 3.2 3.3 3.4 3.5 3.6
Now‐3 yearsBidirectional Power Flow Support 11Distributed Energy Interface Support 11Distributed Energy Connection Process 7System Loss Detection 3Grid‐Wide Communications 11Self‐Healing Grid 5Vault Monitoring 4Theft of Power Detection 6Advanced Asset Management 11Mobile Workforce Support 5Integrated Outage Management 9Identity and Access Management 1Cyber Security 2Billing, Energy, Outage, Carbon Information 11Web Services 8Home Energy and Carbon Management 10Conservation and Demand Management 9Smart Meters 14Advanced Metering Infrastructure 14Transformer Smart Metering 5System Loss Detection 3Wide Area Network 11Smart Sensors 8Vault Monitors 4Feeder Automation 5Station Automation 5Network Automation 5Asset Management Decision Support 9Mobile Computing 3Service Oriented Architecture 4Communicating Fault Sensors 6Home Energy Management System 10In‐Home Displays 9Home Communication Gateway 6Customer Web Portal 12Self‐Healing Networks 5Distributed Energy Integration 12Energy Storage 11Power Electronic Interfaces 6EV/PHEV Integration 9Metering Data Analytics 13Advanced Asset Management Models 10Interoperability, Open Standards 11Consumer Research 11
Smart Grid Objectives
Climate Protection Energy Security Customer Satisfaction
Services
Technologies
R&D
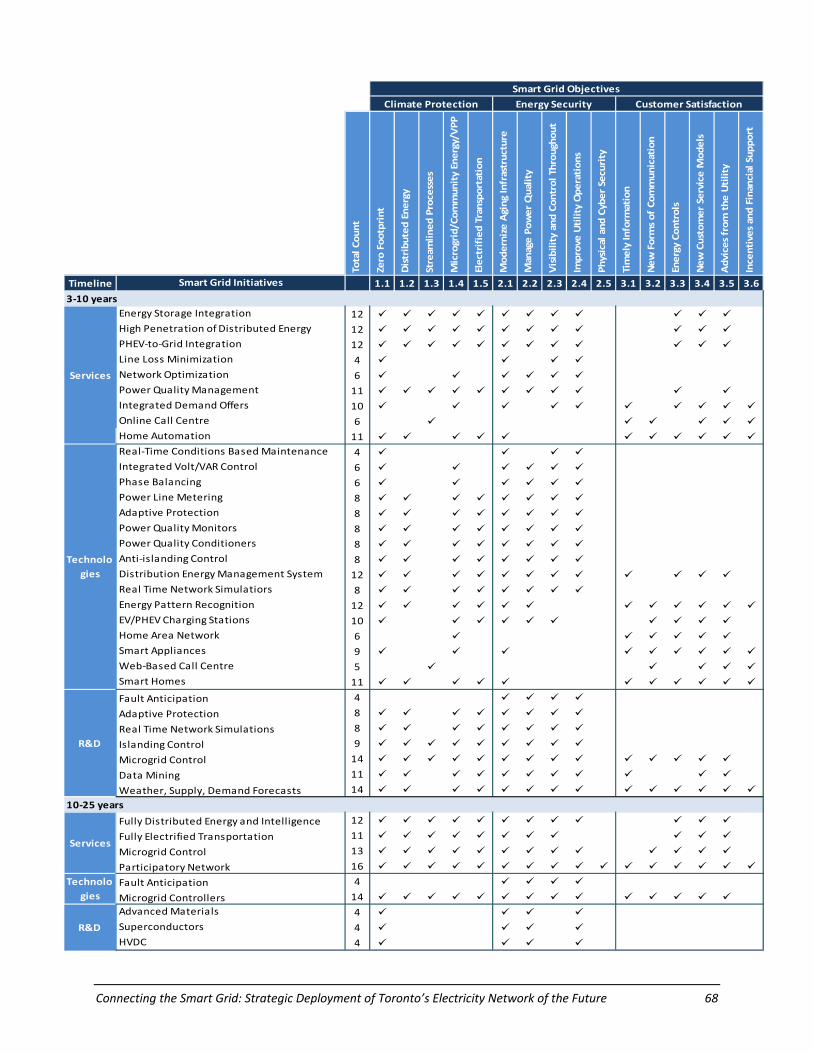
Connecting the Smart Grid: Strategic Deployment of Toronto’s Electricity Network of the Future 68
Total Count
Zero Footprint
Distributed Energy
Stream
lined
Processes
Microgrid/Com
munity Energy/VPP
Electrified Transportation
Modernize Aging Infrastructure
Manage Power Quality
Visibility and
Control Throughout
Improve Utility Operations
Physical and
Cyber Security
Timely Inform
ation
New
Forms of Com
munication
Energy Controls
New
Customer Service M
odels
Advices from the
Utility
Incentives and
Financial Support
Timeline Smart Grid Initiatives 1.1 1.2 1.3 1.4 1.5 2.1 2.2 2.3 2.4 2.5 3.1 3.2 3.3 3.4 3.5 3.6
3‐10 yearsEnergy Storage Integration 12High Penetration of Distributed Energy 12PHEV‐to‐Grid Integration 12Line Loss Minimization 4Network Optimization 6Power Quality Management 11Integrated Demand Offers 10Online Call Centre 6Home Automation 11Real‐Time Conditions Based Maintenance 4Integrated Volt/VAR Control 6Phase Balancing 6Power Line Metering 8Adaptive Protection 8Power Quality Monitors 8Power Quality Conditioners 8Anti‐islanding Control 8Distribution Energy Management System 12Real Time Network Simulatiors 8Energy Pattern Recognition 12EV/PHEV Charging Stations 10Home Area Network 6Smart Appliances 9Web‐Based Call Centre 5Smart Homes 11
Fault Anticipation 4
Adaptive Protection 8
Real Time Network Simulations 8
Islanding Control 9
Microgrid Control 14
Data Mining 11
Weather, Supply, Demand Forecasts 14
10‐25 years
Fully Distributed Energy and Intelligence 12
Fully Electrified Transportation 11
Microgrid Control 13
Participatory Network 16
Fault Anticipation 4
Microgrid Controllers 14Advanced Materials 4Superconductors 4HVDC 4
Smart Grid Objectives
Climate Protection Energy Security Customer Satisfaction
R&D
R&D
Services
Technologies
Services
Technologies
Connecting the Smart Grid: Strategic Deployment of Toronto’s Electricity Network of the Future 69
APPENDIX B:
SMART GRID INITIATIVES REQUIRED IN SYNERGISTIC VIGNETTES
Connecting the Smart Grid: Strategic Deployment of Toronto’s Electricity Network of the Future 70
Timeline Smart Grid InitiativesParticipatory Network
Green SocietyIntegrated Outage
RestorationOptimized
Infrastructure
Smart Grid Services
Bidirectional Power Flow Support
Distributed Energy Interface Support
Distributed Energy Connection Process
Grid‐Wide Communications
Self‐Healing Grid
Vault Monitoring
Theft of Power Detection
Advanced Asset Management
Mobile Workforce Support
Integrated Outage Management
Identity and Access Management
Cyber Security
Billing, Energy, Outage, Carbon Information
Web Services
Home Energy and Carbon Management
Conservation and Demand Management
Energy Storage Integration
High Penetration of Distributed Energy
PHEV‐to‐Grid Integration
Line Loss Minimization
Network OptimizationPower Quality Management
Integrated Demand Response
Online Call Centre
Home Automation
Fully Distributed Energy and Intelligence
Fully Electrified Transportation
Microgrid Control
Islanding Control
Participatory Network
Vignette
10‐25 years
Now‐ 3 years
3‐10 years
Connecting the Smart Grid: Strategic Deployment of Toronto’s Electricity Network of the Future 71
Timeline Smart Grid Initiatives
Participatory Network
Green SocietyIntegrated Outage
RestorationOptimized
Infrastructure
Smart Grid Technologies
Smart Meters
Advanced Metering Infrastructure
Transformer Smart Metering
Wide Area Network
Smart Sensors
Vault Monitors
Feeder Automation
Station Automation
Network Automation
Asset Management Decision Support
Mobile Computing
Communicating Fault Sensors
Home Energy Management System
In‐Home Displays
Home Communication Gateway
Demand Reponse Dispatch
Customer Web Portal
Real‐Time Conditions Based Maintenance
Integrated Volt/VAR Control
Phase Balancing
Power Line Metering
Adaptive Protection
Power Quality Monitors
Power Quality Conditioners
Anti‐islanding Control
Distribution Energy Management System
Real Time Network Simulatiors
Energy Pattern Recognition
EV/PHEV Charging Stations
Home Area Network
Smart Appliances
Web‐Based Call Centre
Smart Homes
Fault Anticipation
Microgrid Controllers
Smart Grid Research and Development
Self‐Healing Networks
Distributed Energy Integration
Energy Storage
Power Electronic Interfaces
EV/PHEV Integration
Metering Data Analytics
Advanced Asset Management Models
Interoperability, Open Standards
Consumer Research
Fault Anticipation
Adaptive Protection
Real Time Network Simulations
Islanding Control
Microgrid Control
Data Mining
Weather, Supply, Demand ForecastsAdvanced Materials
Superconductors
HVDC
10‐25 years
Vignette
Now‐ 3 years
3‐10 years
10‐25 years
Now‐ 3 years
3‐10 years
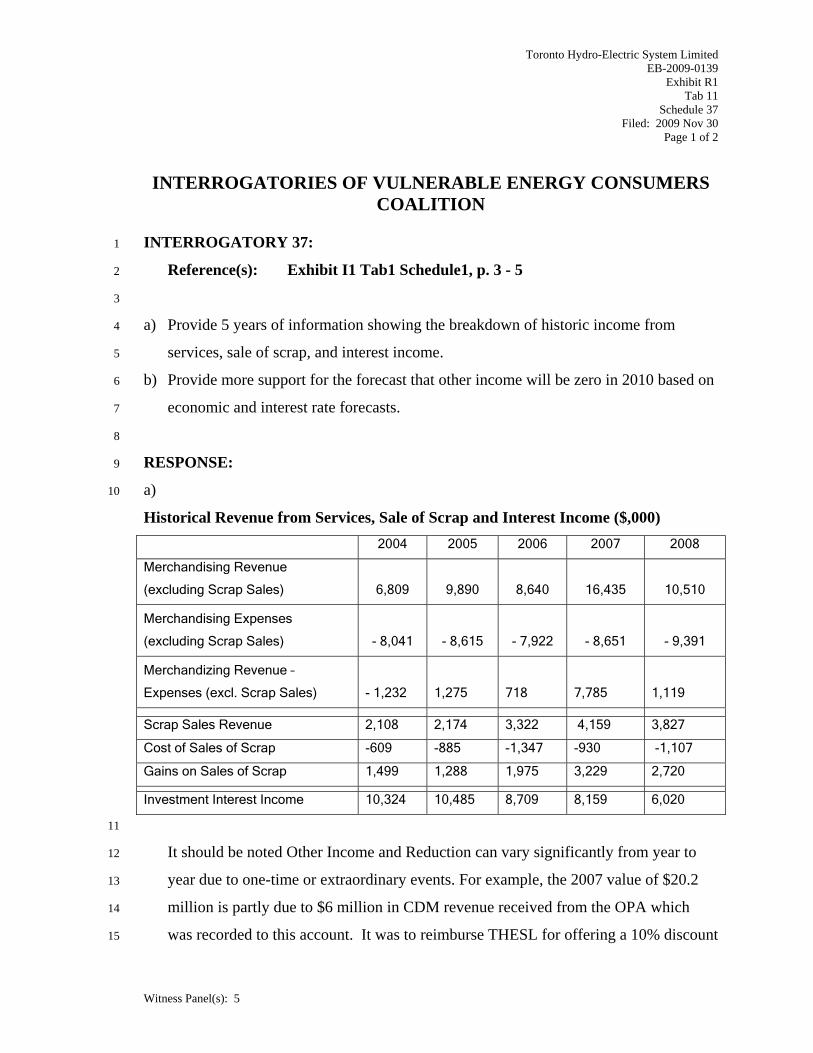
Toronto Hydro-Electric System Limited EB-2009-0139
Exhibit R1 Tab 11
Schedule 37 Filed: 2009 Nov 30
Page 1 of 2
INTERROGATORIES OF VULNERABLE ENERGY CONSUMERS COALITION
Witness Panel(s): 5
INTERROGATORY 37: 1
Reference(s): Exhibit I1 Tab1 Schedule1, p. 3 - 5 2
3
a) Provide 5 years of information showing the breakdown of historic income from 4
services, sale of scrap, and interest income. 5
b) Provide more support for the forecast that other income will be zero in 2010 based on 6
economic and interest rate forecasts. 7
8
RESPONSE: 9
a) 10
Historical Revenue from Services, Sale of Scrap and Interest Income ($,000) 2004 2005 2006 2007 2008
Merchandising Revenue
(excluding Scrap Sales) 6,809 9,890 8,640 16,435 10,510
Merchandising Expenses
(excluding Scrap Sales) - 8,041 - 8,615 - 7,922 - 8,651 - 9,391
Merchandizing Revenue –
Expenses (excl. Scrap Sales) - 1,232 1,275 718 7,785 1,119
Scrap Sales Revenue 2,108 2,174 3,322 4,159 3,827
Cost of Sales of Scrap -609 -885 -1,347 -930 -1,107
Gains on Sales of Scrap 1,499 1,288 1,975 3,229 2,720
Investment Interest Income 10,324 10,485 8,709 8,159 6,020
11
It should be noted Other Income and Reduction can vary significantly from year to 12
year due to one-time or extraordinary events. For example, the 2007 value of $20.2 13
million is partly due to $6 million in CDM revenue received from the OPA which 14
was recorded to this account. It was to reimburse THESL for offering a 10% discount 15
Toronto Hydro-Electric System Limited EB-2009-0139
Exhibit R1 Tab 11
Schedule 37 Filed: 2009 Nov 30
Page 2 of 2
INTERROGATORIES OF VULNERABLE ENERGY CONSUMERS COALITION
Witness Panel(s): 5
to commercial customers achieving 10% load reduction as a conservation measure. 1
THESL also receives investment tax credits, in varying amounts from time to time, 2
due to research and development, which are difficult to forecast. This amount, while 3
booked to Other Revenue, is not a Revenue Offset. 4
5
b) Investment income depends on interest rate and amount of cash in hand. Currently the 6
interest rate on short term cash investments is only about 0.25%. Also, due to the 7
significant increase in capital spending in the Test Year, available cash for short- term 8
investment will be diminished. 9
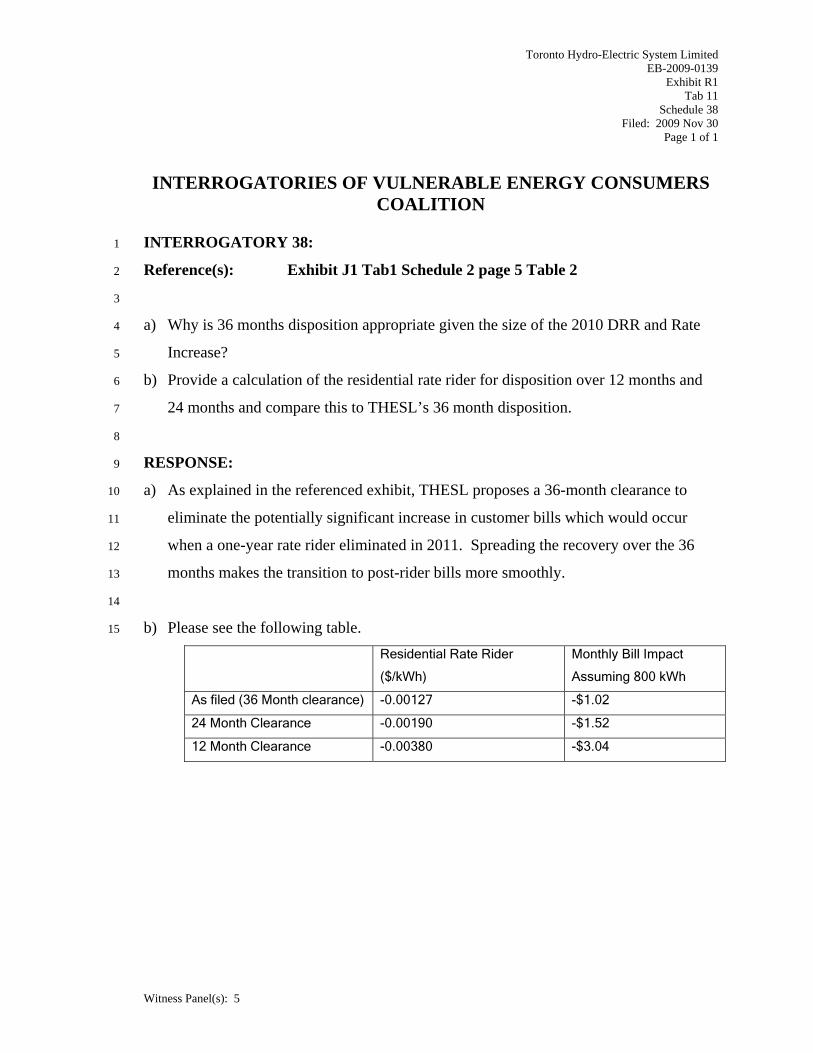
Toronto Hydro-Electric System Limited EB-2009-0139
Exhibit R1 Tab 11
Schedule 38 Filed: 2009 Nov 30
Page 1 of 1
INTERROGATORIES OF VULNERABLE ENERGY CONSUMERS COALITION
Witness Panel(s): 5
INTERROGATORY 38: 1
Reference(s): Exhibit J1 Tab1 Schedule 2 page 5 Table 2 2
3
a) Why is 36 months disposition appropriate given the size of the 2010 DRR and Rate 4
Increase? 5
b) Provide a calculation of the residential rate rider for disposition over 12 months and 6
24 months and compare this to THESL’s 36 month disposition. 7
8
RESPONSE: 9
a) As explained in the referenced exhibit, THESL proposes a 36-month clearance to 10
eliminate the potentially significant increase in customer bills which would occur 11
when a one-year rate rider eliminated in 2011. Spreading the recovery over the 36 12
months makes the transition to post-rider bills more smoothly. 13
14
b) Please see the following table. 15
Residential Rate Rider
($/kWh)
Monthly Bill Impact
Assuming 800 kWh
As filed (36 Month clearance) -0.00127 -$1.02
24 Month Clearance -0.00190 -$1.52
12 Month Clearance -0.00380 -$3.04
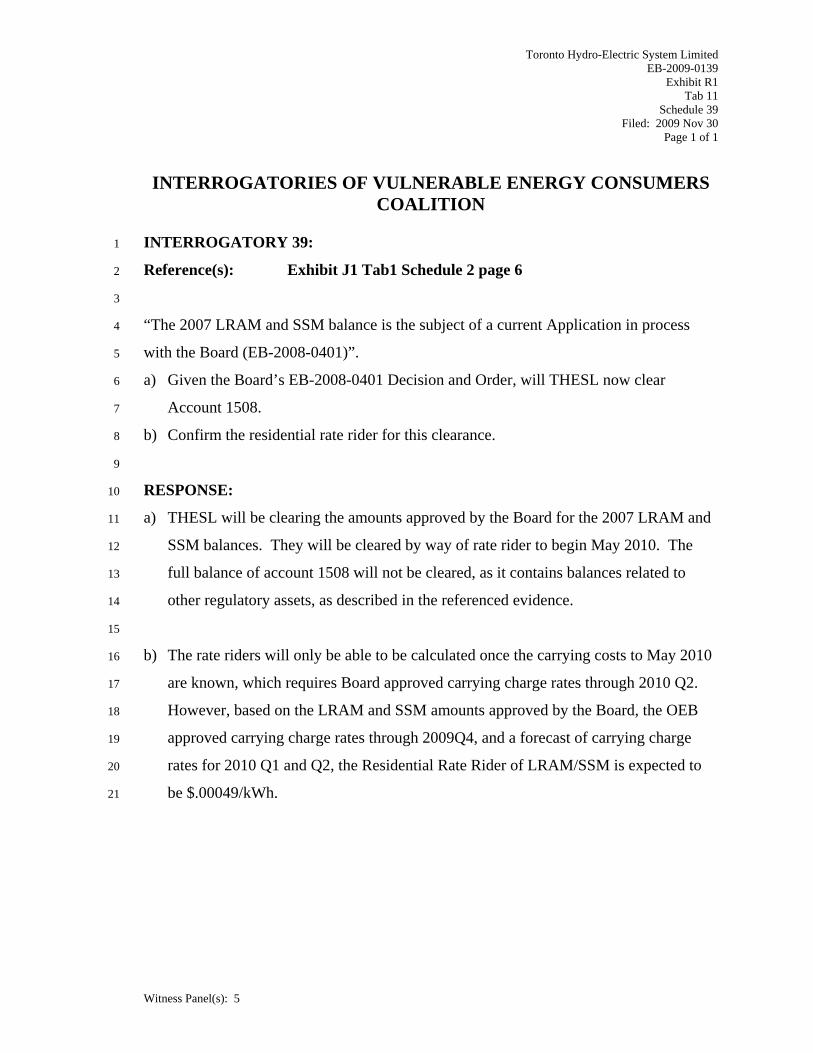
Toronto Hydro-Electric System Limited EB-2009-0139
Exhibit R1 Tab 11
Schedule 39 Filed: 2009 Nov 30
Page 1 of 1
INTERROGATORIES OF VULNERABLE ENERGY CONSUMERS COALITION
Witness Panel(s): 5
INTERROGATORY 39: 1
Reference(s): Exhibit J1 Tab1 Schedule 2 page 6 2
3
“The 2007 LRAM and SSM balance is the subject of a current Application in process 4
with the Board (EB-2008-0401)”. 5
a) Given the Board’s EB-2008-0401 Decision and Order, will THESL now clear 6
Account 1508. 7
b) Confirm the residential rate rider for this clearance. 8
9
RESPONSE: 10
a) THESL will be clearing the amounts approved by the Board for the 2007 LRAM and 11
SSM balances. They will be cleared by way of rate rider to begin May 2010. The 12
full balance of account 1508 will not be cleared, as it contains balances related to 13
other regulatory assets, as described in the referenced evidence. 14
15
b) The rate riders will only be able to be calculated once the carrying costs to May 2010 16
are known, which requires Board approved carrying charge rates through 2010 Q2. 17
However, based on the LRAM and SSM amounts approved by the Board, the OEB 18
approved carrying charge rates through 2009Q4, and a forecast of carrying charge 19
rates for 2010 Q1 and Q2, the Residential Rate Rider of LRAM/SSM is expected to 20
be $.00049/kWh. 21
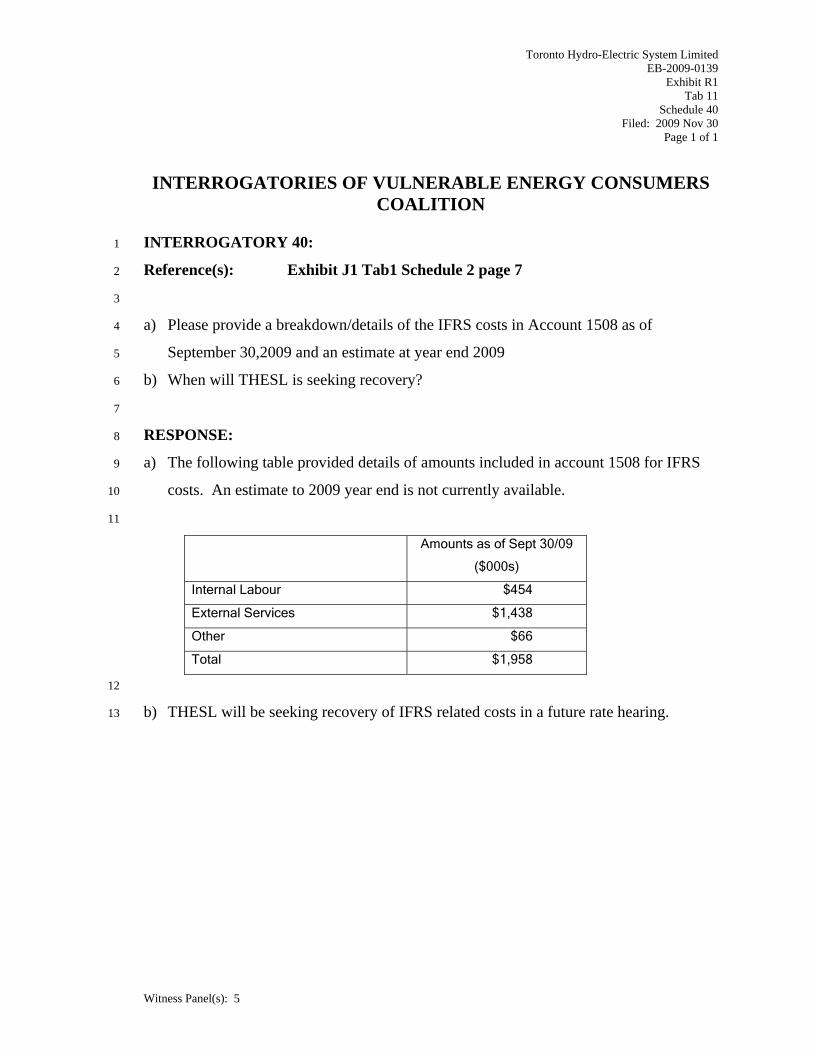
Toronto Hydro-Electric System Limited EB-2009-0139
Exhibit R1 Tab 11
Schedule 40 Filed: 2009 Nov 30
Page 1 of 1
INTERROGATORIES OF VULNERABLE ENERGY CONSUMERS COALITION
Witness Panel(s): 5
INTERROGATORY 40: 1
Reference(s): Exhibit J1 Tab1 Schedule 2 page 7 2
3
a) Please provide a breakdown/details of the IFRS costs in Account 1508 as of 4
September 30,2009 and an estimate at year end 2009 5
b) When will THESL is seeking recovery? 6
7
RESPONSE: 8
a) The following table provided details of amounts included in account 1508 for IFRS 9
costs. An estimate to 2009 year end is not currently available. 10
11
Amounts as of Sept 30/09
($000s)
Internal Labour $454
External Services $1,438
Other $66
Total $1,958
12
b) THESL will be seeking recovery of IFRS related costs in a future rate hearing. 13
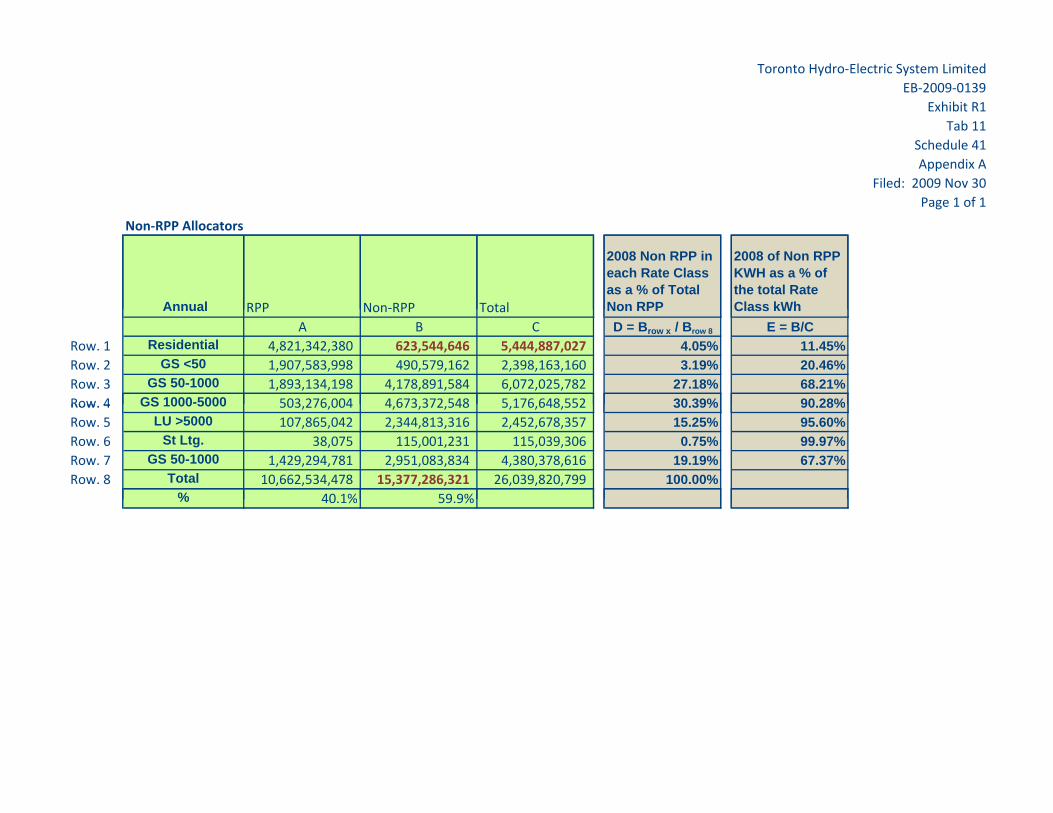
Toronto Hydro‐Electric System LimitedEB‐2009‐0139
Exhibit R1Tab 11
Schedule 41Appendix A
Filed: 2009 Nov 30Page 1 of 1
Non‐RPP Allocators
Annual RPP Non‐RPP Total
2008 Non RPP in each Rate Class as a % of Total Non RPP
2008 of Non RPP KWH as a % of the total Rate Class kWh Annual RPP Non RPP Total Non RPP Class kWh
A B C D = Brow x / Brow 8 E = B/CRow. 1 Residential 4,821,342,380 623,544,646 5,444,887,027 4.05% 11.45%Row. 2 GS <50 1,907,583,998 490,579,162 2,398,163,160 3.19% 20.46%Row. 3 GS 50-1000 1,893,134,198 4,178,891,584 6,072,025,782 27.18% 68.21%Row. 4 GS 1000-5000 503,276,004 4,673,372,548 5,176,648,552 30.39% 90.28%Row. 4 GS 1000 5000 503,276,004 4,673,372,548 5,176,648,552 30.39% 90.28%Row. 5 LU >5000 107,865,042 2,344,813,316 2,452,678,357 15.25% 95.60%Row. 6 St Ltg. 38,075 115,001,231 115,039,306 0.75% 99.97%Row. 7 GS 50-1000 1,429,294,781 2,951,083,834 4,380,378,616 19.19% 67.37%Row. 8 Total 10,662,534,478 15,377,286,321 26,039,820,799 100.00%
% 40.1% 59.9%% 40.1% 59.9%
Toronto Hydro-Electric System Limited EB-2009-0139
Exhibit R1 Tab 11
Schedule 41 Filed: 2009 Nov 30
Page 1 of 1
INTERROGATORIES OF VULNERABLE ENERGY CONSUMERS COALITION
Witness Panel(s): 5
INTERROGATORY 41: 1
Reference(s): Exhibit J1 Tab1 Schedule 2 page 8 and Tables 3 and 4 2
3
In the case of the RSVA Power, the portion which is related to Global Adjustment, and 4
has been collected only from customers who are non-RPP customers, is allocated based 5
on estimates of the load to non-RPP customers in each rate class. 6
a) Provide a schedule that shows the basis of this allocation – the number of non-RPP 7
customers and associated load over the period for the Residential Class. 8
b) Reconcile the allocation with the percentages shown in Table 3 and the rate riders in 9
Table 4. 10
11
RESPONSE: 12
a) Please see Appendix A of this Schedule for the Non RPP allocations. The allocations 13
are based solely on Non-RPP loads in each class, not customers. 14
15
b) Exhibit J1, Tab 2, Schedule 10, page 2 details the derivation of the rate riders shown 16
in Table 4, including the allocations shown in Table 3. 17

Toronto Hydro-Electric System Limited EB-2009-0139
Exhibit R1 Tab 11
Schedule 42 Filed: 2009 Nov 30
Page 1 of 2
INTERROGATORIES OF VULNERABLE ENERGY CONSUMERS COALITION
Witness Panel(s): 5
INTERROGATORY 42: 1
Reference(s): Exhibit K1/Tab 1/Schedule 1, page 1 2
3
a) Please reconcile the $540.5 M Total Distribution Revenue for 2010 reported here 4
with the values ($547.5 M & $528.7 M) reported in Exhibit J1, Tab 1, Schedule 1, 5
Table 1 for 2010. 6
b) Please explain what is meant by Note 3 to Table 1 regarding the Distribution Revenue 7
not including the adjustment for the Transformer allowance. 8
c) Please provide a schedule that sets out the 2010 distribution revenues at the proposed 9
rates by customer class. Please show both the rates and volumes for each class, 10
where the rates: 11
i. exclude the Smart Meter Adder, 12
ii. exclude Hydro One Networks’ LV costs and 13
iii. reflect the discount for transformer ownership where appropriate. 14
d) Please provide a schedule that sets out the revenues by customer class based on 2009 15
approve rates and 2010 forecast billing determinants. Please show both the rates and 16
volumes for each class, where the rates: 17
i. exclude the Smart Meter Adder, 18
ii. exclude Hydro One Networks’ LV costs and 19
iii. reflect the discount for transformer ownership where appropriate. 20
Please reconcile the results with the $476.8 value implicit in Exhibit J1, Tab 1, 21
Schedule 1 (i.e., $495.5-18.7). 22
23
RESPONSE: 24
a) As indicated in the notes to Table 1 in Exhibit K1, Tab 1, Schedule 1, page 1, the 25
revenue figures do not include the adjustment for Transformer allowance costs. The 26

Toronto Hydro-Electric System Limited EB-2009-0139
Exhibit R1 Tab 11
Schedule 42 Filed: 2009 Nov 30
Page 2 of 2
INTERROGATORIES OF VULNERABLE ENERGY CONSUMERS COALITION
Witness Panel(s): 5
Base Revenue requirement of $528.7M must be grossed up to account for $11.7M in 1
transformer allowance paid to customers who own their own transformation assets. 2
The remaining difference of 0.1M is due to rounding. 3
4
b) Please see (a) above. 5
6
c) The requested information is provided in Appendix A to this Schedule, labelled 7
VECC 42c. Note that the first two items listed are not included in distribution 8
charges. The transformer allowance has been removed from the total revenues for the 9
GS 50-999kW, GS 1000-4999kW, and the Large User classes. 10
11
d) The requested information is provided in Appendix B to this Schedule, labelled 12
VECC 42d. Note that the first two items listed are not included in distribution 13
charges. The transformer allowance has been removed from the total revenues for the 14
GS 50-999kW, GS 1000-4999kW, and the Large User classes. 15
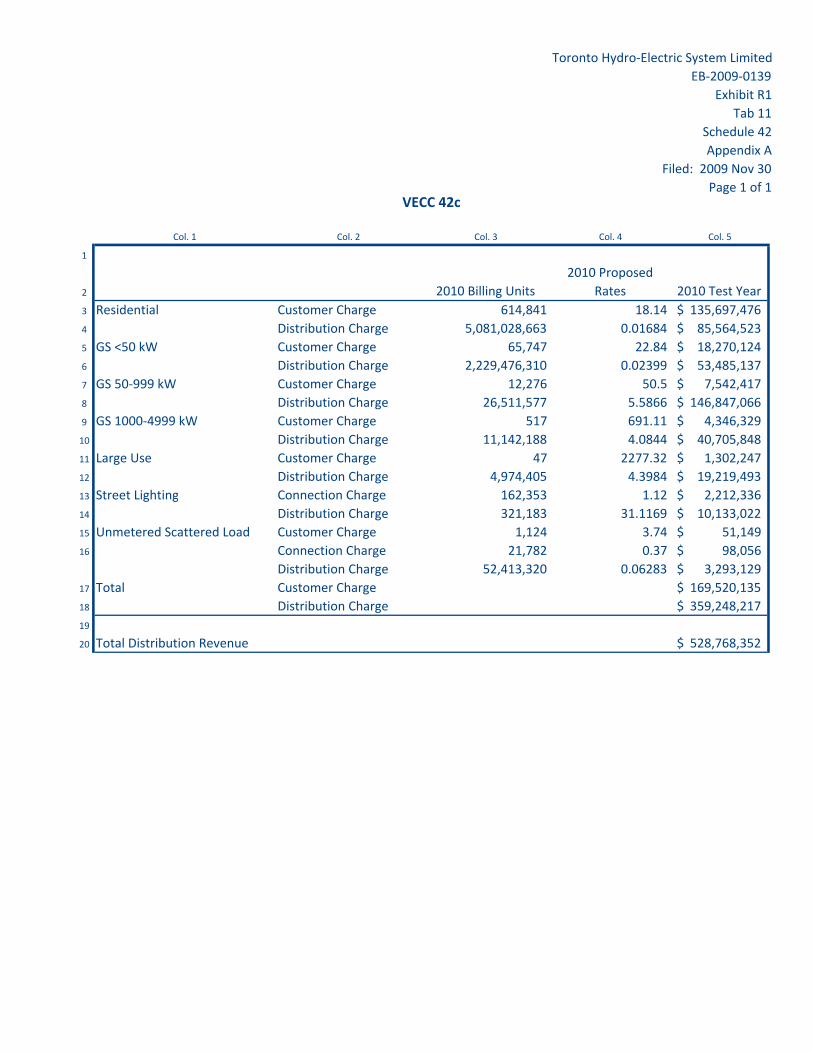
Toronto Hydro‐Electric System LimitedEB‐2009‐0139
Exhibit R1Tab 11
Schedule 42Appendix A
Filed: 2009 Nov 30Page 1 of 1
Col. 1 Col. 2 Col. 3 Col. 4 Col. 5
1
2 2010 Billing Units2010 Proposed
Rates 2010 Test Year3 Residential Customer Charge 614,841 18.14 135,697,476$ 4 Distribution Charge 5,081,028,663 0.01684 85,564,523$ 5 GS <50 kW Customer Charge 65,747 22.84 18,270,124$ 6 Distribution Charge 2,229,476,310 0.02399 53,485,137$ 7 GS 50‐999 kW Customer Charge 12,276 50.5 7,542,417$ 8 Distribution Charge 26,511,577 5.5866 146,847,066$ 9 GS 1000‐4999 kW Customer Charge 517 691.11 4,346,329$ 10 Distribution Charge 11,142,188 4.0844 40,705,848$ 11 Large Use Customer Charge 47 2277.32 1,302,247$ 12 Distribution Charge 4,974,405 4.3984 19,219,493$ 13 Street Lighting Connection Charge 162,353 1.12 2,212,336$ 14 Distribution Charge 321,183 31.1169 10,133,022$ 15 Unmetered Scattered Load Customer Charge 1,124 3.74 51,149$ 16 Connection Charge 21,782 0.37 98,056$
Distribution Charge 52,413,320 0.06283 3,293,129$ 17 Total Customer Charge 169,520,135$ 18 Distribution Charge 359,248,217$ 19
20 Total Distribution Revenue 528,768,352$
VECC 42c
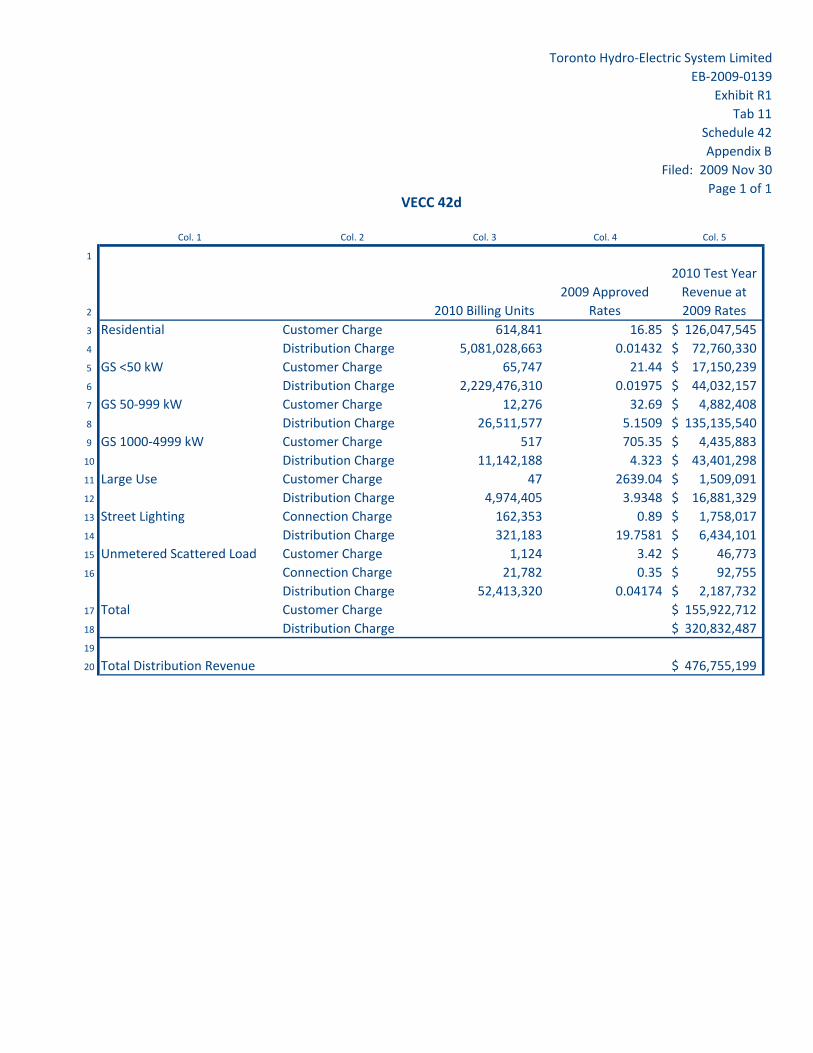
Toronto Hydro‐Electric System LimitedEB‐2009‐0139
Exhibit R1Tab 11
Schedule 42Appendix B
Filed: 2009 Nov 30Page 1 of 1
Col. 1 Col. 2 Col. 3 Col. 4 Col. 5
1
2 2010 Billing Units2009 Approved
Rates
2010 Test Year Revenue at 2009 Rates
3 Residential Customer Charge 614,841 16.85 126,047,545$ 4 Distribution Charge 5,081,028,663 0.01432 72,760,330$ 5 GS <50 kW Customer Charge 65,747 21.44 17,150,239$ 6 Distribution Charge 2,229,476,310 0.01975 44,032,157$ 7 GS 50‐999 kW Customer Charge 12,276 32.69 4,882,408$ 8 Distribution Charge 26,511,577 5.1509 135,135,540$ 9 GS 1000‐4999 kW Customer Charge 517 705.35 4,435,883$ 10 Distribution Charge 11,142,188 4.323 43,401,298$ 11 Large Use Customer Charge 47 2639.04 1,509,091$ 12 Distribution Charge 4,974,405 3.9348 16,881,329$ 13 Street Lighting Connection Charge 162,353 0.89 1,758,017$ 14 Distribution Charge 321,183 19.7581 6,434,101$ 15 Unmetered Scattered Load Customer Charge 1,124 3.42 46,773$ 16 Connection Charge 21,782 0.35 92,755$
Distribution Charge 52,413,320 0.04174 2,187,732$ 17 Total Customer Charge 155,922,712$ 18 Distribution Charge 320,832,487$ 19
20 Total Distribution Revenue 476,755,199$
VECC 42d
Toronto Hydro-Electric System Limited EB-2009-0139
Exhibit R1 Tab 11
Schedule 43 Filed: 2009 Nov 30
Page 1 of 4
INTERROGATORIES OF VULNERABLE ENERGY CONSUMERS COALITION
Witness Panel(s): 5
INTERROGATORY 43: 1
Reference(s): Exhibit K1/Tab 1/Schedule 1, pages 4-8 2
3
a) In its EB-2007-0680 Report (page 33) the Board directed Toronto Hydro to work 4
with other parties to understand differences in load forecast methodologies employed. 5
• Please outline what activities Toronto Hydro undertook in response to the Board’s 6
direction. 7
• Is the changed load forecast methodology the result of this initiative? 8
b) In their 2010 Rate Applications many of the other electricity distributors in the 9
province (e.g., Festival, Oakville, Orangeville and Burlington) have expressed 10
concerns about the quality of their monthly customer usage data and the 11
inappropriateness of using it to model monthly customer sales by class. 12
• Is Toronto Hydro aware of these concerns? 13
• What is different about Toronto Hydro’s data that makes it acceptable for 14
modelling purposes? 15
c) Page 6 indicates that the main drivers of load growth over time are economic 16
conditions, while the primary driver of year over year changes is weather. The 17
Application states that economic conditions are captured by customer, population and 18
time trend variables. Did Toronto test any model specifications that included more 19
direct indicators of economic conditions such as GDP? If not, why not? If yes, what 20
were the results and why were these models rejected? 21
d) The customer class usage inputs used (per Exhibit K1, Tab 2, Schedule 1) are 22
reported as purchased kWh. Please clarify if this is meant to reflect “customer 23
purchases” or “wholesale purchases by Toronto Hydro” to supply the customers. If 24
the latter, what loss factors were used to determine the wholesale purchases in each 25
year and how were these loss factor calculated? 26
Toronto Hydro-Electric System Limited EB-2009-0139
Exhibit R1 Tab 11
Schedule 43 Filed: 2009 Nov 30
Page 2 of 4
INTERROGATORIES OF VULNERABLE ENERGY CONSUMERS COALITION
Witness Panel(s): 5
1
RESPONSE: 2
a) EB-2007-0680 Report (page 33) the Board states: “Going forward, the Board 3
encourages the Applicant to work with OPA, IESO, and perhaps others to understand 4
differences in methodology employed by each… The Applicant can make a very 5
important contribution to the sector by working with stakeholders to bring needed 6
clarity to this aspect of forecasting and utility operations.” (emphasis added). The 7
Board did not direct, but only advised THESL (and indirectly, other stakeholders) to 8
exchange information on certain load forecasting issues and to contribute to the 9
developing of common approaches in treating some of those issues. 10
11
Since summer 2008THESL has been making efforts to increase familiarization with 12
other utilities’ load forecasting models, including the utilities outside of the province 13
(within North America). In particular, THESL took part in two Load Forecasting 14
conferences organized by “Itron” in the US (September 2008 and April 2009) and 15
participated in the inaugural LDC load forecasting forum hosted by the IESO in 16
November 2009. 17
18
THESL finds that although the set of load forecasting issues being faced by all 19
distributors is similar, service territory and customer base characteristics likely 20
significantly influence the set of explanatory variables best suitable for their load 21
modeling. Going forward THESL plans to continue working in this direction. 22
23
THESL made a decision to change its forecasting model because the previously used 24
regression specifications were not satisfactorily capturing the most recent loads 25
experienced by THESL. This conclusion was made based on ongoing testing of the 26
Toronto Hydro-Electric System Limited EB-2009-0139
Exhibit R1 Tab 11
Schedule 43 Filed: 2009 Nov 30
Page 3 of 4
INTERROGATORIES OF VULNERABLE ENERGY CONSUMERS COALITION
Witness Panel(s): 5
previous regression model taking place on the monthly basis since summer 2008. To 1
define the main directions for model improvement, THESL explored and attempted to 2
incorporate some of the successful methodologies other utilities were using. Those 3
ideas where thoroughly tested in terms of their applicability to THESL’s load 4
modeling. The load forecasting models filed in support of this filing are the result of 5
detailed historic load analysis and statistical testing of various explanatory variables 6
and their combinations for each customer class. 7
8
b) THESL is aware of the fact that distributors around the province (and outside of it) 9
are concerned about the quality of their monthly billing data. 10
11
THESL has never stated in its evidence that class billing data were directly used as 12
dependent variables in its models. As was done in the previous rate application 13
approved by the Board, THESL’s load data begins with total purchased energy data. 14
This time, however, total purchased energy monthly amounts are allocated by 15
customer class using proportions based on the calendarized class billing data. This 16
way THESL ensures the use of the most reliable available data (purchased energy on 17
the wholesale level) as well as capturing the differences in class load behaviour and 18
extrapolating them into the forecast period. The detailed explanation of how total 19
purchased energy is allocated between rate classes is provided in Board Staff 20
Interrogatory #8. 21
22
Generally, since the main purpose of the load forecast is for the development of rates 23
for each customer class, it is impossible not to incorporate (directly or indirectly) 24
class billing consumption data at some stage of the load forecasting process. 25
26
Toronto Hydro-Electric System Limited EB-2009-0139
Exhibit R1 Tab 11
Schedule 43 Filed: 2009 Nov 30
Page 4 of 4
INTERROGATORIES OF VULNERABLE ENERGY CONSUMERS COALITION
Witness Panel(s): 5
c) THESL did test different direct indicators of economic conditions. Among them: 1
Toronto GDP, Housing market information on Sales, Completions and Starts (raw 2
and lagged data), Industrial, Commercial and Residential building permits (raw and 3
lagged data) and others. These variables were not included in the final set of 4
explanatory variables because they were found to be statistically insignificant and 5
added no additional explanatory value to the regression models (in particular, the 6
Adjusted-R2 was lower than for the regressions filed in the evidence). Please refer to 7
the Board Staff Interrogatory #7d) to for details on the model estimation with Toronto 8
GDP included in the set of explanatory variables. 9
10
d) The term “purchased energy, kWh” is used in the filed evidence to reflect “wholesale 11
purchases by Toronto Hydro to supply its customers”. Loss factors used are current 12
Board approved loss factors. 13
Toronto Hydro-Electric System Limited EB-2009-0139
Exhibit R1 Tab 11
Schedule 44 Filed: 2009 Nov 30
Page 1 of 2
INTERROGATORIES OF VULNERABLE ENERGY CONSUMERS COALITION
Witness Panel(s): 5
INTERROGATORY 44: 1
Reference(s): Exhibit K1/Tab 1/Schedule 1, pages 9-10 2
3
a) Page 8 notes that customer counts were forecast based on trend analysis. Using such 4
an approach, how do the population and customer count forecasts capture economic 5
conditions (as suggested on page 6)? 6
b) Please provide a schedule that sets out for each class the year over year growth rate in 7
customer/connection count from 2002-2010. 8
c) Please provide Toronto’s actual customer count by class for the most recent month 9
available. 10
d) Please show the derivation of the 2009 and 2010 Residential class customer counts 11
and how the increase in individually metered suites was specifically factored in. 12
13
RESPONSE: 14
a) Extrapolation and trend forecasting techniques have demonstrated their value in 15
forecasting population and customer numbers in the past. Generally, because 16
customer numbers and population do not experience significant short-term swings – 17
unlike loads - extrapolation techniques are quite acceptable as forecasting methods 18
for such variables. Furthermore, as the most recent actual data is included in the 19
development of these models, recent experience is being captured within them, 20
making them very suitable for short-term forecasts such as one or two years. 21
22
b) For the requested schedule please refer to Exhibit R1, Tab11, Schedule 44, 23
Appendix A. 24
25
c) Please see the table below. 26
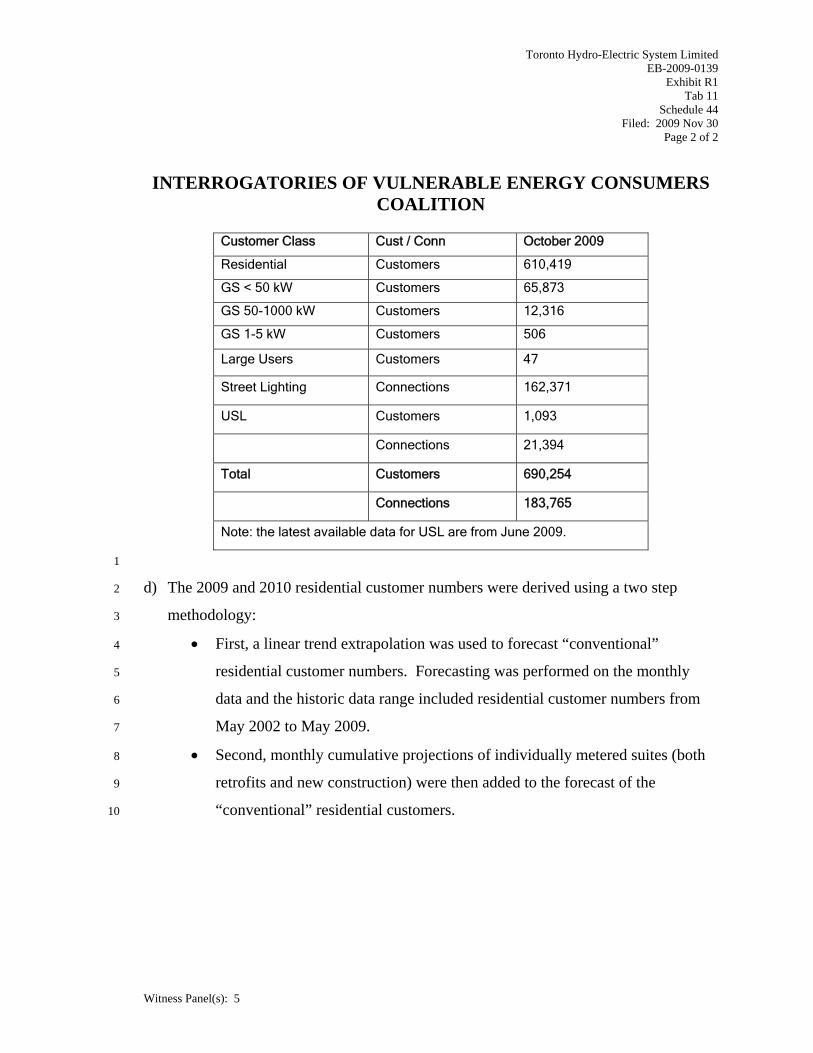
Toronto Hydro-Electric System Limited EB-2009-0139
Exhibit R1 Tab 11
Schedule 44 Filed: 2009 Nov 30
Page 2 of 2
INTERROGATORIES OF VULNERABLE ENERGY CONSUMERS COALITION
Witness Panel(s): 5
Customer Class Cust / Conn October 2009
Residential Customers 610,419
GS < 50 kW Customers 65,873
GS 50-1000 kW Customers 12,316
GS 1-5 kW Customers 506
Large Users Customers 47
Street Lighting Connections 162,371
USL Customers 1,093
Connections 21,394
Total Customers 690,254
Connections 183,765
Note: the latest available data for USL are from June 2009.
1
d) The 2009 and 2010 residential customer numbers were derived using a two step 2
methodology: 3
• First, a linear trend extrapolation was used to forecast “conventional” 4
residential customer numbers. Forecasting was performed on the monthly 5
data and the historic data range included residential customer numbers from 6
May 2002 to May 2009. 7
• Second, monthly cumulative projections of individually metered suites (both 8
retrofits and new construction) were then added to the forecast of the 9
“conventional” residential customers. 10
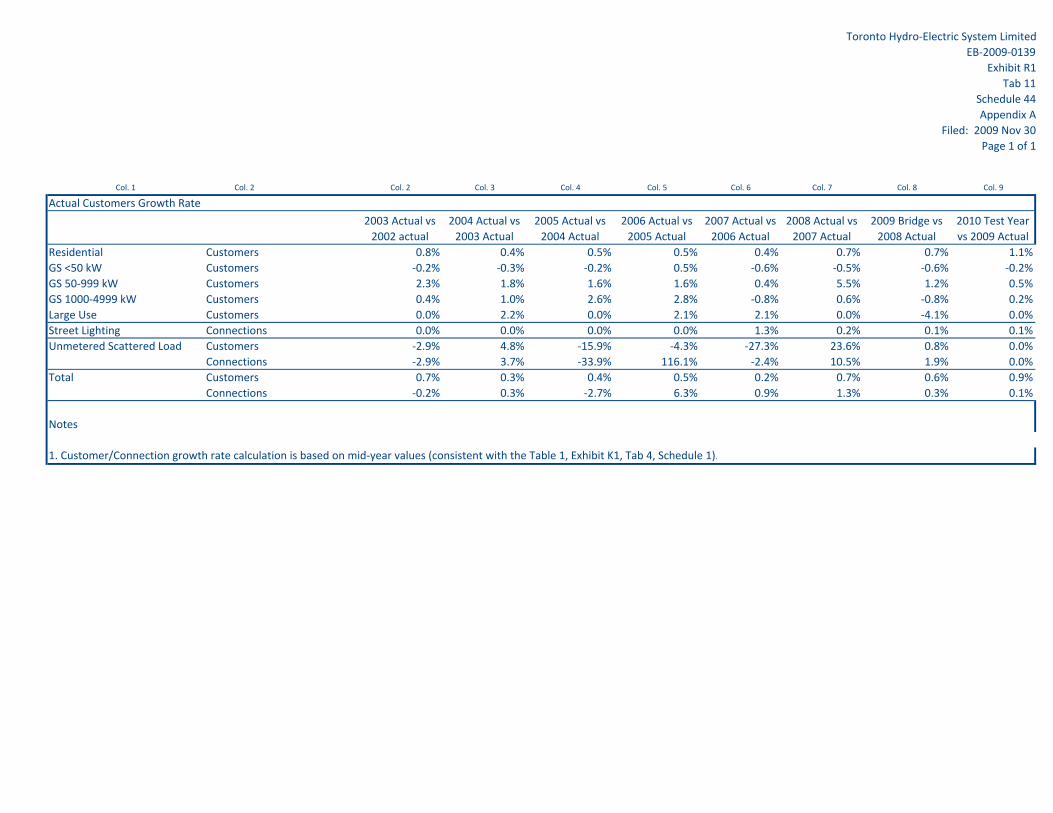
Toronto Hydro‐Electric System LimitedEB‐2009‐0139
Exhibit R1Tab 11
Schedule 44Appendix A
Filed: 2009 Nov 30Page 1 of 1
Col. 1 Col. 2 Col. 2 Col. 3 Col. 4 Col. 5 Col. 6 Col. 7 Col. 8 Col. 9
Actual Customers Growth Rate
2003 Actual vs2002 actual
2004 Actual vs2003 Actual
2005 Actual vs2004 Actual
2006 Actual vs2005 Actual
2007 Actual vs2006 Actual
2008 Actual vs2007 Actual
2009 Bridge vs2008 Actual
2010 Test Yearvs 2009 Actual
Residential Customers 0.8% 0.4% 0.5% 0.5% 0.4% 0.7% 0.7% 1.1%GS <50 kW Customers ‐0.2% ‐0.3% ‐0.2% 0.5% ‐0.6% ‐0.5% ‐0.6% ‐0.2%GS 50‐999 kW Customers 2.3% 1.8% 1.6% 1.6% 0.4% 5.5% 1.2% 0.5%GS 1000‐4999 kW Customers 0.4% 1.0% 2.6% 2.8% ‐0.8% 0.6% ‐0.8% 0.2%Large Use Customers 0.0% 2.2% 0.0% 2.1% 2.1% 0.0% ‐4.1% 0.0%Street Lighting Connections 0.0% 0.0% 0.0% 0.0% 1.3% 0.2% 0.1% 0.1%Unmetered Scattered Load Customers ‐2.9% 4.8% ‐15.9% ‐4.3% ‐27.3% 23.6% 0.8% 0.0%
Connections ‐2.9% 3.7% ‐33.9% 116.1% ‐2.4% 10.5% 1.9% 0.0%Total Customers 0.7% 0.3% 0.4% 0.5% 0.2% 0.7% 0.6% 0.9%
Connections ‐0.2% 0.3% ‐2.7% 6.3% 0.9% 1.3% 0.3% 0.1%
Notes
1. Customer/Connection growth rate calculation is based on mid‐year values (consistent with the Table 1, Exhibit K1, Tab 4, Schedule 1).

Toronto Hydro-Electric System Limited EB-2009-0139
Exhibit R1 Tab 11
Schedule 45 Filed: 2009 Nov 30
Page 1 of 2
INTERROGATORIES OF VULNERABLE ENERGY CONSUMERS COALITION
Witness Panel(s): 5
INTERROGATORY 45: 1
Reference(s): Exhibit K1/Tab 1/Schedule 2 2
3
a) Are any of Toronto Hydro’s customers registered as Market Participants with the 4
IESO? If yes, what is their total usage over the most recent 12 months and what is 5
their forecast usage for 2010? 6
b) What is the basis for Toronto Hydro’s forecast 5% increase in electricity commodity 7
costs for 2010? 8
c) Please provide an alternative 2010 commodity cost forecast based on forecast 9
purchased energy for 2010 and the forecast commodity cost for 2010 as set out in the 10
Board’s most recent RPP Report (October 2009). For purposes of the forecast price 11
please use the following calculation to determine the average commodity cost for 12
2010: 13
• Weight the forecast HOEP price by the proportion of Toronto Hydro’s sale that 14
are for non-RPP customers 15
• Weight the forecast RPP price by the proportion of Toronto Hydro’s sales that are 16
for RPP customers. 17
18
RESPONSE: 19
a) THESL has one customer registered with IESO as a Market Participant. That 20
customer’s total energy usage based on the most recent 12 months bills amounts to 21
224.1 GWh (October 2008 to September 2009). THESL does not produce a separate 22
forecast for the Market Participant. 23
24

Toronto Hydro-Electric System Limited EB-2009-0139
Exhibit R1 Tab 11
Schedule 45 Filed: 2009 Nov 30
Page 2 of 2
INTERROGATORIES OF VULNERABLE ENERGY CONSUMERS COALITION
Witness Panel(s): 5
b) This is THESL’s forecast of the commodity costs based on professional judgement. 1
Commodity prices are extremely difficult to forecast, as is the Global Adjustment 2
component. 3
4
c) Please see response to BOMA interrogatory #42 at Exhibit R1, Tab 3, Schedule 42. 5
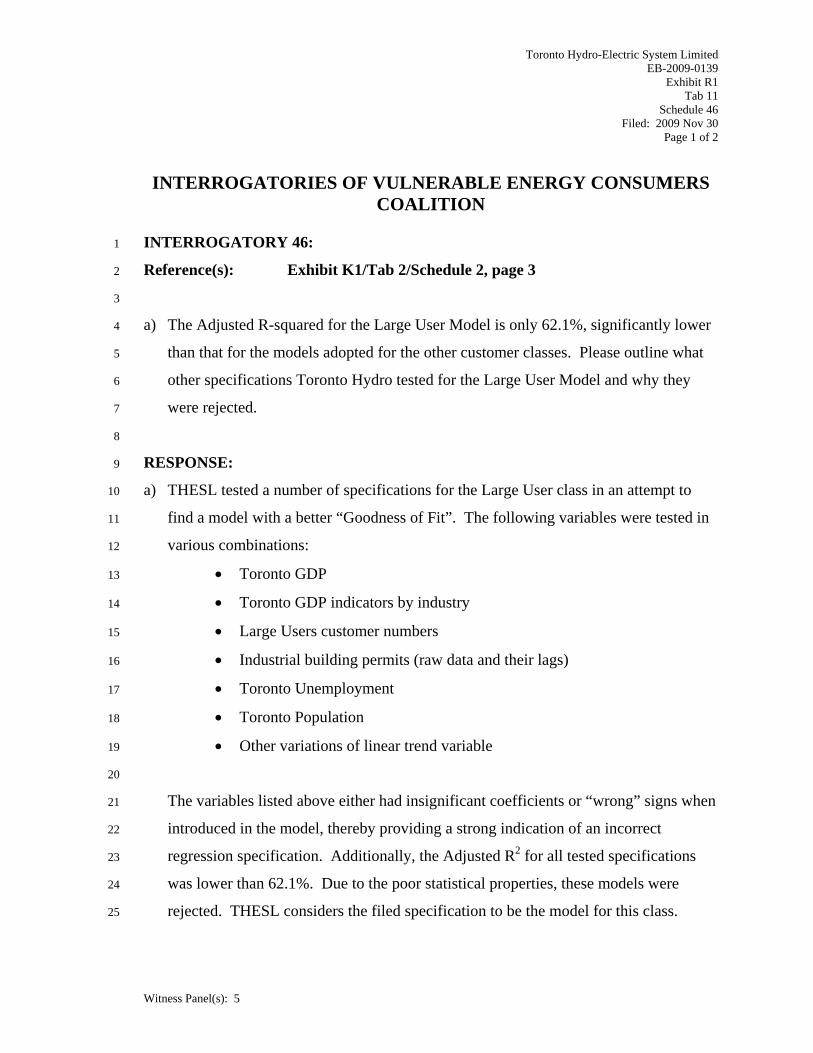
Toronto Hydro-Electric System Limited EB-2009-0139
Exhibit R1 Tab 11
Schedule 46 Filed: 2009 Nov 30
Page 1 of 2
INTERROGATORIES OF VULNERABLE ENERGY CONSUMERS COALITION
Witness Panel(s): 5
INTERROGATORY 46: 1
Reference(s): Exhibit K1/Tab 2/Schedule 2, page 3 2
3
a) The Adjusted R-squared for the Large User Model is only 62.1%, significantly lower 4
than that for the models adopted for the other customer classes. Please outline what 5
other specifications Toronto Hydro tested for the Large User Model and why they 6
were rejected. 7
8
RESPONSE: 9
a) THESL tested a number of specifications for the Large User class in an attempt to 10
find a model with a better “Goodness of Fit”. The following variables were tested in 11
various combinations: 12
• Toronto GDP 13
• Toronto GDP indicators by industry 14
• Large Users customer numbers 15
• Industrial building permits (raw data and their lags) 16
• Toronto Unemployment 17
• Toronto Population 18
• Other variations of linear trend variable 19
20
The variables listed above either had insignificant coefficients or “wrong” signs when 21
introduced in the model, thereby providing a strong indication of an incorrect 22
regression specification. Additionally, the Adjusted R2 for all tested specifications 23
was lower than 62.1%. Due to the poor statistical properties, these models were 24
rejected. THESL considers the filed specification to be the model for this class. 25

Toronto Hydro-Electric System Limited EB-2009-0139
Exhibit R1 Tab 11
Schedule 46 Filed: 2009 Nov 30
Page 2 of 2
INTERROGATORIES OF VULNERABLE ENERGY CONSUMERS COALITION
Witness Panel(s): 5
1
From a general perspective, the fact that Large User model exhibits a lower 2
“Goodness-of-Fit” value as opposed to models used to estimate load for all other 3
classes is somewhat expected, as this class has a small number of customers (47) 4
spanning different sectors (industrial, commercial, institutional), thereby creating 5
a non-homogeneous class. 6
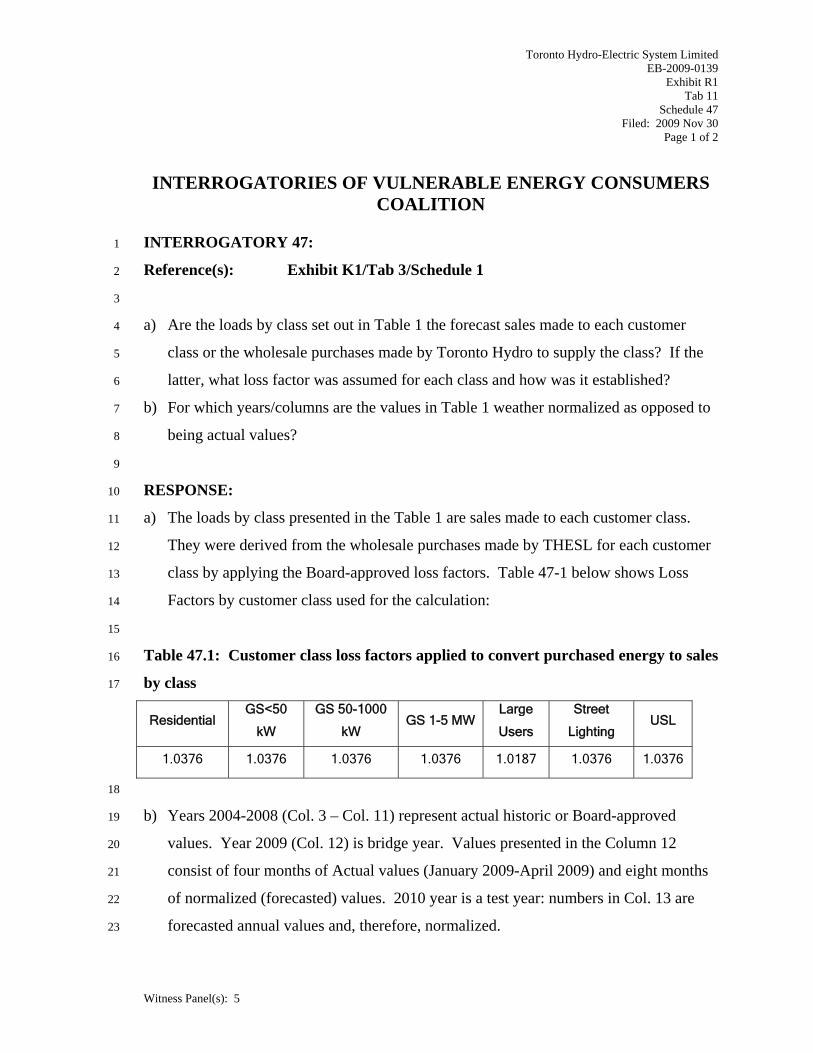
Toronto Hydro-Electric System Limited EB-2009-0139
Exhibit R1 Tab 11
Schedule 47 Filed: 2009 Nov 30
Page 1 of 2
INTERROGATORIES OF VULNERABLE ENERGY CONSUMERS COALITION
Witness Panel(s): 5
INTERROGATORY 47: 1
Reference(s): Exhibit K1/Tab 3/Schedule 1 2
3
a) Are the loads by class set out in Table 1 the forecast sales made to each customer 4
class or the wholesale purchases made by Toronto Hydro to supply the class? If the 5
latter, what loss factor was assumed for each class and how was it established? 6
b) For which years/columns are the values in Table 1 weather normalized as opposed to 7
being actual values? 8
9
RESPONSE: 10
a) The loads by class presented in the Table 1 are sales made to each customer class. 11
They were derived from the wholesale purchases made by THESL for each customer 12
class by applying the Board-approved loss factors. Table 47-1 below shows Loss 13
Factors by customer class used for the calculation: 14
15
Table 47.1: Customer class loss factors applied to convert purchased energy to sales 16
by class 17
Residential GS<50
kW
GS 50-1000
kW GS 1-5 MW
Large
Users
Street
Lighting USL
1.0376 1.0376 1.0376 1.0376 1.0187 1.0376 1.0376
18
b) Years 2004-2008 (Col. 3 – Col. 11) represent actual historic or Board-approved 19
values. Year 2009 (Col. 12) is bridge year. Values presented in the Column 12 20
consist of four months of Actual values (January 2009-April 2009) and eight months 21
of normalized (forecasted) values. 2010 year is a test year: numbers in Col. 13 are 22
forecasted annual values and, therefore, normalized. 23

Toronto Hydro-Electric System Limited EB-2009-0139
Exhibit R1 Tab 11
Schedule 47 Filed: 2009 Nov 30
Page 2 of 2
INTERROGATORIES OF VULNERABLE ENERGY CONSUMERS COALITION
Witness Panel(s): 5
To see weather-normalized annual loads for all years please refer to Table 1, 1
Exhibit K1, Tab 3, Schedule 2. 2
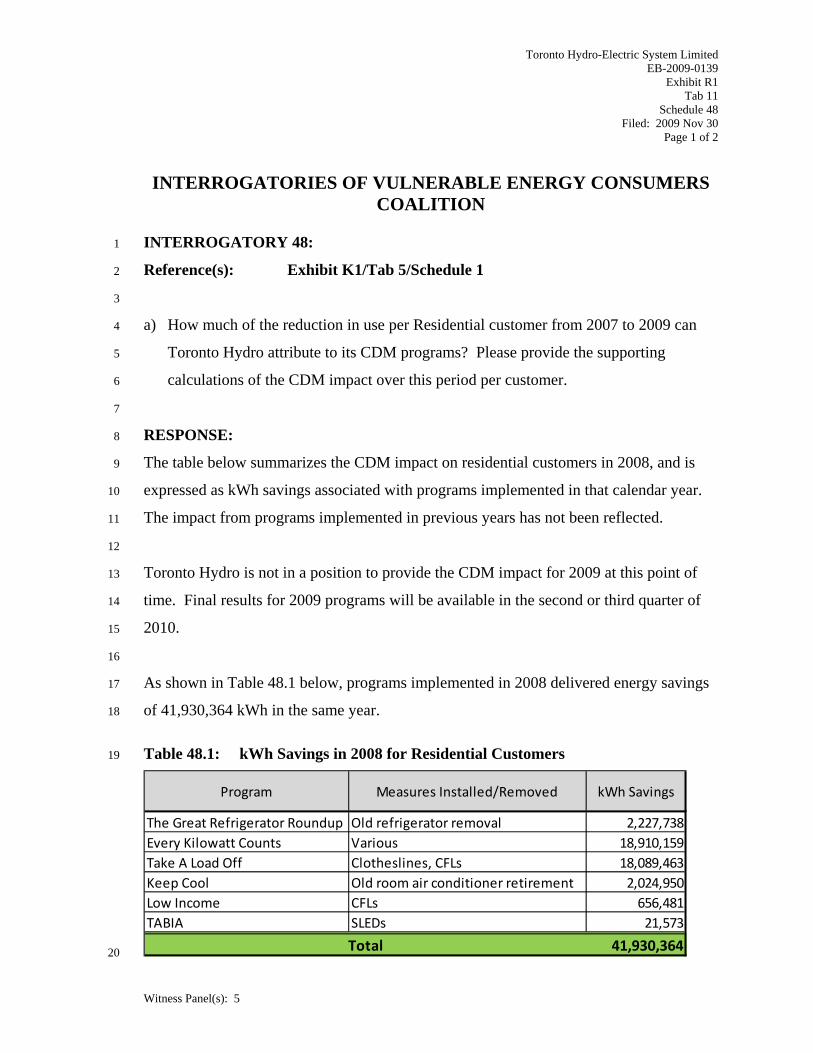
Toronto Hydro-Electric System Limited EB-2009-0139
Exhibit R1 Tab 11
Schedule 48 Filed: 2009 Nov 30
Page 1 of 2
INTERROGATORIES OF VULNERABLE ENERGY CONSUMERS COALITION
Witness Panel(s): 5
INTERROGATORY 48: 1
Reference(s): Exhibit K1/Tab 5/Schedule 1 2
3
a) How much of the reduction in use per Residential customer from 2007 to 2009 can 4
Toronto Hydro attribute to its CDM programs? Please provide the supporting 5
calculations of the CDM impact over this period per customer. 6
7
RESPONSE: 8
The table below summarizes the CDM impact on residential customers in 2008, and is 9
expressed as kWh savings associated with programs implemented in that calendar year. 10
The impact from programs implemented in previous years has not been reflected. 11
12
Toronto Hydro is not in a position to provide the CDM impact for 2009 at this point of 13
time. Final results for 2009 programs will be available in the second or third quarter of 14
2010. 15
16
As shown in Table 48.1 below, programs implemented in 2008 delivered energy savings 17
of 41,930,364 kWh in the same year. 18
Table 48.1: kWh Savings in 2008 for Residential Customers 19
Program Measures Installed/Removed kWh Savings
The Great Refrigerator Roundup Old refrigerator removal 2,227,738Every Kilowatt Counts Various 18,910,159Take A Load Off Clotheslines, CFLs 18,089,463Keep Cool Old room air conditioner retirement 2,024,950Low Income CFLs 656,481TABIA SLEDs 21,573
41,930,364Total 20

Toronto Hydro-Electric System Limited EB-2009-0139
Exhibit R1 Tab 11
Schedule 48 Filed: 2009 Nov 30
Page 2 of 2
INTERROGATORIES OF VULNERABLE ENERGY CONSUMERS COALITION
Witness Panel(s): 5
On average, a reduction of 69 kWh per residential customer can be attributed to CDM 1
programs delivered by Toronto Hydro in 2008. (Please refer to Table 1 in Exhibit K1, 2
Tab 5, Schedule 1 for 2008 number of customers). 3
Toronto Hydro-Electric System Limited EB-2009-0139
Exhibit R1 Tab 11
Schedule 49 Filed: 2009 Nov 30
Page 1 of 1
INTERROGATORIES OF VULNERABLE ENERGY CONSUMERS COALITION
Witness Panel(s): 5
INTERROGATORY 49: 1
Reference(s): Exhibit D1 Tab14 Schedule 1 Page 1 Table 1 2
Exhibit J1, Tab 2, Schedule 7 3
4
a) Please provide more detail of the assumptions and details (lines 2-6) of the WCA 5
calculations in J1 Tab2 Schedule 7. 6
b) Have any of the main assumptions e.g., lag days changed since 2008 Board-7
Approved? If so provide more information on the change(s). 8
c) Will THESL adjust the WCA if the Board approves different amounts for the 9
components used for the WCA? If so when will this occur? 10
11
RESPONSE: 12
a) The calculation of the Working Capital Allowance is based on the Lead/Lag study 13
produced for THESL’s EB-2007-0680 rate filing. THESL has relied on this study to 14
derive the WCA for the 2010 rate year. The calculations use 2010 forecast cost 15
components, and apply weights and lag days as determined in the Lead/Lag study to 16
determine the 2010 WCA. 17
18
b) No, the lag days that were filed in EB-2007-0680 have not changed. 19
20
c) THESL will reflect any changes ordered by the Board for components used to 21
calculate the WCA in its final DRO. 22
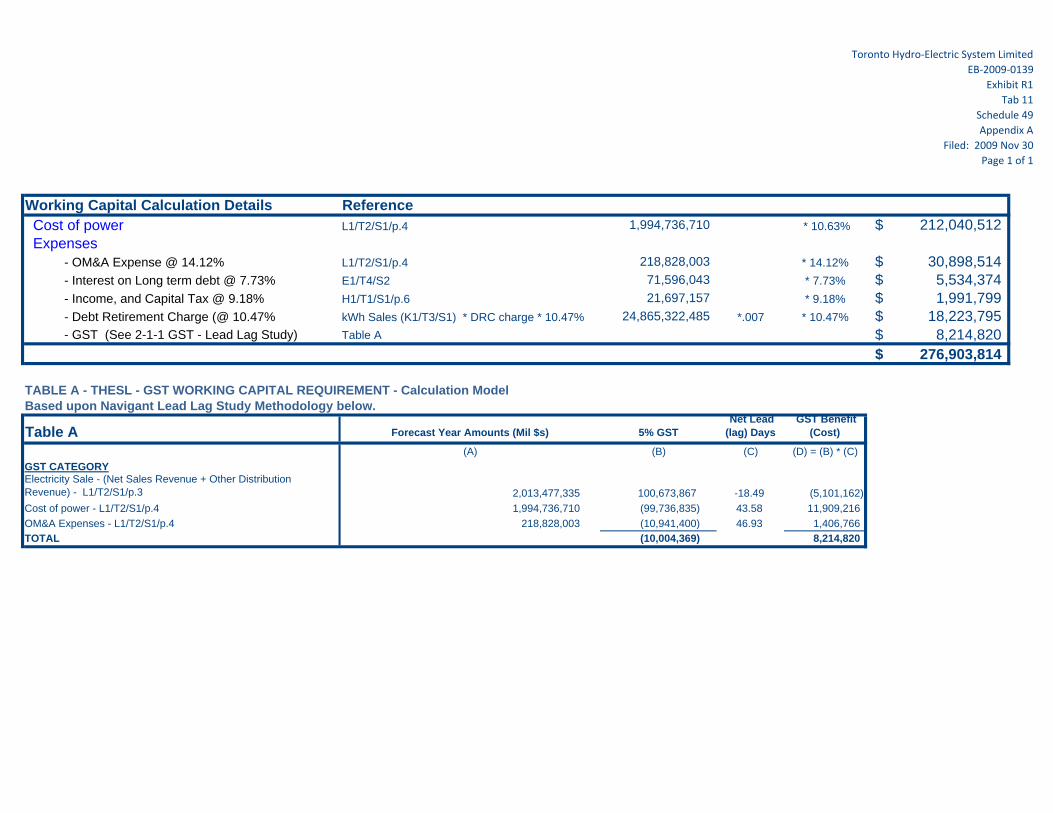
Toronto Hydro‐Electric System LimitedEB‐2009‐0139
Exhibit R1Tab 11
Schedule 49Appendix A
Filed: 2009 Nov 30Page 1 of 1
Working Capital Calculation Details ReferenceCost of power L1/T2/S1/p.4 1,994,736,710 * 10.63% 212,040,512$ Expenses - OM&A Expense @ 14.12% L1/T2/S1/p.4 218,828,003 * 14.12% 30,898,514$ - Interest on Long term debt @ 7.73% E1/T4/S2 71,596,043 * 7.73% 5,534,374$ - Income, and Capital Tax @ 9.18% H1/T1/S1/p.6 21,697,157 * 9.18% 1,991,799$ - Debt Retirement Charge (@ 10.47% kWh Sales (K1/T3/S1) * DRC charge * 10.47% 24,865,322,485 *.007 * 10.47% 18,223,795$ - GST (See 2-1-1 GST - Lead Lag Study) Table A 8,214,820$ 276,903,814$
TABLE A - THESL - GST WORKING CAPITAL REQUIREMENT - Calculation ModelBased upon Navigant Lead Lag Study Methodology below.
Table A Forecast Year Amounts (Mil $s) 5% GSTNet Lead
(lag) Days GST Benefit
(Cost)
(A) (B) (C) (D) = (B) * (C)GST CATEGORYElectricity Sale - (Net Sales Revenue + Other Distribution Revenue) - L1/T2/S1/p.3 2,013,477,335 100,673,867 -18.49 (5,101,162) Cost of power - L1/T2/S1/p.4 1,994,736,710 (99,736,835) 43.58 11,909,216 OM&A Expenses - L1/T2/S1/p.4 218,828,003 (10,941,400) 46.93 1,406,766 TOTAL (10,004,369) 8,214,820
Toronto Hydro-Electric System Limited EB-2009-0139
Exhibit R1 Tab 11
Schedule 50 Filed: 2009 Nov 30
Page 1 of 2
INTERROGATORIES OF VULNERABLE ENERGY CONSUMERS COALITION
Witness Panel(s): 5
INTERROGATORY 50: 1
Reference(s): Exhibit L1 Tab 1 Schedule 1 2
3
a) Please provide an electronic copy of Toronto’s 2010 Cost Allocation model. 4
b) With respect to pages 4-5, please provide a schedule that sets out the transformer 5
allowance provided to each rate class in 2010. Please also explain where and how 6
this “cost” was included in the Cost Allocation model and/or the Rate Design process. 7
c) With respect to pages 4-5, the Board’s Filing Guidelines (revised May 2009 – page 8
20) directed Applicants to: 9
Revise cost allocation by (1) removing the “cost” associated with transformer 10
ownership allowance from the revenue requirement (Worksheet I3) and (2) 11
subtracting the “revenue” associated with the transformer ownership allowance from 12
the approved revenue of the affected rates class(es) (worksheet I6, row 29) 13
Please confirm that this is not the approach used by Toronto Hydro and re-file a 14
version of the Cost Allocation Model that conforms with the Board’s direction. 15
16
RESPONSE: 17
a) An electronic copy has been provided. 18
19
b) As in EB-2007-0680 THESL treated the 2010 Transformer Ownership Allowance by 20
directly assigning the Transformer Ownership Allowance to the rate classes that 21
benefited from customer owned transformers. This removes any of the costs 22
associated with the Transformer Ownership Allowance from the revenue requirement 23
of those rate classes that did not have any customers with their own transformers. In 24
THESL’s case, Residential, GS < 50 kW, USL and Street Lights revenue 25
requirements were not allocated any Transformer Ownership Allowance. 26

Toronto Hydro-Electric System Limited EB-2009-0139
Exhibit R1 Tab 11
Schedule 50 Filed: 2009 Nov 30
Page 2 of 2
INTERROGATORIES OF VULNERABLE ENERGY CONSUMERS COALITION
Witness Panel(s): 5
1
c) Although THESL did not revise the cost allocation model as per OEB’s direction, 2
THESL did identify this model shortfall in its EB-2007-0680 filing and made changes 3
which it believes achieve the same effect. In any event, removing the amounts from 4
the model does not solve the issue of how these costs will be allocated and recovered. 5

Toronto Hydro-Electric System Limited EB-2009-0139
Exhibit R1 Tab 11
Schedule 51 Filed: 2009 Nov 30
Page 1 of 3
INTERROGATORIES OF VULNERABLE ENERGY CONSUMERS COALITION
Witness Panel(s): 5
INTERROGATORY 51: 1
a) Reference(s): Exhibit L1 Tab 2 Schedule 1 2
3
a) With respect to pages 24-25, please reconcile the following: 4
• The total Rate Base reported here ($2,163.8 M) with that reported at Exhibit J1, 5
Tab 2, Schedule 2, page 1 ($2,162.3 M) 6
• The total Service Revenue Requirement reported here ($559.2 M) with that 7
reported at Exhibit J1, Tab 2, Schedule 4, page 1 ($547.5 M) 8
b) Please provide a schedule that set outs how the Distribution Revenue by class 9
(totalling $540.5 M) as reported in Sheet O1 was determined. 10
c) With respect to pages 24 and 19-22, please provide a schedule that explains what 11
each of the expense item reported on these pages is meant to represent and how/why 12
they were directly allocated to specific customer classes (for a total of $15.2 M). 13
d) Please provide the breakdown by customer class (in dollar values) of the allocation 14
base used in the CA Model to allocation A&G costs (excluding Property Insurance 15
and Community Safety Programs) to customer classes. 16
e) Please confirm that, in the OEB CA model, directly allocated OM&A costs are not 17
included in the allocation base used to allocate A&G costs to customer classes (i.e., 18
those costs with an “ad” Group Designation in Worksheet O4 – with the exception of 19
Property Insurance and Community Safety Programs). 20
f) Please provide a revised allocation base broken down by customer class for A&G 21
costs (excluding Property Insurance and Community Safety Programs) that includes 22
directly allocated O&M costs. 23
g) With respect to pages 18-19 and 25, please provide a schedule that explains what 24
dollars for each of the reported asset-related accounts is meant to represent and 25
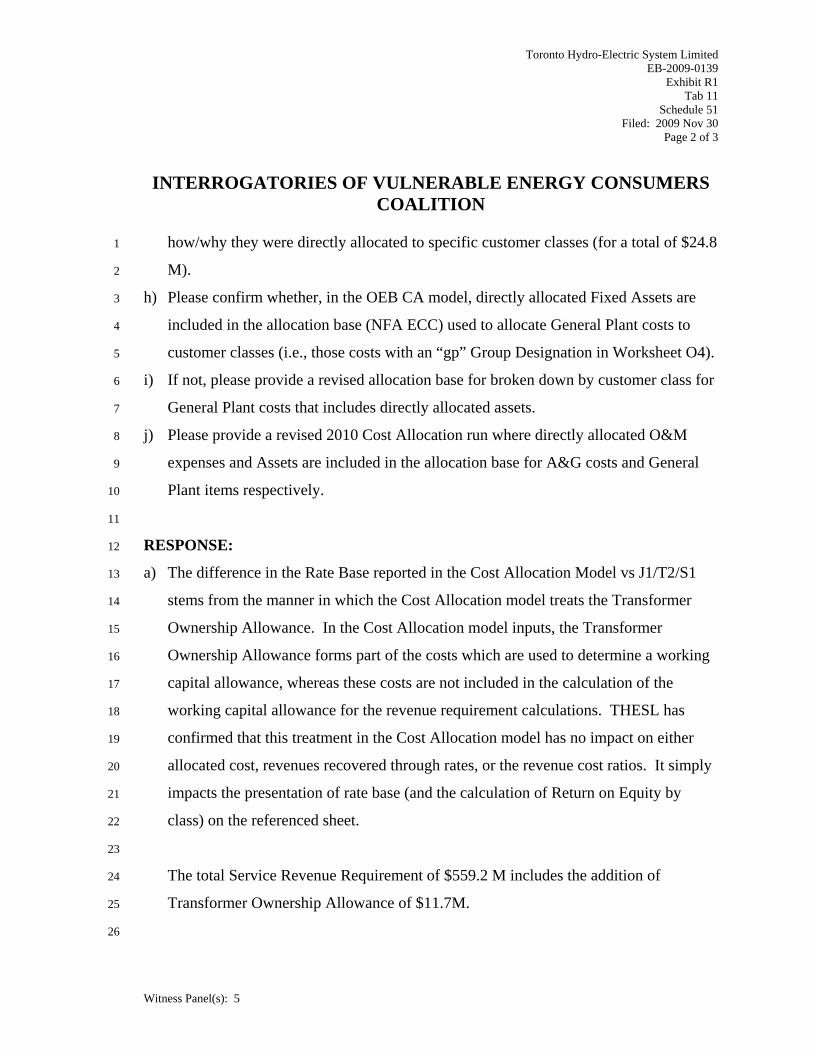
Toronto Hydro-Electric System Limited EB-2009-0139
Exhibit R1 Tab 11
Schedule 51 Filed: 2009 Nov 30
Page 2 of 3
INTERROGATORIES OF VULNERABLE ENERGY CONSUMERS COALITION
Witness Panel(s): 5
how/why they were directly allocated to specific customer classes (for a total of $24.8 1
M). 2
h) Please confirm whether, in the OEB CA model, directly allocated Fixed Assets are 3
included in the allocation base (NFA ECC) used to allocate General Plant costs to 4
customer classes (i.e., those costs with an “gp” Group Designation in Worksheet O4). 5
i) If not, please provide a revised allocation base for broken down by customer class for 6
General Plant costs that includes directly allocated assets. 7
j) Please provide a revised 2010 Cost Allocation run where directly allocated O&M 8
expenses and Assets are included in the allocation base for A&G costs and General 9
Plant items respectively. 10
11
RESPONSE: 12
a) The difference in the Rate Base reported in the Cost Allocation Model vs J1/T2/S1 13
stems from the manner in which the Cost Allocation model treats the Transformer 14
Ownership Allowance. In the Cost Allocation model inputs, the Transformer 15
Ownership Allowance forms part of the costs which are used to determine a working 16
capital allowance, whereas these costs are not included in the calculation of the 17
working capital allowance for the revenue requirement calculations. THESL has 18
confirmed that this treatment in the Cost Allocation model has no impact on either 19
allocated cost, revenues recovered through rates, or the revenue cost ratios. It simply 20
impacts the presentation of rate base (and the calculation of Return on Equity by 21
class) on the referenced sheet. 22
23
The total Service Revenue Requirement of $559.2 M includes the addition of 24
Transformer Ownership Allowance of $11.7M. 25
26

Toronto Hydro-Electric System Limited EB-2009-0139
Exhibit R1 Tab 11
Schedule 51 Filed: 2009 Nov 30
Page 3 of 3
INTERROGATORIES OF VULNERABLE ENERGY CONSUMERS COALITION
Witness Panel(s): 5
b) Please see Appendix A of this Schedule. 1
2
c) Please see response to Board Staff’s interrogatory # 95 a). 3
4
d) The A&G costs have been rolled into O&M grouping as provided for in the Board’s 5
Cost Allocation Model guidelines. The allocation of A&G costs is on the same basis 6
as other O&M costs. 7
8
e) There are no direct allocations of O&M costs. 9
10
f) Please see (e) above. 11
12
g) $15.2M is the directly assigned net fixed share of the PILs, Return on Debt and 13
Return on Equity. The allocator is the amount of directly assigned Net Fix Assets 14
divided by the Total Net Assets excluding general plant. F or details please see the 15
bottom section in Exhibit L1, Tab 2, Schedule 1, age 23. 16
17
h) In the OEB Cost Allocation Model, directly allocated Fixed Assets are not included in 18
the allocation base used to allocate General Plant costs to customer classes. 19
20
i) Please see response h). 21
22
j) There was no direct allocation of O&M costs and the direct allocation of fixed assets 23
was done in accordance with OEB’s instructions (Cost Allocation Review – EB2005-24
0317 Chapter 5.1). 25
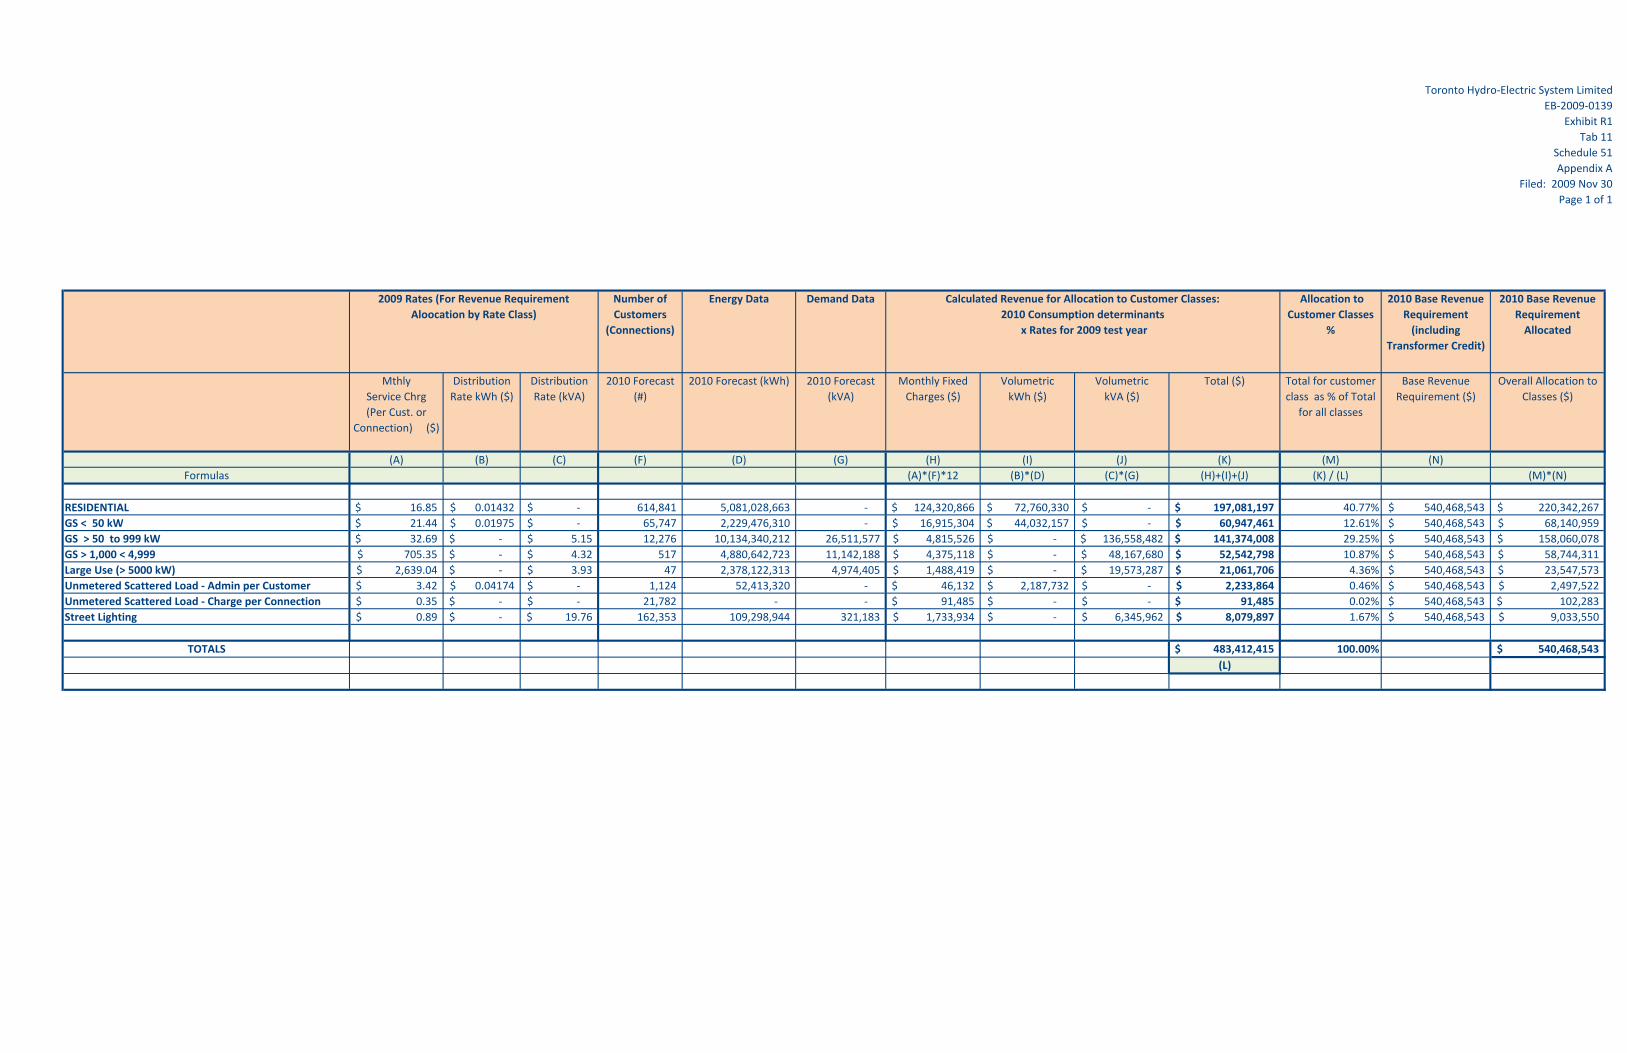
Toronto Hydro‐Electric System LimitedEB‐2009‐0139
Exhibit R1Tab 11
Schedule 51Appendix A
Filed: 2009 Nov 30Page 1 of 1
Number of Customers
(Connections)
Energy Data Demand Data Allocation to Customer Classes
%
2010 Base Revenue Requirement (including
Transformer Credit)
2010 Base Revenue Requirement Allocated
MthlyService Chrg(Per Cust. or
Connection) ($)
Distribution Rate kWh ($)
Distribution Rate (kVA)
2010 Forecast (#)
2010 Forecast (kWh) 2010 Forecast (kVA)
Monthly Fixed Charges ($)
VolumetrickWh ($)
VolumetrickVA ($)
Total ($) Total for customer class as % of Total
for all classes
Base Revenue Requirement ($)
Overall Allocation to Classes ($)
(A) (B) (C) (F) (D) (G) (H) (I) (J) (K) (M) (N)Formulas (A)*(F)*12 (B)*(D) (C)*(G) (H)+(I)+(J) (K) / (L) (M)*(N)
RESIDENTIAL 16.85$ 0.01432$ ‐$ 614,841 5,081,028,663 ‐ 124,320,866$ 72,760,330$ ‐$ 197,081,197$ 40.77% 540,468,543$ 220,342,267$ GS < 50 kW 21.44$ 0.01975$ ‐$ 65,747 2,229,476,310 ‐ 16,915,304$ 44,032,157$ ‐$ 60,947,461$ 12.61% 540,468,543$ 68,140,959$ GS > 50 to 999 kW 32.69$ ‐$ 5.15$ 12,276 10,134,340,212 26,511,577 4,815,526$ ‐$ 136,558,482$ 141,374,008$ 29.25% 540,468,543$ 158,060,078$ GS > 1,000 < 4,999 705.35$ ‐$ 4.32$ 517 4,880,642,723 11,142,188 4,375,118$ ‐$ 48,167,680$ 52,542,798$ 10.87% 540,468,543$ 58,744,311$ Large Use (> 5000 kW) 2,639.04$ ‐$ 3.93$ 47 2,378,122,313 4,974,405 1,488,419$ ‐$ 19,573,287$ 21,061,706$ 4.36% 540,468,543$ 23,547,573$ Unmetered Scattered Load ‐ Admin per Customer 3.42$ 0.04174$ ‐$ 1,124 52,413,320 ‐ 46,132$ 2,187,732$ ‐$ 2,233,864$ 0.46% 540,468,543$ 2,497,522$ Unmetered Scattered Load ‐ Charge per Connection 0.35$ ‐$ ‐$ 21,782 ‐ ‐ 91,485$ ‐$ ‐$ 91,485$ 0.02% 540,468,543$ 102,283$ Street Lighting 0.89$ ‐$ 19.76$ 162,353 109,298,944 321,183 1,733,934$ ‐$ 6,345,962$ 8,079,897$ 1.67% 540,468,543$ 9,033,550$
TOTALS 483,412,415$ 100.00% 540,468,543$ (L)
2009 Rates (For Revenue Requirement Aloocation by Rate Class)
Calculated Revenue for Allocation to Customer Classes:2010 Consumption determinants
x Rates for 2009 test year
Toronto Hydro-Electric System Limited EB-2009-0139
Exhibit R1 Tab 11
Schedule 52 Filed: 2009 Nov 30
Page 1 of 1
INTERROGATORIES OF VULNERABLE ENERGY CONSUMERS COALITION
Witness Panel(s): 5
INTERROGATORY 52: 1
Reference(s): Exhibit M1/Tab 1/Schedule 1, pages 4-5 2
3
a) Why is Toronto proposing to increase the revenue to cost ratio for the Residential 4
class when it is already above the lower end of the Board’s recommended range given 5
that the Board concluded in its EB-2007-0667 Report that there are “factors that 6
currently limit or otherwise affect the ability or desirability of moving immediately to 7
a cost allocation framework that might, from a theoretical perspective, be considered 8
ideal (page 2) and that “a range approach is preferred” (page 4)? 9
b) Has Toronto made any improvements or changes to the Cost Allocation model used 10
for 2010 (as opposed to that used for the 2007 filing) to address the data and 11
methodology concerns noted by the Board in its EB-2007-0667 Report (pages 5-6)? 12
13
RESPONSE: 14
a) Please see response to BOMA 50a found at Exhibit R1, Tab 3, Schedule 50. 15
16
b) THESL has continued to use the Board’s Cost Allocation Model, and has not made 17
any changes to the model (other than updating input data) from the model used in 18
THESL’s EB-2007-0680 filing. 19

Toronto Hydro-Electric System Limited EB-2009-0139
Exhibit R1 Tab 11
Schedule 53 Filed: 2009 Nov 30
Page 1 of 2
INTERROGATORIES OF VULNERABLE ENERGY CONSUMERS COALITION
Witness Panel(s): 5
INTERROGATORY 53: 1
Reference(s): Exhibit M1/Tab 1/Schedule 1, pages 5-6 2
3
a) Please confirm that the Board’s EB-2007-0667 Guideline (page 12) sets the upper 4
limit for the MSC at 120% of avoided costs plus the allocated customer costs (i.e., 5
Minimum System plus PLCC Adjustment). 6
b) Given that the OEB has not completed its Rate Design review, why is it appropriate, 7
for those classes whose values are currently within the Board’s recommended range, 8
to increase the Monthly Fixed Charges towards the value derived including the 9
Minimum System as opposed to maintaining the current fixed-variable split for the 10
class. 11
c) Please reconcile Toronto Hydro’s approach regarding the Fixed Monthly charge with 12
that proposed for the Transformer Allowance (page 7), where it is proposed to 13
maintain the status quo until the completion of the OEB’s Rate Design review. 14
d) Please provide a schedule that sets out the derivation of the current fixed-variable 15
split for each customer class based on 2009 approved rates and 2010 billing 16
determinants. 17
e) Please provide a schedule that sets out the month service charge for each class for 18
2010 consistent with the current fixed-variable split (per part (d)). 19
20
RESPONSE: 21
a) Confirmed. 22
23
b) THESL believes the current Cost Allocation model provides a reasonable estimate of 24
the fixed and variable cost components for each rate class. THESL also believes in 25
the matching of recovery of fixed costs through fixed rate components, and variable 26
Toronto Hydro-Electric System Limited EB-2009-0139
Exhibit R1 Tab 11
Schedule 53 Filed: 2009 Nov 30
Page 2 of 2
INTERROGATORIES OF VULNERABLE ENERGY CONSUMERS COALITION
Witness Panel(s): 5
costs through variable rate components. THESL believes that its proposed fixed and 1
variable rates continue to move the recovery of costs in this direction, with minimal 2
impact on customer bills. 3
4
c) The transformer allowance is a very specific rate to a very specific group of 5
customers. THESL recognizes that there may be a desire on the part of the OEB to 6
standardize this rate across LDCs, within reason (i.e., rates that reasonably 7
compensate for costs), unlike distribution rates, where there is likely more variability, 8
and higher revenue/cost consequences than with the transformer allowance. 9
10
d) Please see Appendix A to this Schedule labelled VECC 53d. 11
12
e) Please see Appendix B to this Schedule labelled VECC 53e. 13
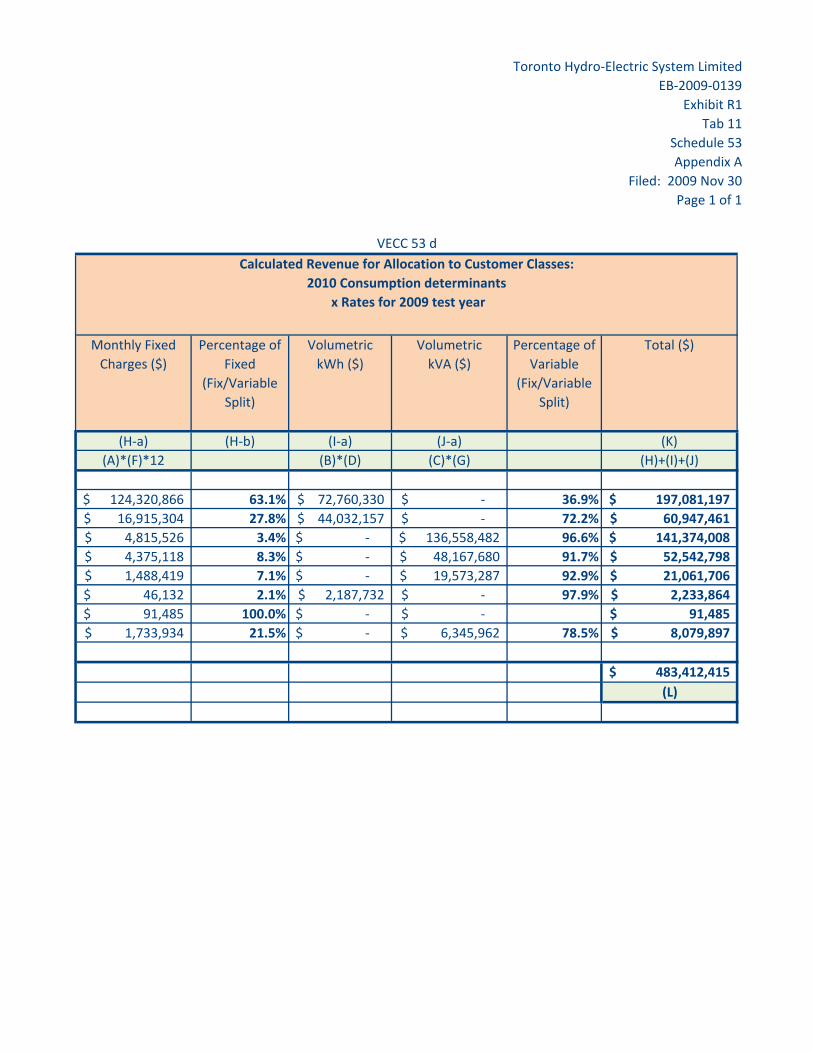
Toronto Hydro‐Electric System LimitedEB‐2009‐0139
Exhibit R1Tab 11
Schedule 53Appendix A
Filed: 2009 Nov 30Page 1 of 1
Monthly Fixed Charges ($)
Percentage of Fixed
(Fix/Variable Split)
VolumetrickWh ($)
VolumetrickVA ($)
Percentage of Variable
(Fix/Variable Split)
Total ($)
(H‐a) (H‐b) (I‐a) (J‐a) (K)(A)*(F)*12 (B)*(D) (C)*(G) (H)+(I)+(J)
124,320,866$ 63.1% 72,760,330$ ‐$ 36.9% 197,081,197$ 16,915,304$ 27.8% 44,032,157$ ‐$ 72.2% 60,947,461$ 4,815,526$ 3.4% ‐$ 136,558,482$ 96.6% 141,374,008$ 4,375,118$ 8.3% ‐$ 48,167,680$ 91.7% 52,542,798$ 1,488,419$ 7.1% ‐$ 19,573,287$ 92.9% 21,061,706$
46,132$ 2.1% 2,187,732$ ‐$ 97.9% 2,233,864$ 91,485$ 100.0% ‐$ ‐$ 91,485$
1,733,934$ 21.5% ‐$ 6,345,962$ 78.5% 8,079,897$
483,412,415$ (L)
Calculated Revenue for Allocation to Customer Classes:2010 Consumption determinants
x Rates for 2009 test year
VECC 53 d
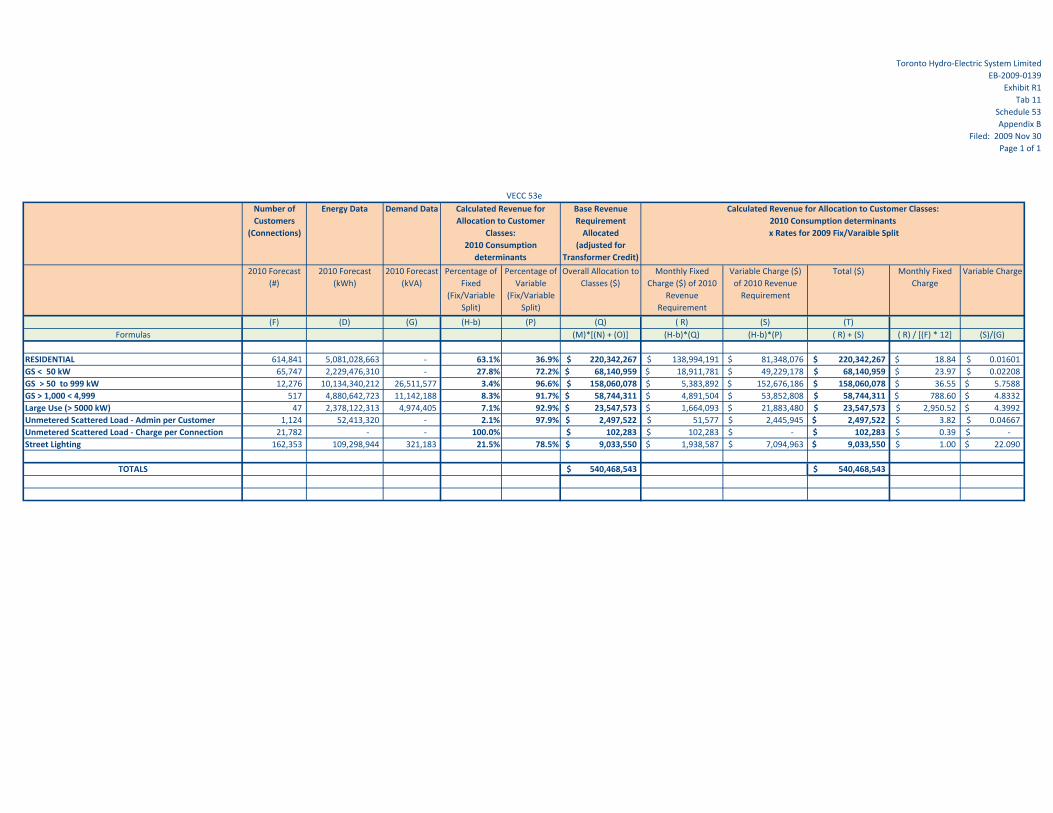
Toronto Hydro‐Electric System LimitedEB‐2009‐0139
Exhibit R1Tab 11
Schedule 53Appendix B
Filed: 2009 Nov 30Page 1 of 1
Number of Customers
(Connections)
Energy Data Demand Data Base Revenue Requirement Allocated
(adjusted for Transformer Credit)
2010 Forecast (#)
2010 Forecast (kWh)
2010 Forecast (kVA)
Percentage of Fixed
(Fix/Variable Split)
Percentage of Variable
(Fix/Variable Split)
Overall Allocation to Classes ($)
Monthly Fixed Charge ($) of 2010
Revenue Requirement
Variable Charge ($) of 2010 Revenue Requirement
Total ($) Monthly Fixed Charge
Variable Charge
(F) (D) (G) (H‐b) (P) (Q) ( R) (S) (T) Formulas (M)*[(N) + (O)] (H‐b)*(Q) (H‐b)*(P) ( R) + (S) ( R) / [(F) * 12] (S)/(G)
RESIDENTIAL 614,841 5,081,028,663 ‐ 63.1% 36.9% 220,342,267$ 138,994,191$ 81,348,076$ 220,342,267$ 18.84$ 0.01601$ GS < 50 kW 65,747 2,229,476,310 ‐ 27.8% 72.2% 68,140,959$ 18,911,781$ 49,229,178$ 68,140,959$ 23.97$ 0.02208$ GS > 50 to 999 kW 12,276 10,134,340,212 26,511,577 3.4% 96.6% 158,060,078$ 5,383,892$ 152,676,186$ 158,060,078$ 36.55$ 5.7588$ GS > 1,000 < 4,999 517 4,880,642,723 11,142,188 8.3% 91.7% 58,744,311$ 4,891,504$ 53,852,808$ 58,744,311$ 788.60$ 4.8332$ Large Use (> 5000 kW) 47 2,378,122,313 4,974,405 7.1% 92.9% 23,547,573$ 1,664,093$ 21,883,480$ 23,547,573$ 2,950.52$ 4.3992$ Unmetered Scattered Load ‐ Admin per Customer 1,124 52,413,320 ‐ 2.1% 97.9% 2,497,522$ 51,577$ 2,445,945$ 2,497,522$ 3.82$ 0.04667$ Unmetered Scattered Load ‐ Charge per Connection 21,782 ‐ ‐ 100.0% 102,283$ 102,283$ ‐$ 102,283$ 0.39$ ‐$ Street Lighting 162,353 109,298,944 321,183 21.5% 78.5% 9,033,550$ 1,938,587$ 7,094,963$ 9,033,550$ 1.00$ 22.090$
TOTALS 540,468,543$ 540,468,543$
Calculated Revenue for Allocation to Customer
Classes:2010 Consumption
determinants
Calculated Revenue for Allocation to Customer Classes:2010 Consumption determinants x Rates for 2009 Fix/Varaible Split
VECC 53e
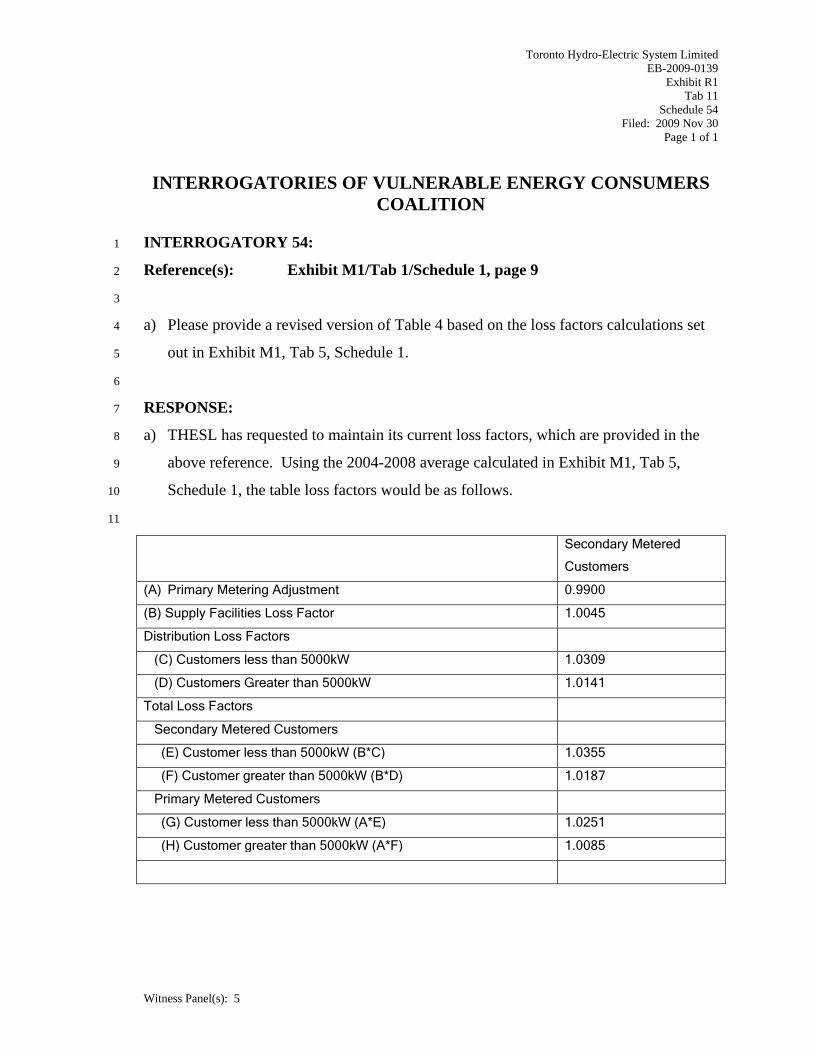
Toronto Hydro-Electric System Limited EB-2009-0139
Exhibit R1 Tab 11
Schedule 54 Filed: 2009 Nov 30
Page 1 of 1
INTERROGATORIES OF VULNERABLE ENERGY CONSUMERS COALITION
Witness Panel(s): 5
INTERROGATORY 54: 1
Reference(s): Exhibit M1/Tab 1/Schedule 1, page 9 2
3
a) Please provide a revised version of Table 4 based on the loss factors calculations set 4
out in Exhibit M1, Tab 5, Schedule 1. 5
6
RESPONSE: 7
a) THESL has requested to maintain its current loss factors, which are provided in the 8
above reference. Using the 2004-2008 average calculated in Exhibit M1, Tab 5, 9
Schedule 1, the table loss factors would be as follows. 10
11
Secondary Metered
Customers
(A) Primary Metering Adjustment 0.9900
(B) Supply Facilities Loss Factor 1.0045
Distribution Loss Factors
(C) Customers less than 5000kW 1.0309
(D) Customers Greater than 5000kW 1.0141
Total Loss Factors
Secondary Metered Customers
(E) Customer less than 5000kW (B*C) 1.0355
(F) Customer greater than 5000kW (B*D) 1.0187
Primary Metered Customers
(G) Customer less than 5000kW (A*E) 1.0251
(H) Customer greater than 5000kW (A*F) 1.0085
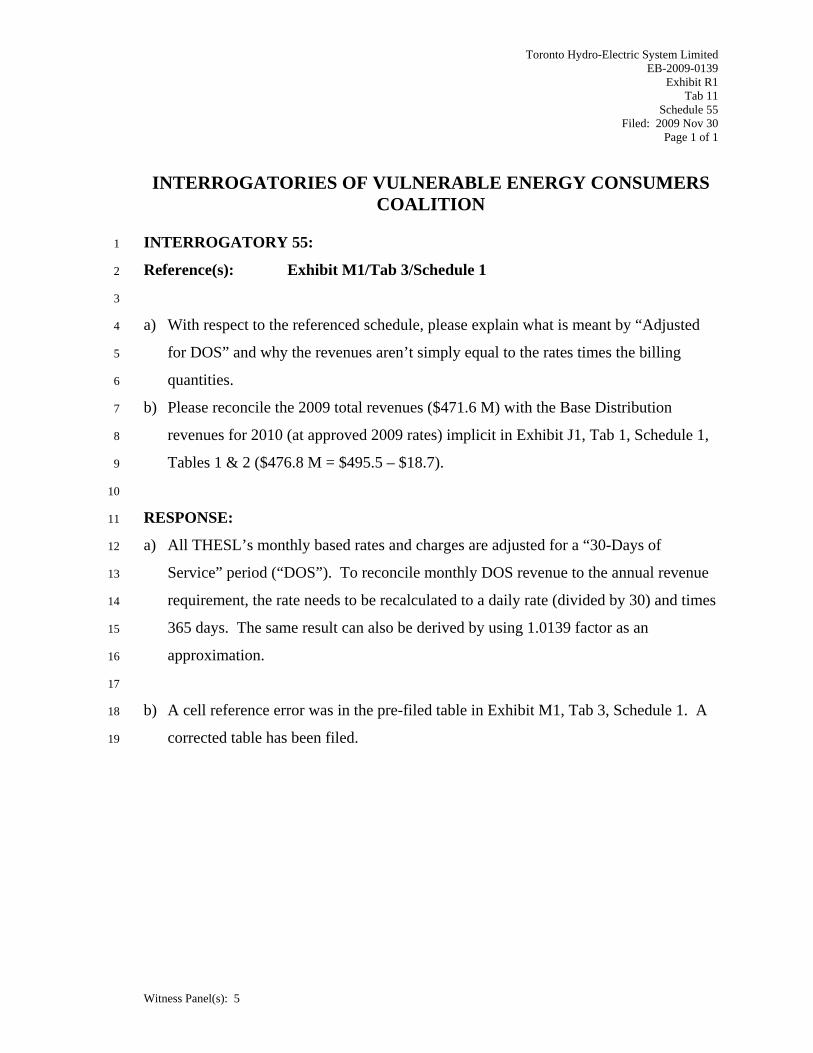
Toronto Hydro-Electric System Limited EB-2009-0139
Exhibit R1 Tab 11
Schedule 55 Filed: 2009 Nov 30
Page 1 of 1
INTERROGATORIES OF VULNERABLE ENERGY CONSUMERS COALITION
Witness Panel(s): 5
INTERROGATORY 55: 1
Reference(s): Exhibit M1/Tab 3/Schedule 1 2
3
a) With respect to the referenced schedule, please explain what is meant by “Adjusted 4
for DOS” and why the revenues aren’t simply equal to the rates times the billing 5
quantities. 6
b) Please reconcile the 2009 total revenues ($471.6 M) with the Base Distribution 7
revenues for 2010 (at approved 2009 rates) implicit in Exhibit J1, Tab 1, Schedule 1, 8
Tables 1 & 2 ($476.8 M = $495.5 – $18.7). 9
10
RESPONSE: 11
a) All THESL’s monthly based rates and charges are adjusted for a “30-Days of 12
Service” period (“DOS”). To reconcile monthly DOS revenue to the annual revenue 13
requirement, the rate needs to be recalculated to a daily rate (divided by 30) and times 14
365 days. The same result can also be derived by using 1.0139 factor as an 15
approximation. 16
17
b) A cell reference error was in the pre-filed table in Exhibit M1, Tab 3, Schedule 1. A 18
corrected table has been filed. 19

Toronto Hydro-Electric System Limited EB-2009-0139
Exhibit R1 Tab 11
Schedule 56 Filed: 2009 Nov 30
Page 1 of 2
INTERROGATORIES OF VULNERABLE ENERGY CONSUMERS COALITION
Witness Panel(s): 5
INTERROGATORY 56: 1
Reference(s): Exhibit N1/Tab 2/Schedule 2 2
3
a) Please provide a schedule that sets out the RTSR revenues by class for each of 4
Networks and Connection based on 2009 approved rates and 2010 volumes. 5
b) Please comment on the merits of using the results from part (a) to allocate the forecast 6
2010 Wholesale Transmission costs to customer classes. 7
c) How many delivery points does Toronto Hydro have that are subject to Line and/or 8
Transformation Connection charges by the either the IESO or Hydro One Networks? 9
10
RESPONSE: 11
a) Please see Appendix A of this Schedule. 12
13
b) The methodology used by THESL in evidence (and in previous filings) allocates 14
forecast transmission costs to rate classes based on 12CP (for Network charges) and 15
12NCP (for Line and Transformation charges). This allocation methodology reflects 16
the anticipated cost drivers for each class for each component. THESL sees no merit 17
in allocating forecast transmission costs based on historical proportions based on 18
previously approved rates. 19
20
c) THESL has 35 Delivery Points. 21
22
All 35 TSs are subject to Network Connection Charges because all 35 TSs are 23
connected to the IESO-controlled transmission network. Network charges apply to 24
all transmission connected TSs regardless of the ownership of the TS. 25
26
Toronto Hydro-Electric System Limited EB-2009-0139
Exhibit R1 Tab 11
Schedule 56 Filed: 2009 Nov 30
Page 2 of 2
INTERROGATORIES OF VULNERABLE ENERGY CONSUMERS COALITION
Witness Panel(s): 5
Thirty-four TSs (all except Richview) are subject to Line Connection Charges 1
because the TSs were constructed for the purpose of supplying loads in the THESL 2
service area. Richview is not subject to Line Connection Charges because Richview 3
Station was constructed for the purpose of supporting the operation of the IESO-4
controlled transmission network. 5
6
Thirty-four TSs (all except Cavanagh) are subject to Transformation Connection 7
Charges because HONI owns the high-voltage station transformers at all the TSs 8
except Cavanagh. THESL owns the high-voltage station transformers at Cavanagh 9
TS so Transformation Connection Charges do not apply at Cavanagh TS. 10
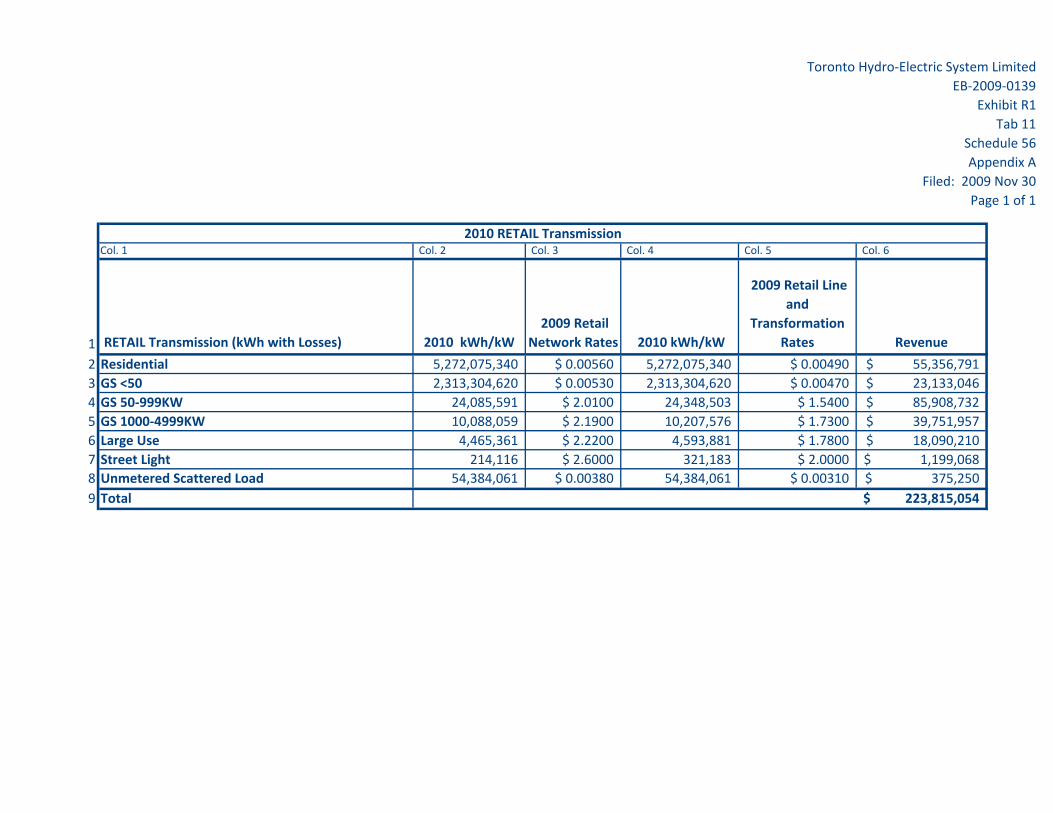
Toronto Hydro‐Electric System LimitedEB‐2009‐0139
Exhibit R1Tab 11
Schedule 56Appendix A
Filed: 2009 Nov 30Page 1 of 1
Col. 1 Col. 2 Col. 3 Col. 4 Col. 5 Col. 6
1 RETAIL Transmission (kWh with Losses) 2010 kWh/kW 2009 Retail
Network Rates 2010 kWh/kW
2009 Retail Line and
Transformation Rates Revenue
2 Residential 5,272,075,340 $ 0.00560 5,272,075,340 $ 0.00490 55,356,791$ 3 GS <50 2,313,304,620 $ 0.00530 2,313,304,620 $ 0.00470 23,133,046$ 4 GS 50‐999KW 24,085,591 $ 2.0100 24,348,503 $ 1.5400 85,908,732$ 5 GS 1000‐4999KW 10,088,059 $ 2.1900 10,207,576 $ 1.7300 39,751,957$ 6 Large Use 4,465,361 $ 2.2200 4,593,881 $ 1.7800 18,090,210$ 7 Street Light 214,116 $ 2.6000 321,183 $ 2.0000 1,199,068$ 8 Unmetered Scattered Load 54,384,061 $ 0.00380 54,384,061 $ 0.00310 375,250$ 9 Total 223,815,054$
2010 RETAIL Transmission
Toronto Hydro-Electric System Limited EB-2009-0139
Exhibit R1 Tab 11
Schedule 57 Filed: 2009 Nov 30
Page 1 of 8
INTERROGATORIES OF VULNERABLE ENERGY CONSUMERS COALITION
Witness Panel(s): 3A
INTERROGATORY 57: 1
Reference(s): Exhibit Q1 Tab2 Schedule 1 Tables 2 and 3 2
Exhibit Q1 Tab 3 Schedule 1 3
4
Kinetrics 2009 ACA and HI assessment includes the following assessments (Relative to 5
2006) 6
• Wood Poles had an 8.6% increase of assets in poor and very poor condition. 7
• Station Transformers had a 10.4% increase of assets in poor and very poor 8
condition. This indicates that THESL should review its maintenance practices, 9
particularly as they relate to Stations Transformers, and be prepared to have more 10
assets in need of replacement or major refurbishment. 11
• Underground cables (not in duct)had a significant increase in percentage of assets 12
in poor and very poor condition based on the number of faults experienced over 13
the last five and a half years: almost 75% 14
a) Provide a schedule that provides a summary of capital investment and maintenance 15
expenditures for these 3 asset groups from 2006-2009 and forecast 2010. Show the 16
also the percentage invested in these categories as a percentage of 17
i. sustaining capital 18
ii. overall total capital 19
iii. sustaining maintenance costs 20
iv. overall maintenance costs 21
b) If THESL agrees that the Kinetrics assessment shows deteriorating asset condition in 22
these groups, then discuss why did not the Capital Plan channel more dollars to these 23
critical asset categories in the period 2007-2009. 24
c) THESL appears anecdotally in part to “blame” the Board-directed reduction in 25
Capital and maintenance in EB-2007-.0680 (Exhibit Q1 Tab 2 Schedule 1 Page 6 and 26
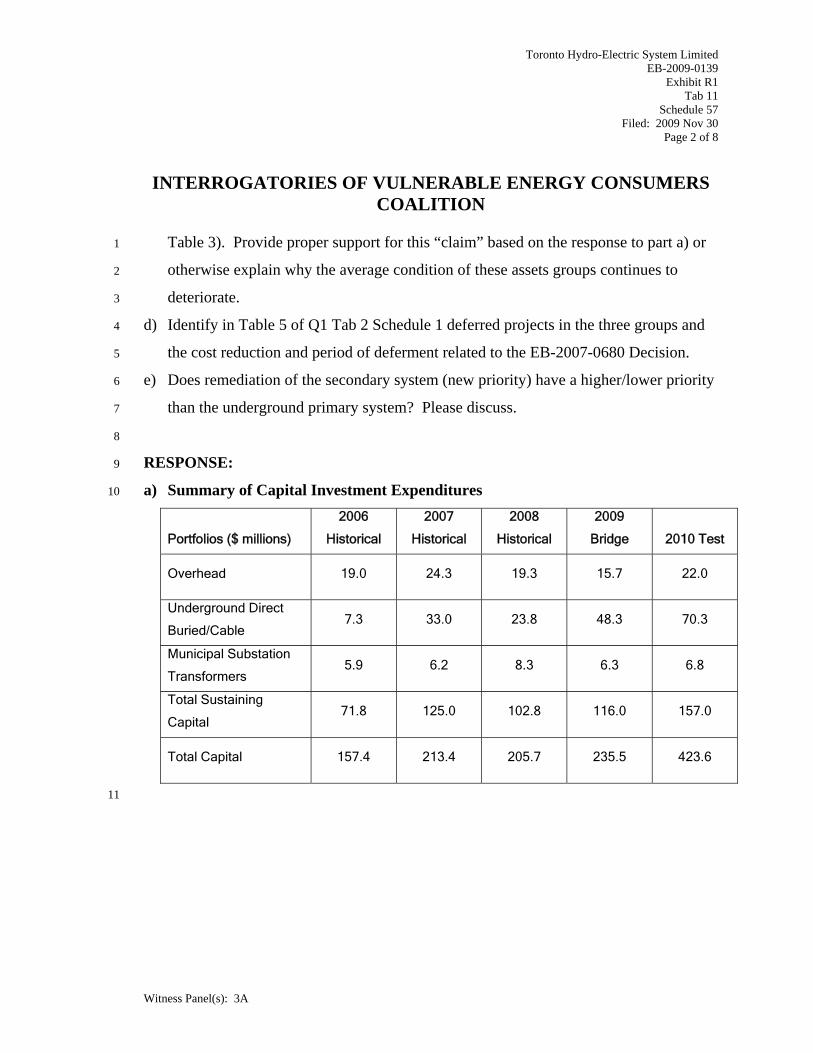
Toronto Hydro-Electric System Limited EB-2009-0139
Exhibit R1 Tab 11
Schedule 57 Filed: 2009 Nov 30
Page 2 of 8
INTERROGATORIES OF VULNERABLE ENERGY CONSUMERS COALITION
Witness Panel(s): 3A
Table 3). Provide proper support for this “claim” based on the response to part a) or 1
otherwise explain why the average condition of these assets groups continues to 2
deteriorate. 3
d) Identify in Table 5 of Q1 Tab 2 Schedule 1 deferred projects in the three groups and 4
the cost reduction and period of deferment related to the EB-2007-0680 Decision. 5
e) Does remediation of the secondary system (new priority) have a higher/lower priority 6
than the underground primary system? Please discuss. 7
8
RESPONSE: 9
a) Summary of Capital Investment Expenditures 10
Portfolios ($ millions)
2006
Historical
2007
Historical
2008
Historical
2009
Bridge 2010 Test
Overhead 19.0 24.3 19.3 15.7 22.0
Underground Direct
Buried/Cable 7.3 33.0 23.8 48.3 70.3
Municipal Substation
Transformers 5.9 6.2 8.3 6.3 6.8
Total Sustaining
Capital 71.8 125.0 102.8 116.0 157.0
Total Capital 157.4 213.4 205.7 235.5 423.6
11
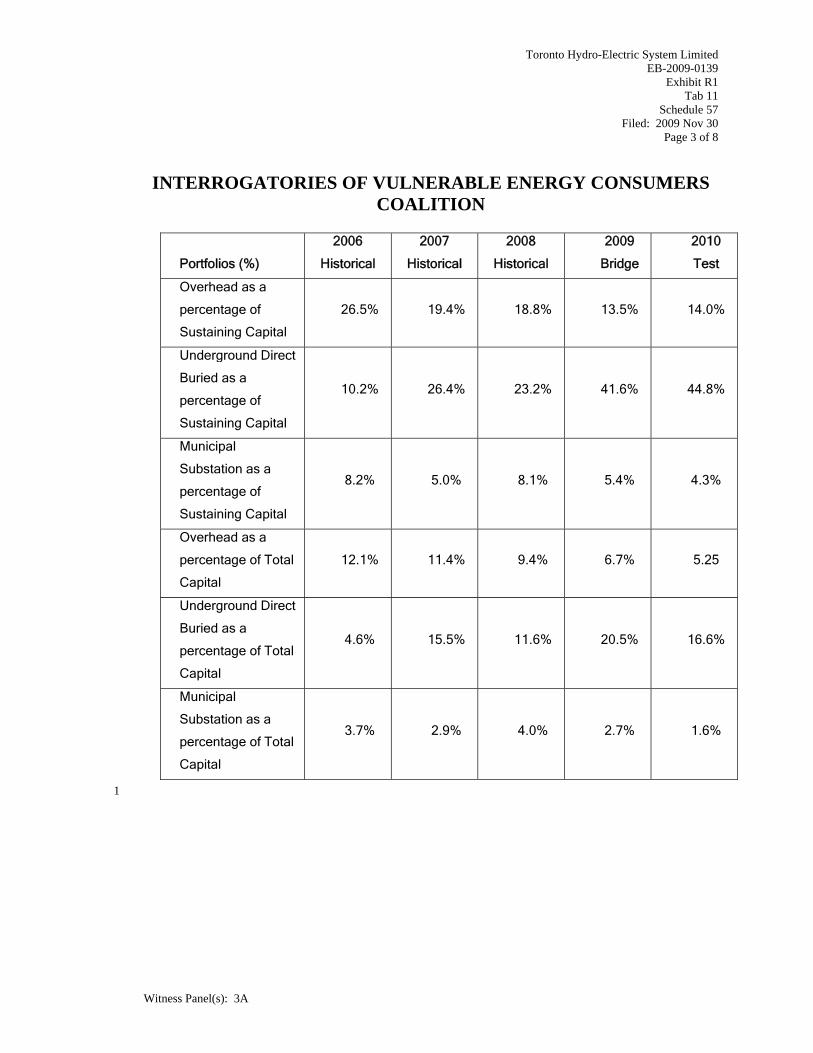
Toronto Hydro-Electric System Limited EB-2009-0139
Exhibit R1 Tab 11
Schedule 57 Filed: 2009 Nov 30
Page 3 of 8
INTERROGATORIES OF VULNERABLE ENERGY CONSUMERS COALITION
Witness Panel(s): 3A
Portfolios (%)
2006
Historical
2007
Historical
2008
Historical
2009
Bridge
2010
Test
Overhead as a
percentage of
Sustaining Capital
26.5% 19.4% 18.8% 13.5% 14.0%
Underground Direct
Buried as a
percentage of
Sustaining Capital
10.2% 26.4% 23.2% 41.6% 44.8%
Municipal
Substation as a
percentage of
Sustaining Capital
8.2% 5.0% 8.1% 5.4% 4.3%
Overhead as a
percentage of Total
Capital
12.1% 11.4% 9.4% 6.7% 5.25
Underground Direct
Buried as a
percentage of Total
Capital
4.6% 15.5% 11.6% 20.5% 16.6%
Municipal
Substation as a
percentage of Total
Capital
3.7% 2.9% 4.0% 2.7% 1.6%
1
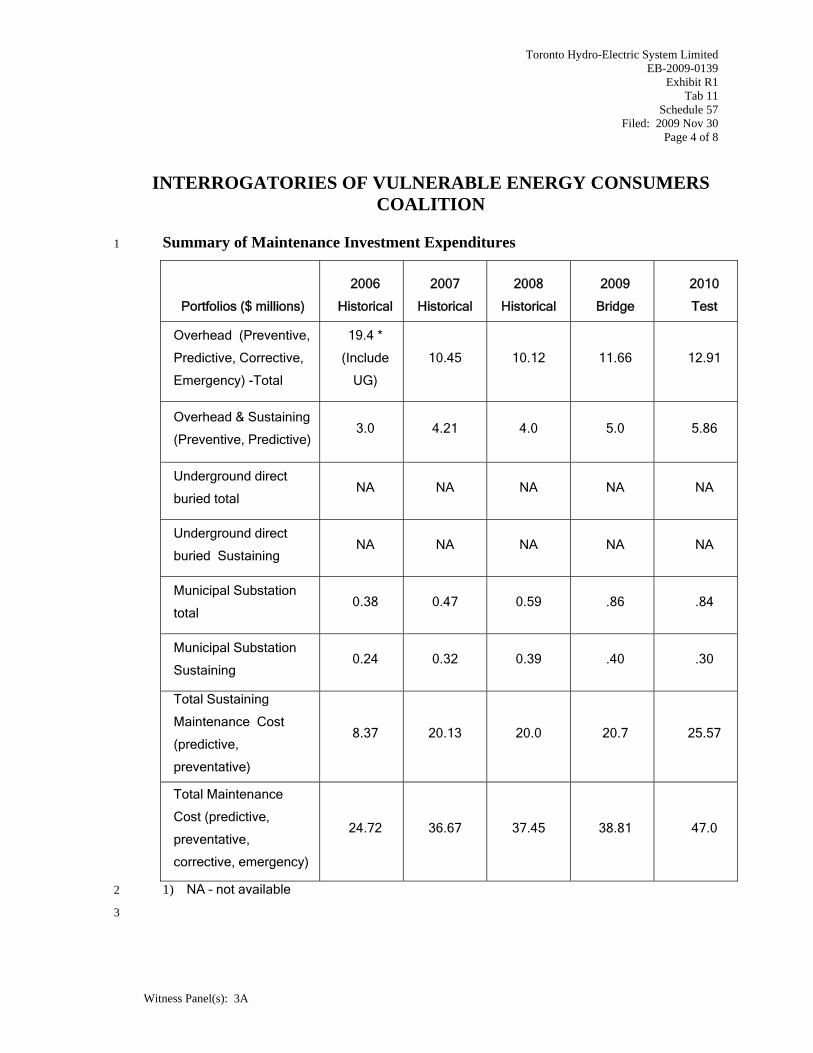
Toronto Hydro-Electric System Limited EB-2009-0139
Exhibit R1 Tab 11
Schedule 57 Filed: 2009 Nov 30
Page 4 of 8
INTERROGATORIES OF VULNERABLE ENERGY CONSUMERS COALITION
Witness Panel(s): 3A
Summary of Maintenance Investment Expenditures 1
Portfolios ($ millions)
2006
Historical
2007
Historical
2008
Historical
2009
Bridge
2010
Test
Overhead (Preventive,
Predictive, Corrective,
Emergency) -Total
19.4 *
(Include
UG)
10.45 10.12 11.66 12.91
Overhead & Sustaining
(Preventive, Predictive) 3.0 4.21 4.0 5.0 5.86
Underground direct
buried total NA NA NA NA NA
Underground direct
buried Sustaining NA NA NA NA NA
Municipal Substation
total 0.38 0.47 0.59 .86 .84
Municipal Substation
Sustaining 0.24 0.32 0.39 .40 .30
Total Sustaining
Maintenance Cost
(predictive,
preventative)
8.37 20.13 20.0 20.7 25.57
Total Maintenance
Cost (predictive,
preventative,
corrective, emergency)
24.72 36.67 37.45 38.81 47.0
1) NA – not available 2
3
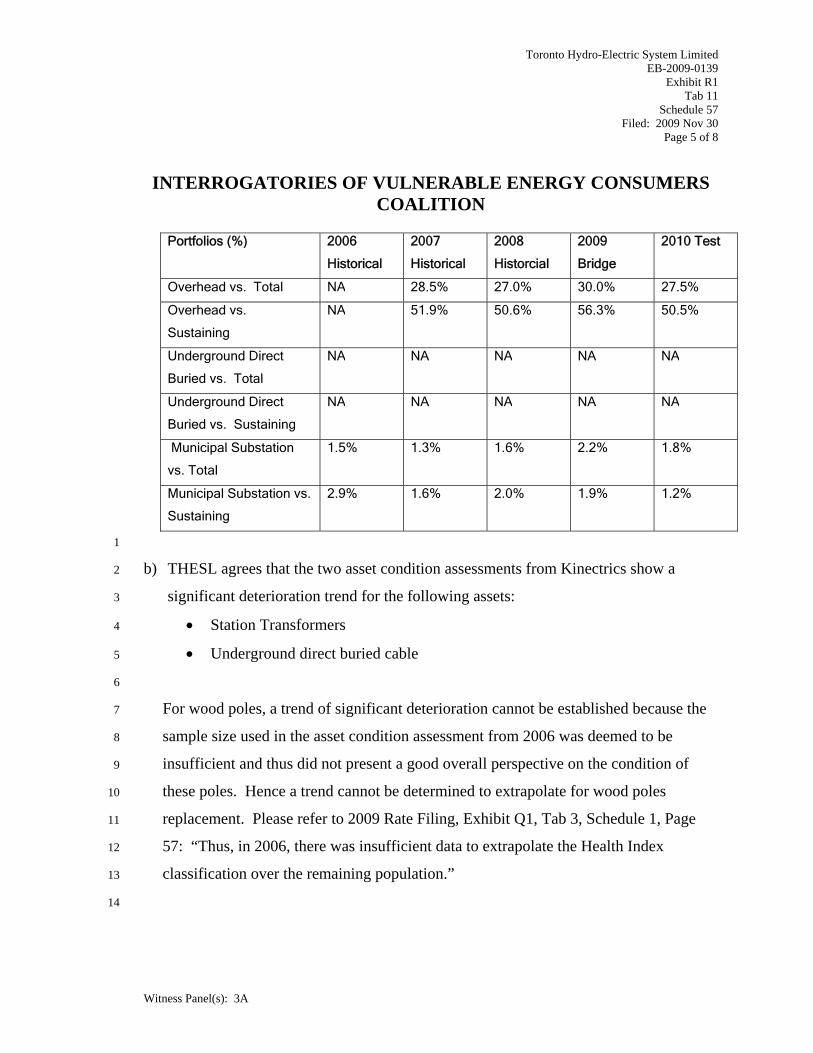
Toronto Hydro-Electric System Limited EB-2009-0139
Exhibit R1 Tab 11
Schedule 57 Filed: 2009 Nov 30
Page 5 of 8
INTERROGATORIES OF VULNERABLE ENERGY CONSUMERS COALITION
Witness Panel(s): 3A
Portfolios (%) 2006
Historical
2007
Historical
2008
Historcial
2009
Bridge
2010 Test
Overhead vs. Total NA 28.5% 27.0% 30.0% 27.5%
Overhead vs.
Sustaining
NA 51.9% 50.6% 56.3% 50.5%
Underground Direct
Buried vs. Total
NA NA NA NA NA
Underground Direct
Buried vs. Sustaining
NA NA NA NA NA
Municipal Substation
vs. Total
1.5% 1.3% 1.6% 2.2% 1.8%
Municipal Substation vs.
Sustaining
2.9% 1.6% 2.0% 1.9% 1.2%
1
b) THESL agrees that the two asset condition assessments from Kinectrics show a 2
significant deterioration trend for the following assets: 3
• Station Transformers 4
• Underground direct buried cable 5
6
For wood poles, a trend of significant deterioration cannot be established because the 7
sample size used in the asset condition assessment from 2006 was deemed to be 8
insufficient and thus did not present a good overall perspective on the condition of 9
these poles. Hence a trend cannot be determined to extrapolate for wood poles 10
replacement. Please refer to 2009 Rate Filing, Exhibit Q1, Tab 3, Schedule 1, Page 11
57: “Thus, in 2006, there was insufficient data to extrapolate the Health Index 12
classification over the remaining population.” 13
14
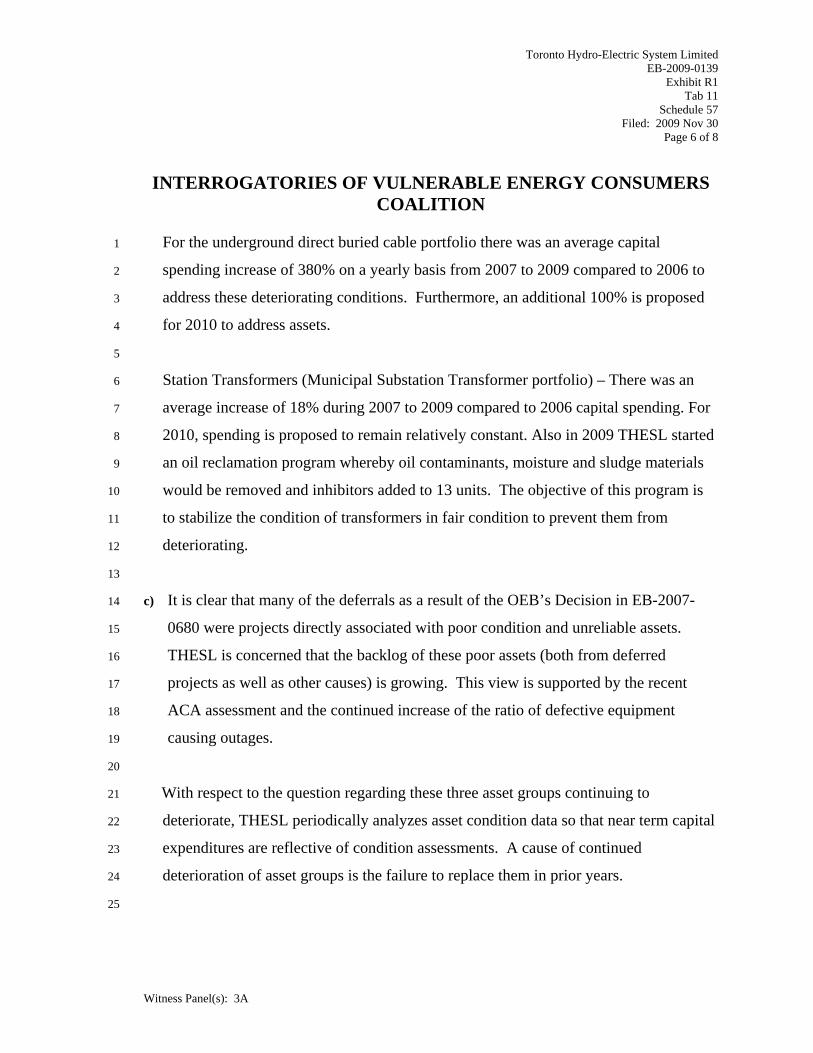
Toronto Hydro-Electric System Limited EB-2009-0139
Exhibit R1 Tab 11
Schedule 57 Filed: 2009 Nov 30
Page 6 of 8
INTERROGATORIES OF VULNERABLE ENERGY CONSUMERS COALITION
Witness Panel(s): 3A
For the underground direct buried cable portfolio there was an average capital 1
spending increase of 380% on a yearly basis from 2007 to 2009 compared to 2006 to 2
address these deteriorating conditions. Furthermore, an additional 100% is proposed 3
for 2010 to address assets. 4
5
Station Transformers (Municipal Substation Transformer portfolio) – There was an 6
average increase of 18% during 2007 to 2009 compared to 2006 capital spending. For 7
2010, spending is proposed to remain relatively constant. Also in 2009 THESL started 8
an oil reclamation program whereby oil contaminants, moisture and sludge materials 9
would be removed and inhibitors added to 13 units. The objective of this program is 10
to stabilize the condition of transformers in fair condition to prevent them from 11
deteriorating. 12
13
c) It is clear that many of the deferrals as a result of the OEB’s Decision in EB-2007-14
0680 were projects directly associated with poor condition and unreliable assets. 15
THESL is concerned that the backlog of these poor assets (both from deferred 16
projects as well as other causes) is growing. This view is supported by the recent 17
ACA assessment and the continued increase of the ratio of defective equipment 18
causing outages. 19
20
With respect to the question regarding these three asset groups continuing to 21
deteriorate, THESL periodically analyzes asset condition data so that near term capital 22
expenditures are reflective of condition assessments. A cause of continued 23
deterioration of asset groups is the failure to replace them in prior years. 24
25
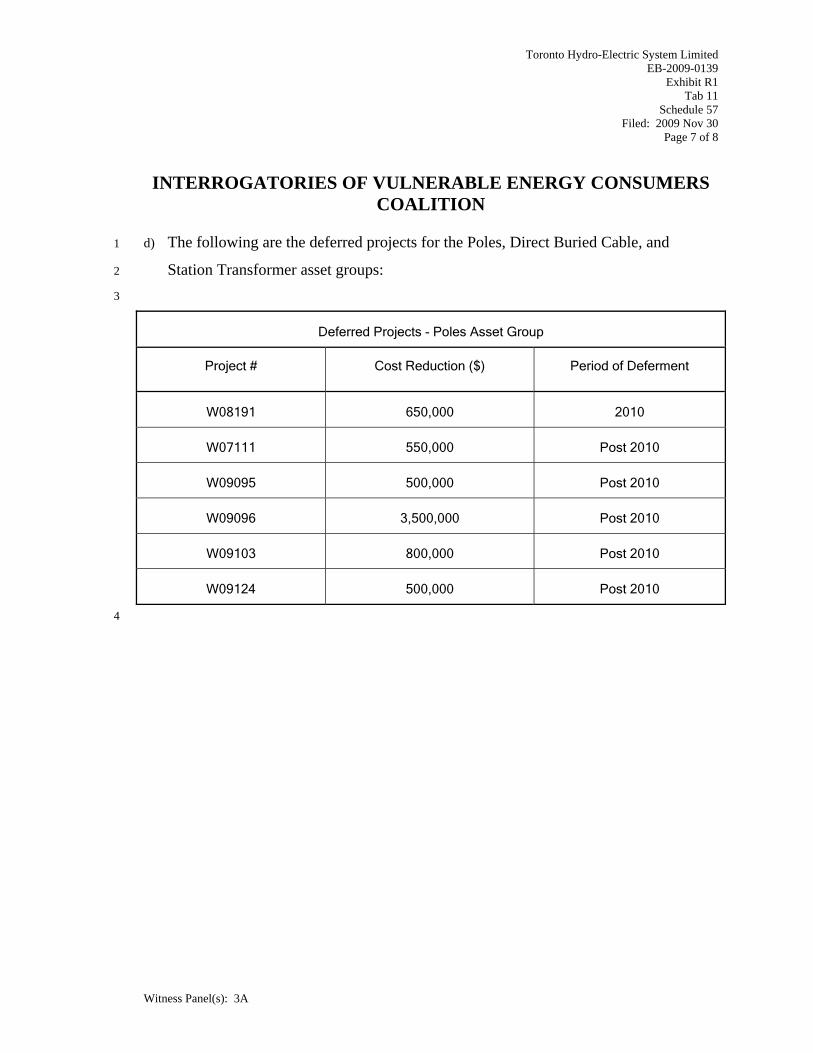
Toronto Hydro-Electric System Limited EB-2009-0139
Exhibit R1 Tab 11
Schedule 57 Filed: 2009 Nov 30
Page 7 of 8
INTERROGATORIES OF VULNERABLE ENERGY CONSUMERS COALITION
Witness Panel(s): 3A
d) The following are the deferred projects for the Poles, Direct Buried Cable, and 1
Station Transformer asset groups: 2
3
Deferred Projects - Poles Asset Group
Project # Cost Reduction ($) Period of Deferment
W08191 650,000 2010
W07111 550,000 Post 2010
W09095 500,000 Post 2010
W09096 3,500,000 Post 2010
W09103 800,000 Post 2010
W09124 500,000 Post 2010
4
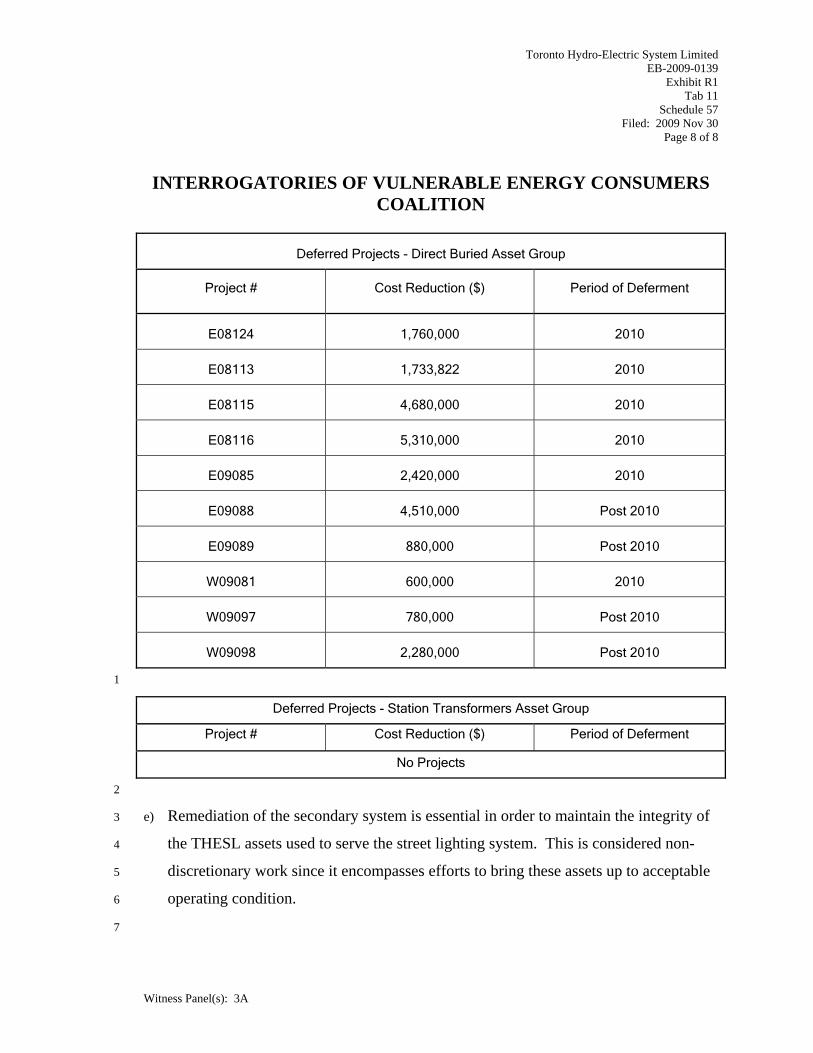
Toronto Hydro-Electric System Limited EB-2009-0139
Exhibit R1 Tab 11
Schedule 57 Filed: 2009 Nov 30
Page 8 of 8
INTERROGATORIES OF VULNERABLE ENERGY CONSUMERS COALITION
Witness Panel(s): 3A
Deferred Projects - Direct Buried Asset Group
Project # Cost Reduction ($) Period of Deferment
E08124 1,760,000 2010
E08113 1,733,822 2010
E08115 4,680,000 2010
E08116 5,310,000 2010
E09085 2,420,000 2010
E09088 4,510,000 Post 2010
E09089 880,000 Post 2010
W09081 600,000 2010
W09097 780,000 Post 2010
W09098 2,280,000 Post 2010
1
Deferred Projects - Station Transformers Asset Group
Project # Cost Reduction ($) Period of Deferment
No Projects
2
e) Remediation of the secondary system is essential in order to maintain the integrity of 3
the THESL assets used to serve the street lighting system. This is considered non-4
discretionary work since it encompasses efforts to bring these assets up to acceptable 5
operating condition. 6
7

Toronto Hydro-Electric System Limited EB-2009-0139
Exhibit R1 Tab 11
Schedule 58 Filed: 2009 Nov 30
Page 1 of 1
INTERROGATORIES OF VULNERABLE ENERGY CONSUMERS COALITION
Witness Panel(s): 2
INTERROGATORY 58: 1
Reference(s): Exhibit Q1 Tab 5 Schedule 1 2
3
a) Provide a version of Table 1 that matches THESL regulatory filings (Board approves 4
where available for CAPEX and FTEs. Then make the following additions 5
b) Insert a line that shows external contractor costs related to capital projects 6
c) Insert a line that shows controllable OM&A costs (excluding Amortization) 7
d) Insert a line that shows # customers 8
e) Insert a line that shows kWh distributed 9
f) Provide the following ratios 10
i. Capex/FTE (including external contractors) 11
ii. O&M/ FTE 12
iii. Customers per FTE 13
iv. Kwh/distributed per FTE 14
g) Graph these ratios in the same format as the chart on page 5 15
h) Discuss the trends in capital and labour productivity based on the above 4 ratios. 16
17
RESPONSE: 18
Please see attached Appendix A for parts a) to g). 19
For part h), the effects of rising costs associated with infrastructure renewal and 20
workforce renewal are clear as are the effects of declining load. 21
22
Assumptions used in Appendix A include: 23
1) 50% of contractor costs are labour. 24
2) Average contractor cost per FTE is $80,000. 25
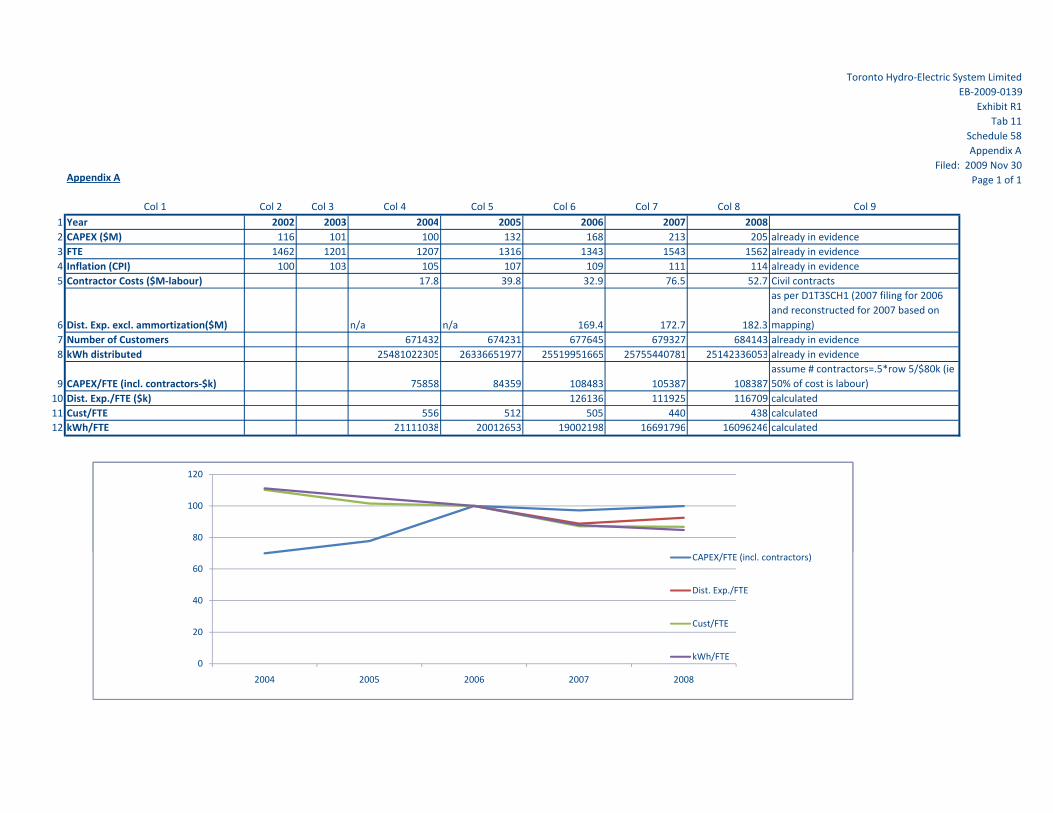
Toronto Hydro‐Electric System LimitedEB‐2009‐0139
Exhibit R1Tab 11
Schedule 58Appendix A
Filed: 2009 Nov 30Page 1 of 1Appendix A
Col 1 Col 2 Col 3 Col 4 Col 5 Col 6 Col 7 Col 8 Col 91 Year 2002 2003 2004 2005 2006 2007 20082 CAPEX ($M) 116 101 100 132 168 213 205 already in evidence3 FTE 1462 1201 1207 1316 1343 1543 1562 already in evidence4 Inflation (CPI) 100 103 105 107 109 111 114 already in evidence5 Contractor Costs ($M‐labour) 17.8 39.8 32.9 76.5 52.7 Civil contracts
6 Dist. Exp. excl. ammortization($M) n/a n/a 169.4 172.7 182.3
as per D1T3SCH1 (2007 filing for 2006 and reconstructed for 2007 based on mapping)
7 Number of Customers 671432 674231 677645 679327 684143 already in evidence8 kWh distributed 25481022305 26336651977 25519951665 25755440781 25142336053 already in evidence
9 CAPEX/FTE (incl. contractors‐$k) 75858 84359 108483 105387 108387assume # contractors=.5*row 5/$80k (ie 50% of cost is labour)
10 Dist. Exp./FTE ($k) 126136 111925 116709 calculated11 Cust/FTE 556 512 505 440 438 calculated12 kWh/FTE 21111038 20012653 19002198 16691796 16096246 calculated
80
100
120
0
20
40
60
80
100
120
2004 2005 2006 2007 2008
CAPEX/FTE (incl. contractors)
Dist. Exp./FTE
Cust/FTE
kWh/FTE
Toronto Hydro-Electric System Limited EB-2009-0139
Exhibit R1 Tab 11
Schedule 59 Filed: 2009 Nov 30
Page 1 of 4
INTERROGATORIES OF VULNERABLE ENERGY CONSUMERS COALITION
Witness Panel(s): 2
INTERROGATORY 59: 1
Reference(s): Exhibit Q1 Tab 5 Schedule 1 Page 8 2
3
a) Provide a list of all scorecards and their KPIs employed by THESL. 4
b) Other than Supply Chain Management, which Scorecards/KPIs were examined in 5
depth by Key Willow Consulting. 6
c) Provide copies of any other assessments analyses similar to that on page 5 for Supply 7
Chain Management. 8
d) Does THESL agree that the Key Willow Study falls short of meeting the Board’s 9
direction. 10
“The Board expects that the Company will develop the ability to 11
track productivity gains throughout its operations in a 12
programmatic manner that will appropriately inform its next 13
rebasing application.” 14
If THESL disagrees explain why not. 15
e) Explain why THESL did not undertake a standard productivity study. For example a 16
capital and labour productivity study similar to that that the Pacific Economics Group 17
(PEG) undertook for the Board to assess productivity factor differentials for 3GIRM. 18
f) What was the cost of the Key Willow study? 19
20
RESPONSE: 21
a) THESL’s 2010 KPIs and scorecard is expected to be approved by the Board of 22
Directors by the end of December 2009. As soon as the KPIs and scorecard are 23
approved, THESL will submit this to the Board and intervenors. 24
25

Toronto Hydro-Electric System Limited EB-2009-0139
Exhibit R1 Tab 11
Schedule 59 Filed: 2009 Nov 30
Page 2 of 4
INTERROGATORIES OF VULNERABLE ENERGY CONSUMERS COALITION
Witness Panel(s): 2
b) KeyWillow did not examine any scorecards “in depth.” Their mandate was to 1
prepare a document which would allow readers to understand how THESL was 2
achieving productivity improvements. The analysis focused on describing the use of 3
tools, processes and leadership which created a culture of improvement, that together, 4
guarantee systematic improvements will continue. In addition to review of Supply 5
Chain Management, other documents reviewed included; Safety KPI Gap, 6
Attendance Summary Statistics, LDC Operations Report, 2010 Plan, and an MCRS 7
Overview. 8
9
c) THESL has adopted a number of initiatives in the area of health and safety, with the 10
intention of ensuring a higher quality of life for, and greater productivity from its 11
employees. To ensure the effectiveness of these initiatives, THESL has established 12
health and safety KPIs that are monitored via the MCRS process. This has resulted in 13
significant improvements in health and safety performance: 14
• Lost Time Injury Frequency (a measure of lost time injuries) has dropped 15
from 2.4 in 2001 to 0.7 in 2008, and 0.15 YTD October 2009 16
• Accident Severity (a measure of time lost due to injuries) has dropped 17
from 34.9 in 2001 to 11.0 in 2008, and 0.83 YTD October 2009 18
• All Injury Frequency (a measure of Workplace Safety & Insurance Board 19
[WSIB] claims) has dropped from 7.18 in 2001 to 5.28 in 2008, and 4.08 20
YTD October 2009 21
22
THESL has also instituted within its MCRS process a KPI around crew safety 23
inspections. In 2001, Supervisors were expected to conduct three crew inspections 24
per month. By 2008, the expected level had increased to 20 per month. These 25
inspections serve to reinforce good safety practices and the need for personal 26
Toronto Hydro-Electric System Limited EB-2009-0139
Exhibit R1 Tab 11
Schedule 59 Filed: 2009 Nov 30
Page 3 of 4
INTERROGATORIES OF VULNERABLE ENERGY CONSUMERS COALITION
Witness Panel(s): 2
responsibility for safety from each crew member. They also provide an extra 1
opportunity to coach staff and execute short interval control on projects, which 2
enhances productivity. 3
4
d) THESL does not agree with the general thrust of the question. The environment that 5
THESL is operating in is changing rapidly. In addition, there are variable conditions 6
within the work program. Consequently, traditional quantitative metrics for 7
measuring productivity prove to be misleading when comparing year-over-year 8
changes to assess trends. It is for this reason that THESL has not produced these 9
types of analyses. 10
11
Rather, THESL’s programmatic approach is to incorporate strong business discipline 12
into its operation to achieve continuous improvement. This discipline is applied 13
through the Management Control and Reporting System (MCRS), which establishes 14
scorecards involving Key Performance Indicators (KPIs), sets targets and stretch 15
goals for each, manages the program through regular KPI reviews to achieve short 16
interval control, and rewards staff for performance against the targets/stretch goals. 17
Through these techniques, THESL is able to improve its operations in all areas of the 18
business over time. 19
20
e) A standard productivity study approach using outputs divided by inputs is considered 21
by THESL to be useful only in an environment where incremental output can be 22
effectively associated with incremental inputs. In THESL’s case, load is declining 23
due to economic and conservation effects while costs are growing at an 24
unprecedented rate to deal with aging infrastructure, workforce renewal and other 25
emerging capital requirements. THESL considers its approach using a corporate-26

Toronto Hydro-Electric System Limited EB-2009-0139
Exhibit R1 Tab 11
Schedule 59 Filed: 2009 Nov 30
Page 4 of 4
INTERROGATORIES OF VULNERABLE ENERGY CONSUMERS COALITION
Witness Panel(s): 2
wide MCRS system to be more effective in optimizing its operations, while 1
minimizing cost increases in a sustainable way. 2
3
f) The cost of the KeyWillow study was $39,240 plus GST. 4


![[88713] PLAINTIFF'S DISCOVERY - viethmms.comataa/docs/Interrogatories-1st-to... · provided the information to answer these interrogatories and requests for production. 2. Identify](https://static.fdocuments.net/doc/165x107/5afe72447f8b9a864d8ef440/88713-plaintiffs-discovery-ataadocsinterrogatories-1st-toprovided-the.jpg)


![[85865] DISCOVERY - PLAINTIFF - viethmms.comataa/docs/Interrogatories-1st-to_truck...PLAINTIFF ANNIE LAURA OLIVER GRAY'S FIRST INTERROGATORIES TO ... of the Subject Incident (e.g.,](https://static.fdocuments.net/doc/165x107/5b3955c67f8b9a5a518e6054/85865-discovery-plaintiff-ataadocsinterrogatories-1st-totruckplaintiff.jpg)

![Plaintiff's [Swanenburg] Answers to Defendants First Set Interrogatories](https://static.fdocuments.net/doc/165x107/53f95e338d7f7253318b4d05/plaintiffs-swanenburg-answers-to-defendants-first-set-interrogatories.jpg)


