
Interregional Performance of the Public Health System of a ... · Maria Cristina N. Gramani...
18
Interregional Performance of the Public Health System of a High-Inequality Country Insper Working Paper WPE: 310/2013 Maria Cristina N. Gramani Inspirar para Transformar
-
Upload
vuongthuan -
Category
Documents
-
view
216 -
download
0
Transcript of Interregional Performance of the Public Health System of a ... · Maria Cristina N. Gramani...

Interregional Performance of the Public Health System of a High-Inequality Country
Insper Working PaperWPE: 310/2013
Maria Cristina N. Gramani
Inspirar para Transformar

Interregional Performance of the Public Health System of a High-Inequality Country
Maria Cristina N. Gramani
Insper - Institute of Education and Research
Rua Quatá, 300 - Vila Olímpia 04546-042 São Paulo - SP - Brazil Phone/Fax: 55-11-4504-2436 / 55-11-4504-2350 [email protected] Introduction
Brazil has the sixth-highest gross domestic product (GDP) in the world but is
ranked 85th according to the Human Development Index (HDI). Although Brazil trailed
Norway (the most developed country according to the HDI) by 13.5% in 2007, in 2011
this difference decreased by only 1%, indicating that there remains room for improvement
in this area.
Brazil, which is a country of continental dimensions, has a current population of
approximately 194 million, but this population is not uniformly distributed throughout the
geographical regions of the country; for example, “the southeast region covers only 11%
of Brazil´s territory but accounts for 43% of the population and 56% of the gross domestic
product.” [1]. Because socioeconomic inequalities exist in developing countries, quality
control in areas such as health and education is a complicated matter. Mackenbach et al.
[2] showed that the inequalities in European health are associated with socioeconomic
status and made the following conclusion: “These inequalities might be reduced by
improving educational opportunities, income distribution, health-related behavior, or
access to health care.”
Therefore, the consideration of aggregate figures for Brazil in a cross-country
analysis would obfuscate the reality of each individual region. The Brazilian health system
has three subsectors: 1) the public subsector; 2) the private (for-profit and non-profit)
subsector, in which services are financed in various manners with public and private
funds; and 3) the private health insurance subsector. Citizens can use services in all three
subsectors [1]. In the Brazilian public health system, each of the 27 federal units (FUs) is
responsible for its own health care through the Unified Health System (Sistema Único de

Saúde; SUS). According to the Brazilian government (http://portaldasaude.saude.gov.br),
SUS “covers procedures from simple health procedures to outpatient organ transplants,
ensuring full access and universal and free coverage for the entire population.” However,
this decentralization of the health system may lead to performance variance among the
FUs.
The performance of a public health system can be viewed from many perspectives.
Raphael [3] considered 12 social health factors for Canadians, such as employment,
individual income, income distribution, etc.. Cavelaars et al. [4] and Gupta et al. [5]
argued that the level of education is a determinant of health in the country. Cavelaars et al.
[4] analyzed the variation in educational levels between 11 western European countries,
and Gupta et al. [5] used cross-sectional data on 50 developing and transitional countries
to show that “increased public expenditure on education and health care is associated
with improvements in both access to and attainment in schools, and reduces mortality
rates for infants and children.”
Sundmacher et al. [6] examined an annual panel of approximately 20,000 16-year-
olds from over 11,000 households throughout Germany and suggested that three factors
contribute to variance in health: “the capability score, cultural-behavioural variables and
a lower extent, the materialist approach.”
Few studies have performed a comparison of the health performance of FUs in a
high-inequality country under different perspectives. Such comparisons reveal which FUs
are efficient for each health perspective and describe the performance differences between
the perspectives.
This study serves three primary purposes: (1) to examine the efficiency of the
individual FUs and explore the perspectives that affect the overall performance of the
public health system in a high-inequality country; (2) to explore the determinants of
performance for each perspective in each geographical region of the country; and (3) to
determine which elements cause some regions to be inefficient (the inefficient
determinants).
The rest of the paper is organized as follows. The next section presents the two
methodologies used, the balanced scorecard (BSC) to determine the health perspectives,
and the data envelopment analysis technique (DEA) to evaluate the performance of each
perspective, followed by the proposed integrated BSC-DEA approach. We then present the
data and show the empirical results and discussions. Finally, we offer some concluding
remarks.
Methods Balanced Scorecard (BSC)
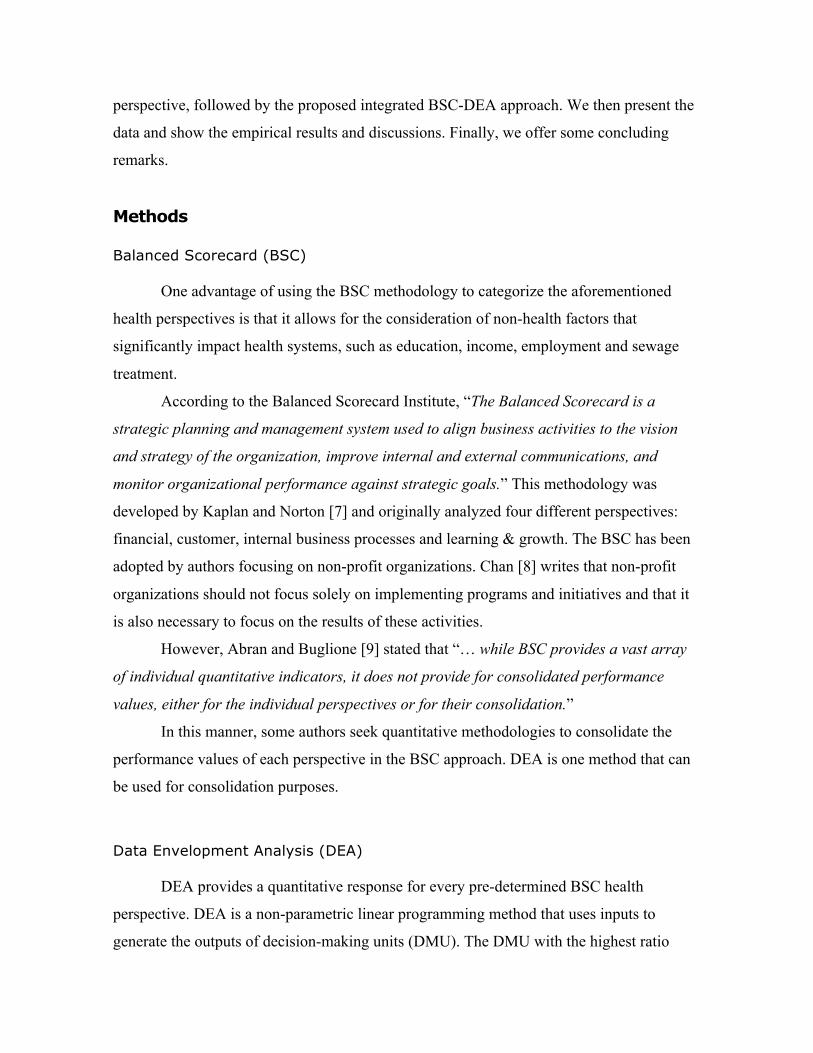
One advantage of using the BSC methodology to categorize the aforementioned
health perspectives is that it allows for the consideration of non-health factors that
significantly impact health systems, such as education, income, employment and sewage
treatment.
According to the Balanced Scorecard Institute, “The Balanced Scorecard is a
strategic planning and management system used to align business activities to the vision
and strategy of the organization, improve internal and external communications, and
monitor organizational performance against strategic goals.” This methodology was
developed by Kaplan and Norton [7] and originally analyzed four different perspectives:
financial, customer, internal business processes and learning & growth. The BSC has been
adopted by authors focusing on non-profit organizations. Chan [8] writes that non-profit
organizations should not focus solely on implementing programs and initiatives and that it
is also necessary to focus on the results of these activities.
However, Abran and Buglione [9] stated that “… while BSC provides a vast array
of individual quantitative indicators, it does not provide for consolidated performance
values, either for the individual perspectives or for their consolidation.”
In this manner, some authors seek quantitative methodologies to consolidate the
performance values of each perspective in the BSC approach. DEA is one method that can
be used for consolidation purposes.
Data Envelopment Analysis (DEA)
DEA provides a quantitative response for every pre-determined BSC health
perspective. DEA is a non-parametric linear programming method that uses inputs to
generate the outputs of decision-making units (DMU). The DMU with the highest ratio

between the outputs and the inputs is deemed the top performer. Although this
construction does not constrain the efficiency of the best possible DMU, it does mean that,
among the DMUs considered, it is the best one. Moreover, this methodology identifies
how inefficient DMUs might reach maximum efficiency.
According to the World Health Organization [10], “One health system differs from
the other in structure, quantity and kinds of resources utilized and the outcomes attained.
Nevertheless, health authorities yearn for the same objective, which are based on values like:
good health for the entire population, responsiveness and fairness in financing.” In this paper,
we use the federal units as the DMUs, which differ depending on the quantity of resources
(inputs) used and the products (outputs) produced (Figure 1).
FIGURE 1
Two main characteristics differentiate the DEA models.
1) Orientation: The input-orientation model aims to minimize the inputs while maintaining
the outputs at a constant level. The output-orientation model aims to maximize the outputs
given constant inputs.
2) Returns to scale: The model considers either constant returns to scale (CRS) or variable
returns to scale (VRS). With CRS, an increase in inputs generates the same increase in
outputs, whereas VRS do not require this proportionality.
Some vulnerabilities must be prevented to implement the DEA [11].
1) Minimizing input variables and maximizing output variables is preferable. For example, if
the variable “number of children treated” must be considered as an input, and this variable
should be maximized, we can use “1/ number of children treated” as the input.
2) The number of DMUs must be at least twice the product of the number of inputs and
outputs. Because we use more than one perspective in this paper, one advantage of using
the DEA technique for each perspective of the BSC methodology is the possibility of
increasing the number of variables that are used [12].

Generally, the efficiency of a DMU k is measured by the rate between the outputs
(Yk) and the inputs (Xk), i.e., k
kvXuY
, where:
• the ratio must be less than 1, and
• the weight for each variable (u and v) is positive.
The objective in this case is to determine the best weights (u and v) that optimize
the ratio. If a variable weight is zero, either this input or output variable is not considered
in the best solution, or this variable has a high potential to be improved.
An Integrated BSC-DEA Approach
Ramanathan and Ramanathan [13] proposed the integration of the BSC with the
DEA, which can be applied to estimate the performance of health authorities (HA) in the
UK. The authors used six perspectives for the BSC and different sets of inputs and outputs
for the DEA model in each perspective. They found that no HA performed well in any of
the six perspectives.
Identifying the input/output variables of the model is one of the most important
stages of the DEA technique. In general, studies that evaluate the efficiency of health
systems use variables such as the number of health professionals, cost measurement, the
number of inpatients and patient life expectancy from birth [14-17]. One benefit of using
the BSC-DEA integrated model is that we can be more specific; i.e., we can use more
variables and directly relate them to each perspective.
Therefore, in this paper, we also propose an integration of BSC with DEA, but
here, we consider all 27 Brazilian federal units and assume a dependency between the
perspectives. We use the BSC-DEA approach with the four classical perspectives, which
we believe cover the entire range of public health systems. These perspectives can be
represented as follows:
1. Financial perspective: This perspective generally involves financial variables, such
as return on investment, return on assets and cash flows. However, because we
investigated the public health systems (i.e., non-profit organizations), other
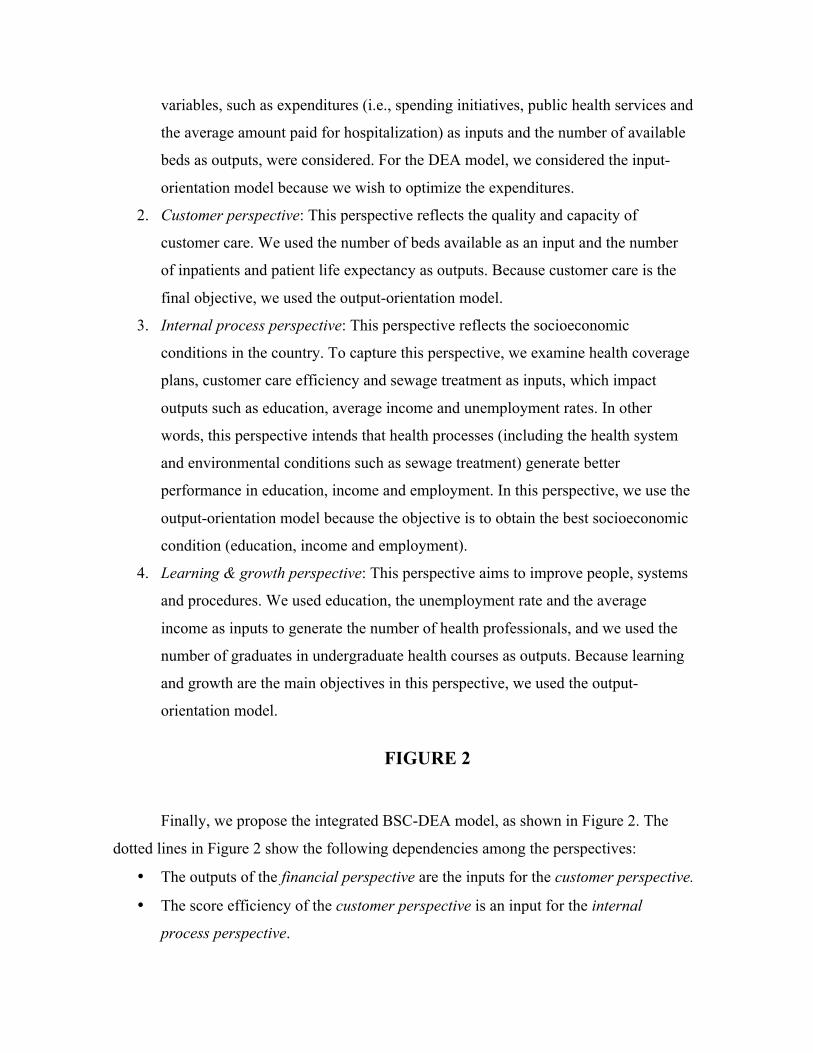
variables, such as expenditures (i.e., spending initiatives, public health services and
the average amount paid for hospitalization) as inputs and the number of available
beds as outputs, were considered. For the DEA model, we considered the input-
orientation model because we wish to optimize the expenditures.
2. Customer perspective: This perspective reflects the quality and capacity of
customer care. We used the number of beds available as an input and the number
of inpatients and patient life expectancy as outputs. Because customer care is the
final objective, we used the output-orientation model.
3. Internal process perspective: This perspective reflects the socioeconomic
conditions in the country. To capture this perspective, we examine health coverage
plans, customer care efficiency and sewage treatment as inputs, which impact
outputs such as education, average income and unemployment rates. In other
words, this perspective intends that health processes (including the health system
and environmental conditions such as sewage treatment) generate better
performance in education, income and employment. In this perspective, we use the
output-orientation model because the objective is to obtain the best socioeconomic
condition (education, income and employment).
4. Learning & growth perspective: This perspective aims to improve people, systems
and procedures. We used education, the unemployment rate and the average
income as inputs to generate the number of health professionals, and we used the
number of graduates in undergraduate health courses as outputs. Because learning
and growth are the main objectives in this perspective, we used the output-
orientation model.
FIGURE 2
Finally, we propose the integrated BSC-DEA model, as shown in Figure 2. The
dotted lines in Figure 2 show the following dependencies among the perspectives:
• The outputs of the financial perspective are the inputs for the customer perspective.
• The score efficiency of the customer perspective is an input for the internal
process perspective.

• The outputs of the internal process perspective are the inputs for the learning &
growth perspective.
We used the VRS model for all of the perspectives because we determined that
there is no proportionality between increases in inputs and increases in outputs.
Data
The data were collected from the SUS database and were publicly available for all
27 Brazilian federal units (http://tabnet.datasus.gov.br). All of the variables mentioned in
the previous section were collected for all of the Brazilian federal units for 2008, and the
descriptive statistics are shown in Table 1.
TABLE 1
Empirical Results and Discussion Health Performance Comparison between the FUs
Figure 3 presents the public health performance of all 27 federal units in each BSC
perspective. The FUs N1 to N7 belong to the northern region of the country, NE1 to NE9
belong to the northeastern region, CW1 to CW4 belong to the central-west region, SE1 to
SE4 belong to the southeastern region and S1 to S3 belong to the southern region.
FIGURE 3
Figure 3 clearly shows the inequality in performance between the FUs and between
the perspectives. The results show that one FU (CW1) excels in all of the perspectives,
and the S and SE regions show clear superiority over the N and NE regions.
TABLE 2

Table 2 shows a moderate correlation between the efficiency of the perspectives
and the GDP and PISA data for the FUs; that is, these results show that the FUs that
perform better in terms of education and the economy are also superior in terms of health
care.
The difference between the performances in each perspective is clear. The
customer perspective shows the best performance overall, and the learning & growth and
financial perspectives display the worst.
Figure 3 also shows that all of the federal units from the South region are 100%
efficient in the customer perspective; i.e., this region can be considered as a benchmark for
this perspective.
Efficiency Determinants
To simplify the next set of results without losing any information, the FUs were
aggregated into five geographical regions: 1) North, which includes the 7 federal units in
the north of the country; 2) Northeast, which includes the 9 federal units from the
northeast of the country; 3) Central West, which includes the 4 federal units from the
central west of the country; 4) Southeast, which includes the 4 federal units from the
southeast of the country; and 5) South, which includes the 3 federal units from the south of
the country.
The integrated model establishes the best contributions (or weights) for each input
and output variable in every perspective; i.e., the input or output that most improves the
performance of a given perspective will receive the greatest contribution (or the highest
weight). The variable (input or output) with the highest contribution to a perspective can
be considered the determinant of efficiency.
FIGURE 4
Figure 4 shows the contributions of each variable in each region for all four
perspectives. This figure shows that the efficiency determinants are well defined in all of
the perspectives, as follows:

• Financial perspective: the number of beds, which is defined by the variable number of
beds available per 1,000 inhabitants (O1) for all regions.
• Customer perspective: again, the number of beds, which is defined by the variable
1/number of beds available per 1,000 inhabitants (I3) for all regions.
• Internal process perspective: Average income per capita/unemployment rate (O5) for
the South region and population with more than 8 years of education/total population
(O4) for all other regions [4, 5].
• Learning & growth perspective: Number of graduates with a health-related
undergraduate degree/Total population (O7) for the Southeast and Central West
regions, Total population/population with more than 8 years of education (I7) for the
North and Northeast regions and Unemployment rate/Average income per capita (I8)
for the South region.
Inefficiency Determinants – Potential Improvements This section describes the reasons for inefficiencies in each region from every
perspective and discusses how an inefficient region can improve.
FIGURE 5
Figure 5 shows the potential improvements for the entire region to do as well as the
top performers. This figure indicates how much each variable in each region must improve
for all four perspectives; the vertical axes represent the percentage that the input must
decrease to become the region top efficient and the percentage that the output must
increase for the same purpose. For example, in the financial perspective, the North region
must decrease 74% in I1, decrease 60% in I2 and increase 11% in O1, to make this region
100% efficient. Note that for all perspectives, the “strong” reasons for inefficiency can
differ between regions. It is also noteworthy that the N and NE regions have the highest
percentages of potential improvements when compared with the other three regions, which
is compatible with the efficiency results that show the inferiority of the N and NE regions.
The inefficiency determinants are defined as follows.

• Financial perspective: Spending initiatives and public health services per capita (I1)
displays the highest potential for improvement for the N and CW regions, but for the
NE, S and SE regions, the variable Average amount paid for hospitalization (I2) merits
more attention.
• Customer perspective: 1/number of beds available (I3) is the variable with the highest
potential for improvement for the N, NE and CW regions; however, for the SE region,
the variable that merits more attention is the number of inpatients per 100 inhabitants
(O2). Region S is 100% efficient in this perspective; therefore, there is no possible
improvement relative to the other regions.
• Internal process perspective: The variable with the highest (absolute) potential
improvement for the N and NE regions is income average/unemployment rate (O5). For
the CW region, the variable with the most potential for improvement is Total
population/population served by the sewage treatment (I6), and for the S and SE
regions, it is 1/Health plan coverage (I4).
• Learning & growth perspective: The variable Number of graduates with a health-
related undergraduate degree/Total population (O7) shows the highest potential
improvement for the N and S regions, and the Number of health professionals per 1,000
inhabitants (O6) shows the highest potential improvement for the other regions.
Finally, it is clear that the financial and learning & growth perspectives (the lowest
performing perspectives) have the greatest potential for improvement.
Conclusions
The main advantage of separating the public health system performance evaluation
into four perspectives is that the information that is obtained can inform the government
decision-makers about which resources will truly affect the performance of each federal
unit.
The relative health efficiency of all 27 Brazilian federal units was measured for
each of the four BSC perspectives. The results showed significant performance differences
between the federal units; 37% of the federal units were 100% efficient in at least one
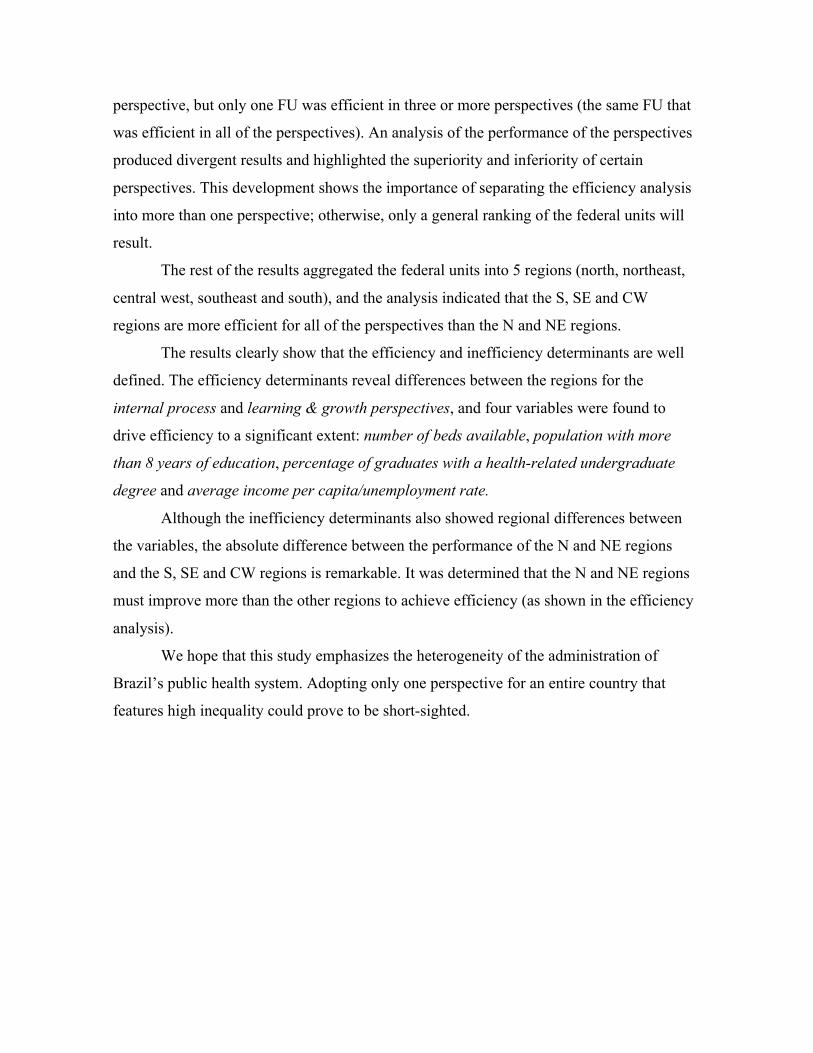
perspective, but only one FU was efficient in three or more perspectives (the same FU that
was efficient in all of the perspectives). An analysis of the performance of the perspectives
produced divergent results and highlighted the superiority and inferiority of certain
perspectives. This development shows the importance of separating the efficiency analysis
into more than one perspective; otherwise, only a general ranking of the federal units will
result.
The rest of the results aggregated the federal units into 5 regions (north, northeast,
central west, southeast and south), and the analysis indicated that the S, SE and CW
regions are more efficient for all of the perspectives than the N and NE regions.
The results clearly show that the efficiency and inefficiency determinants are well
defined. The efficiency determinants reveal differences between the regions for the
internal process and learning & growth perspectives, and four variables were found to
drive efficiency to a significant extent: number of beds available, population with more
than 8 years of education, percentage of graduates with a health-related undergraduate
degree and average income per capita/unemployment rate.
Although the inefficiency determinants also showed regional differences between
the variables, the absolute difference between the performance of the N and NE regions
and the S, SE and CW regions is remarkable. It was determined that the N and NE regions
must improve more than the other regions to achieve efficiency (as shown in the efficiency
analysis).
We hope that this study emphasizes the heterogeneity of the administration of
Brazil’s public health system. Adopting only one perspective for an entire country that
features high inequality could prove to be short-sighted.

References 1. Paim J, Travassos C, Almeida C, Bahia L, Macinko J (2011) The Brazilian health
system: history, advances and challenges. Lancet 377: 1778-1797.
2. Mackenbach JP, Stirbu I, Roskam AR, Schaap MM, Menvielle G, et al. (2008)
Socioeconomic inequalities in health in 22 European countries. N Engl J Med 358: 2468-
2481.
3. Raphael D (2009) Social determinants of health: an overview of key issues and themes.
In: Raphael D, editor. Social determinants of health (2nd ed.). Toronto: Canadian
Scholars’ Press Inc. pp. 2-19.
4. Cavelaars AEJM, Kunst AE, Geurts JJM, Crialesi R, Grötvedt L, et al. (1998)
Differences in self reported morbidity by educational level: a comparison of 11 western
European countries. J Epidemiol Community Health 52: 219-227.
5. Gupta S, Verhoeven M, Tiongson ER (2002) The effectiveness of government spending
on education and health care in developing and transition economies. Eur J Polit Econ 18:
717–737.
6. Sundmacher L, Scheller-Kreinsen D, Busse R (2011) The wider determinants of
inequalities in health: a decomposition analysis. Int J Equity Health 10: 30.
7. Kaplan RS, Norton DP (1992) The balanced scorecard: measures that drive
performance. Harv Bus Rev 70: 71-79.
8. Chan YCL (2006) An analytic hierarchy framework for evaluating balanced scorecards
of healthcare organizations. Can J Admin Sci 23: 85-104.
9. Abran A, Buglione L (2003) A multidimensional performance model for consolidating
Balanced Scorecards. Adv Eng Softw 34: 339–349.
10. World Health Organization (2000) World Health Report 2000 - health systems:
improving performance. Geneva: WHO Press.
11. Dyson RG, Allen R, Camanho AS, Podinovski VV, Sarrico CS, Shale EA (2001)
Pitfalls and protocols in DEA. European Journal of Operational Research 132 (2): 245-
259.
12. Chen T, Chen L (2007) DEA performance evaluation based on BSC indicators
incorporated: the case of semiconductor industry. Int J Prod Perform Manag 56: 335-357.

13. Ramanathan R, Ramanathan U (2011) A performance measurement framework
combining DEA and balanced scorecard for the UK health sector. Int J Oper Res 12: 257-
278.
14. Salinas-Jiménez J, Smith P (1996) Data envelopment analysis applied to quality in
primary health care. Annals of Operations Research 67: 141-161.
15. Palmer S, Torgerson D J (1999) Definitions of efficiency. BMJ 318: 1136.
16. Jacobs R, Smith PC, Street A (2006) Measuring efficiency in health care. Analytic
techniques and health policy. Cambridge: Cambridge University Press.
17. Liu C, Ferguson B, Laporte A (2006) Ranking the health system efficiency among
Canadian provinces and American states. Paper presented at the Annual Meeting of the
Economics of Population Health: Inaugural Conference of the American Society of Health
Economists, Madison, WI, USA.

Table 1. The descriptive statistics for the variables from all FUs.
Variables Mean Standard deviation
Median Min Max
The spending initiatives and public health services per capita (in Reals)
530.1 132.5 524.3 324.6 829.7
The average amount paid for hospitalization in the public health care system (in Reals)
792.5 179.7 789.9 453.4 1,119.5
GDP per capita (in Reals) 13,713.9 8,344.1 11,844.0 5,372.6 45,977.6
The number of beds available per 1,000 inhabitants
2.1 0.3 2.2 1.6 2.9
The number of inpatients per 100 inhabitants
6.1 0.9 6.0 4.0 7.7
The life expectancy at birth 72.4 2.3 72.1 67.7 76.1
Health plan coverage (percentage of the population)
19.4 9.1 15.1 6.0 40.1
The population served by sewage treatment
5,006,229.6 7,713,348.6 2,139,380.0 219,843.0 38,166,149.0
The population with more than 8 years of education
2,876,834.3 4,097,769.5 1,374,032.0 169,817.0 20,499,837.0
The total population 7,022,696.8 8,422,434.6 3,453,648.0 412,783.0 41,011,635.0
The average income per capita (in Reals, per month)
533.6 204.7 459.2 291.5 1.233.1
The unemployment rate 7.1 2.3 6.2 4.0 14.9
The number of health professionals per 1,000 inhabitants
1.5 0.7 1.3 0.6 3.6
The number of graduates with a health-related undergraduate degree
3,090.5 4,704.0 1,524.0 20.0 21,107.0
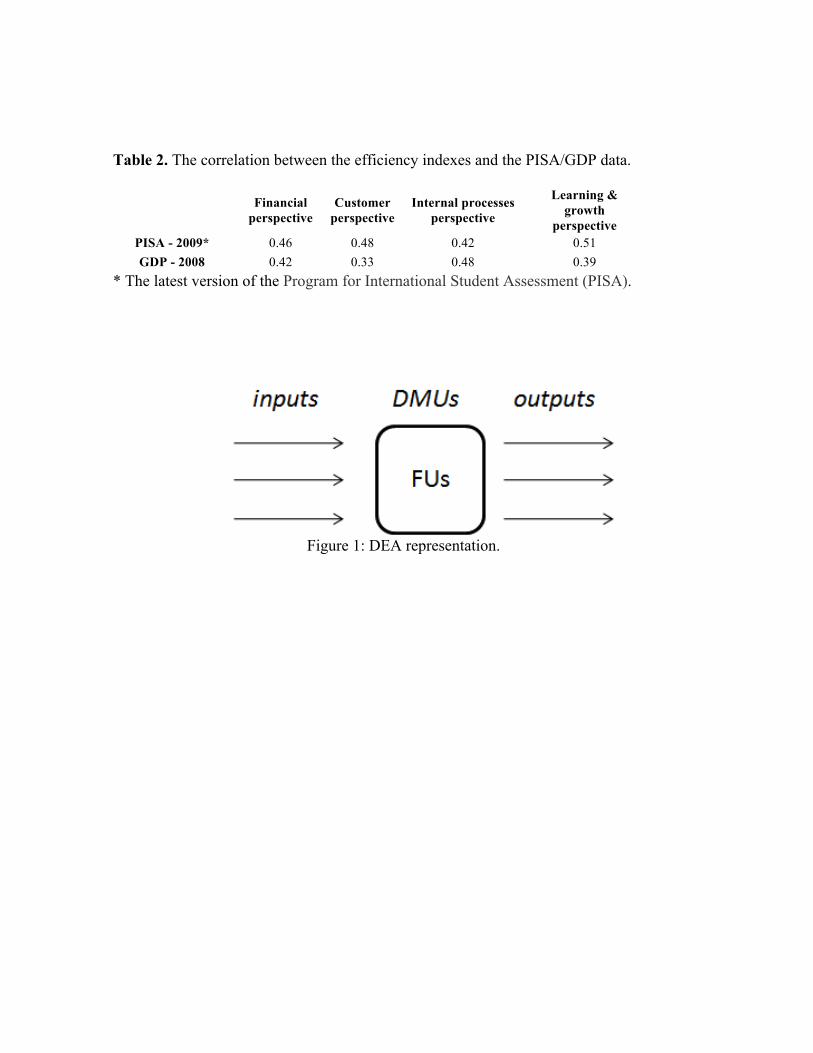
Table 2. The correlation between the efficiency indexes and the PISA/GDP data.
Financial
perspective Customer
perspective Internal processes
perspective
Learning & growth
perspective PISA - 2009* 0.46 0.48 0.42 0.51 GDP - 2008 0.42 0.33 0.48 0.39
* The latest version of the Program for International Student Assessment (PISA).
Figure 1: DEA representation.

Figure 2: Integrated BSC-DEA model for the SUS.
Figure 3: Public health system performance for each federal unit.

Figure 4: Input/output contributions by perspective.
Figure 5: Potential improvements by perspective.


